


-
Peripheral artery disease (PAD) is an atherosclerotic syndrome marked by stenosis or occlusion of the arteries in lower extremities in middle-aged and elderly individuals[1]. Several studies have shown that subclinical hypothyroidism and euthyroidism were associated with increased prevalence of dyslipidemia, atherosclerosis, and cardiovascular disease (CVD)[2-3]. The association between thyroid dysfunction and atherosclerosis might be because of multiple underlying mechanisms such as hypertension, glycometabolic disorders, dyslipidemia, inflammation, and autoimmunity[3]. PAD has been reported to be associated with an increased risk of the cardiovascular morbidity and mortality independent of presence of traditional cardiovascular risk factors[1]. However, study on the relationship between thyroid hormones and PAD is limited. In the present study, we examined the association of serum free triiodothyronine (FT3), free thyroxin (FT4), thyroid-stimulating hormone (TSH) levels, and the free-triiodothyronine-to-free-thyroxin (FT3/FT44) ratio with PAD in middle-aged and elderly euthyroid population.
During June-July 2008, 10, 185 participants from Songnan community, Baoshan district, Shanghai, China, were enrolled into the phase 1 survey. Participants were classified into one of the following three groups according to fasting plasma glucose (FPG) levels and medical history of diabetes: normal glucose regulation (NGR, FPG < 5.6 mmol/L, and no history of diabetes), impaired glucose regulation (IGR, FPG 5.6-7.0 mmol/L, and no history of diabetes), and diabetes (FPG≥7.0 mmol/L or history of diabetes). In phase 2, June-August 2009, 4, 012 participants were selected according to the classification in phase 1 survey with a ratio of 1.0: diabetes to 1.2: IGR to 1.44: NGR for the current study[4]. Participants who met the following criteria were excluded: (1) with a history of overt hyperthyroidism, hypothyroidism, or thyroiditis or use of antithyroid drugs (n=12); (2) taking medications affecting thyroid function (including amiodarone, lithium, antipsychotic drugs such as chlorpromazine and risperidone, and antiepileptic drugs such as phenytoin sodium and carbamazepine) (n=5); (3) with a history of thyroidectomy (n=2); (4) missing thyroid measurements (n=42); (5) missing ankle-brachial index (ABI) data (n=107); and (6) with thyroid dysfunction whose serum TSH levels were not in the normal reference range (0.35-3.94 μIU/mL) (n=139). Finally, a total of 3, 148 participants (1, 268 men and 1, 880 women) were included in the present analysis.
The study protocols were approved by the Committee on Human Research at Rui-Jin Hospital, Shanghai Jiao Tong University School of Medicine. All participants provided written informed consent. Information on sociodemographics and medication history was collected using standardized questionnaire by a trained physician. Anthropometric measurements were performed according to standard protocols. Blood pressure measurement was done three times consecutively at 1-min intervals on the non-dominant arm (usually the left arm) after at least 10 minutes' rest using an automated electronic device (OMRON model HEM-752 FUZZY; Omron Company, Dalian, China), and the mean value of the three readings was used for analysis. Participants who smoked at least one cigarette per day or seven cigarettes per week in the past 6 months were defined as current smokers, and those who had alcohol intake at least once a week in the past 6 months were defined as current drinkers.
Plasma and serum samples were obtained after at least 10-h fasting. The collected fasting venous blood samples in the routine tube were immediately centrifuged on site at 4 ℃. Blood glucose and lipid profile including total cholesterol, triglycerides, high-density lipoprotein cholesterol (HDL-C), and low-density lipoprotein cholesterol (LDL-C) were measured within 2 h of collection using an automatic biochemical instrument (Bayer Biochemical auto-analyzer ADVIA 1650, Bayer, Leverkusen, Germany). The estimated glomerular filtration rate, expressed in ml/min per 1.73 m2 was calculated with the Chronic Kidney Disease (CKD)-Epidemiology Collaboration equation based on serum creatinine levels.
Thyroid measurements were determined in the Clinical Laboratory for Endocrinology, Shanghai Institution of Endocrine and Metabolic Disease, which is certified by College of American Pathologists. Serum FT3, FT4, and TSH levels were determined by Chemiluminescent Microparticle Immunoassay (CMI) by the Architect system (Abbott Laboratories, Abbott Park, IL). The laboratory reference range of FT3 was 2.62-6.49 pmol/L (with an interassay coefficient of variation [CV] of 4.7%-8.0%), of FT4 was 9.01-19.04 pmol/L (with an interassay CV of 2.6%-5.3%), and of TSH was 0.35-4.94 μIU/mL (with an interassay CV of 3.1%-3.4%). Serum thyroid antibodies including thyroid peroxidase antibody (TPOAb) and thyroglobulin antibody (TgAb) were measured using Architect Anti-TPO and Anti-TG CMI on the Architect System (Abbott Laboratories). The laboratory reference ranges were < 5.61 IU/mL (with an interassay CV of 4.3%-6.8%) for TPOAb and < 4.11 IU/mL (with an interassay CV of 3.2%-5.2%) for TgAb. ABI, an indicator of PAD, was measured by a fully automatic arteriosclerosis diagnose device (Colin VP-1000, Model BP203RPE Ⅱ, form PWV/ABI) with participants in supine position after resting for 10-15 min. We defined ABI as the ratio of systolic pressure of the ankle to that of systolic pressure of the arm. Ankle and brachial artery pressures were measured simultaneously on both sides and ABI was calculated automatically. Participants who had an ABI < 0.9 at either side were diagnosed as having PAD[5].
We performed statistical analysis using SAS 9.3 (SAS Institute, Cary, NC, USA) and P value < 0.05 (two-sided) indicated statistical significance. Triglycerides, FT3, FT4, TSH, TPOAb, and TgAb were logarithmically normalized before analysis. To test the difference of characteristics among PAD status, continuous variables were compared using one-way analysis of variance (ANOVA), and categorical variables were compared using Cochran-Armitage χ2 test. Multivariate logistic regression models were used to evaluate the association between thyroid hormones levels and PAD. Model 1 was unadjusted; model 2 was adjusted for age, sex, body mass index (BMI), smoking and drinking status, systolic blood pressure (SBP), diastolic blood pressure (DBP), triglycerides, HDL-C, LDL-C, diabetes status, TPOAb, and TgAb; and model 3 was further adjusted for estimated glucose filtration rate (eGFR).
Basic clinical characteristics of the study population are presented in Table 1. The mean age of the study population was 60.7 years and 59.7% were females (n=1, 880). The prevalence of diabetes was 32.2% in the study population. Prevalence of PAD was 2.9% (n=91) among 3, 148 participants. Compared with participants without PAD, participants with PAD were older, had higher proportions of current smokers, had higher BMI, SBP, and serum triglycerides levels, and lower serum HDL-C and FT3 levels and FT3/FT4 ratio (P≤0.05 for these variables).
Characteristics Total Population
N=3, 148PAD (NO)
N=3, 057PAD (Yes)
N=91P Value Age (y) 60.7±9.79 60.5±9.8 68.4±11.5 < 0.0001 Female, n (%) 1880 (59.7) 1830 (59.9) 50 (55.0) 0.34 BMI (kg/m2) 24.8±3.6 24.8±3.6 25.5±4.9 0.002 Current smokers, n (%) 648 (20.6) 622 (20.3) 26 (28.6) 0.02 Current drinkers, n (%) 542 (17.2) 531 (17.4) 11 (12.1) 0.19 SBP (mmHg) 138.9±22.1 138.4±21.6 155.2±30.0 < 0.0001 DBP (mmHg) 78.4±10.2 78.4±10.2 78.3±11.0 0.61 Diabetes, n (%) 1003 (32.2) 944 (31.4) 59 (60.9) < 0.0001 Triglycerides (mmol/L) 1.45 (1.00-2.10) 1.44 (1.00-2.09) 1.69 (1.15-2.33) 0.02 HDL-C (mmol/L) 1.36±0.30 1.36±0.31 1.27±0.26 0.009 LDL-C (mmol/L) 2.38±0.68 2.38±0.68 2.49±0.72 0.22 FT3 (pmmol/L) 4.60 (4.29-4.92) 4.61 (4.30-4.93) 4.42 (4.12-4.69) < 0.0001 FT4 (pmmol/L) 14.24 (13.25-15.33) 14.24 (13.25-15.32) 14.22 (13.38-15.69) 0.26 FT3-to-FT4 ratio 0.32 (0.30-0.35) 0.32 (0.30-0.35) 0.31 (0.28-0.33) < 0.0001 TSH (μIU/mL) 1.44 (1.01-2.10) 1.44 (1.01-2.10) 1.39 (0.92-2.14) 0.39 TPOAb (IU/mL) 0.31 (0.17-0.73) 0.31 (0.17-0.73) 0.32 (0.17-0.61) 0.62 TgAb (IU/mL) 1.05 (0.70-2.40) 1.05 (0.70-2.41) 1.14 (0.72-2.27) 0.93 Note. Data are means±SD, medians (interquartile ranges) for skewed variables, and proportions for categorical variables. BMI: Body mass index, SBP: systolic blood pressure, DBP: diastolic blood pressure, HDL-C: high-density lipoprotein cholesterol, LDL-C: low-density lipoprotein cholesterol, FT3: free triiodothyronine, FT4: free thyroxin FT3/FT4 ratio: free-triiodothyronine-to-free-thyroxin ratio, TSH: thyroid-stimulating hormone, TPOAb: thyroid peroxidase antibody, TgAb: thyroglobulin antibody. Table 1. Baseline Characteristics of the Study Population
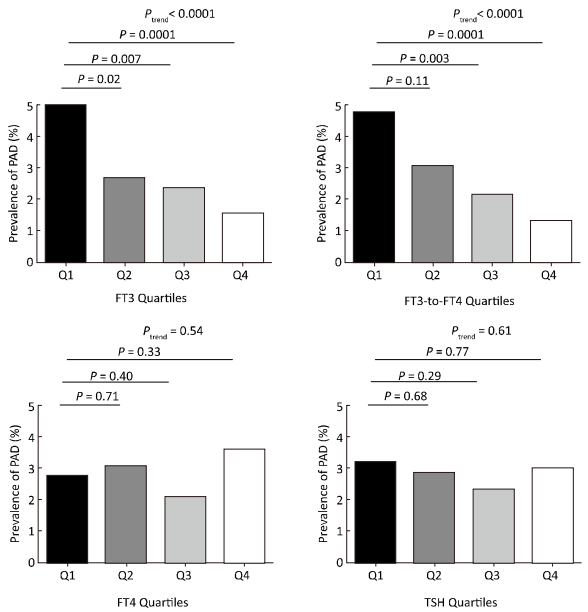
The prevalence of PAD decreased according to FT3 quartiles (5.0%, 2.7%, 2.4%, and 1.5%, respectively; P for trend < 0.0001) and according to the FT3/FT4 ratio quartiles (4.8%, 3.1%, 2.2%, and 1.3%, respectively; P for trend < 0.0001) (Figure 1). After adjusting for potential confounders including age, sex, BMI, current smoking and drinking status, SBP, DBP, triglycerides, HDL-C, LDL-C, diabetes status, TPOAb, TgAb, and eGFR, multivariate logistic regression analyses revealed that risk of prevalence of PAD decreased across the thyroid hormones quartiles. Compared to the lowest quartile, the risk of prevalence of PAD was significantly decreased in the third (multivariate-adjusted OR, 95% CI: 0.57, 0.32-0.99 for FT3) and the highest quartiles (multivariate-adjusted OR, 95% CI: 0.32, 0.15-0.62 and 0.31, 0.13-0.66 for FT3 and FT3/FT4 ratio, respectively) (Table 2). We found three additional risk factors for prevalence of PAD by multivariate logistic regression model, including current smoking (yes), SBP (per 1 mmHg), and diabetes (yes) (multivariate-adjusted OR, 95% CI: 2.60, 1.40-2.70, 1.02, 1.01-1.04 and 1.68, 1.07-2.65, respectively).
Figure 1. The prevalence of PAD according to the quartiles of FT3, FT4, FT3/FT4 ratio, and TSH among euthyroid participants. FT3 quartiles: quartile 1 (Q1), < 4.29 pmol/L; quartile 2 (Q2), 4.29-4.60 pmol/L; quartile 3 (Q3), 4.61-4.92 pmol/L; quartile 4 (Q4), > 4.92 pmol/L. FT4 quartiles: Q1, < 13.25 pmol/L; Q2, 13.25-14.24 pmol/L; Q3, 14.25-15.33 pmol/L; Q4, > 15.33 pmol/L. FT3/FT4 ratio quartiles: Q1, < 0.30; Q2, 0.30-0.32; Q3, 0.33-0.35; Q4, > 0.35. TSH quartiles: Q1, < 1.01 μIU/mL; Q2, 1.01-1.44 μIU/mL; Q3, 1.45-2.10 μIU/mL; Q4, > 2.10 μIU/mL.
Items Quartiles of Thyroid Hormones Quartile 1 Quartile 2 Quartile 3 Quartile 4 P for trend FT3 Quartiles FT3, pmol/L < 4.29 4.29-4.60 4.61-4.92 > 4.92 Age, mean±sd (PAD+) 70.0±11.2 63.8±12.9 65.3±11.8 64.4±9.9 0.07 Age, mean±sd (PAD-) 63.2±10.9 69.8±10.0 59.9±9.3 58.3±8.2 < 0.0001 Cases/participants 39/785 21/792 19/791 12/780 < 0.0001 Model 1 1.00 0.52 (0.30-0.89) 0.47 (0.26-0.81) 0.30 (0.15-0.56) 0.0008 Model 2 1.00 0.58 (0.31-1.04) 0.61 (0.32-1.13) 0.32 (0.14-0.69) 0.007 Model 3 1.00 0.64 (0.37-1.08) 0.57 (0.32-0.99) 0.32 (0.15-0.62) 0.01 FT3-to-FT4 ratio Quartiles FT3-to-FT4 ratio < 0.30 0.30-0.32 0.33-0.35 > 0.35 Age, mean±sd (PAD+) 70.5±10.3 58.7±11.6 66.1±11.0 67.5±13.3 0.17 Age, mean±sd (PAD-) 63.0±10.6 61.0±9.9 59.7±9.3 58.5±8.8 < 0.0001 Cases/participants 44/919 18/580 18/828 11/821 < 0.0001 Model 1 1.00 0.64 (0.36-1.10) 0.44 (0.25-0.76) 0.27 (0.13-0.51) < 0.0001 Model 2 1.00 0.78 (0.41-1.42) 0.67 (0.35-1.12) 0.31 (0.13-0.65) 0.003 Model 3 1.00 0.78 (0.41-1.43) 0.68 (0.36-1.23) 0.31 (0.13-0.66) 0.004 FT4 Quartiles FT4, pmol/L < 13.25 13.25-14.24 14.25-15.33 > 15.33 Age, mean±sd (PAD+) 67.9±12.5 68.3±12.8 63.8±10.7 66.7±11.3 0.52 Age, mean±sd (PAD-) 60.0±10.1 60.2±9.4 60.0±9.7 61.9±10.0 0.0009 Cases/participants 21/761 24/779 17/809 29/799 0.54 Model 1 1.00 1.12 (0.62-2.05) 0.76 (0.39-1.44) 1.33 (0.75-2.38) 0.33 Model 2 1.00 1.00 (0.52-1.95) 0.78 (0.38-1.56) 1.06 (0.57-2.03) 0.81 Model 3 1.00 1.01 (0.52-1.99) 0.79 (0.39-1.59) 1.08 (0.57-2.05) 0.80 TSH Quartiles TSH, μIU/mL < 1.01 1.01-1.44 1.45-2.10 > 2.10 Age, mean±sd (PAD+) 67.9±10.0 68.1±11.4 63.9±12.9 67.5±1 2.9 0.54 Age, mean±sd (PAD-) 60.3±9.6 60.5±9.3 60.8±9.9 60.5±10.4 0.60 Cases/participants 25/780 24/791 20/789 22/788 0.61 Model 1 1.00 0.89 (0.50-1.57) 0.73 (0.40-1.32) 0.92 (0.51-1.64) 0.77 Model 2 1.00 1.00 (0.52-1.95) 0.78 (0.38-1.56) 1.06 (0.57-2.03) 0.81 Model 3 1.00 0.87 (0.45-1.65) 0.84 (0.43-1.61) 0.95 (0.48-1.84) 0.95 Note. Model 1: Unadjusted, Model 2: Adjusted for age, sex, BMI, smoking and drinking status, SBP, DBP, triglycerides, HDL-C, LDL-C, diabetes status, TPOAb, and TgAb, Model 3: Model 2 further adjusted for eGFR. Table 2. The Odds Ratios of PAD According to the Quartiles of FT3, FT3-to-FT4 Ratio, FT4, and TSH in Euthyroid Participants
In this community-based cross-sectional study of 3, 148 middle-aged or older Chinese adults, we found that higher serum FT3 levels within the normal range and increased FT3/FT4 ratio were significantly associated with a decreased risk of prevalence of PAD. This association was independent from traditional cardiometabolic risk factors. To the best of our knowledge, this is the first large-scale population-based investigation on the association between thyroid hormones and PAD.
The association between thyroid dysfunction and changes in cardiovascular hemodynamics has been recognized in previous studies[2]. Both overt and subclinical hypothyroidisms were related to accelerated atherosclerosis[2-3]. In the present study, we added new evidence that FT3 levels and the FT3/FT4 ratio was inversely associated with PAD independent of traditional cardiometabolic factors in general euthyroid population.
The potential relationship between serum FT3 levels and PAD may be explained by several mechanisms. First, reduced FT3 levels may lead to PAD by promoting endothelial impairment that is associated with multiple cardiometabolic disorders, such as hypertension, diabetes, coronary artery disease, and peripheral artery disease[6]. Previous studies suggest that triiodothyronine exerts important effects on the vascular system, mainly through inducing relaxation of vascular smooth muscle cells via activation of nitric oxide synthase and inducing adrenomedullin expression in endothelial cells[7]. Direct modulation of endothelium-dependent and endothelium-independent vasoregulation may partly explain the triiodothyronine-induced decrease in systemic vascular resistance. In addition, generalized endothelia dysfunction plays an important role in both initiation and progression of atherosclerosis. Endothelium dysfunction triggers a self-perpetuating downward spiral involving inflammation and platelet and smooth muscle cell activation, leading to degenerative vascular processes with vascular wall thickening and stiffening[8].
In the current study, we did not find significant associations between serum FT4 or TSH and PAD in euthyroid individuals. The biological mechanism of this relation remains unclear. In the cardiovascular system, the magnitude of transport of triiodothyronine is 2.5-fold higher than thyroxin. Furthermore, triiodothyronine is better advanced in improving systemic vascular resistance than thyroxin[9]. TSH secretion from the pituitary gland is by serum thyroxin and triiodothyronine and changes mainly regulated occurred in TSH bioactivity, thyroid TSH responsiveness by factors regulating thyroid hormone uptake and metabolism, thyroid hormone receptors, and/or cofactors that modulate the T3-responsiveness with increasing age[2]. Accordingly, older people have lower TSH responses to thyrotropin-releasing hormone stimulation than young people[2]. Thus, circulating FT3 levels might be a more sensitive index of effects of thyroid function in predicting atherosclerosis and PAD.
The strengths of the present study include the large simple size and the comprehensively controlled covariates in multivariate-adjusted analysis. However, several limitations of our study must be considered. First, the cross-sectional design of the current study prevents us from further disclosing the causal relationship of thyroid hormones and PAD. Second, although we have taken into account many important potential confounders for PAD, unmeasured covariates that might mediate the association possibly still exist. Third, PAD was diagnosed on the basis of ABI instead of angiography, which is the gold-standard for diagnosis. However, ABI measurement has been documented as a simple, noninvasive, and widely validated procedure that can be performed easily in the outpatient setting[10]. Forth, the present study was based on adults aged 40 years and above; therefore, the extrapolation of the findings to population of other age groups has been made with care.
The present study showed that serum FT3 and the FT3/FT4 ratio was inversely associated with PAD in Chinese population aged 40 years and older independent of traditionally risk factors including age, smoking, diabetes, hypertension, and hyperlipidemia. Our findings suggested that high FT3 levels within the clinically defined normal range were associated with a decreased risk of prevalence of PAD. Further prospective studies are needed to validate our observations.
Association between Free Triiodothyronine Levels and Peripheral Arterial Disease in Euthyroid Participants
doi: 10.3967/bes2017.016
Funds:
the Ministry of Science and Technology 2015BAI12B02
the National Natural Science Foundation of China 81370960
the Ministry of Science and Technology 2016YFC1305202
the Ministry of Science and Technology 2016YFC0901200
the Ministry of Science and Technology 2015BAI12B14
the National Natural Science Foundation of China 81670795
- Received Date: 2016-09-14
- Accepted Date: 2017-01-09
Abstract: This current cross-sectional study investigates the relationship between thyroid hormones and peripheral artery disease (PAD) among euthyroid Chinese population aged 40 years and above. Serum free triiodothyronine (FT3), free thyroxin (FT4), thyroid-stimulating hormone (TSH), and thyroid antibodies were measured. PAD was defined as ankle-brachial index (ABI) < 0.9. There were 91 (2.9%) PAD cases among the 3, 148 euthyroid study participants. Participants in the highest quartile of FT3 and free-triiodothyronine-to-free-thyroxin (FT3/FT4 ratio) had a decreased risk of prevalent PAD (multivariate-adjusted odds ratio, 95% confidence interval: 0.32, 0.15-0.62, P for trend=0.01 and 0.31, 0.13-0.66, P for trend=0.004, respectively) compared to those in the lowest quartile. To conclude, FT3 levels and the FT3/FT4 ratio was inversely associated with prevalent PAD in euthyroid Chinese population aged 40 years and above.
| Citation: | WANG Po, DU Rui, LIN Lin, DING Lin, PENG Kui, XU Yu, XU Min, BI Yu Fang, WANG Wei Qing, NING Guang, LU Jie Li. Association between Free Triiodothyronine Levels and Peripheral Arterial Disease in Euthyroid Participants[J]. Biomedical and Environmental Sciences, 2017, 30(2): 128-133. doi: 10.3967/bes2017.016

|

 Quick Links
 DownLoad: