


HTML
-
Obesity has reached epidemic proportions in the developed countries[1]. Although recent studies have suggested that obesity prevalence may have reached a plateau in some developed countries[2, 3], obesity remains a major public health concern in these countries[4]. In many developing countries, the prevalence of obesity has been increasing rapidly as a result of socioeconomic changes. In China, the largest developing country in the world with a population of 1.4 billion people, there has been a rapid and dramatic increase in obesity prevalence, from 7.1% in 2002 to 11.9% in 2012[5, 6]. Consequently, there has been a parallel increase in the prevalence of several cardiometabolic diseases, such as type 2 diabetes, hypertension, stroke, and heart diseases[7, 8].
Numerous studies have firmly established that the factors that occurred earlier in life probably contributed to the development of obesity in adult life[9-11]. Childhood body mass index (BMI), the most commonly used measure of obesity, demonstrates a strong association (correlation coefficient ranging between 0.3 and 0.9) with adult BMI and obesity, in many cases, decades later[12]. However, most of these findings were observed from populations outside of China. However, the extent to which childhood BMI is associated with adult BMI and obesity in populations in China is not well studied. Furthermore, genetic factors contribute significantly to the development of obesity[13, 14]; however, whether parental obesity has an impact on the link between childhood BMI and adult obesity in Chinese populations remains unclear. Data on these aspects are critical for understanding the nature of obesity beginning in childhood and for developing strategies for the early prevention of adult cardiometabolic diseases in China.
In this prospective cohort study of a Chinese population, we aimed to examine the link between childhood obesity and adulthood obesity, and the influence of parental obesity on obesity development from childhood to adulthood.
-
Participants in the Nutrition and Chronic Disease Family Cohort (NCDFaC) study in Shanxi Province were included; this was a follow-up study of the China National Nutrition and Health Survey (CNNHS) conducted in 2002[15, 16]. Participants of the CNNHS from six poor counties in the Shanxi province were invited to join in the NCDFaC as a follow-up study in 2015. Of the 204 children aged 6-17 years who participated in the 2015 assessment, 18 with missing data on parental weight, 15 with missing data on their weight, and 17 with missing values on important covariates were excluded; a total of 154 participants (aged 6-17 years) were finally included in this study. Figure 1 shows the flow diagram depicting the study design and the development of the final study population. Supplementary Table S1 (available in www.besjournal.com) shows the baseline characteristics of the included and excluded participants. No significant differences were observed in mean BMI between included participants and excluded participants (P > 0.05). At baseline and follow-up, data of participants' parents were also collected. Informed consent from parents or guardians and assent from the children were obtained at baseline, and informed consent was obtained from all participants at follow-up. The study was approved by the Ethics Committee of the National Institute for Nutrition and Health, Chinese Center for Disease Control and Prevention.
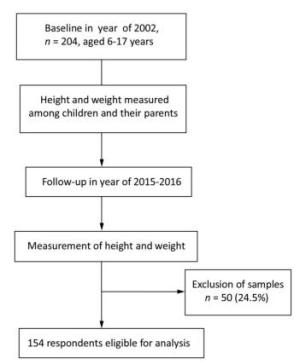
Figure 1. Flow diagram depicting the study design.
-
Anthropometric measurements were performed using standardized techniques and calibrated equipment at all survey sites. The measurement was carried out in accordance with unified method. All measurements followed the standardized protocol by trained staffs. The measurements of each indicator were retested partly to ensure the interrater reliability. Moreover, standardized tests were developed by measurement professionals using mathematical methods to control errors. Height was measured once to the nearest 0.1 cm with the participant wearing no shoes, while body weight was measured once to the nearest 0.1 kg, in the morning after an overnight fasting, with the participant wearing only light clothes. BMI was calculated as weight in kilograms divided by height in meters squared (kg/m2).
-
The following covariates were included in the analysis: age (Q1, 6.0-7.9 years; Q2, 8.0-9.9 years; Q3, 10.0-13.0 years; and Q4, 13.1-17.9 years), sex (male or female), household income (< 2, 000 Yuan, 2, 000-5, 000 Yuan, or > 5, 000 Yuan), and parental BMI and obesity at baseline.
-
Age- and sex-specific BMIs according to the Chinese standard for children and adolescents were calculated and used to determine obesity status in children and adolescents[17]. Parental weight status was determined using the following Chinese classification system: adult underweight (BMI < 18.5 kg/m2), normal weight (18.5 ≤ BMI < 24.0 kg/m2), overweight (24.0 ≤ BMI < 28.0 kg/m2), and obesity (BMI ≥ 28.0 kg/m2)[18]. In the current study, we used dichotomous variables to define obesity status as obese and non-obese for both participants and their parents.
Data were analyzed using SAS version 9.4 for Windows (SAS Institute Inc., Cary, NC, USA). Categorical variables were presented as percentage (%), while continuous variables as means and standard deviation. Chi-square tests were used to assess the categorical variables. T-test and analysis of variance were used to assess the continuous variables. Multiple linear regression analyses were used to assess the association of childhood BMI and parental BMI with adulthood BMI, and logistic regression analyses were used to assess the association of childhood obesity and parental obesity status with adulthood obesity after adjusting for age, sex, parental BMI or obesity at baseline, and household income. The odds ratios (ORs, 95% CI) were visually presented in Stata 13.0.
Study Design and Participants
Anthropometric Measurements
Covariance
Statistical Analysis
-
The characteristics of the 154 included participants were compared with those of the 50 excluded participants, and no significant differences were observed between the two groups in terms of age, sex, and BMI (P > 0.05). The baseline demographic characteristics of the non-obese group and obese group are shown in Table 1. No significant differences were observed between the two groups in terms of sex, age, household income, and father's and mother's BMI. When combined with parental obesity status, a significant difference was observed between the two groups (Table 1, P < 0.05). The BMI of the obese group was higher than that of the non-obese group (Table 1, P < 0.05).
Characteristics Total Non-obese Obese P Female, n (%) 106 (52.0) 99 (54.0) 7 (33.3) 0.129 Age, years, mean (SD) 10.8 (3.2) 10.7 (3.1) 11.8 (3.6) 0.233 BMI, kg/m2 (SD) 17.2 (3.2) 16.5 (2.2) 23.7 (3.6) < 0.0001 Household Income, % 0.115 < 2, 000 Yuan 59.6 61.0 46.7 2, 000-5, 000 Yuan 25.8 26.5 20.0 > 5, 000 Yuan 14.6 12.5 33.3 Father's BMI, kg/m2 (SD) 24.1 (2.9) 24.0 (2.9) 24.7 (2.8) 0.374 Mother's BMI, kg/m2 (SD) 24.0 (3.4) 23.8 (3.4) 25.5 (3.0) 0.066 Father's obesity, yes (%) 9.0 9.2 7.7 0.860 Mother's obesity, yes (%) 11.2 10.2 20.0 0.253 Parental obesity, yes (%) 21.1 18.5 42.9 0.034 Note. Overweight and obesity were defined by using the Chinese standard for children and adults; Parental obesity was defined as either parent being obese. Table 1. Characteristics of the Study Cohort at Baseline in 2002 (n = 204)
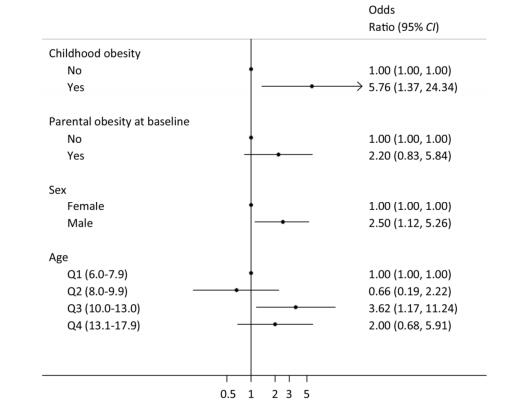
The percentage of non-obese children grow up to non-obese adults was 62.6%, and the percentage of obese children grew up to obese adults was 80.0%. The difference was considered significant (Table 2, P < 0.05). Table 3 shows the results of the multivariate linear regression analyses of adulthood BMI. After adjustment for age, sex, parental BMI at baseline, and household income, the childhood BMI and age were found to be associated with adulthood BMI, with B regression coefficients of 3.76 (95% CI: 1.36-6.16) for childhood BMI in fourth quartile, and 2.61 (95% CI: 0.44-4.78) for age in third quartile (10.0-13.0 years). Results of the logistic regression analyses of the association between childhood obesity and adulthood obesity are shown in Figure 2. Moreover, childhood obesity (OR = 5.76, 95% CI: 1.37-24.34), sex (male) (OR = 2.50, 95% CI: 1.12-5.26), and age in third quartile (10.0-13.0 years) (OR = 3.62, 95% CI: 1.17-11.24) were significantly associated with adult obesity after adjusting for all confounders. By contrast, their parental BMI or obesity status at baseline was not associated with adulthood obesity.
Childhood Adulthood Total P Non-obese Obese Non-obese 87 (62.6) 52 (37.4) 139 (100.0) Obese 3 (20.0) 12 (80.0) 15 (100.0) 0.002 Note. Data are shown as n (%). Table 2. Change of Obesity from Childhood to Adulthood, n (%)
Nariables Adulthood BMI (kg/m2) β 95% CI P Childhood BMI (kg/m2) Q1 0.00 - Q2 0.68 -1.34 to 2.70 0.508 Q3 1.61 -0.68 to 3.91 0.166 Q4 3.76 1.36 to 6.16 0.002 Mother's BMI (kg/m2) Q1 0.00 - Q2 0.92 -1.19 to 3.04 0.387 Q3 0.76 -1.28 to 2.81 0.461 Q4 1.56 -0.53 to 3.64 0.142 Father's BMI (kg/m2) Q1 0.00 - Q2 -0.35 -2.25 to 1.56 0.720 Q3 0.07 -1.86 to 1.99 0.947 Q4 1.77 -0.14 to 3.67 0.069 Age (years) Q1 0.00 - Q2 0.60 -1.44 to 2.64 0.561 Q3 2.61 0.44 to 4.78 0.019 Q4 0.63 -1.58 to 2.84 0.572 Note. Q, quartile. Adjusted for age, sex, parental BMI at baseline, and household income. Table 3. Multivariate Linear Regression Model to Evaluate the Effect of Childhood BMI and Parental BMI on Adulthood BMI (β Coefficients and 95 % confidence intervals)

Figure 2. Associations between childhood obesity and adulthood obesity in China (odds ratios and 95% confidence intervals). Parental obesity was defined as either parent being obese. Age_Q1 (6.0-7.9) means that the first quartile range of age was 6.0 years to 7.9 years (similarly hereinafter). Adjustment for age, sex, childhood obesity, parental obesity status at baseline, and household income.
-
In this longitudinal study, we showed that childhood BMI and obesity were significantly associated with adulthood BMI and obesity. Parental obesity at baseline was not positively associated with the increased risk of obesity during adulthood after adjustments for putative risk factors. Male participants and those aged 10.0-13.0 years had higher risk of adulthood obesity. These data can serve as a basis when developing an obesity prevention strategy beginning in childhood.
The continuous increases in the prevalence of adult and child obesity have become a serious public health concern. Both genetic and environmental factors contributed to the development of obesity from childhood to adulthood[19-21]. However, data on the prevalence of obesity among populations from China, which has the largest population and has been undergoing a dramatic socioeconomic transition, are limited. Our findings showed that childhood BMI was a strong predictor of adulthood BMI and obesity status. Table 2 shows that 80% of obese children remain obese when they grow up. Table 3 and Figure 2 show that obese children had the tendency to remain obese when they reach adulthood. These results were consistent with those of previous studies[20, 22-25], which were mostly from high-income countries. Our study provides further evidence regarding the prevalence of obesity in middle-income countries and supports the concept that obesity begins in childhood and tends to persist into adulthood[26, 27].
In this study, the male participants had higher risk of adulthood obesity, which was consistent with our previous study[28]. In addition to being associated with eating more high fat and energy foods, it was also associated with Chinese cultural tradition. Overweight boys are often considered 'strong' in China, while thin girls are regarded as beautiful. In addition, participants aged 10-13 years, which was considered as the peak growth period, had a higher risk of adulthood obesity and this might be related to overfeeding of children.
Parents have some responsibility for children's obesity, and they are often the focus of public health interventions designed to improve children's lifestyle and thereby reduce the prevalence of childhood obesity. The results from our previous study showed that parental obesity was associated with higher BMI and risk of childhood obesity, which confirmed that family environments contribute to obesity development in Chinese populations as well[28]. In this cohort study, our results found that parental obesity at baseline was associated with children's obesity (Table 1), but was not positively associated with the children's obesity during adulthood (Table 3 and Figure 2). These results suggested that the effect of parental obesity on children diminishes as they enter adulthood. Furthermore, we could infer from the results that social and environmental factors may be more influential than genetic factors in China.
The link between parental obesity status and childhood obesity development apparently reflect both the contributions of genetic factors and shared environmental factors within families. Some previous studies suggested that obesogenic environment had more influence on childhood adiposity despite the influence of genetics[29, 30]. Obesogenic lifestyles and behavioral traits can be easily passed down from parents to children through the family socialization process[31]. The shared living environment between parents and their children may expose both parties to common obesogenic factors, such as unhealthy eating and a sedentary lifestyle. As children grow older, their center of life gradually transferred from home to school or society and parental influence on children diminished as they enter adulthood. This might explain why parental obesity had no positive association with children's adulthood obesity and related to children's obesity.
Findings from the current study have import implications for early prevention and intervention of obesity from childhood to adulthood, particularly in Chinese populations. First, because children with obesity had the tendency to become adults with obesity, obesity prevention should begin during childhood. In this regard, available literature suggest that health promotion in children is effective and feasible[32]. Population-specific programs that meet the needs of different populations are needed and should be more effective than one-fits-all programs, such as those focusing more on obese boys and children with obese parents. Second, family-based programs are needed to tackle the rising obesity epidemic in developing economies. Such programs should be more effective in that they will bring about healthier changes in both children and parents. The current food environments are likely to exacerbate the influence of genetic predisposition to obesity. As such, targeting high-risk families should be an important component in any obesity prevention program. Further interventional studies are required to determine which approaches on childhood body weight management interventions are efficiently directed at households.
Our study had several strengths and limitations. The current study was family based and prospective and had a long follow-up time. The data provided by the current study filled the important gap in knowledge regarding the development obesity from childhood to adulthood in developing countries in general and in China in particular. This study also adopted rigorous quality control measures during the investigation. Despite all these strengths, we recognized that our study had a few limitations. Participants in the current study were recruited from a single province in China. Hence, the strengths of the associations between childhood BMI and adult obesity may vary across the country. However, we believe that the overall findings can still bring us enlightenment. The generalizability of the study may be limited due to the small sample size and the number of confounding variables. Moreover, the difference between participants in terms of sex or age cannot be determined using a stratified analysis due to the limited sample size. Nevertheless, our results provide valuable information regarding the process of obesity development across childhood and adulthood. Meanwhile, further study is needed to understand other socioeconomic factors that may contribute to obesity risk.
-
In conclusion, our study demonstrates that childhood obesity is an important predictor of adulthood obesity. The effect of parental obesity on children diminishes as they enter adulthood. Therefore, family-based intervention programs are needed to tackle the increasing epidemic of obesity and its related cardiometabolic disorders.
-
LIU Dan performed the data analyses and wrote the manuscript; HAO Yun Xia, ZHAO Ting Zhi, ZHANG Jian, WANG Zhuo Qun, ZHANG Mei, ZHAI Yi, ZHAO Yan Fang, WANG Yu Ying, and MI Sheng Quan contributed significantly to data collection and manuscript preparation; SONG Peng Kun, and PANG Shao Jie played an important role in revising the manuscript and interpreting the results; and ZHAO Wen Hua and ZHANG Jian conceived and designed the work, and approved the final version.
-
The study was sponsored by the National Institute for Nutrition and Health, Chinese Center for Disease Control and Prevention, and conducted by the Ministry of Health, Ministry of Science and Technology, and National Bureau of Statistics of the People's Republic of China. We would like to thank the staff from the Centers for Disease Control and Prevention of Shanxi Province and United Nations International Children's Emergency Fund; the staff of the Centers for Disease Control and Prevention of Xinzhou City, Tianzhen County, Heshun County, Linyi County, Wuzhai County, and Yangcheng County; all members of the project team; and all participants for their support and cooperation.
-
The authors declare that they have no competing interests.
Characteristics Inclusion Samples Exclusion Samples Total Samples P Value Sex > 0.05 Male 75 (48.7) 23 (46.0) 98 (48.0) Female 79 (51.3) 27 (54.0) 106 (52.0) Age, years, mean (SD) 10.9 (3.6) 10.6 (3.0) 10.8 (3.2) > 0.05 BMI, kg/m2 (SD) 17.6 (3.5) 17.1 (2.9) 17.2 (3.2) > 0.05 Table Supplementary Table S1. Basic Characteristics of Inclusion and Exclusion of Samples

 Quick Links
 DownLoad: