


HTML
-
Population aging is a worldwide phenomenon with significant effects on the society. It is estimated that, between 2015 and 2030, the aging population will grow by 56%, from 901 million to 1.4 billion, and, by 2050, the population will grow more than double its size in 2015, possibly reaching up to 2.1 billion[1]. Health, independence, and quality of life of the elderly population depend on their nutritional well-being[2]. Being malnourished or having nutritional risk is associated with higher morbidity, longer stay in hospital, and increased mortality, leading to personal and economic burden for the elderly patient and society[3]. Therefore, early prevention, identification of high-risk individuals, and appropriate interventions should be addressed in this group.
Anthropometry provides information on the physical status of the individual and can be associated with nutritional status. Anthropometric measurements, such as body mass index (BMI), are simple, noninvasive, and easy-to-use tools in routine nutritional risk assessments and accurate indicators of weight change, terminal functional decline, and functional status[4-5], although the appropriate cutoff point of BMI for the elderly population is still not defined. The current practice of diagnosing undernutrition with BMI needs an accurate measurement of weight and height. However, many elderly individuals in nursing homes and in hospitalized patients are unable stand for height and weight measurements. When height cannot be measured, an approximation can be derived from self-reported values and observer estimation. Loss of height with increasing age is associated with greater inaccuracies of self-reported height, with studies on adults aged ≥ 65 years reporting mean overestimates of 2.3-5.0 cm. Moreover, greater differences in women are probably associated with greater osteoporosis-related bone loss[6-7].
The calf circumference (CC) proposed here could be an alternative to this subject. CC is an anthropometric parameter that is closely related to whole body muscle mass[8]. Although the results demonstrate that CC has a good ability to predict muscle mass decrease, the different cutoff points available in the literature, 31-35 cm in women (27-31) and 33-34 cm in men (28-31), hinder clinical judgment and therapeutic decision-making by the professional in clinical practice. This is partly due to variation in normative ranges between populations. A previous study found a positive correlation between CC and BMI, arm circumference, triceps skinfold, mid-arm muscle circumference, and mid-arm muscle area[9]. The most commonly used test for the assessment of malnutrition in geriatric patients in daily practice is the Mini Nutritional Assessment short-form (MNA-SF) test. One of the domains of the MNA-SF test is BMI. If it is not possible to assess the BMI of patients, the well validated parameter, instead of BMI, is CC[10]. All these studies indicate that CC can be used as a complementary tool for monitoring the nutritional status of elderly inpatients.
There is a lack of evidence-based clinical guidance to support CC application in predicting the nutritional risk, especially in patients aged ≥ 80 years. The present study attempted to address this gap. The aim of this study was to determine whether CC can predict nutritional risk in Chinese hospitalized patients aged ≥ 80 years. We also aimed to determine the cutoff values of CC for predicting nutritional risk in this population.
-
A total of 1, 234 consecutive patients admitted to the Department of Geriatrics at Shanghai Jiaotong University Affiliated Sixth People's Hospital between July 2017 and April 2018 were recruited in this study. The study inclusion criteria were age ≥ 80 years and availability of complete medical and nutritional information from the medical records of the institution. The exclusion criteria were age < 80 years, presence of carcinomatous cachexia (referent to the clinical history), critical illness, inability to communicate, bedridden status, and edema. The study was approved by the Ethics Committee of the Shanghai Jiaotong University Affiliated Sixth People's Hospital [approval number, 2016-141-(1)]. Written informed consent was obtained from all participants and adhered to the tenets of the Declaration of Helsinki.
-
Participants' demographic information, lifestyle variables, and personal disease history were collected using questionnaires and confirmed through examination of medical records. The variables included age, sex, cigarette smoking, alcohol drinking, and personal history of diabetes, hypertension, cerebral infarction, chronic obstructive pulmonary disease (COPD), coronary heart disease, and neoplasms. Our standard physician assessments define 'current smokers or drinkers' as patients who recounted a history of active smoking or drinking in the last 6 months. The diagnostic criteria of type 2 diabetes were based on the American Diabetes Association diagnostic criteria 2016. Hypertension was defined as either blood pressure ≥ 140/90 mmHg or current antihypertensive treatment. Dyslipidemia was defined according to the American National Cholesterol Education Program (Adult Treatment Panel Ⅲ) guidelines. Coronary heart disease was considered present if patients had an ischemic history or electrocardiographic signal perturbation that is typical of ischemia. Cerebral infarction was defined as a history of ischemia attack confirmed by cerebral CT or MRI scan. COPD was diagnosed according to the Chinese Thoracic Society guideline that the post-bronchodilator forced expiratory volume in one second (FEV1)/forced vital capacity (FVC) was < 0.7 and other airflow limitation diseases were excluded.
-
Anthropometric parameters included height, weight, and CC. Height and weight were measured while the participants were barefoot and in light clothing using the height and weight scale to the nearest 0.1 cm and 0.1 kg, respectively. BMI (kg/m2) was calculated as weight in kilograms divided by height in square meters. CC was measured with the elderly individual in standing position, at the greatest circumference. All measurements were performed in duplicate, and the means were calculated for analysis.
-
The Nutritional Risk Screening 2002 (NRS-2002) was used to determine nutritional risk, taking into account weight loss, low food intake, BMI, and disease severity. An adjustment factor was used in individuals aged ≥ 70 years. The total NRS-2002 score indicates whether the patient is at nutritional risk (score ≥ 3) or not (score < 3)[11]. A multidisciplinary nutrition support team evaluated the nutritional status of each patient. All patients underwent nutritional status assessment in the first 24 h of hospital stay.
-
All patients had overnight fasting before the blood samples were collected. Hemoglobin level was measured using a standard cyanmethemoglobin method. Serum iron levels were measured by performing a colorimetric endpoint assay with commercial kits from Roche China (Shanghai, China). The serum albumin and prealbumin levels were assessed using turbidimetric immunoassay (Hitachi, Tokyo, Japan). Serum folic acid and vitamin B12 levels were measured using a chemiluminescent immunoassay. Vitamin D level was obtained via electrochemiluminescence assay (Roche) for serum 25-dihydroxyvitamin D [25(OH)D] level.
-
For continuous variables, results were presented as mean ± SD or median (25th percentile to 75th percentile), and the differences between groups were evaluated with the Student's t-test or Mann- Whitney U test. Categorical variables were presented as frequency percentage, and intergroup comparisons were analyzed using the chi-square test. The association between CC and other variables were evaluated with Pearson or Spearman correlation analysis. Multiple logistic regression analysis was used to identify the influencing factors of nutritional risk. Receiver operating characteristic (ROC) curve analysis was performed to determine the optimal cutoff values of CC with optimum sensitivity and specificity for identification of nutritional risk. An optimal cutoff value was defined as the point at which the Youden index (sensitivity + specificity −1) was highest. The area under the ROC curve (AUC) with 95% confidence intervals (CIs) was generated to indicate the diagnostic performance of CC in determining those with nutritional risk. A test is considered perfect if AUC is 1.0 and no better than chance if AUC is 0.5. All statistical analyses were performed using SPSS 21.0 (SPSS Inc., Chicago, IL). A two-sided P-value < 0.05 was considered statistically significant.
Study Population
Data Collection
Anthropometric Measurement
Nutritional Risk Assessment
Laboratory Measurements
Statistical Analyses
-
A total of 1, 234 patients [mean age, 87 (82-90) years; male/female, 906/328] were enrolled in this study. The proportion of nutritional risk, as defined by an NRS-2002 score ≥ 3, was 38.82% (479 cases). The clinical characteristics of patients with and without nutritional risk are presented in Table 1. There was a significant difference in age; BMI; CC; albumin, prealbumin, hemoglobin, and serum iron levels; and prevalence of neoplasms between the two groups. CC values were significantly lower in patients with nutritional risk compared to those without nutritional risk. However, there were no significant differences in sex; serum folic acid, vitamin B12, and 25(OH)D levels; drinking and smoking habit; and prevalence of cerebral infarction, COPD, coronary artery disease, diabetes, hypertension, and hyperlipidemia observed between patients with and without nutritional risk.
Variable Nutritional Risk
(n = 479)Non-Nutritional Risk
(n = 755)P Age (years) 87.000 (83.000-90.000) 85.000 (81.000-89.000) 0.003 Gender (male%) 73.486 78.278 0.308 Body mass index (kg/m2) 20.761 (19.002-23.441) 23.945 (21.912-26.061) < 0.001 Calf circumference (cm) 27.000 (24.500-31.000) 31.000 (29.000-33.500) < 0.001 Prealbumin (mg/L) 180.384 ± 70.571 208.183 ± 52.156 < 0.001 Albumin (g/dL) 37.000 (33.000-40.000) 40.000(38.000-43.000) < 0.001 Hemoglobin (g/dL) 109.043 (93.251 ± 122.756) 124.021(112.752-134.078) < 0.001 Serum iron (μmol/L) 8.711 ± 4.446 13.657 ± 5.671 < 0.001 Folic acid (μg/L) 7.817 (5.156-13.313) 7.362 (4.741-11.687) 0.377 Vitamin B12 (ng/L) 805.951 (525.533-1158.752) 667.551 (457.482-962.933) 0.082 25-hydroxyitamin D (ng/mL) 16.122 (12.061-25.676) 17.377 (11.348-23.972) 0.896 Smoking (%) 18.998 17.881 0.821 Drinking (%) 3.555 3.179 0.184 Cerebral infarction (%) 56.576 47.417 < 0.001 Chronic obstructive pulmonary disease (%) 33.612 25.430 < 0.001 Coronary heart disease (%) 65.344 61.192 0.437 Diabetes (%) 36.326 33.377 0.001 Hypertension (%) 85.803 84.768 0.863 Hyperlipidemia (%) 18.580 30.199 < 0.001 Neoplasms (%) 23.800 11.258 < 0.001 Table 1. Clinical and Biochemical Characteristics of Nutritional Risk and Non-nutritional Risk
To determine the influencing factors of CC, a correlation analysis between clinical and biochemical parameters and CC was conducted. It was found that CC was negatively correlated with age and nutritional risk. Moreover, CC was positively associated with the hemoglobin, albumin, prealbumin, and serum iron levels and prevalence of hyperlipidemia (Table 2).
Variable r P Age -0.296 < 0.001 Body mass index 0.129 0.013 Hemoglobin 0.409 < 0.001 Albumin 0.320 < 0.001 Prealbumin 0.211 < 0.001 Folic acid -0.042 0.471 Vitamin B12 -0.070 0.232 Serum iron 0.335 < 0.001 25-hydroxyitamin D 0.097 0.116 Nutritional risk -0.331 < 0.001 Table 2. Correlation Analysis of Clinical and Biochemical Parameters with Calf Circumference
To determine which factors were independently associated with nutritional risk, logistic regression was performed. Independent variables were indicated as risk factors, including age, BMI, hemoglobin level, albumin level, cerebral infarction, COPD, diabetes, hyperlipidemia, neoplasms, and CC. A logistic regression analysis of nutritional risk revealed that BMI (OR, 0.906; 95% CI, 0.856-4.636; P = 0.001), albumin level (OR = 0.845; 95% CI, 0.804-0.889; P < 0.001), hemoglobin level (OR = 0.984; 95% CI: 0.973-0.995; P = 0.004), cerebral infarction (OR = 1.788; 95% CI: 1.240-2.579; P = 0.002), neoplasms (OR = 2.90, 95% CI: 1.814-4.636; P < 0.001), and CC (OR = 0.897; 95% CI: 0.856-0.941; P < 0.001) were independent impact factors of nutritional risk (Table 3).
Factors β S.E Wald OR (95% CI) P BMI -0.098 0.029 11.351 0.906 (0.856-4.636) 0.001 Albumin -0.168 0.026 43.225 0.845 (0.804-0.889) < 0.001 Hemoglobin -0.016 0.006 8.346 0.984 (0.973-0.995) < 0.001 Cerebral infarction 0.581 0.187 9.673 1.788 (1.240-2.579) 0.002 Neoplasms 1.065 0.239 19.789 2.900 (1.814-4.636) < 0.001 Calf circumference -0.108 0.024 19.908 0.897 (0.856-0.941) < 0.001 Table 3. Independent Factors for Nutritional Risk by Multivariable Logistic Regression Analysis
The prevalence of nutritional risk in CC quartiles was also compared. The results showed that it increased with a decrease in CC. Patients in the first CC quartile had significantly greater nutritional risk compared with those in other quartiles. Compared with patients in Quartile 4 (reference), those in Quartile 3 (OR = 5.197, 95% CI: 2.999-9.008, P < 0.001), Quartile 2 (OR = 8.559, 95% CI: 4.081-17.953, P < 0.001), and Quartile 1 (OR = 9.281, 95% CI: 4.773-18.473, P < 0.001) had greater nutritional risk (Table 4).
CC OR (95% CI) P Q4 (≥ 33.0) 1 (reference) / Q3 (31.0-33.0) 5.197 (2.999-9.008) < 0.001 Q2 (27.5-31.0) 8.559 (4.081-17.953) < 0.001 Q1 (< 27.5) 9.281 (4.773-18.475) < 0.001 Table 4. Nutritional Risk Prevalence in Different Calf Circumference Quartiles
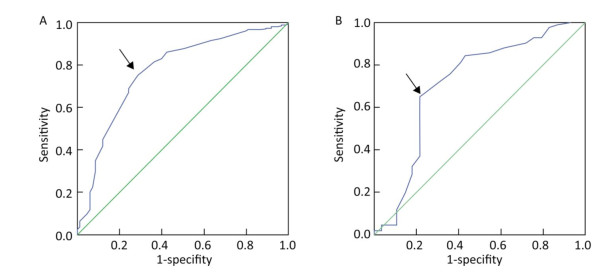
Because CC was an independent correlative factor for nutritional risk, ROC curve analysis was performed to reveal the optimal cutoff point of CC, predicting nutritional risk. In men, the cutoff point was 29.75 cm, the AUC was 0.771 (95% CI: 0.711-0.831, the Youden index at this level was 0.466, and its sensitivity and specificity were 75.5% and 71.1%, respectively. In women, the cutoff point was 28.25 cm, the AUC was 0.715 (95% CI: 0.589-0.840), the Youden index at this level was 0.437, and its sensitivity and specificity were 65.1% and 78.6%, respectively (Figure 1).
Figure 1. ROC curve analysis of CC for nutritional risk. (A) Men: AUC = 0.771 (P < 0.001); 95% CI, 0.711-0.831; identified CC cutoff point = 29.75 cm; Youden index = 0.466; sensitivity, 75.5%; specificity, 71.1%. (B) Women: AUC = 0.715 (P < 0.001), 95% CI, 0.589-0.840; identified CC cutoff point = 28.25 cm, Youden index = 0.437; sensitivity, 65.1%; specificity, 78.6%.
-
In this single-center, cross-sectional, observational, retrospective study, we provided evidence that CC can predict nutritional risk in hospitalized patients aged ≥ 80 years. CC values were significantly lower in patients with nutritional risk patients compared to those without nutritional risk. CC was negatively correlated with nutritional risk. CC was an independent impact factor of nutritional risk, and nutritional risk increased with a decrease in CC. The best CC cutoff point for predicting nutritional risk was 29.75 cm in men and 28.25 in women.
According to previous studies, the prevalence of malnutrition among hospitalized elderly patients shows an increasing trend. In Asia, 16%-78% of hospitalized elderly patients were malnourished (including those at risk of malnutrition) between 2005 and 2012[12]. China is one of the most rapidly aging societies in the world. The life expectancy of Chinese residents has increased to 76.2 years, which is 4.4 years higher than the international average[13]. As the country's population has continued to age, in China, the elderly population aged > 60 years accounted for 17.3% of the total population in 2017. In our study, the proportion of nutritional risk, as defined by a NRS-2002 score ≥ 3, was 38.82%. Determining the nutritional status and providing nutritional support are the responsibilities of physicians.
Failure to recognize malnutrition and lack of awareness have resulted in its high prevalence, which leads to poor identification, documentation, and intervention for combating malnutrition, causing prolonged hospitalization due to delayed recovery of elderly patients. Nutrition assessment is a process of obtaining, verifying, and interpreting the data needed to determine the nutrition-related problems, their causes, and significance. However, a nutrition assessment based on these tools could be a complex process because they often involve assessment of nutritional intake, changes in body composition, and signs or symptoms of nutritional deficiency. The measurement of anthropometric parameters is a noninvasive, cost-effective method to evaluate the health and nutritional status of elderly individuals. Various skeletal changes that occur during the aging process preclude the use of height in BMI derivation. A systematic review of studies comparing self-reported and measured height found an overall tendency to overestimate height, with studies reporting mean differences of up to 7.5 cm[14]. CC is highly accessible and easy to measure and is better than BMI in reflecting muscle loss of the lower extremities that occurs with aging or decreased physical activity. This alternate anthropometric measure makes assessment more user-friendly, fast, and easy to use in the field. Furthermore, CC can be measured even in the lying down position and hence can be used in bedridden patients.
A close relationship between CC and whole-body muscle mass has been reported[8]. The muscle is a metabolic tissue and endocrine organ, and the development of muscle mass releases several endocrine factors called myokines[15-17]. Some myokines may be involved in mediating the inflammation process and have an anti-inflammatory effect[18]. In a Japanese study with 526 participants, CC was positively correlated with appendicular skeletal muscle mass and skeletal muscle index and associated with the diagnosis of sarcopenia[19]. In a previous study, CC was found to have a positive association with functional performance and negative association with risk of mortality and frailty index in the elderly population[20]. Low CC was associated with slow walking speed in the South American elderly population[21]. In the Taiwan Longitudinal Survey on Aging study including 2, 521 participants, compared to BMI, CC has better ability to predict emerging care need in older people in Taiwan of China[22].
In clinical practice, blood diagnostics also has the advantage of ensuring immediate nutrition assessment and prompt intervention in patients who are malnourished or at risk of malnutrition. Protein markers, such as albumin and prealbumin, were once the standard blood biomarkers in diagnosing malnutrition during hospital admissions. In our study, we found that albumin and protein levels were significantly lower in patients with nutritional risk compared to those without nutritional risk. Moreover, CC was also positively associated with hemoglobin, albumin, prealbumin, and serum iron levels. Disease-associated malnutrition, if underrecognized, could cause significant economic burden[23]. In our study, CC was negatively correlated with the prevalence of cerebral infarction, COPD, and diabetes.
There are several limitations of this study. First, it was a retrospective observational analysis of the database, which was collected at a single time point, rather than a long-term repeated observation. The direction of association may not be determined through a retrospective observational analysis. Second, the investigated population was relatively small with limited ethnicity. Lastly, several other confounding influencing factors on nutritional risk were not excluded.
Therefore, based on previous studies, the prevalence of nutritional risk in hospitalized elderly patients shows an increasing trend worldwide. Underdiagnosis of malnutrition may be the root cause of this problem. CC is a valid anthropometric measure to predict nutritional risk in hospitalized patients aged ≥ 80 years.
-
The authors declare no conflict of interest.
-
This project was not funded by any organization.

 Quick Links
 DownLoad: