

-
With economic development and rapid lifestyle transitions, as well as the epidemics of obesity and type 2 diabetes, the unexpected growing prevalence of nonalcoholic fatty liver disease (NAFLD) has now become a great health threat worldwide, including China. From 2008 to 2018, the prevalence of NAFLD in China has increased from 18% to 29.2%, and the number increased at nearly twice the rate as in the Western countries[1]. NAFLD indicates a clinical-pathologic spectrum of histopathological conditions, ranging from simple steatosis to nonalcoholic steatohepatitis with varying stages of fibrosis and cirrhosis[2]. Several studies have proven that the progression of liver fibrosis is an important predictor of all-cause and cause-specific mortality, such as cardiovascular mortality in NAFLD patients[3,4]. Early identification of preventive risk factors associated with fibrosis progression plays a pivotal role to reduce disease-specific mortality in NAFLD patients.
Liver biopsy is the gold standard to confirm the severity of liver fibrosis; however, quick and noninvasive evaluation and quantification for fibrosis progression are more widely used in population-based epidemiological studies, such as NAFLD fibrosis score (NFS)[2]. A previous study from the National Health and Nutrition Examination Survey (NHANES) showed that liver fibrosis indicated by NFS was highly associated with cardiovascular mortality among NAFLD patients[5].
Peripheral artery disease (PAD) is a distinct atherosclerosis characterized by artery stenosis or artery occlusion[6]. It has been reported that there was an increased risk of atherosclerosis in NAFLD patients[7] and that those with advanced fibrosis (AF) had a 29% increased risk of atherosclerosis[8]. Previous studies demonstrated that the severest form of NAFLD including fibrosis progression and PAD shared many common metabolic dysfunctions and risk factors[2,9,10]. However, the association of PAD with the risk of histological severity of NAFLD, the progression of liver fibrosis, was less elucidated.
In this current study, we performed a longitudinal study to evaluate the association between PAD and risk of fibrosis deterioration in NAFLD patients in a community-dwelling Chinese population. PAD was defined as an ankle-brachial index (ABI) of either < 0.90 or > 1.40[11]. We assessed the probability of AF by NFS, and fibrosis deterioration was defined as the NFS status increased to a higher category at the follow-up visit.
-
Participants in this study were from an average of 4.3 years’ follow-up cohort of middle-aged and elderly Chinese in Jiading district, Shanghai, which was reported previously[7]. Briefly, from March to August 2010, 10,375 participants aged 40 years or older who underwent a comprehensive health examination were recruited at baseline. Between August 2014 and May 2015, all the participants were invited to attend a follow-up examination, including detailed anthropometry, biochemical measurements, and blood sampling, to evaluate the longitudinal changes of the participants’ health status.
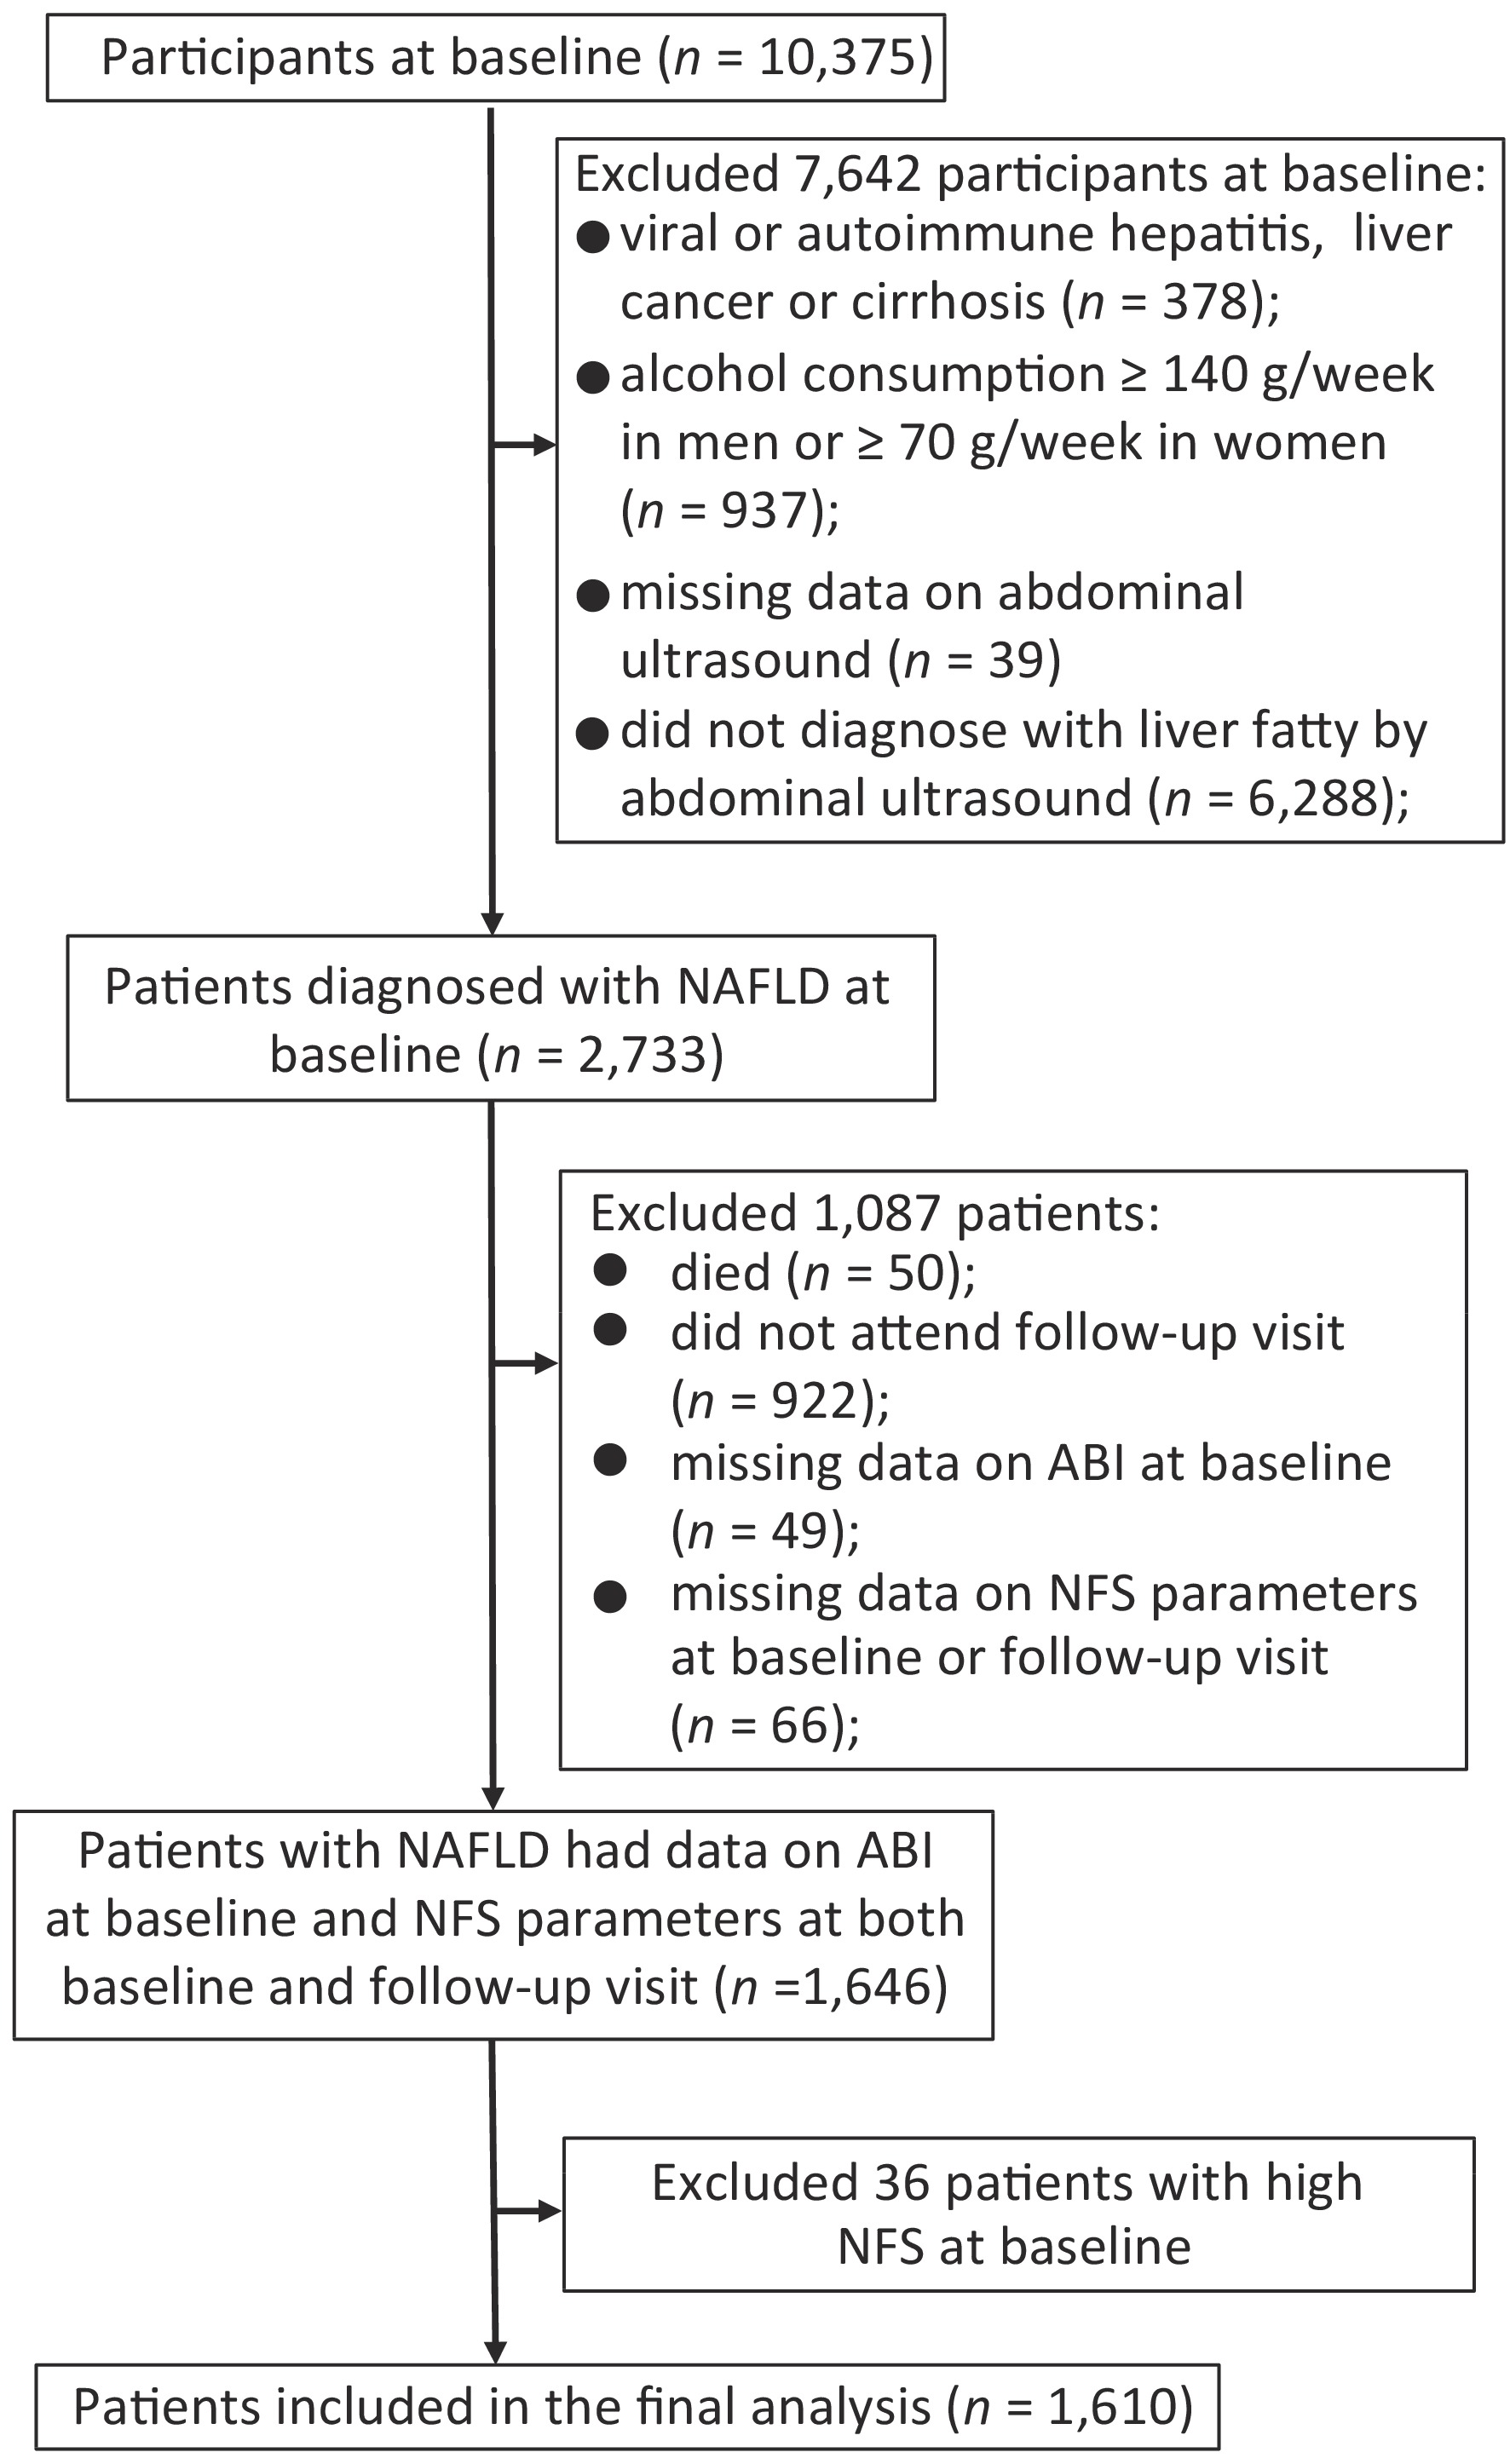
Since NAFLD was a diagnosis of exclusion, we excluded participants for the following criteria at baseline: viral or autoimmune hepatitis, liver cancer or cirrhosis (n = 378), alcohol consumption ≥ 140 g/week in men or ≥ 70 g/week in women (n = 937), missing data on abdominal ultrasound (n = 39), or without fatty liver diagnosed by abdominal ultrasound (n = 6,288). Among 2,733 patients diagnosed with NAFLD at baseline, 50 died during follow-up, and 922 did not attend the follow-up visit. Those with missing data on ABI at baseline (n = 49) and components of NFS including age, height, weight, fasting plasma glucose, aspartate aminotransferase (AST), alanine aminotransferase (ALT), serum albumin, platelet counts (PLT) at baseline or follow-up visit (n = 66) were also excluded. To evaluate the association of PAD at baseline with the following fibrosis deterioration, we further excluded those who were already with high NFS at baseline (n = 36). Finally, a total of 1,610 patients were included for analysis (Figure 1).
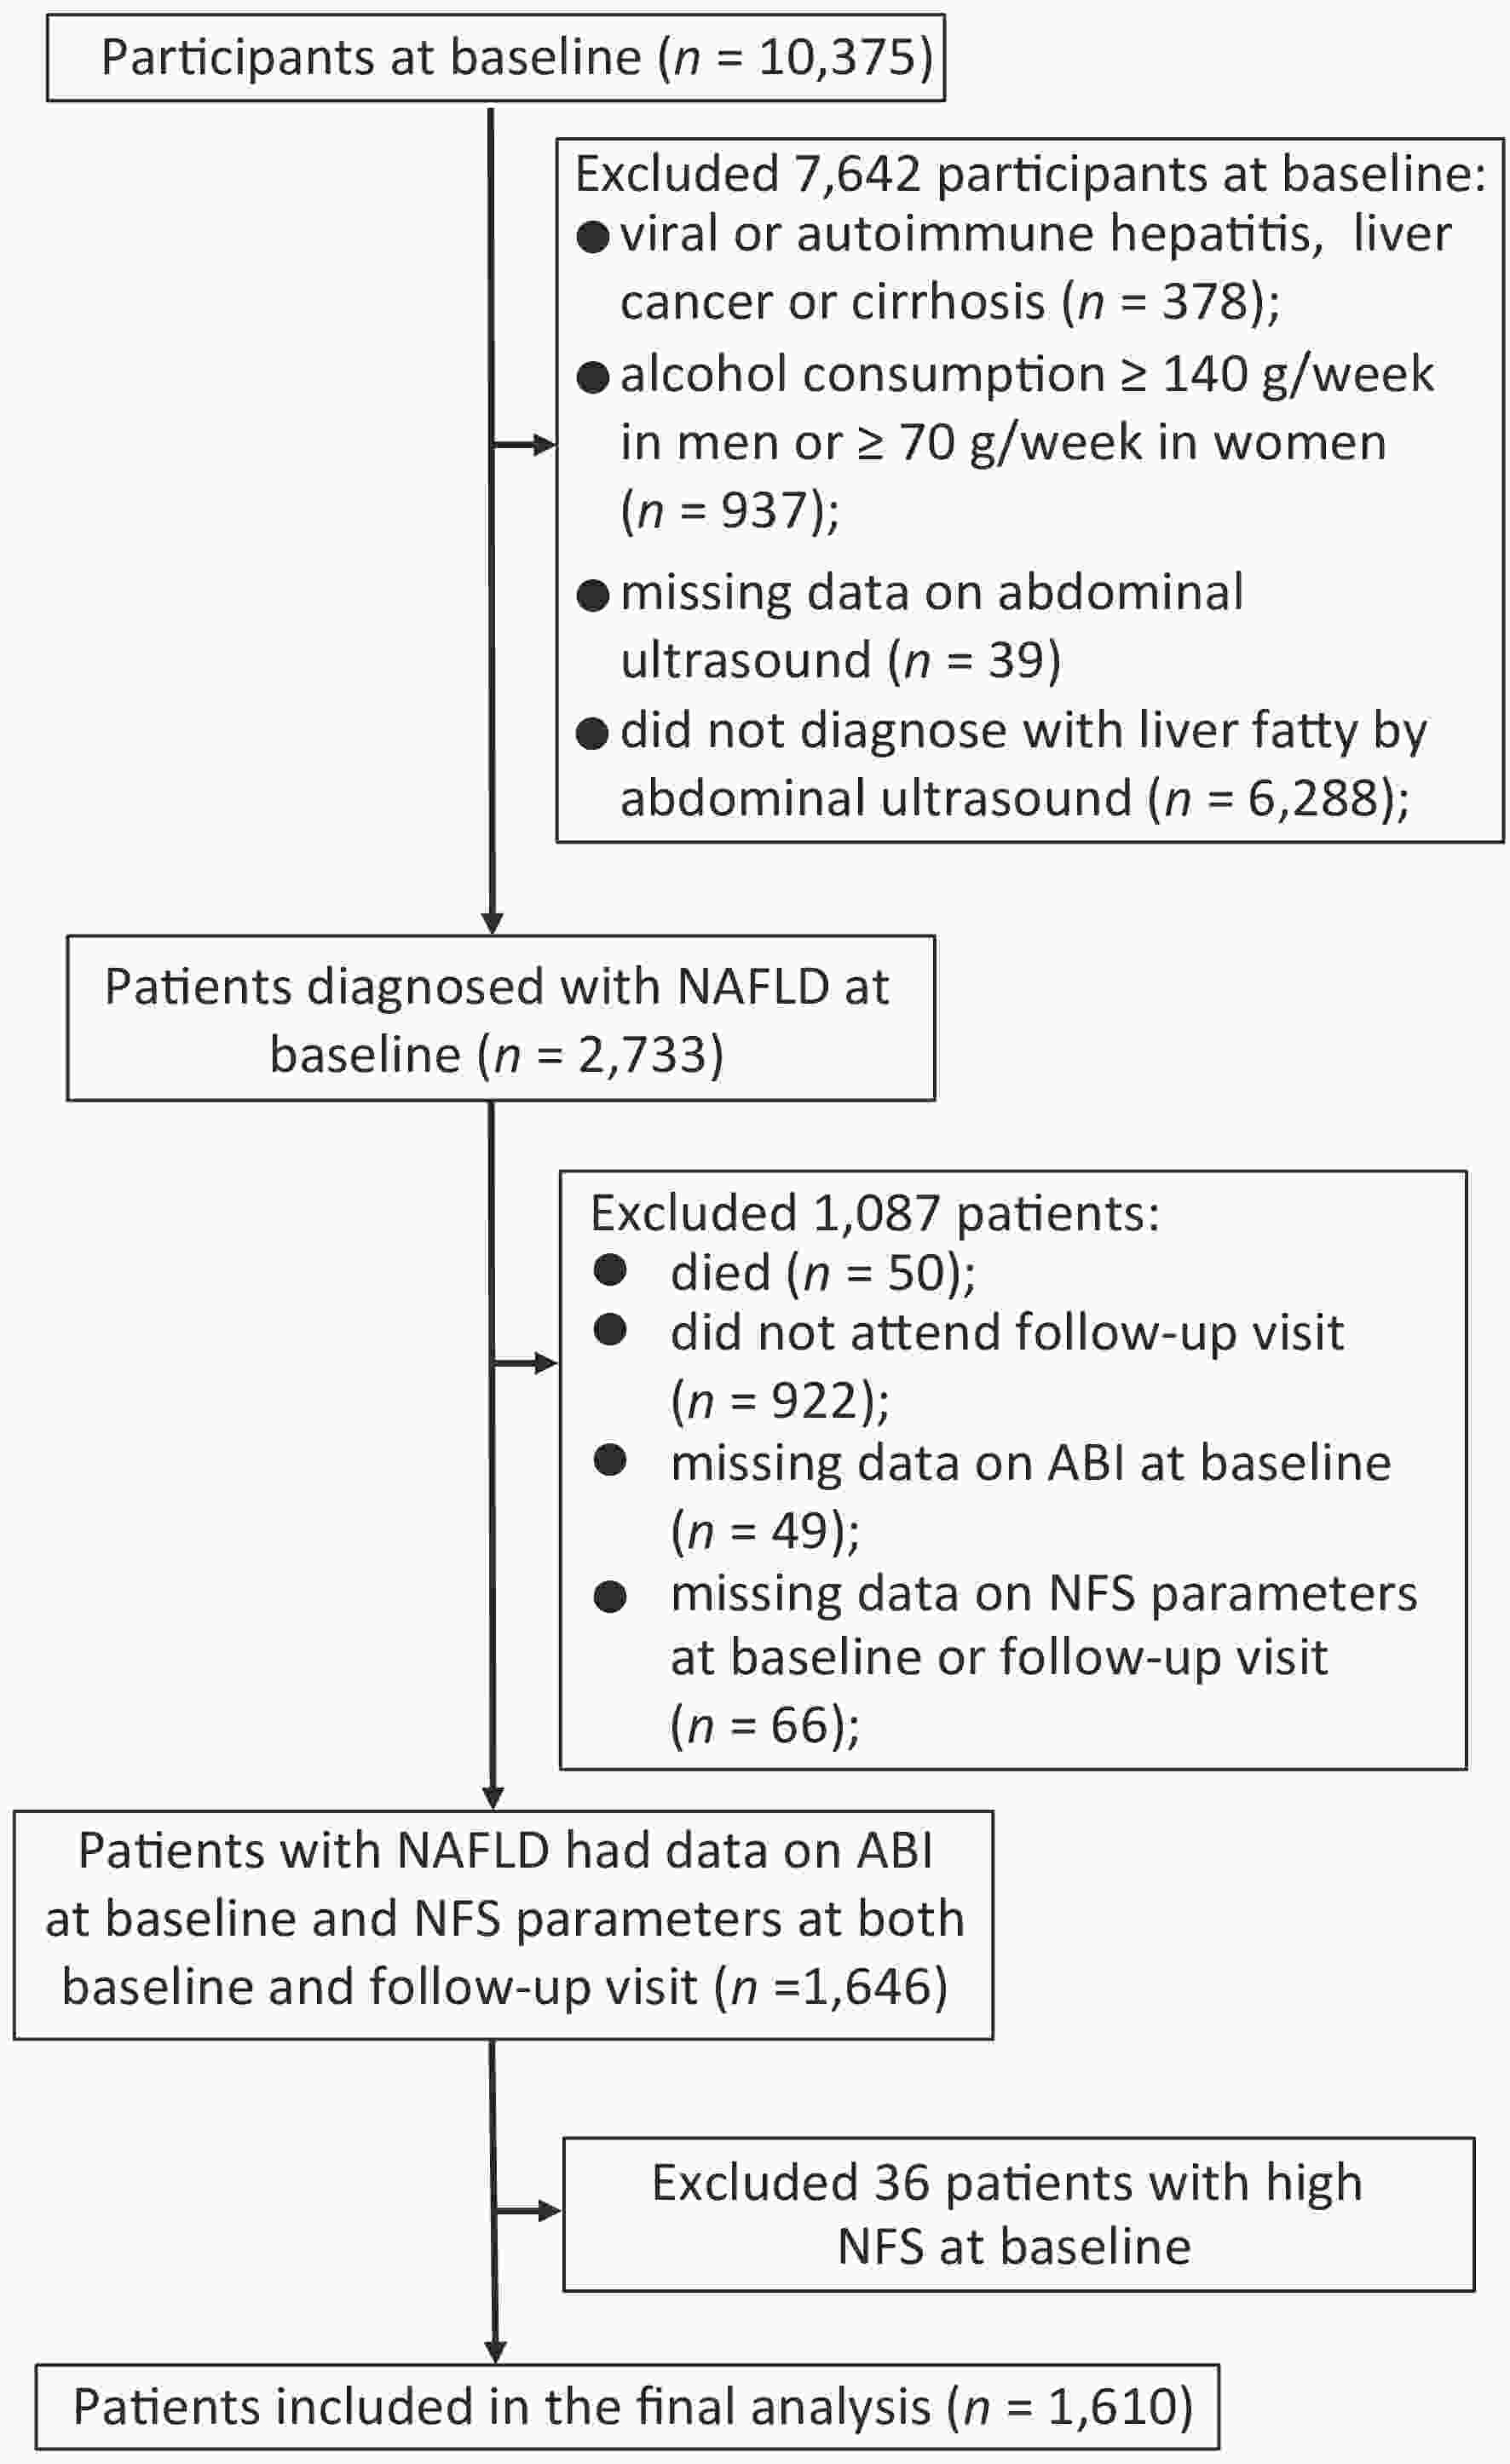
Figure 1. Flowchart of the study population. Abbreviation: NAFLD, nonalcoholic fatty liver disease; ABI, ankle-brachial index; NFS, NAFLD fibrosis score.
The Institutional Review Board on human research at Rui-Jin Hospital, Shanghai Jiao Tong University School of Medicine approved this study. All participants provided their written consent.
-
Body height, weight, waist circumference (WC), and blood pressure were measured by trained nurses as previously described[7]. Body mass index (BMI) was calculated as weight (kg) divided by the square of height (m).
Venous blood samples were collected after an overnight fast at both baseline and follow-up visit. A standard 75-g oral glucose tolerance test was conducted to collect blood samples at two points (0 and 2 h). Fasting glucose and 2-h post-loading plasma glucose were measured with the use of the glucose oxidize method on an auto-analyzer (Modular P800; Roche, Basel, Switzerland). Serum insulin was measured by using an electrochemiluminescence assay (Modular E170, Roche, Basel, Switzerland). Serum total cholesterol, triglyceride (TG), high-density lipoprotein (HDL) cholesterol, low-density lipoprotein (LDL) cholesterol, AST, ALT, gamma-glutamyl transpeptidase, and serum albumin were measured on the auto-analyzer (Modular E170, Roche, Basel, Switzerland) using chemiluminescence method. White blood cells (WBC) and PLT were measured on an automated cell counter (Hematology analyzer 120, ABX, France).
Diabetes was defined as fasting plasma glucose ≥ 7.0 mmol/L, 2-h plasma glucose ≥ 11.1 mmol/L, or current use of insulin or antidiabetic medications. Hypertension was defined as systolic blood pressure (SBP) ≥ 140 mmHg, diastolic blood pressure ≥ 90 mmHg, or current use of antihypertensive medications. Central obesity was defined as WC ≥ 90 cm in men and ≥ 80 cm in women. Homeostasis model assessment of insulin resistance (HOMA-IR) for quantifying IR was calculated according to the following formula: [fasting plasma glucose (mmol/L) × fasting insulin (μIU/mL)]/22.5[12]. IR was defined as HOMA-IR ≥ 2.5[12].
-
Fatty liver was diagnosed using abdominal ultrasonography based on at least two of three abnormal findings: (1) diffusely increased echogenicity of the liver relative to the kidney or spleen, (2) attenuation of the ultrasound beam, or (3) poor visualization of intrahepatic structures. The definition of NAFLD was the presence of fatty liver in the absence of excessive alcohol use or other known liver diseases[2].
To evaluate the probability of AF in NAFLD patients, NFS as a noninvasive index of liver fibrosis was used. NFS was calculated according to the following published formula: NFS = −1.675 + 0.037 × age (years) + 0.094 × BMI (kg/m2) + 1.13 × impaired fasting glycaemia or diabetes (yes = 1, no = 0) + 0.99 × AST/ALT ratio − 0.013 × platelet (×109/L) − 0.66 × serum albumin (g/dL). Two cutoff points were selected to categorize patients with NAFLD into three groups, including those with high probability (NFS > 0.676), intermediate probability (NFS = −1.455 to 0.676), and low probability (NFS < −1.455) of AF[13].
-
ABI was the most common measurement of screening for PAD. After a 10–15 min rest, patients were measured by a fully automatic arteriosclerosis diagnosis device (Colin VP-1000, Model BP203RPE II, form PWV/ABI, Japan) in a supine position. ABI was calculated by dividing the highest SBP measurements obtained at the ankle by the highest SBP measurements obtained at the brachial artery[11]. Those with an ABI of < 0.90 or > 1.40 at either side were diagnosed with PAD[11].
-
Baseline characteristics of the participants according to ABI categories were presented as mean ± standard deviation (SD) or median (interquartile range) for continuous variables and number (percentage) for categorical variables.
If a patient’s NFS status increased to a higher category during follow-up, the case was assumed to develop fibrosis deterioration. When stratified by baseline NFS status, fibrosis deterioration status was divided into two groups: progression from low to intermediate or high NFS and progression from intermediate to high NFS. Multiple logistic regression analysis was performed to investigate the association of PAD with the risk of fibrosis deterioration. Potential confounders for adjustments included age (years), sex, and baseline NFS in Model 1. Model 2 further adjusted for central obesity, physical activity, current smoking, current drinking, diabetes, hypertension, TG, HDL cholesterol, LDL cholesterol, and WBC. Model 3 further adjusted for HOMA-IR.
We performed stratified analyses according to age (< 65 and ≥ 65 years), sex (men and women), central obesity, current smoking, hypertension, diabetes, HOMA-IR (< 2.5 and ≥ 2.5), and WBC (< 6.0 and ≥ 6.0 × 10⁹/L). We tested the multiplicative interaction between PAD and IR on the association with fibrosis deterioration by putting PAD, IR, and IR × PAD in the model simultaneously, after adjustments for age, sex, baseline NFS, central obesity, physical activity, current smoking, current drinking, hypertension, TG, HDL cholesterol, LDL cholesterol, and WBC.
We further assessed the joint effect of PAD and IR on fibrosis deterioration by multiple logistic regression analyses after the same adjustments as above. For this analysis, the patients were divided into the following four groups: (1) with neither PAD nor IR (the reference group), (2) without PAD but with IR, (3) with PAD but without IR, and (4) with both PAD and IR.
Statistical analyses were carried out using SAS version 9.4 (SAS Institute Inc, Cary, NC, USA). A two-sided P-value of < 0.05 was considered statistically significant.
-
Baseline characteristics were similar between the two groups according to the ABI category, except that those with PAD (ABI < 0.90 or > 1.40) were more likely to have higher levels of BMI and WBC than those with the normal range of ABI (0.90–1.40; Table 1). The mean ± SD values for NFS were −1.77 ± 1.13 for all the study patients at baseline, −1.69 ± 1.18 for those with an ABI of < 0.90 or > 1.40, and −1.78 ± 1.12 for those with the normal range of ABI.
Characteristics ABI P value 0.90–1.40 < 0.90 or > 1.40 Number 1,486 124 Age (years) 58.0 ± 8.0 57.5 ± 8.5 0.51 Men [n (%)] 453 (30.48) 43 (34.68) 0.33 Current smoker [n (%)] 221 (14.87) 21 (16.93) 0.52 Current drinker [n (%)] 40 (3.36) 5 (4.03) 0.39 Hypertension [n (%)] 1,111 (74.81) 85 (68.55) 0.13 Diabetes [n (%)] 494 (33.24) 40 (32.26) 0.82 Physical activity* (MET-h/week) 23.1 (0, 69.3) 23.1 (4.1, 74.2) 0.50 BMI (kg/m2) 27.4 ± 2.9 28.3 ± 3.3 0.002 WC (cm) 88.5 ± 7.6 89.5 ± 8.6 0.15 SBP (mmHg) 146.6 ± 18.9 145.1 ± 19.2 0.40 Diastolic blood pressure (mmHg) 85.7 ± 10.2 86.3 ± 10.6 0.56 Fasting plasma glucose (mmol/L) 6.08 ± 1.96 6.12 ± 2.24 0.81 Triglycerides* (mmol/L) 1.85 (1.35, 2.59) 1.99 (1.41, 2.66) 0.47 Total cholesterol (mmol/L) 5.52 ± 1.10 5.46 ± 1.05 0.59 HDL cholesterol (mmol/L) 1.21 ± 0.26 1.19 ± 0.29 0.37 LDL cholesterol (mmol/L) 3.32 ± 0.91 3.26 ± 0.85 0.44 Albumin (g/L) 49.13 ± 2.23 48.94 ± 2.50 0.35 ALT* (U/L) 23.1 (17.4, 33.3) 24.4 (17.5, 34.8) 0.66 AST* (U/L) 22.3 (19.0, 27.3) 22.5 (18.7, 27.1) 0.86 GGT* (U/L) 28 (20, 44) 31 (21, 41) 0.60 White blood cell (×109/L) 6.13 ± 1.47 6.55 ± 1.46 0.002 HOMA-IR* 2.62 (1.81, 3.84) 2.61 (1.82, 3.63) 0.90 NFS −1.78 ± 1.12 −1.69 ± 1.18 0.40 Note. Data are presented as mean ± SD, median (interquartile range), or number (percentage). P-values were calculated by one-way analysis of variance for continuous variables and chi-square test for categorical variables. *Variables were log-transformed before analysis. Abbreviations: ABI, ankle-brachial index; BMI, body mass index; WC, waist circumference; MET, metabolic equivalent; SBP; systolic blood pressure; HDL, high-density lipoprotein; LDL, low-density lipoprotein; ALT, alanine aminotransferase; AST, aspartate aminotransferase; GGT, gamma-glutamyl transpeptidase; HOMA-IR, homeostasis model assessment of insulin resistance; NAFLD, nonalcoholic fatty liver disease; NFS, NAFLD fibrosis score. Table 1. Baseline characteristics of NAFLD patients according to ABI category
-
Table 2 shows the association of PAD with the risk of fibrosis deterioration. The mean ± SD value for NFS at follow-up was −0.91 ± 1.12. Of all the 1,610 NAFLD patients at baseline, 618 (38%) patients developed fibrosis deterioration. When stratified by baseline NFS status, 494 patients progressed from low to intermediate or high and 124 from intermediate to high.
Fibrosis deterioration PAD No. events / participants Model 1 Model 2 Model 3 OR (95% CI) P OR (95% CI) P OR (95% CI) P Total No 561/1,486 1.00 0.01 1.00 0.003 1.00 0.003 Yes 57/124 1.69 (1.12, 2.56) 1.93 (1.25, 2.98) 1.92 (1.24, 2.98) Intermediate to high No 108/577 1.00 0.03 1.00 0.03 1.00 0.03 Yes 16/52 2.19 (1.10, 4.35) 2.27 (1.06, 4.84) 2.24 (1.05, 4.80) Low to intermediate or high No 453/909 1.00 0.14 1.00 0.04 1.00 0.04 Yes 41/72 1.47 (0.89, 2.44) 1.72 (1.00, 2.94) 1.74 (1.02, 3.00) Note. Data are presented as OR and 95% CI.
Model 1 was adjusted for age, sex, and baseline nonalcoholic fatty liver disease fibrosis score.
Model 2 was further adjusted for central obesity, physical activity, current smoking, current drinking, diabetes, hypertension, triglycerides, HDL cholesterol, LDL cholesterol, and white blood cell based on Model 1.
Model 3 was further adjusted for the homeostasis model assessment of IR based on Model 2.
Abbreviation: PAD, peripheral artery disease; IR, insulin resistance; HDL, high-density lipoprotein; LDL, low-density lipoprotein.Table 2. Association of PAD with risk of fibrosis deterioration
As compared with the normal range of ABI, those with an ABI of < 0.90 or > 1.40 were associated with a 69% increased risk of fibrosis deterioration (95% CI: 1.12, 2.56) after adjustments for age, sex, and baseline NFS (Model 1). Further adjusting for conventional metabolic risk factors (Model 2) did not substantially change the results (OR = 1.93, 95% CI: 1.25, 2.98, P = 0.003). To explore whether IR mediated the association, further analysis was performed with adjustments for HOMA-IR (Model 3), and the results slightly decreased but remained significant (OR = 1.92, 95% CI: 1.24, 2.98, P = 0.003).
Then, we grouped the fibrosis deterioration status by baseline NFS category (Table 2). There was a 1.47-fold (95% CI: 0.89, 2.44) increased risk of progression from low to intermediate or high NFS and a 2.19-fold (95% CI: 1.10, 4.35) increased risk of progression from intermediate to high. The results did not change appreciably in Model 2 (low NFS at baseline: OR = 1.72, 95% CI: 1.00, 2.94, P = 0.04; intermediate NFS at baseline: OR = 2.27, 95% CI: 1.06, 4.84, P = 0.03). For further adjustments for HOMA-IR (Model 3), the associations were statistically significant (low NFS at baseline: OR = 1.74, 95% CI: 1.02, 3.00, P = 0.04; intermediate NFS at baseline: OR = 2.24, 95% CI: 1.05, 4.80, P = 0.03).
-
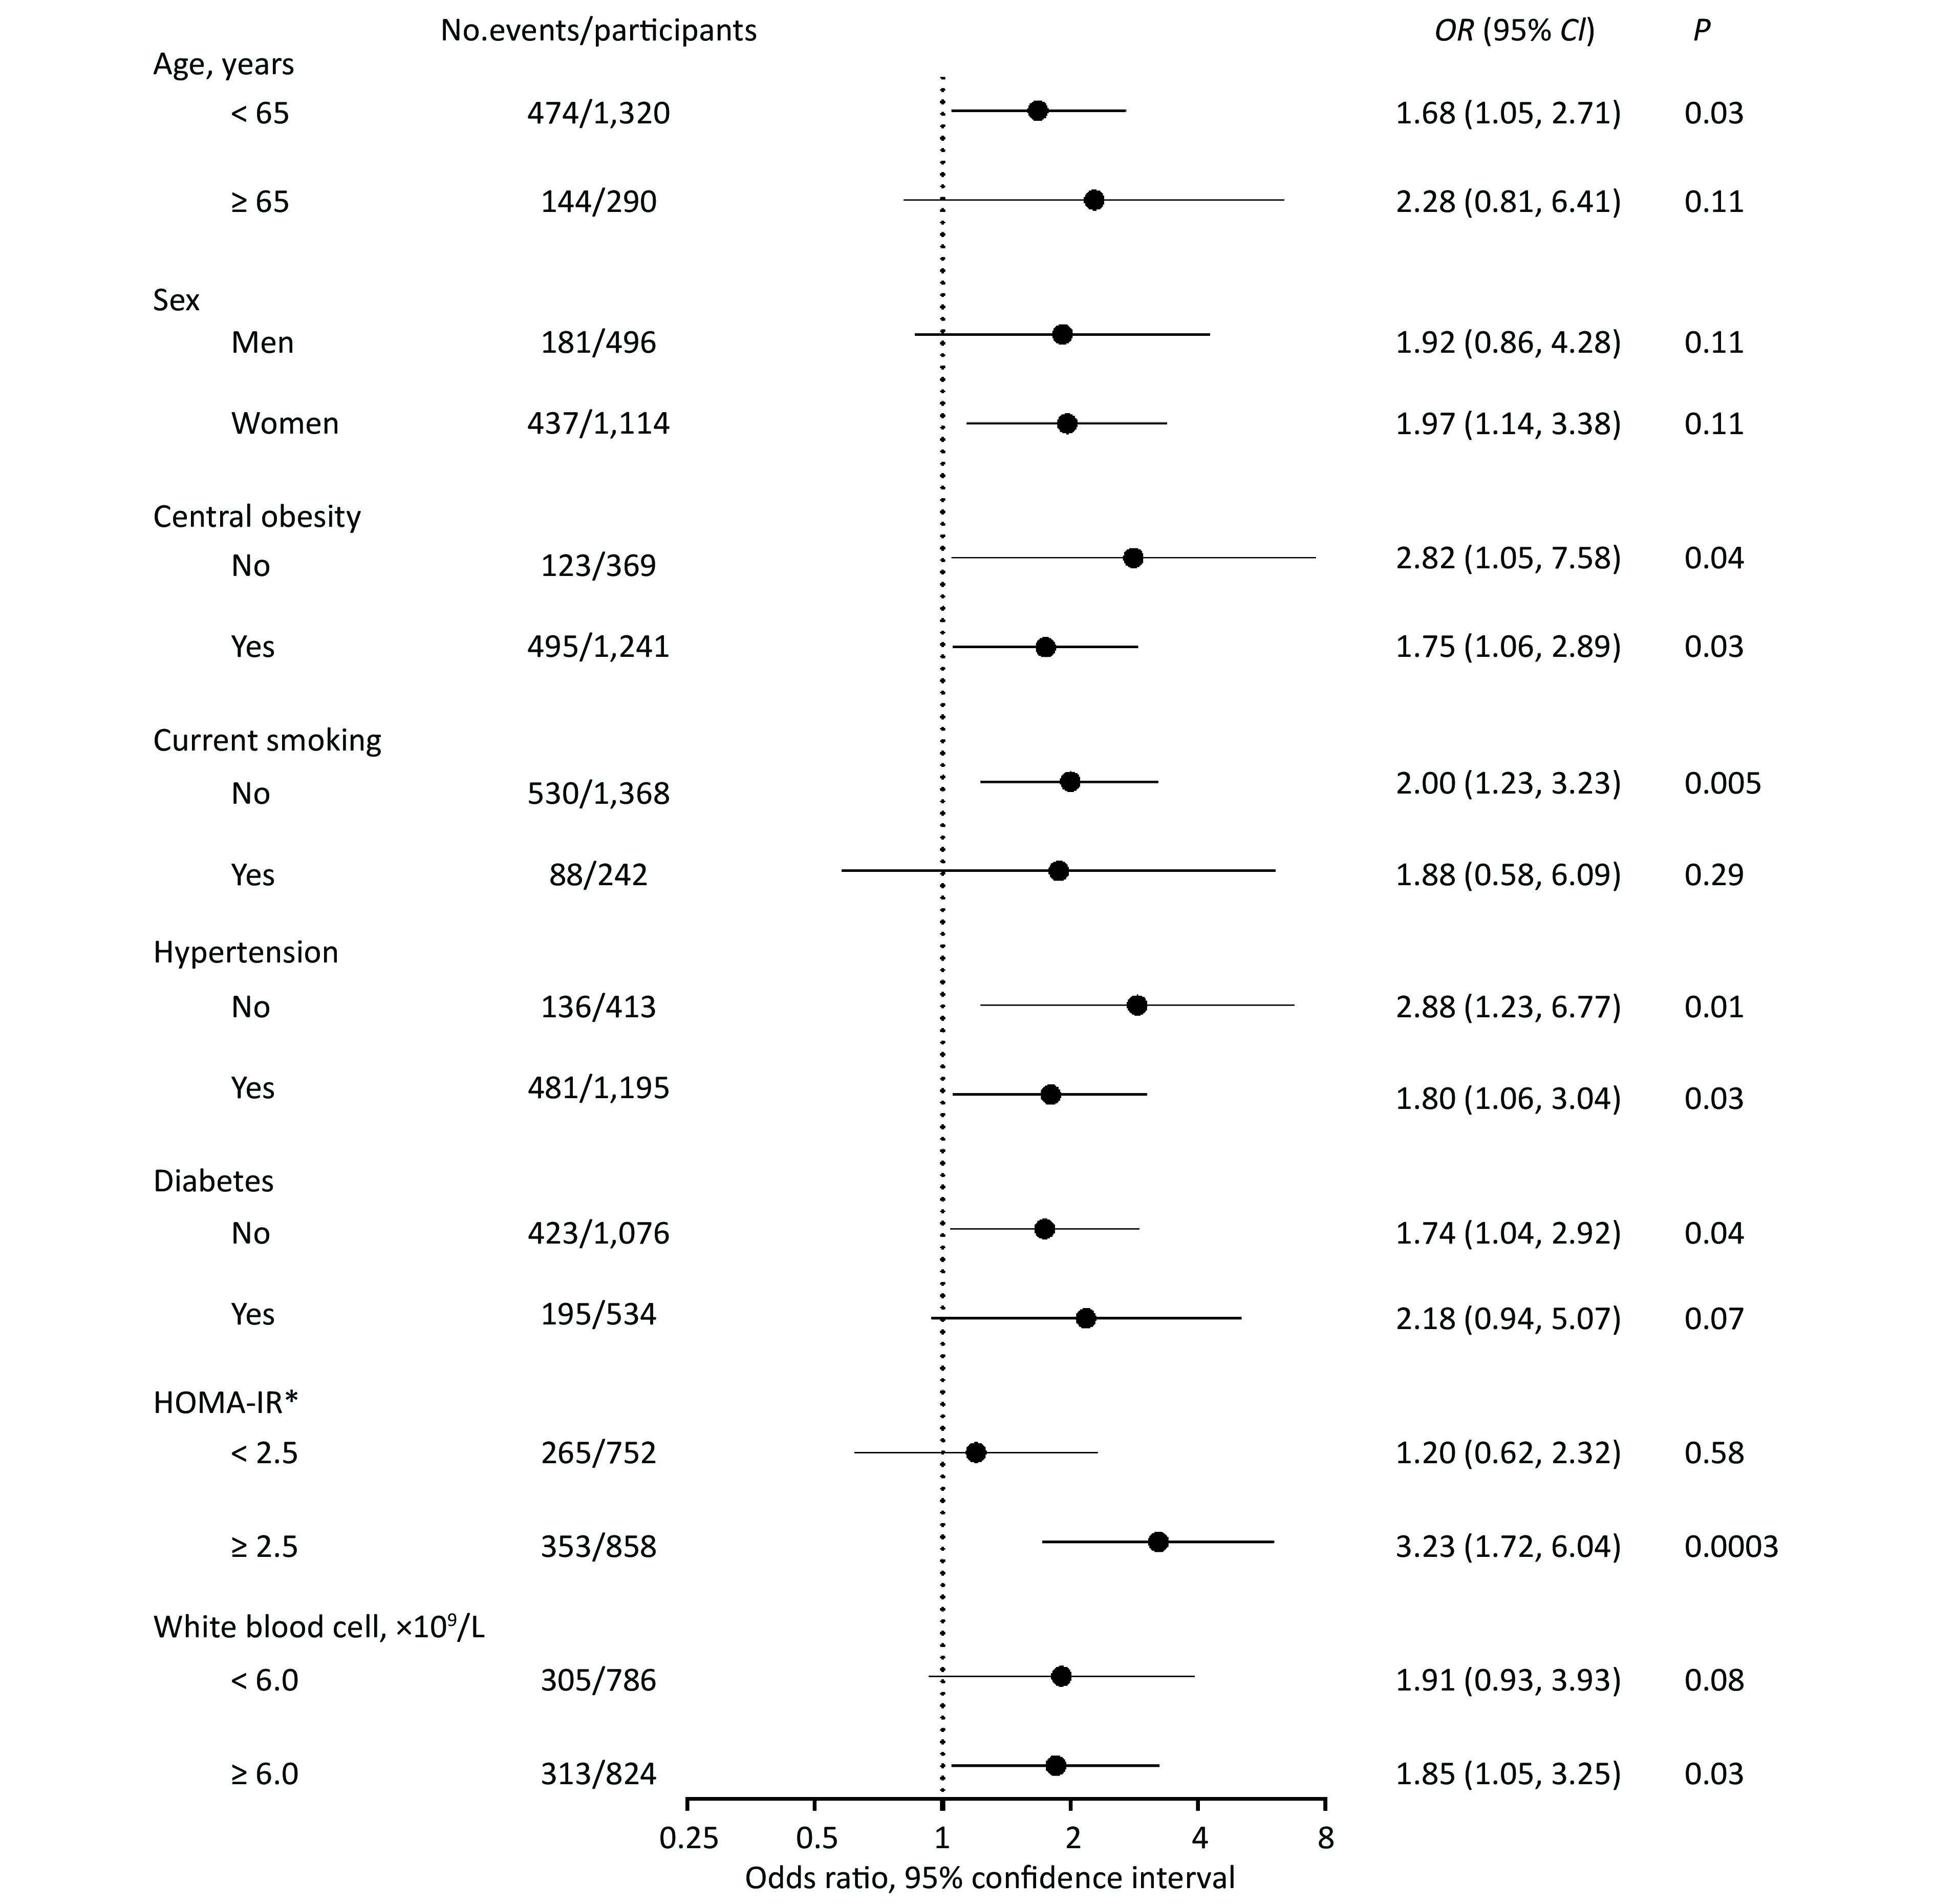
In stratified analyses, the risk of fibrosis deterioration with PAD remarkably increased among patients with IR (OR = 3.23, 95% CI: 1.72, 6.04, P = 0.0003), whereas no association was found among those without IR (OR = 1.20, 95% CI: 0.62, 2.32, P = 0.58). There was a significant multiplicative interaction between PAD and IR (P for interaction = 0.03; Figure 2).
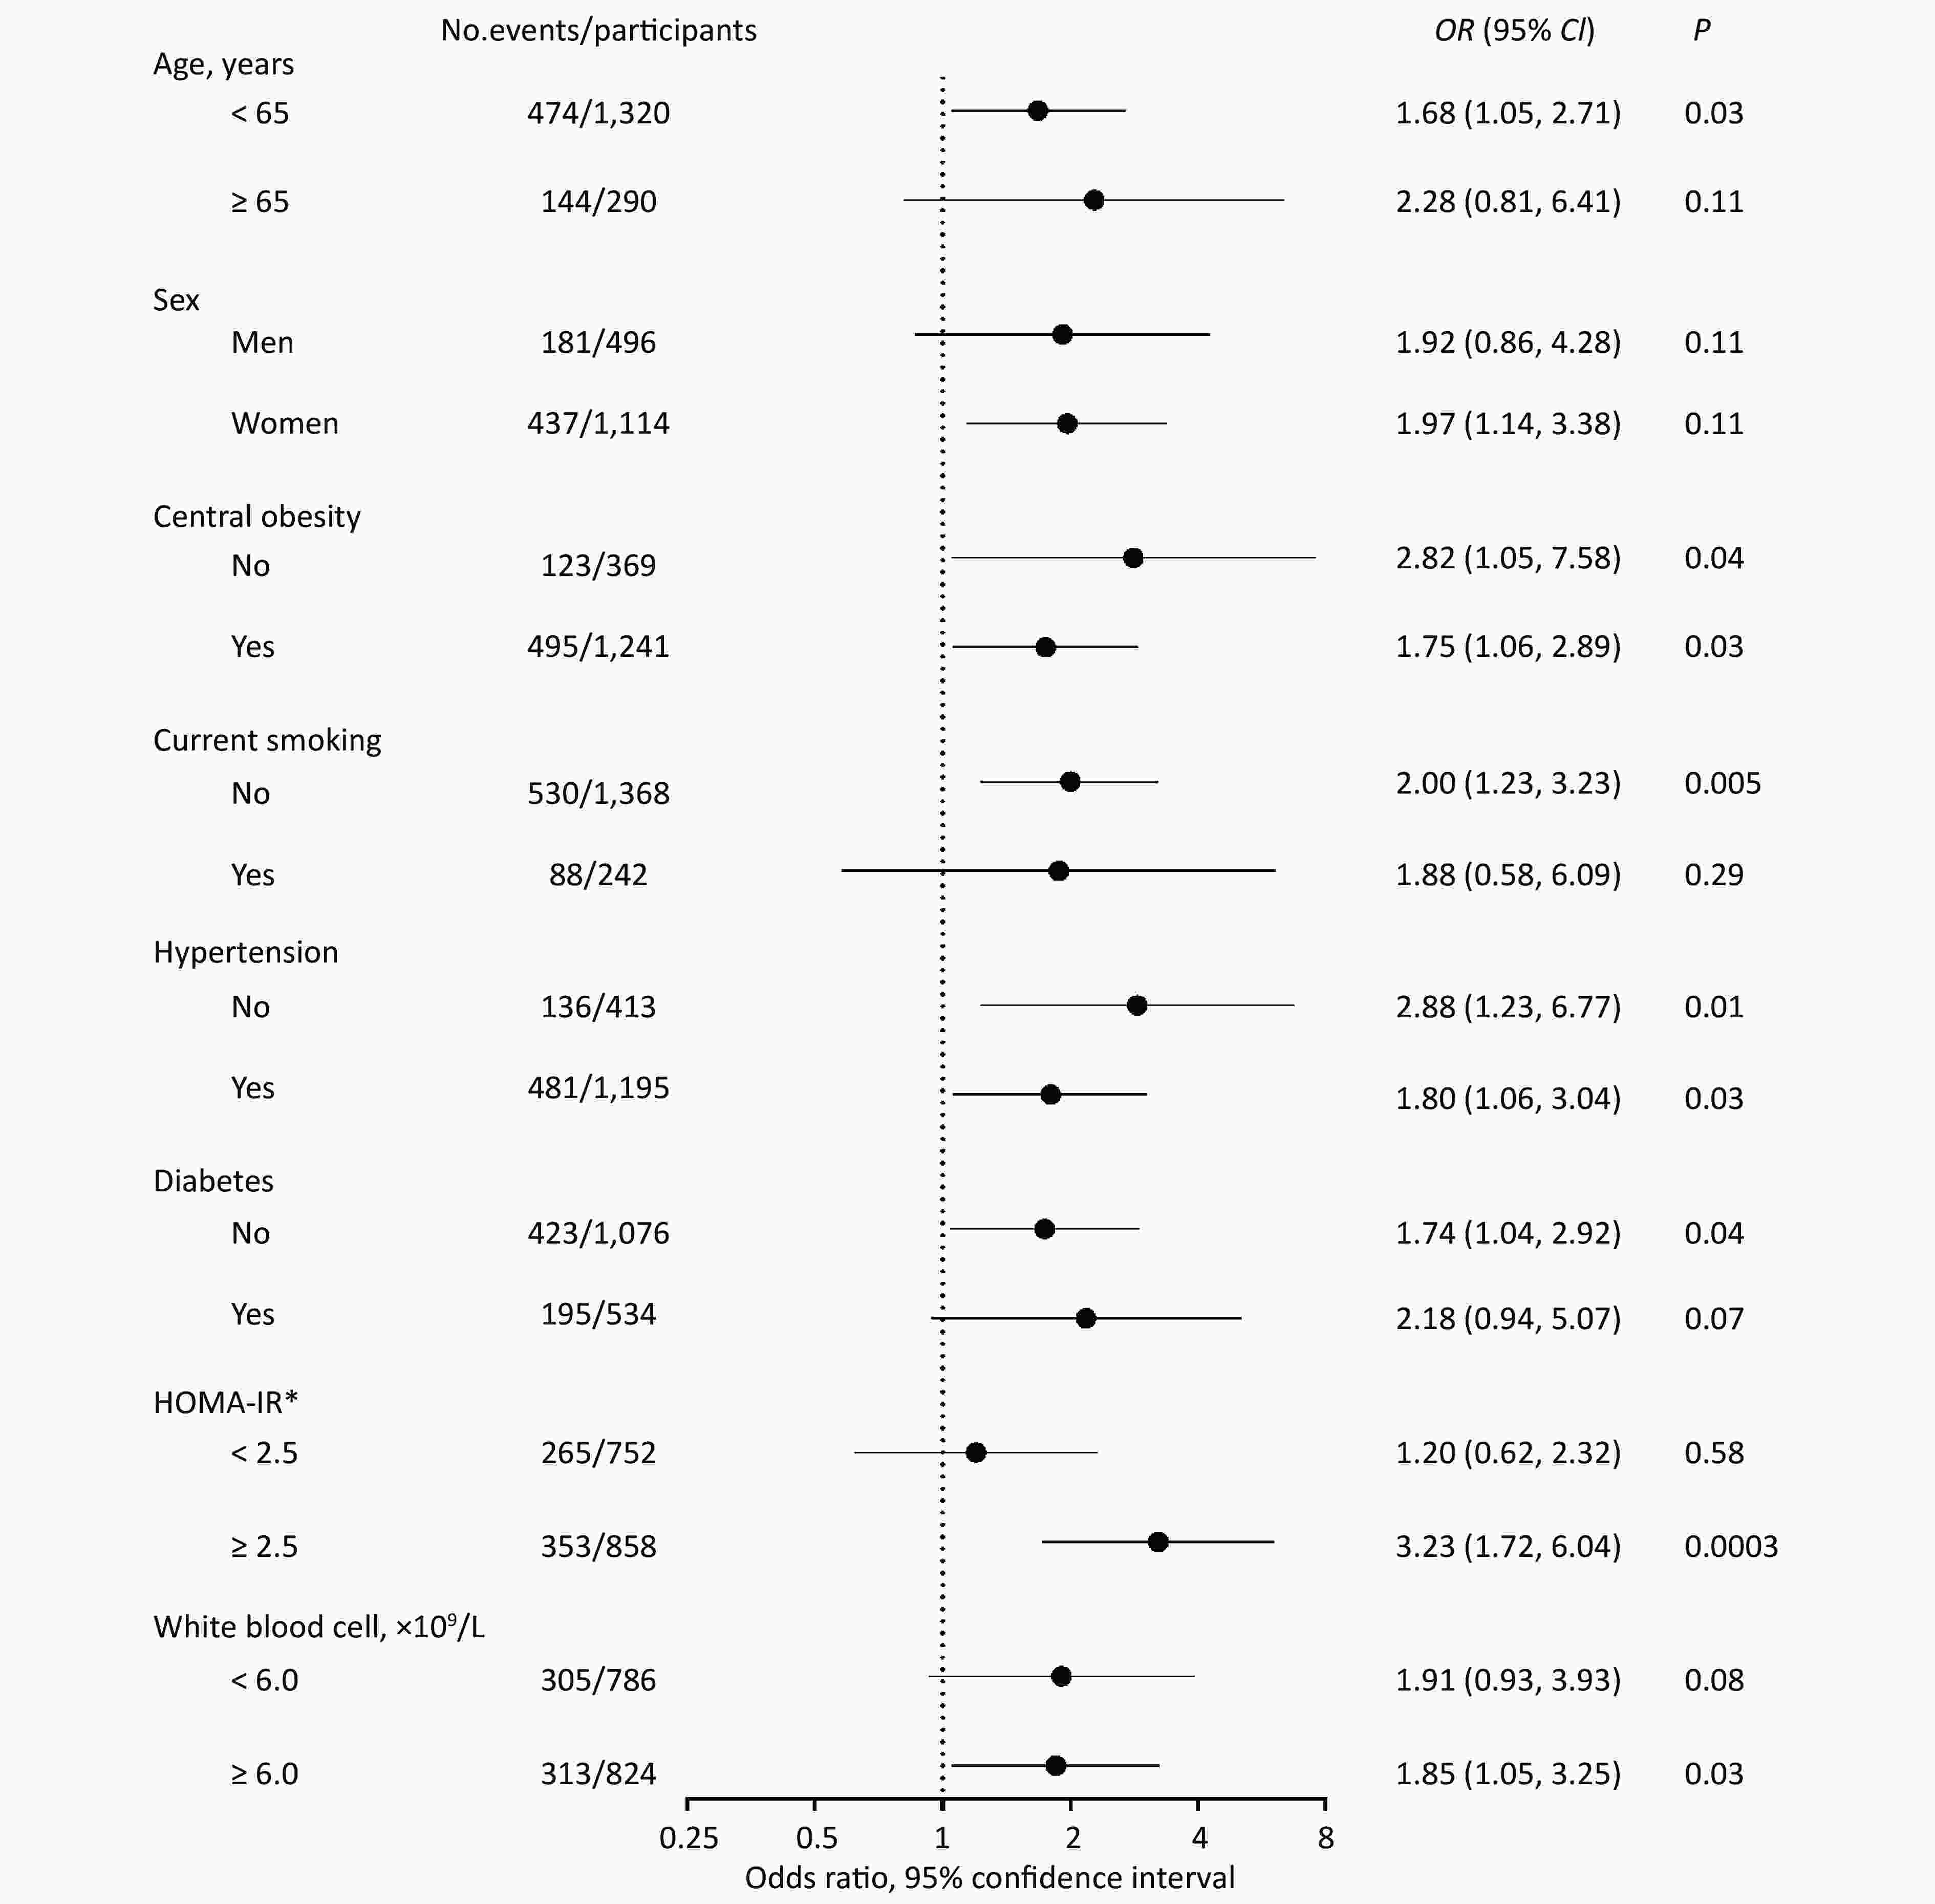
Figure 2. Stratified analyses of the association between PAD and risk of fibrosis deterioration.
Given the observed interaction between PAD and IR, we then explored the joint effect of PAD and IR on fibrosis deterioration (Table 3). Patients with both PAD and IR had a dramatically increased risk of fibrosis deterioration, compared with those with neither PAD nor IR, after adjusting for confounders (OR = 3.85, 95% CI: 2.06, 7.18, P < 0.0001). The similar results were observed among those with progression from low to intermediate or high NFS (OR = 4.20, 95% CI: 1.75, 10.09, P = 0.001) and those with progression from intermediate to high NFS (OR = 2.82, 95% CI: 1.07, 7.42, P = 0.03).
Deterioration of fibrosis PAD IR OR (95% CI) P No. events/participants Total No No 1.00 246/696 No Yes 1.27 (0.97, 1.65) 0.09 315/790 Yes No 1.16 (0.61, 2.23) 0.65 19/56 Yes Yes 3.85 (2.06, 7.18) < 0.0001 38/68 Intermediate to high No No 1.00 40/233 No Yes 0.86 (0.50, 1.46) 0.57 68/344 Yes No 1.13 (0.30, 4.30) 0.86 4/18 Yes Yes 2.82 (1.07, 7.42) 0.03 12/34 Low to intermediate or high No No 1.00 206/463 No Yes 1.42 (1.04, 1.94) 0.03 247/446 Yes No 1.12 (0.53, 2.37) 0.78 15/38 Yes Yes 4.20 (1.75, 10.09) 0.001 26/34 Note. Data are presented as OR and 95% CI.
P-values were assessed from the logistic regression analyses, after adjustments for age, sex, baseline nonalcoholic fatty liver disease fibrosis score, central obesity, physical activity, current smoking, current drinking, diabetes, hypertension, triglycerides, HDL cholesterol, LDL cholesterol, and white blood cell.
IR: homeostasis model assessment of IR ≥ 2.5 was defined as Yes.
Abbreviation: PAD, peripheral artery disease; IR, insulin resistance; HDL, high-density lipoprotein; LDL, low-density lipoprotein.Table 3. Joint effect of PAD and IR on fibrosis deterioration
-
In this community-based cohort of middle-aged and elderly Chinese patients with NAFLD, PAD measured as ABI was independently associated with increased risk of fibrosis deterioration, especially in those with IR. The coexistence of PAD and IR can impose an interactive effect on the risk of fibrosis deterioration.
Our study focusing on PAD and the risk of fibrosis deterioration greatly expanded the previous findings. A growing body of evidence reported that metabolic dysfunctions could increase the risk of both fibrosis progression and PAD. Those with metabolic syndrome were more likely to progress to the higher category of the histologic severity of liver disease[14], and even each component of metabolic syndrome was the independent risk factor associated with the severity of liver fibrosis[15]. Besides, BMI was positively associated with the risk of the more severe stages of fibrosis progression in NAFLD patients[16]. The risk factors for developing PAD were diabetes, obesity, and dyslipidemia, which had also been well demonstrated[9,17]. Based on these epidemiological studies, it seems that metabolic disorders, including obesity, diabetes, and dyslipidemia, contributed significantly to the same biological pathways of PAD and fibrosis progression. Although a previous study has also reported that NAFLD patients with AF had an increased risk of PAD[8], our results demonstrated a significant and independent relationship between PAD and risk of fibrosis deterioration.
We detected a multiplicative interaction of PAD and IR on the risk of liver fibrosis deterioration. Findings from prior studies supported that IR played a key role in developing PAD as well as fibrosis progression. Recently, IR had been proposed to be predictive of fibrosis progression in NAFLD patients[18]. Those with IR had an increased risk of incident PAD, independent of the presence of metabolic risk factors[19]. Data from NHANES also reported that IR was strongly and independently related to the increased risk of PAD[20]. Hereby, the risk of fibrosis deterioration was dramatically strengthened by the coexistence of PAD and IR, as we found in our study. Additionally, our results also showed that the association of PAD and fibrosis deterioration was more significant in those with IR. IR acted as a key factor leading to PAD as well as fibrosis deterioration and had a combined effect with PAD on fibrosis deterioration.
The exact mechanisms linking PAD and fibrosis progression are not fully understood. Most likely, PAD and liver fibrosis may share the same physiopathological determinants and progress in parallel. Chronic inflammation and oxidative stress may suggest a plausible relationship between PAD and progressive forms in NAFLD[21]. Besides, considerable experimental data supported an important role of transforming growth factor-β1 (TGF-β1) in liver fibrosis[22]. It has been shown that adventitial TGF-β1 associated with arterial diseases due to oxidative stress resulted in collagen deposition[23]. Pentraxin 3 (PTX3), mainly produced in the atherosclerotic vascular tissue[24], played a role in the vascular injury because of inflammation[25]. Elevated plasma PTX3 levels were closely correlated with the presence of fibrosis in NAFLD patients[26]. Basic research also provided evidence for the role of IR in the pathogenesis of atherosclerosis because of the development of endothelial dysfunction through the adverse effects of glucotoxicity, lipotoxicity, and vascular endothelium inflammation[27].
The strengths of our study included the prospective follow-up design and the use of standardized clinical, imaging, and laboratory procedures in data collection. The fibrosis progression in NAFLD patients was evaluated by two repeated measured variables at both baseline and follow-up examination. Despite these strengths, several limitations should be acknowledged. First, in our study, PAD was defined according to resting ABI measurement without the clinical presentation, physical examination, and additional physiological diagnostic tests like exercise treadmill ABI testing, which were necessary to confirm the diagnosis of PAD at clinical practice[28]. However, resting ABI measurement was generally an initial test and noninvasive method in diagnosing PAD because of its excellent sensitivity and specificity[28]. It has been considered as the most accurate method of assessing PAD in the epidemiological studies[29]. Second, we did not apply liver biopsy to evaluate fatty liver and fatty liver severity. Although liver biopsy is currently the most reliable approach to diagnose NAFLD and quantify liver fibrosis, its clinical value in epidemiological studies is greatly limited, considering its cost, invasive nature, and high procedure-related complication risks. Hence, abdominal ultrasound has been considered as a reliable and accurate diagnostic measurement to detect fatty liver and is preferred to screen for fatty liver in population-based epidemiological studies[30,31]. NFS is a noninvasive index, which is based on six readily available variables (age, BMI, fasting plasma glucose, PLT, albumin, and ALT/AST), and the diagnostic accuracy of the probability of AF has been confirmed in NAFLD patients compared with liver biopsy in clinical practice[32]. The cutoff points of 0.676 had 97% specificity in evaluating the high probability of AF in NAFLD patients, and a score of < −1.455 had 90% sensitivity to exclude AF[2]. Importantly, a recent study found that there was slightly greater diagnostic accuracy for detecting liver fibrosis in NFS than other noninvasive indices [2,33]. Third, it has been demonstrated that PAD and fibrosis progression shared the same metabolic dysfunctions. In our study, we only explored the association between the PAD presence at baseline and the risk of fibrosis deterioration, which might indicate the contribution of metabolic dysfunctions. Since a bilateral direction may exist between PAD and liver fibrosis, the presence of liver fibrosis could cause an incident PAD in NAFLD to warrant further exploration. Besides, considering this was an observational study, although known and possible confounders had been put into analyses as covariables, the possibility of residual confounding could not be ruled out, such as hypersensitive C-reactive protein. In our study, we adjusted for WBC as one of the inflammation markers. Last, the study was performed in middle-aged and elderly Chinese. Because of the high prevalence of PAD in the elderly[34], the present results may not be directly generalizable to younger and other ethnic populations.
-
In conclusion, this community-based longitudinal study provides evidence of an association between PAD and increased risk of fibrosis deterioration, especially in those with IR. The coexistence of PAD and IR may impose an interactive effect on the risk of fibrosis deterioration. Given the epidemic of NAFLD and the heavy burden of its comorbidities, early detection and prevention of PAD and IR could help identify individuals at high risk of fibrosis deterioration and related adverse consequences.
-
The authors declare that there is no duality of interest associated with this manuscript.
-
XU Min and ZHU Wen designed the study. ZHU Wen collected, analyzed, and interpreted the data and wrote the manuscript. DENG Chan Juan, XUAN Li Ping, DAI Hua Jie, ZHAO Zhi Yun, LI Mian, LU Jie Li, XU Yu, and CHEN Yu Hong collected the data. WANG Tian Ge, WANG Wei Qing, BI Yu Fang, and XU Min interpreted the data and revised the manuscript. All authors approved the final version of the manuscript.
Peripheral Artery Disease and Risk of Fibrosis Deterioration in Nonalcoholic Fatty Liver Disease: A Prospective Investigation
doi: 10.3967/bes2020.031
Funds:
Grants from the Ministry of Science and Technology of China [2018YFC1311705, 2016YFC1305600, and 2016YFC1304904]; the National Natural Science Foundation of China [81770842, 81941017, and 81870604]; the Shanghai Science and Technology Commission [YDZX20173100004881]; and the Shanghai Shen-Kang Hospital Development Center [SHDC12016202]
- Received Date: 2019-10-08
- Accepted Date: 2020-01-14
-
Key words:
- Ankle-brachial index /
- Nonalcoholic fatty liver disease /
- Fibrosis deterioration /
- NAFLD fibrosis score /
- Insulin resistance
Abstract:
| Citation: | ZHU Wen, DENG Chan Juan, XUAN Li Ping, DAI Hua Jie, ZHAO Zhi Yun, WANG Tian Ge, LI Mian, LU Jie Li, XU Yu, CHEN Yu Hong, WANG Wei Qing, BI Yu Fang, XU Min. Peripheral Artery Disease and Risk of Fibrosis Deterioration in Nonalcoholic Fatty Liver Disease: A Prospective Investigation[J]. Biomedical and Environmental Sciences, 2020, 33(4): 217-226. doi: 10.3967/bes2020.031

|

 Quick Links
 DownLoad: