

-
Drinking-water distribution systems including premise plumbing are complex microbial ecosystems that may harbor a diversity of bacteria, protozoa, virus, and fungi. As the most frequently studied group of microorganisms in water systems, bacteria play a key role in water quality and drinking water safety. In general, Proteobacteria, Bacteroidetes, Cyanobacteria, Verrucomicrobia, and Actinobacteria are the most frequently reported abundant bacterial phyla in the water systems[1]. Notably, the presence of pathogens or opportunistic pathogens in these phyla, such as Legionella pneumophila (L. pneumophila) and Mycobacterium avium (M. avium), can pose potential health threats to humans. L. pneumophila are Gram-negative obligate aerobic bacteria of the phylum Proteobacteria, which can cause Legionnaires' disease (LD) or Pontiac fever. Similar to some species within the Actinobacteria phylum, non-tuberculous mycobacteria (NTM) can cause pulmonary diseases resembling tuberculosis, lymphadenitis, soft tissue infection, or disseminated infection in immunocompromised individuals such as acquired immune deficiency syndrome (AIDS) and transplanted patients[2]. So far, although over 150 different species of NTM have been reported, NTM infections are most commonly associated with species such as M. avium complex, M. abscessus, M. fortuitum, and M. kansasii[3].
Owing to their ability to resist stressful environmental conditions (such as oxygen deprivation, nutrition deficiency, temperature shocks, pH changes, and chlorine resistance), Legionella and NTM are often found in a wide range of natural and artificial aquatic environments[4,5]. According to previous studies, these bacteria have been widely detected in municipal water treatment and distribution systems[6,7]. Legionella and NTM colonization in water distribution systems are influenced by many factors, including water temperature, organic matter, pipe material, corrosion, nutrient levels, hydraulic conditions, and biofilm formation in pipe networks[8-10]. The U.S. Environmental Protection Agency (EPA) has included M. avium and L. pneumophila in the contaminate candidate list 4 (CCL4), which is a list of contaminants that are currently not subject to any proposed or promulgated national primary drinking water regulations[11].
Many modes have been identified for the transmission of these opportunistic pathogens to humans. Inhalation or micro aspiration of aerosols generated by contaminated water, such as from nebulizers, showers, faucets, fountains, hot water systems, and cooling towers, is the most common route of exposure. The hospital environment is of importance in the cross-transmission of opportunistic pathogens. For example, pathogen contamination on the surfaces of medical devices or other healthcare facilities is a potential exposure route to opportunistic pathogens for susceptible people, which increases the potential risk of healthcare-associated infections. A review of 27 LD outbreaks investigated by the U.S. CDC shown that 33% LD cases are linked to healthcare[12,13]. Airborne/aerosols mode of infection are also important migration routes in hospital. Legionella spp. and NTM can survive in water systems and spread in the form of aerosols during showering, bathing, or through faucet water[14]. Like other bacteria, these opportunistic pathogens mostly grow in biofilms, which provide an ecological niche for microorganisms on the surfaces of plumbing materials. Once established within the water system, opportunistic pathogens are difficult to be eradicated.
There is an extensive concern that nosocomial infections are associated with waterborne opportunistic pathogens. Some studies indicated that the water system is one of the main sources for LD outbreaks in hospitals[15,16]. Legionella spp. in hospital drinking water samples have been associated with patient isolates in Italy[17]. The aerators/rectifiers connected to the faucets of the water supply in a Japanese hospital were also suspected to be related to the increased frequency of NTM-positive disease cases[18]. However, there are gaps in the knowledge about the existence of opportunistic pathogens in the water systems of respiratory disease hospitals that hospitalize many patients with pulmonary diseases susceptible to infection with opportunistic pathogens. In addition, little is known about the composition of microbial community, especially that of opportunistic pathogens, associated with bacterial populations in hospital water systems. Considering the complexity of hospital water systems and the vulnerability of hospitalized patients, it is important to conduct studies to survey the presence of opportunistic pathogens and investigate the composition of microbial community in water systems of respiratory disease hospitals.
In this study, representative opportunistic pathogens such as Legionella spp., Mycobacterium spp., and M. avium were targeted in a pulmonary hospital water system. This hospital is one of the largest hospitals specializing in respiratory disease treatment and research in China. In addition, amplicon sequencing of 16S rRNA genes was performed. The aims of this study are as follows: (1) to reveal the occurrence of opportunistic pathogens in tap water; (2) to evaluate the correlations of water quality parameters like temperature, pH, total chlorine, nitrate, nitrite, and ammonia with opportunistic pathogens; (3) to characterize microbial communities and to explore the influence of drinking water systems on the drinking water microbiome. The information from this study might be useful for improving hospital water systems to prevent nosocomial infections caused by opportunistic pathogens.
-
The work was conducted in a pulmonary hospital in Shanghai, China, which is one of the largest hospitals specialized in respiratory disease treatment, research and education in China. This hospital was founded in 1933, covering an area of 103,000 square meters. There are 1,348 employees, 13 clinical departments (such as thoracic surgery, oncology department, respiration department, tuberculosis department, occupational disease department), and 11 medical technique departments. It reports 1,044,704 outpatient visits and discharges 88,768 patients on a yearly average.
Drinking water samples were collected from three buildings during March to May, 2018 in this hospital, where chloramine was used as the secondary disinfectant. The first building is used for outpatient service, the second building are wards of respiration department, and the third building is an office building free of medical services, serving as a control site in this study. The detailed information for sampling is shown in Supplementary Table S1 (available in www.besjournal.com). Samples (1,000 mL) were collected after flushing for 3 min, and then the bulk water sample was filtered through a sterile 0.22 μm nitrocellulose membrane (Millipore, MA) using a peristaltic pump. A filter membrane with collected biomass was transferred into a 2 mL tube (the lysing matrix A tube) from FastDNA SPIN Kit (MP Biomedicals, OH). The sample was further processed according to the manufacturer’s protocol. The extracted DNA was purified, precipitated, and dissolved in 50 μL of sterile nuclease-free water. The concentration and purity of the total DNA were measured using NanoDrop 2000 (Thermo Fisher Scientific).
Building Location Faucet type Sampling month 1st Consulting room Automatic faucet April, 2018 1st Consulting room Automatic faucet April, 2018 1st Dressing room Automatic faucet April, 2018 1st Dressing room Automatic faucet April, 2018 1st Drinking room Manual faucet March, 2018 1st Drinking room Manual faucet March, 2018 1st Office Manual faucet April, 2018 1st Office Manual faucet April, 2018 1st Treatment room Automatic faucet April, 2018 1st Treatment room Automatic faucet April, 2018 1st Wash room Automatic faucet March, 2018 1st Wash room Automatic faucet March, 2018 2nd Consulting room Manual faucet March, 2018 2nd Consulting room Manual faucet March, 2018 2nd Respiratory ward Manual faucet March, 2018 2nd Respiratory ward Manual faucet March, 2018 2nd Servery Manual faucet March, 2018 2nd Servery Manual faucet March, 2018 2nd Treatment room Manual faucet March, 2018 2nd Treatment room Manual faucet March, 2018 2nd Wash room Manual faucet March, 2018 2nd Wash room Manual faucet March, 2018 3rd Wash room Manual faucet May, 2018 3rd Wash room Manual faucet May, 2018 3rd Wash room Manual faucet May, 2018 Table S1. Sampling information in this study
-
Temperature, pH, total chlorine, nitrate, nitrite, and ammonia were measured at the time of collection. pH and temperature were monitored using a portable pH meter (Bante Instrument, Bante903P). Total chlorine, nitrate, nitrite, and ammonia were analyzed using HACH reagents, on a DR900 colorimeter (HACH, Loveland, CO).
-
Legionella spp., Mycobacterium spp., M. avium, and total bacterial 16S rRNA genes were quantified by qPCR assays using previously published primers and probes[19]. All qPCR reactions were performed in triplicate in a 10 μL system containing TaqMan Probes or SybrGreen Premix (TaKaRa). For SYBR Green assays, the 10 μL reaction mixture contained 5 μL of SYBR Green Premix, 0.8 μL each of 5 μmol/L forward and reverse primers, 0.16 μL ROX, 2.24 μL DNase/RNase-free water, and 1 μL template DNA. For TaqMan assays, the 10 μL reaction mixture contained 5 μL of Probes Premix, 0.4 μL each of 5 μmol/L primers, 0.35 μL of 10 μmol/L probe, 0.1 μL ROX, 2.75 μL DNase/RNase-free water, and 1 μL template DNA. The qPCR conditions were as follows: 30 s at 95 °C, 40 cycles of 5 s at 95 °C, 34 s at 55 °C, and 40 s at 72 °C (for 16S rRNA genes); 1 min at 95 °C, 40 cycles of 5 s at 95 °C, 34 s at 64 °C, and 40 s at 72 °C (for M. avium); 30 s at 95 °C, 40 cycles of 5 s at 95 °C, 34 s at 58.5 °C, and 40 s at 72 °C (for Legionella spp.); 30 s at 95 °C, 45 cycles of 5 s at 95 °C, 34 s at 55 °C, and 40 s at 72 °C (for Mycobacterium spp.). Samples were diluted at 1:10 ratios to minimize PCR inhibition. Standards (positive controls) and sterile water (negative controls) were included in each qPCR run. qPCR standards were analyzed to determine the amplification efficiencies (range: between 90% and 110%) and the correlation coefficient (R2 > 0.99 for all the standard curves). Samples yielding a detectable threshold cycle in at least two experiments out of three were scored as positive.
-
The V3–V4 region of 16S rRNA genes were amplified for all DNA extracts with primers 338F (forward primer sequence: 5’-ACTCCTACGGGAGGCAGCA-3’) and 806R (reverse primer sequence: 5’-GGACTACHVGGGTWTCTAAT-3’). PCRs were performed with a 20 µL system using TransStart Fastpfu DNA Polymerase (Beijing TransGen Biotech). The PCR products from triplicate amplifications were examined using a 2% agarose gel, and then purified using the AxyPrep DNA Gel Extraction Kit (Axygen Biosciences, USA) according to the manufacturer’s instructions. Purified amplicons were pooled in equimolar amounts prior to amplicons sequencing on an Illumina MiSeq platform using paired-end 250 bp kits according to the standard protocols at the Majorbio Bio-Pharm Technology Corporation in Shanghai, China.
Paired-end reads were stitched and screened using Trimmomatic to remove short sequences, singletons, and noisy reads, prior to alignment using FLASH[20,21]. Chimeras were identified and removed from further analysis using UCHIME[22]. Sequences were clustered into operational taxonomic units (OTUs) using the average neighbor algorithm with a similarity cut-off of 97%[23]. The taxonomic information of sequences was aligned against the Greengenes database, with a threshold confidence level of 70%[24].
The software Mothur was used to analyze the alpha diversity indices, including the coverage, observed OTUs richness (Sobs), Shannon index, abundance-based coverage estimator (ACE) and Chao1[25]. The intersection of OTUs lists for different samples was analyzed using the vegan packages in R to reveal overlapped and unique OTUs in different buildings. Non-metric multidimensional scaling (NMDS) analysis and analysis of similarity (ANOSIM) were performed based on generated Bray-Curtis distance matrices to evaluate the variation of the microbial community structure among different sample groups. Redundancy analysis (RDA) was used to evaluate the relationship between the abundance of microbial species and environmental variables, using the vegan and ggplot2 packages in R v3.5.0 software.
-
qPCR and physiochemical data were analyzed with a significance level < 0.05. The Shapiro-Wilk test was used to test the normality of data. One-way analysis of variance (ANOVA) or Kruskal-Wallis H test was performed to compare target microbes in different buildings depending on the normality and variance of the data. Wilcoxon rank-sum test was used to compare physiochemical and/or biological data between the two different types of faucets. Spearman correlation analysis was used to identify associations between qPCR data and physiochemical parameters using the IBM SPSS statistics v24.0 software. Maximal Information-based Nonparametric Exploration (MINE) analysis, a tool for finding the pairwise associations (linear or non-linear association) in a dataset, with a false detection rate correction at 0.05 was used to characterize the associations between Legionella spp., Mycobacterium spp., and other bacterial genera[26,27].
-
The water quality parameters in the hospital water system are shown in Table 1 and Supplementary Table S2, available in www.besjournal.com. The temperature, pH, total chlorine, NO3-N, NO2-N, and NH4-N varied in the range of 12.7–27.5 °C, 7.17–7.91, 0.06–0.93 mg/L, 0.3–2.9 mg/L, < 0.001–0.046 mg/L, and 0.07–0.20 mg/L among all water samples, respectively. The levels of total chlorine in building 2 were significantly higher than in building 1 and building 3 (P < 0.05). NO3-N shared a similar trend: building 3 < building 1 < building 2 (P < 0.05). However, the variation of temperature was opposite, with the average temperature in building 3 about 7.0 °C higher than that of building 2 (P < 0.05). The concentrations of NH4-N in building 1 and building 2 were approximately two times higher than building 3 (P < 0.05). No significant difference was observed for NO2-N among the three buildings.
Item Temperature (°C) pH Total chlorine (mg/L) NO3-N (mg/L) NO2-N (mg/L) NH4-N (mg/L) Building 1 21.6 ± 3.1 7.58 ± 0.12 0.60 ± 0.24 1.4 ± 0.6 0.006 ± 0.004 0.16 ± 0.03 Building 2 18.4 ± 5.0 7.39 ± 0.16 0.83 ± 0.10 2.1 ± 0.4 0.008 ± 0.013 0.15 ± 0.04 Building 3 25.4 ± 0.4 7.85 ± 0.06 0.27 ± 0.03 0.6 ± 0.1 0.006 ± 0.006 0.08 ± 0.01 Note. Building 3 serves as a control. Data are shown as mean ± standard deviation. Table 1. Physiochemical parameters of water samples collected from the hospital water system
Location Temperature (°C) pH Chlorine (mg/L) NO3-N (mg/L) NO2-N (mg/L) NH4-N (mg/L) 1st Consulting room 1 22.1 7.62 0.45 1.4 0.009 0.19 1st Consulting room 2 20.3 7.67 0.76 1.4 0.006 0.19 1st Dressing room 2 23.5 7.52 0.35 1.3 0.005 0.14 1st Dressing room 1 24.9 7.58 0.06 1.5 0.007 0.10 1st Drinking room 1 20.3 7.51 0.84 2.0 0.002 0.17 1st Drinking room 2 17.3 7.57 0.85 1.5 < 0.001 0.18 1st Office 1 22.6 7.67 0.57 0.8 0.004 0.17 1st Office 2 27.5 7.62 0.77 1.9 0.004 0.16 1st Treatment room 1 23.9 7.66 0.55 0.3 0.009 0.17 1st Treatment room 2 21.6 7.69 0.74 0.7 0.009 0.16 1st Wash room 1 18.5 7.24 0.77 1.9 0.004 0.16 1st Wash room 2 17.2 7.58 0.84 2.7 0.002 0.17 2nd Consulting room 1 22.0 7.26 0.57 1.8 0.046 0.08 2nd Consulting room 2 19.8 7.31 0.85 1.9 < 0.001 0.09 2nd Respiratory ward 1 27.4 7.32 0.76 2.0 0.006 0.12 2nd Respiratory ward 2 25.2 7.37 0.83 1.8 0.006 0.12 2nd Servery 1 15.9 7.51 0.89 2.6 0.003 0.18 2nd Servery 2 13.9 7.56 0.91 2.9 0.005 0.17 2nd Treatment room 1 17.2 7.57 0.85 1.8 0.005 0.17 2nd Treatment room 2 15.1 7.62 0.88 2.0 0.009 0.16 2nd Wash room 1 14.8 7.17 0.84 1.9 < 0.001 0.20 2nd Wash room 2 12.7 7.23 0.93 2.3 < 0.001 0.18 3rd Wash room 1 25.7 7.91 0.30 0.6 0.006 0.07 3rd Wash room 2 24.9 7.84 0.27 0.5 0.006 0.09 3rd Wash room 3 25.6 7.79 0.24 0.7 0.005 0.08 Table S2. Physiochemical parameters of water samples collected from the hospital water system
-
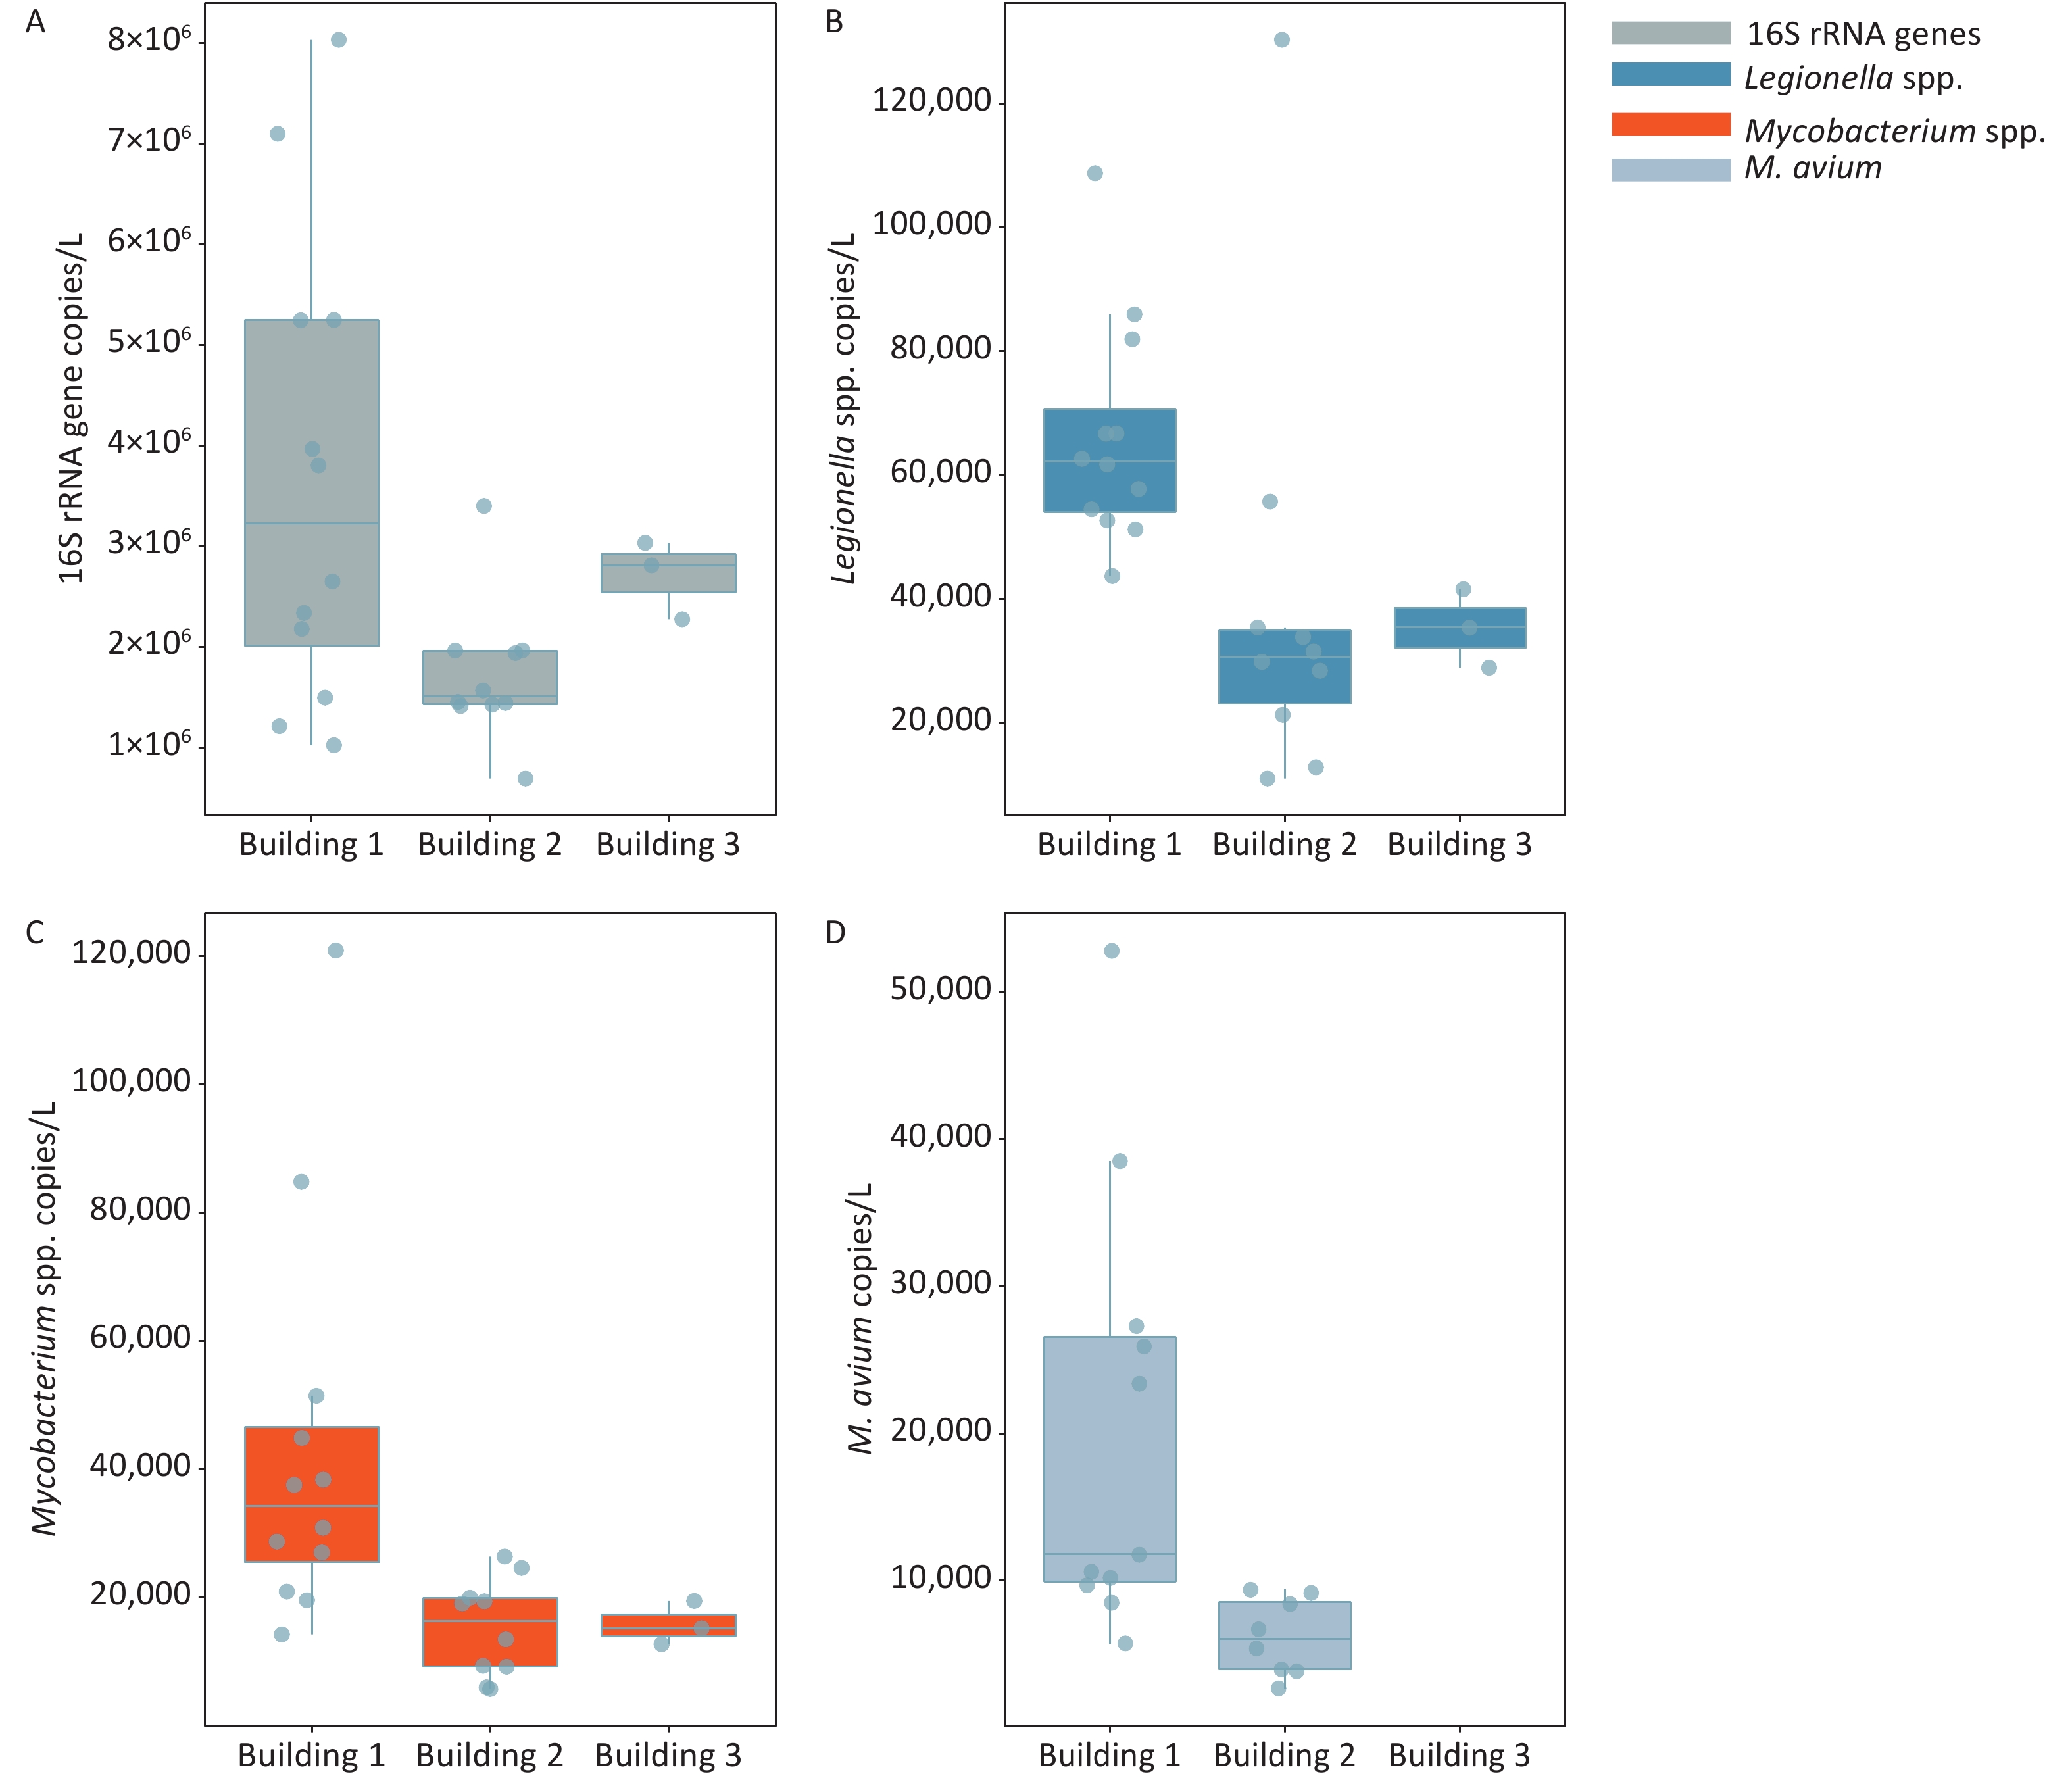
The frequencies of detection (FOD) of Legionella spp., Mycobacterium spp., and M. avium in the three hospital buildings were 100%, 100%, and 76%, respectively (Figure 1 and Supplementary Table S3, available in www.besjournal.com). The total bacteria, Legionella spp., and Mycobacterium spp. were detected in all water samples taken from 3 different buildings, ranging from (0.70–8.03) × 106, (0.11–1.30) × 105, and (0.56–12.09) × 104 gene copies/L, respectively. M. avium was only detected in water samples of building 1 and building 2, while no M. avium was found in building 3. The FOD of M. avium (91.7%) in building 1 was higher than that in building 2 (80.0%), and the FOD in all samples was 76.0% (19 out of 25). There was a significant difference in the number of M. avium gene copies between the automatic faucet and manual faucet (P < 0.01). Different levels of total bacteria and Legionella gene copies were observed among the three buildings (P < 0.05).
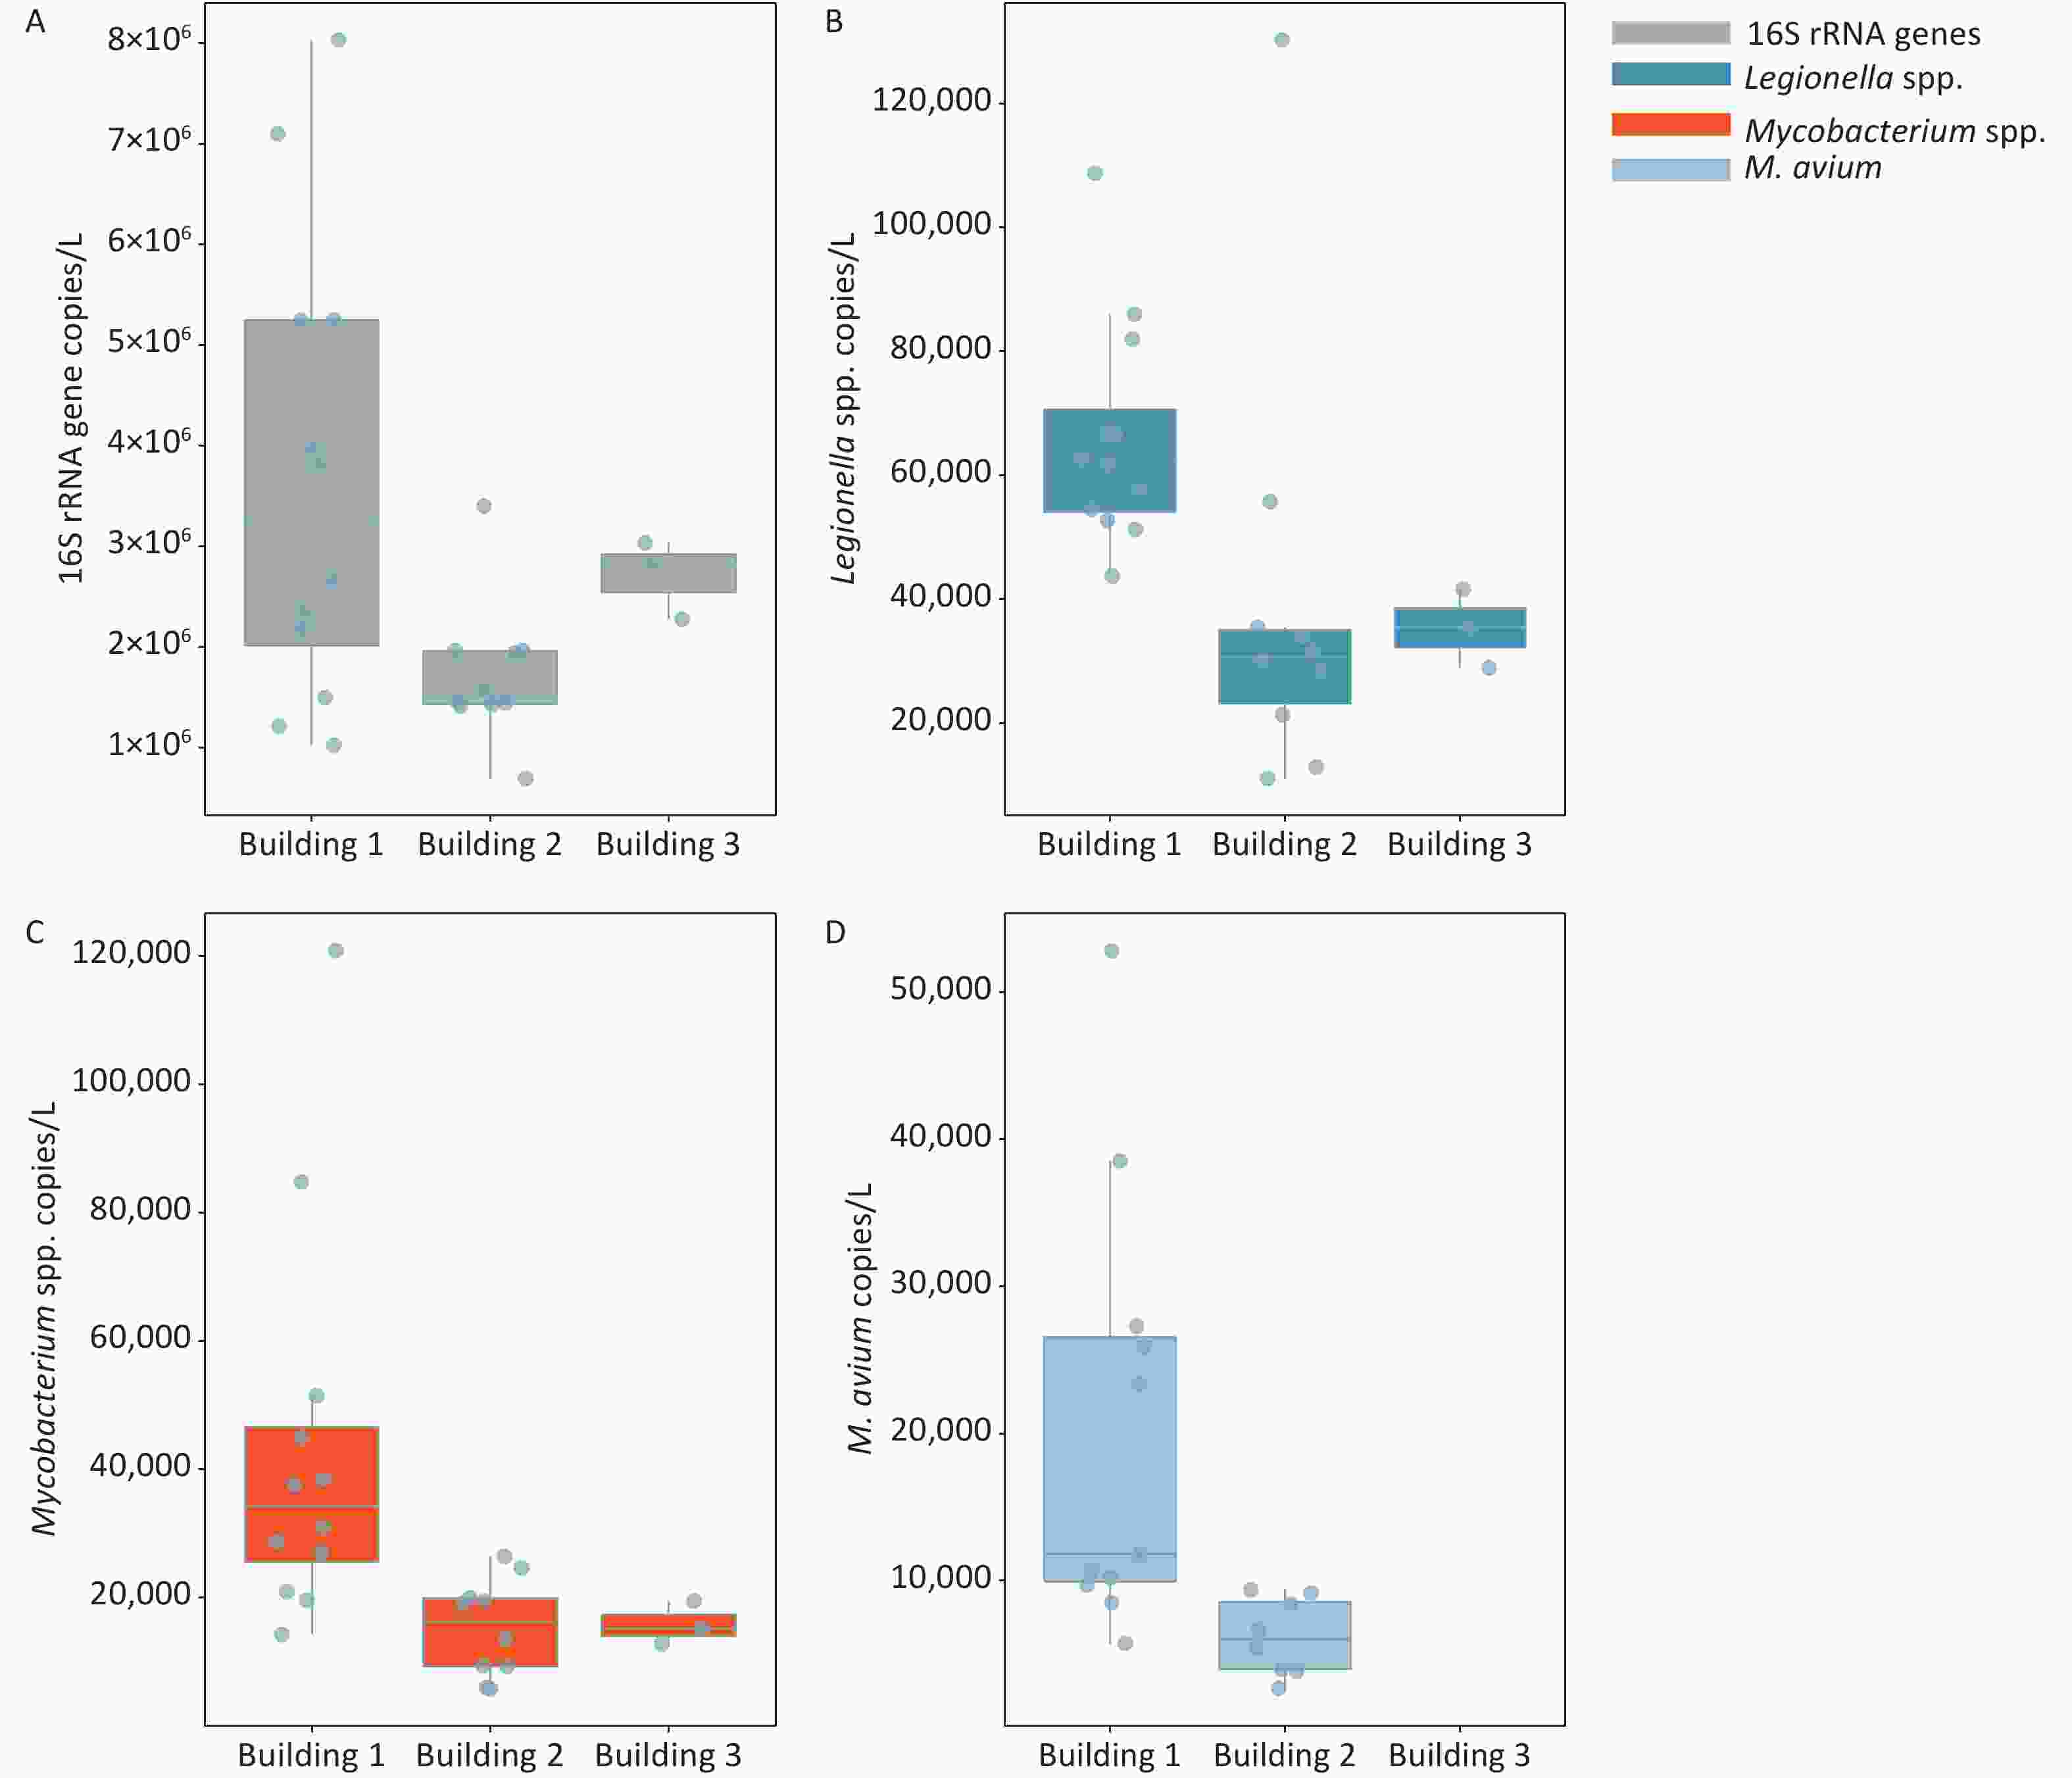
Figure 1. Enumeration of 16S rRNA genes, Legionella spp., Mycobacterium spp., and M. avium in water samples collected from three hospital buildings. (A) 16S rRNA genes; (B) Legionella spp.; (C) Mycobacterium spp.; (D) M. avium. The bottom, middle, and top line of the box correspond to the 25%, 50%, and 75% percentiles, respectively. Data beyond the end of the whiskers are outliers. Building 1 is used for outpatient service, building 2 for respiration department and wards, and building 3 is an office building free of medical services.
Target organism Occurrence rate (%) Concentration (gene copies/L) Building 1 Building 2 Building 3 Total Building 1 Building 2 Building 3 Total bacteria 100 100 100 100 (1.02–8.03) × 106 (0.70–3.40) × 106 (2.34–2.84 )× 106 Legionella spp. 100 100 100 100 (0.44–1.09) × 105 (0.11–1.30) × 105 (3.69–4.46) × 104 Mycobacterium spp. 100 100 100 100 (0.14–1.21) × 105 (0.57–2.64) × 104 (1.46–1.87) × 104 M. avium 91.7 80 0 76 (ND–5.28) × 104 (ND–9.10) × 103 ND Table S3. Occurrence and concentrations of total bacteria, Legionella spp., Mycobacterium spp., and M. avium in the hospital water system
-
The correlations between the water quality parameters and the gene copies of total bacteria and opportunistic pathogens are shown in Table 2. In all samples, significant negative correlations were found between the number of total bacterial 16S rRNA gene copies and total chlorine (r = −0.650, P < 0.01), and between the number of M. avium gene copies and total chlorine (r = −0.705, P < 0.01). Positive correlations were observed between the number of total bacterial 16S rRNA gene copies and temperature (r = 0.508, P < 0.01), pH (r = 0.535, P < 0.01), and nitrite (r = 0.475, P < 0.05). Correlation analysis was also performed between target organisms. The number of gene copies of Mycobacterium (r = 0.554), M. avium (r = 0.689) showed positive correlations with 16S rRNA gene numbers, respectively (P < 0.01).
Item Temperature pH Chlorine Nitrate Nitrite Ammonia Total bacteria Total bacteria 0.508b 0.535b −0.650b −0.735b 0.475a −0.112 1.000 Legionella −0.058 0.207 −0.154 −0.280 −0.181 0.379 0.140 Mycobacterium 0.269 0.308 −0.367 −0.470a 0.313 −0.012 0.554b M. avium 0.416 0.701b −0.705b −0.814b 0.385 0.006 0.689b Note. aSignificance < 0.05, bSignificance < 0.01. Table 2. Correlations between the water quality parameters and the gene copies of total bacteria and opportunistic pathogens
-
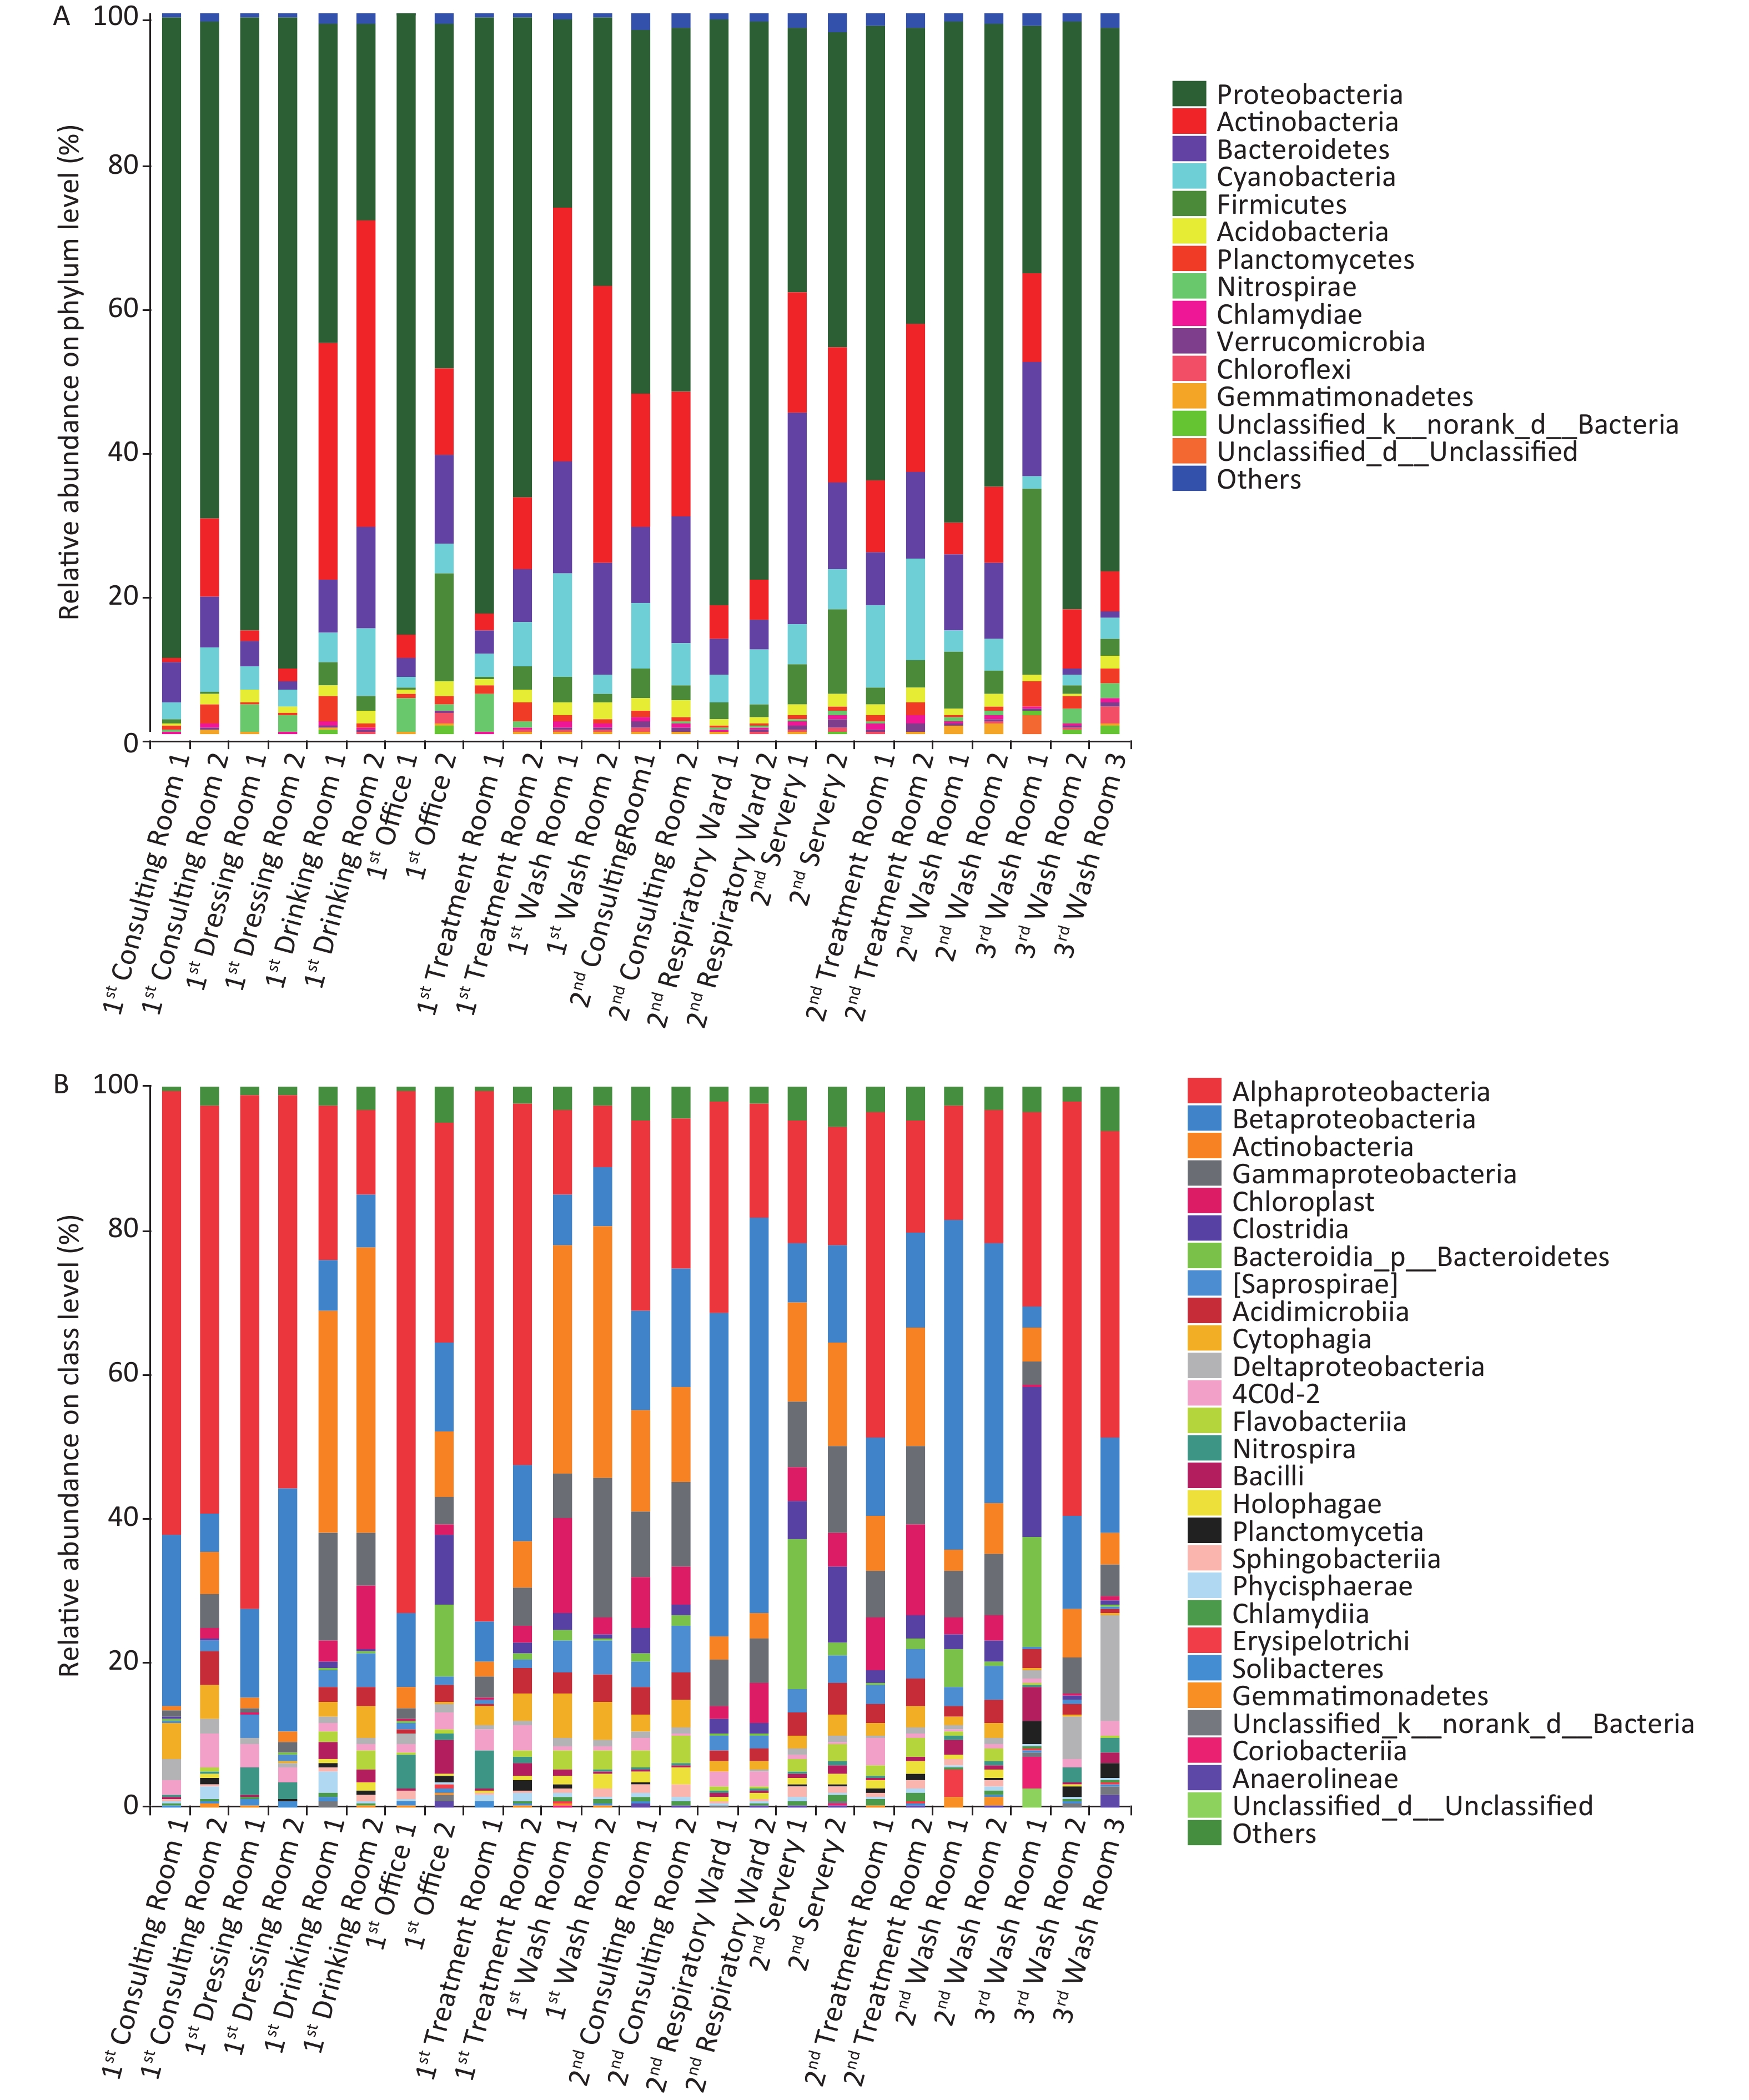
Illumina sequencing of 16S rRNA gene amplicons was performed to characterize microbial community compositions in the hospital water system (Figure 2). A total of 1,427,942 sequences were obtained from 25 water samples. These sequences were clustered into 3,182 OTUs at a 97% similarity level. The relative abundances of the most dominant phyla across the 25 samples were Proteobacteria (26.20%–90.22%), Actinobacteria (0.84%–42.63%), Bacteroidetes (0.85%–29.33%), Cyanobacteria (1.30%–14.24%), Firmicutes (0.04%–26.34%), Acidobacteria (0.32%–2.38%), Planctomycetes (0.15%–3.58%), Nitrospirae (0.04%–5.34%), Chlamydiae (0.04%–1.12%), and Gemmatimonadetes (0.05%–1.23%). At the class level, Alphaproteobacteria, Betaproteobacteria, Actinobacteria, Gammaproteobacteria, Chloroplast, Clostridia, Saprospirae, Acidimicrobiia, Cytophagia, Deltaproteobacteria, Flavobacteriia, Nitrospira, and Bacilli were the dominant classes in these samples (the sum of relative abundance > 1%). Novosphingobium, Mycobacterium, and Sphingomonas were the most prevailing genera in all the water samples, the combined relative abundances of which were 11.21%, 8.36%, and 7.17%, respectively. Other major genera in the samples were Schlegelella, Pseudomonas, Sediminibacterium, Hyphomicrobium, Bradyrhizobium, and Nitrospira (the relative abundance > 1%). MINE analysis identified 22 statistically significant associations between Mycobacterium spp. and other microbial genera under a false detection rate of 0.05 (Supplementary Table S4 available in www.besjournal.com); whereas no significant association was found between Legionella spp. and other microbial genera. The highest maximal information coefficient (MIC) between Mycobacterium spp. and other microbial genera was with Methylosinus (MIC = 0.9427, TIC = 0.7910), followed by Sediminibacterium (MIC = 0.8411, TIC = 0.3093), Polaromonas (MIC = 0.8325, TIC = 0.2773) and Limnohabitans (MIC = 0.7983, TIC = 0.4796).
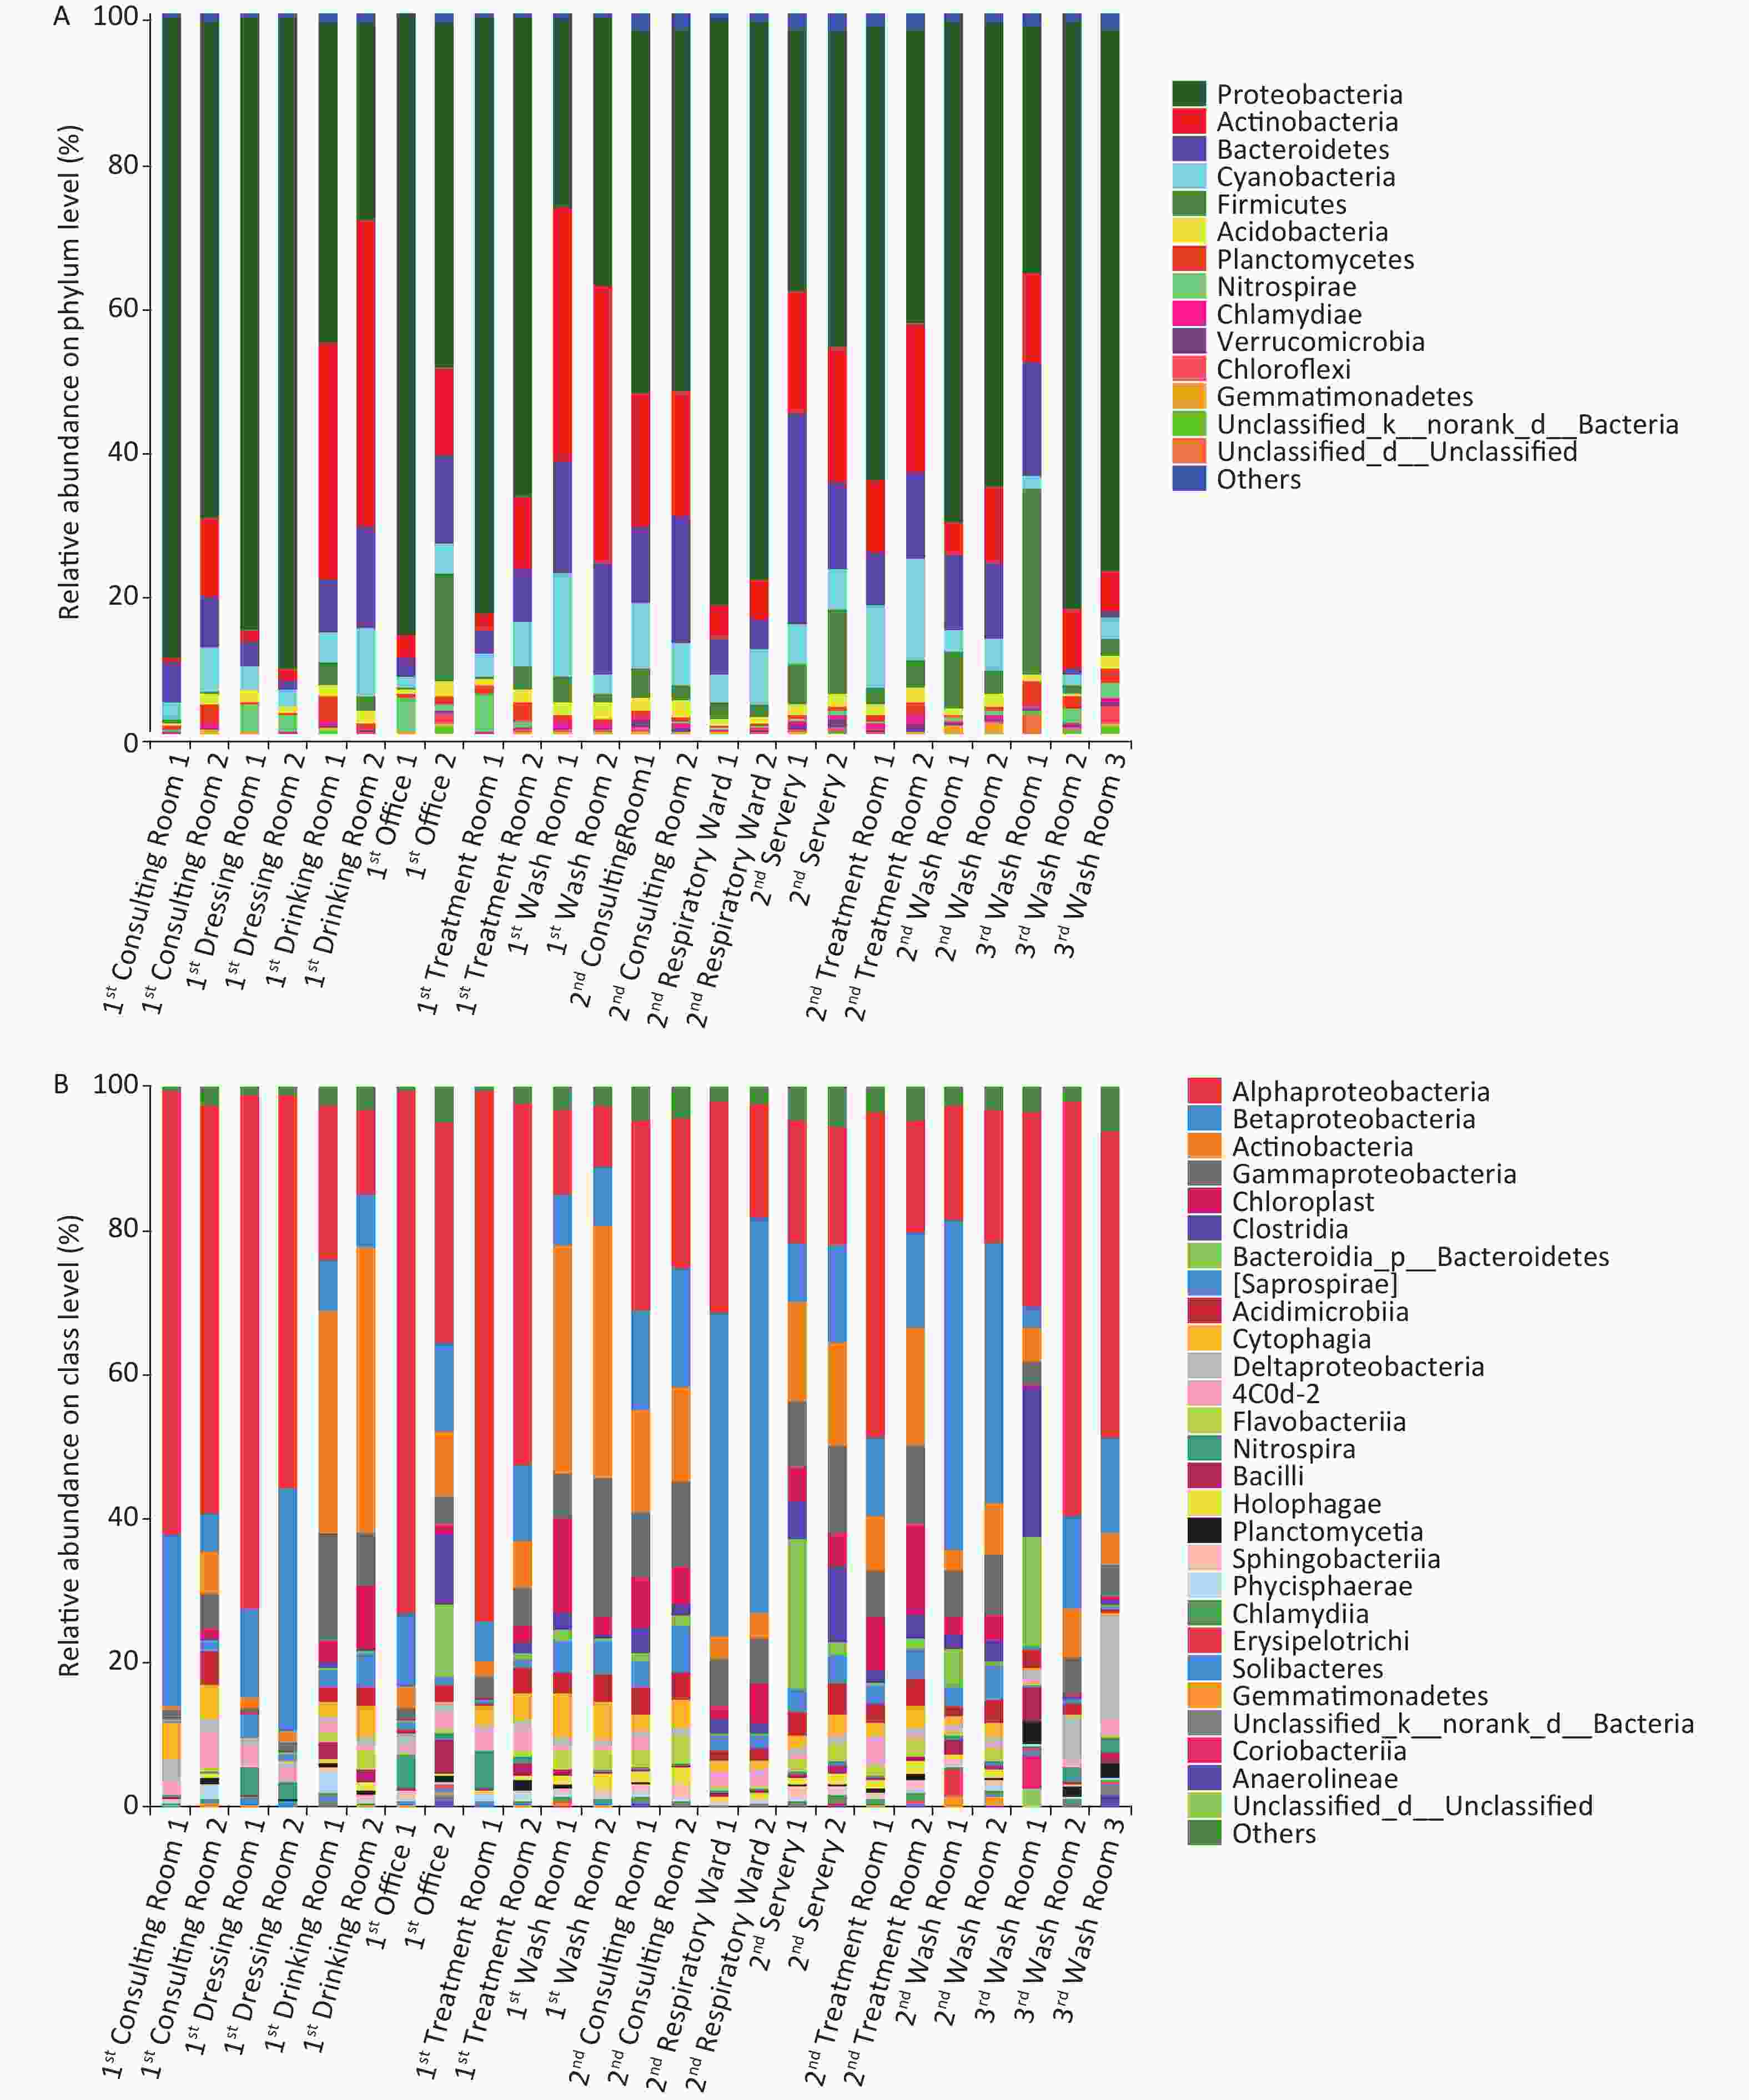
Figure 2. Relative abundance of bacterial phyla (A) and class (B) at each sampling site.
X var Y var MICe (strength) TICe (presence of relationship) MICe-p2
(nonlinearity)MASe (non-monotonicity) MEVe (functionality) MCNe (complexity) Linear regression (p) Mycobacterium Methylosinus 0.9427 0.7910 0.2105 0.0469 0.9427 2.5850 0.8557 Mycobacterium Sediminibacterium 0.8411 0.3093 0.2678 0.0937 0.8411 3.5850 0.7572 Mycobacterium Polaromonas 0.8325 0.2773 0.7527 0.3929 0.8325 3.5850 0.2825 Mycobacterium Limnohabitans 0.7983 0.4796 0.1878 0.1930 0.7983 3.3219 0.7813 Mycobacterium Gallionella 0.7983 0.3781 0.5821 0.2022 0.7983 3.3219 0.4650 Mycobacterium Gemmatimonas 0.7286 0.4796 0.2345 0.1060 0.7286 3.5850 0.7029 Mycobacterium Polynucleobacter 0.7102 0.2516 0.6682 0.2770 0.7102 3.3219 0.2049 Mycobacterium Novosphingobium 0.7090 0.2516 0.4944 0.1326 0.7090 3.5850 −0.4633 Mycobacterium Methyloversatilis 0.7027 0.3851 0.5761 0.1588 0.7027 3.0000 −0.3557 Mycobacterium Synechococcus 0.6994 0.3150 0.6749 0.1601 0.6994 3.0000 0.1567 Mycobacterium Enhydrobacter 0.6840 0.4636 0.2253 0.1263 0.6840 3.0000 0.6773 Mycobacterium Bdellovibrio 0.6656 0.4636 0.5334 0.1015 0.6656 3.3219 −0.3635 Mycobacterium Staphylococcus 0.6614 0.4045 0.4145 0.1397 0.6146 3.5850 0.4968 Mycobacterium Opitutus 0.6343 0.3851 0.6026 0.0782 0.6343 3.5850 0.1780 Mycobacterium Flavobacterium 0.6227 0.3857 0.5102 0.1519 0.6227 3.5850 0.3354 Mycobacterium Ralstonia 0.6155 0.2516 0.3426 0.0810 0.6155 3.5850 0.5224 Mycobacterium Fluviicola 0.6146 0.4045 0.0333 0.0567 0.6146 3.5850 0.7624 Mycobacterium Arcobacter 0.6094 0.2816 0.3572 0.1801 0.6094 3.5850 0.5022 Mycobacterium Crenothrix 0.6041 0.3377 0.3639 0.1843 0.6041 3.3219 0.4901 Mycobacterium Mycoplana 0.6041 0.3150 0.6039 0.2381 0.6041 3.3219 −0.0150 Mycobacterium Methylotenera 0.6002 0.3150 0.3959 0.1895 0.6002 3.5850 0.4520 Mycobacterium Blautia 0.5511 0.3093 0.5509 0.1539 0.5511 3.5850 0.0141 Table S4. The MINE analysis between Mycobacterium and other microbial genera in the hospital water system
The main differences between the microbial community in phylum and class (top 20) in different groups are shown in Supplementary Tables S5–S6, available in www.besjournal.com. For the three buildings, the significant differences in abundance (top 20) were observed in Verrucomicrobia (P < 0.01), Gemmatimonadetes (P < 0.01), Synergistetes (P < 0.01) at the phylum level, and in Deltaproteobacteria (P < 0.01), Planctomycetia (P < 0.01), Holophagae (P < 0.05) and Sphingobacteriia (P < 0.01) at the class level. For the two types of faucets, the relative abundances of microorganisms (top 10) were different. The relative abundances of Firmicutes (phylum, P < 0.01), Verrucomicrobia (phylum, P < 0.01), Clostridia (class, P < 0.01), and Gammaproteobacteria (class, P < 0.05) in samples taken from manual faucets were higher than those in samples taken from automatic faucets.
Phylum Relative abundance of bacteria in
three buildings (%)Class Relative abundance of bacteria in
three buildings (%)Genus Relative abundance of bacteria in
three buildings (%)Building 1 Building 2 Building 3 Building 1 Building 2 Building 3 Building 1 Building 2 Building 3 Proteobacteria 62.62 57.88 63.89 Alphaproteobacteria 43.62 22.11 42.52 Novosphingobium 21.07 2.02 2.37 Actinobacteria 16.08 12.68 8.66 Betaproteobacteria 12.05 25.74 9.55 Mycobacterium 10.34 7.07 4.71 Bacteroidetes 7.89 11.96 5.87 Actinobacteria 13.97 9.62 5.33 Sphingomonas 7.89 6.50 6.51 Firmicutes 2.54 4.58 9.92 Gammaproteobacteria 5.73 8.67 4.33 Schlegelella 0.03 8.90 < 0.01 Cyanobacteria 5.03 7.05 2.10 Clostridia 1.38 3.43 7.44 Hyphomicrobium 0.41 0.60 5.46 Planctomycetes 1.20 0.68 2.44 Deltaproteobacteria 1.13 cf 0.61 bf 7.35 bf, cf Pseudomonas 1.75 2.52 0.29 Acidobacteria 1.41 1.47 0.93 Chloroplast 2.78 5.51 0.34 Sediminibacterium 1.37 2.13 0.09 Nitrospirae 1.58 0.36 1.40 Acidimicrobiia 1.96 2.97 1.70 Nitrospira 1.57 0.22 1.34 Chloroflexi 0.22 0.24 0.82 Saprospirae 2.15 3.50 bd 0.34 bd Bradyrhizobium 1.44 0.76 0.60 Chlamydiae 0.31 0.57 0.35 Cytophagia 2.88 2.13 0.19 Sphingopyxis 0.26 1.78 0.42 Verrucomicrobia 0.12 af 0.57 af 0.48 Bacilli 1.08 0.65 2.26 Erythromicrobium 1.52 0.17 0.69 Gemmatimonadetes 0.25 af 0.36 af,bf 0.15 bf Nitrospira 1.58 0.36 1.40 Rhodococcus 1.89 ad < 0.01ad < 0.01 Armatimonadetes 0.01 0.64 0.04 Planctomycetia 0.47 cf 0.30 bf 2.27 bf, cf Flavobacterium 0.41 ae 1.42 ae,be 0.03 be Tenericutes 0.04 0.10 0.16 Flavobacteriia 1.04 1.73 0.15 Polynucleobacter 0.22 af 1.50 af,be 0.06 be Spirochaetes 0.07 0.04 0.14 Holophagae 0.56 ad 1.25 ad,bd 0.08 bd Janthinobacterium 0.15 af 1.49 af,be 0.03 be Synergistetes < 0.01 af 0.23 af,be 0.02 be Coriobacteriia 0.03 0.02 1.47 Lactobacillus 0.16 0.33 1.18 Thermi 0.12 0.02 0.01 Sphingobacteriia 0.45 ad 0.96 ad,bd 0.07 bd Rhodobacter 1.00 0.18 0.46 Chlorobi 0.03 0.02 0.07 Phycisphaerae 0.72 0.37 0.17 Methylosinus 0.45 0.55 0.29 Elusimicrobia 0.04 0.02 0.02 Chlamydiia 0.31 0.57 0.35 Ruminococcus 0.15 0.08 1.01 Deferribacteres 0.01 0.02 < 0.01 Anaerolineae 0.08 0.21 0.61 Acinetobacter 0.13 cf 0.07 bf 0.89 bf,cf Note. a significant difference between building 1 and building 2, b significant difference between building 2 and building 3, and c significant difference between building 1 and building 3; d P < 0.05, e P < 0.01, and f P < 0.001. Table S5. Significance test of difference about relative abundances between the samples collected from different buildings, showing the top 20 most abundant bacteria by phylum, class,and genus
Phylum Manual faucet Automatic faucet Class Manual faucet Automatic faucet Proteobacteria 57.41 68.25 Alphaproteobacteria 28.49 48.49 Actinobacteria 14.36 12.71 Betaproteobacteria 19.02 13.40 Bacteroidetes 10.18 7.35 Actinobacteria 11.46 10.62 Cyanobacteria 5.65 5.14 Gammaproteobacteria 7.50 a 5.10 a Firmicutes 5.68 b 1.19 b Chloroplast 4.06 2.56 Acidobacteria 1.38 1.36 Cytophagia 1.69 3.46 Nitrospirae 0.80 1.64 Saprospirae 2.67 2.07 Planctomycetes 1.15 1.12 Clostridia 3.99 b 0.66 b Chlamydiae 0.47 0.31 Acidimicrobiia 2.50 1.99 Verrucomicrobia 0.46 b 0.10 b Deltaproteobacteria 1.90 1.18 Gemmatimonadetes 0.30 0.24 Nitrospira 0.80 1.64 Chloroflexi 0.38 0.13 Flavobacteriia 1.34 0.95 Armatimonadetes 0.38 0.02 Bacilli 1.31 0.50 Spirochaetes 0.05 0.10 Holophagae 0.89 0.53 Synergistetes 0.14 a 0.0 a Planctomycetia 0.69 0.46 Tenericutes 0.10 a 0.02 a Phycisphaerae 0.45 0.66 Thermi 0.09 0.01 Sphingobacteriia 0.74 a 0.33 a Elusimicrobia 0.02 a 0.06 a Chlamydiia 0.47 0.31 Chlorobi 0.04 0.02 Solibacteres 0.17 0.40 Deferribacteres 0.02 < 0.01 Acidobacteria 0.16a 0.38 a Note. a P < 0.05, b P < 0.01. Table S6. Significance test of difference about relative abundances between the samples collected from different faucets, showing the top 20 most abundant bacteria by phylum and class
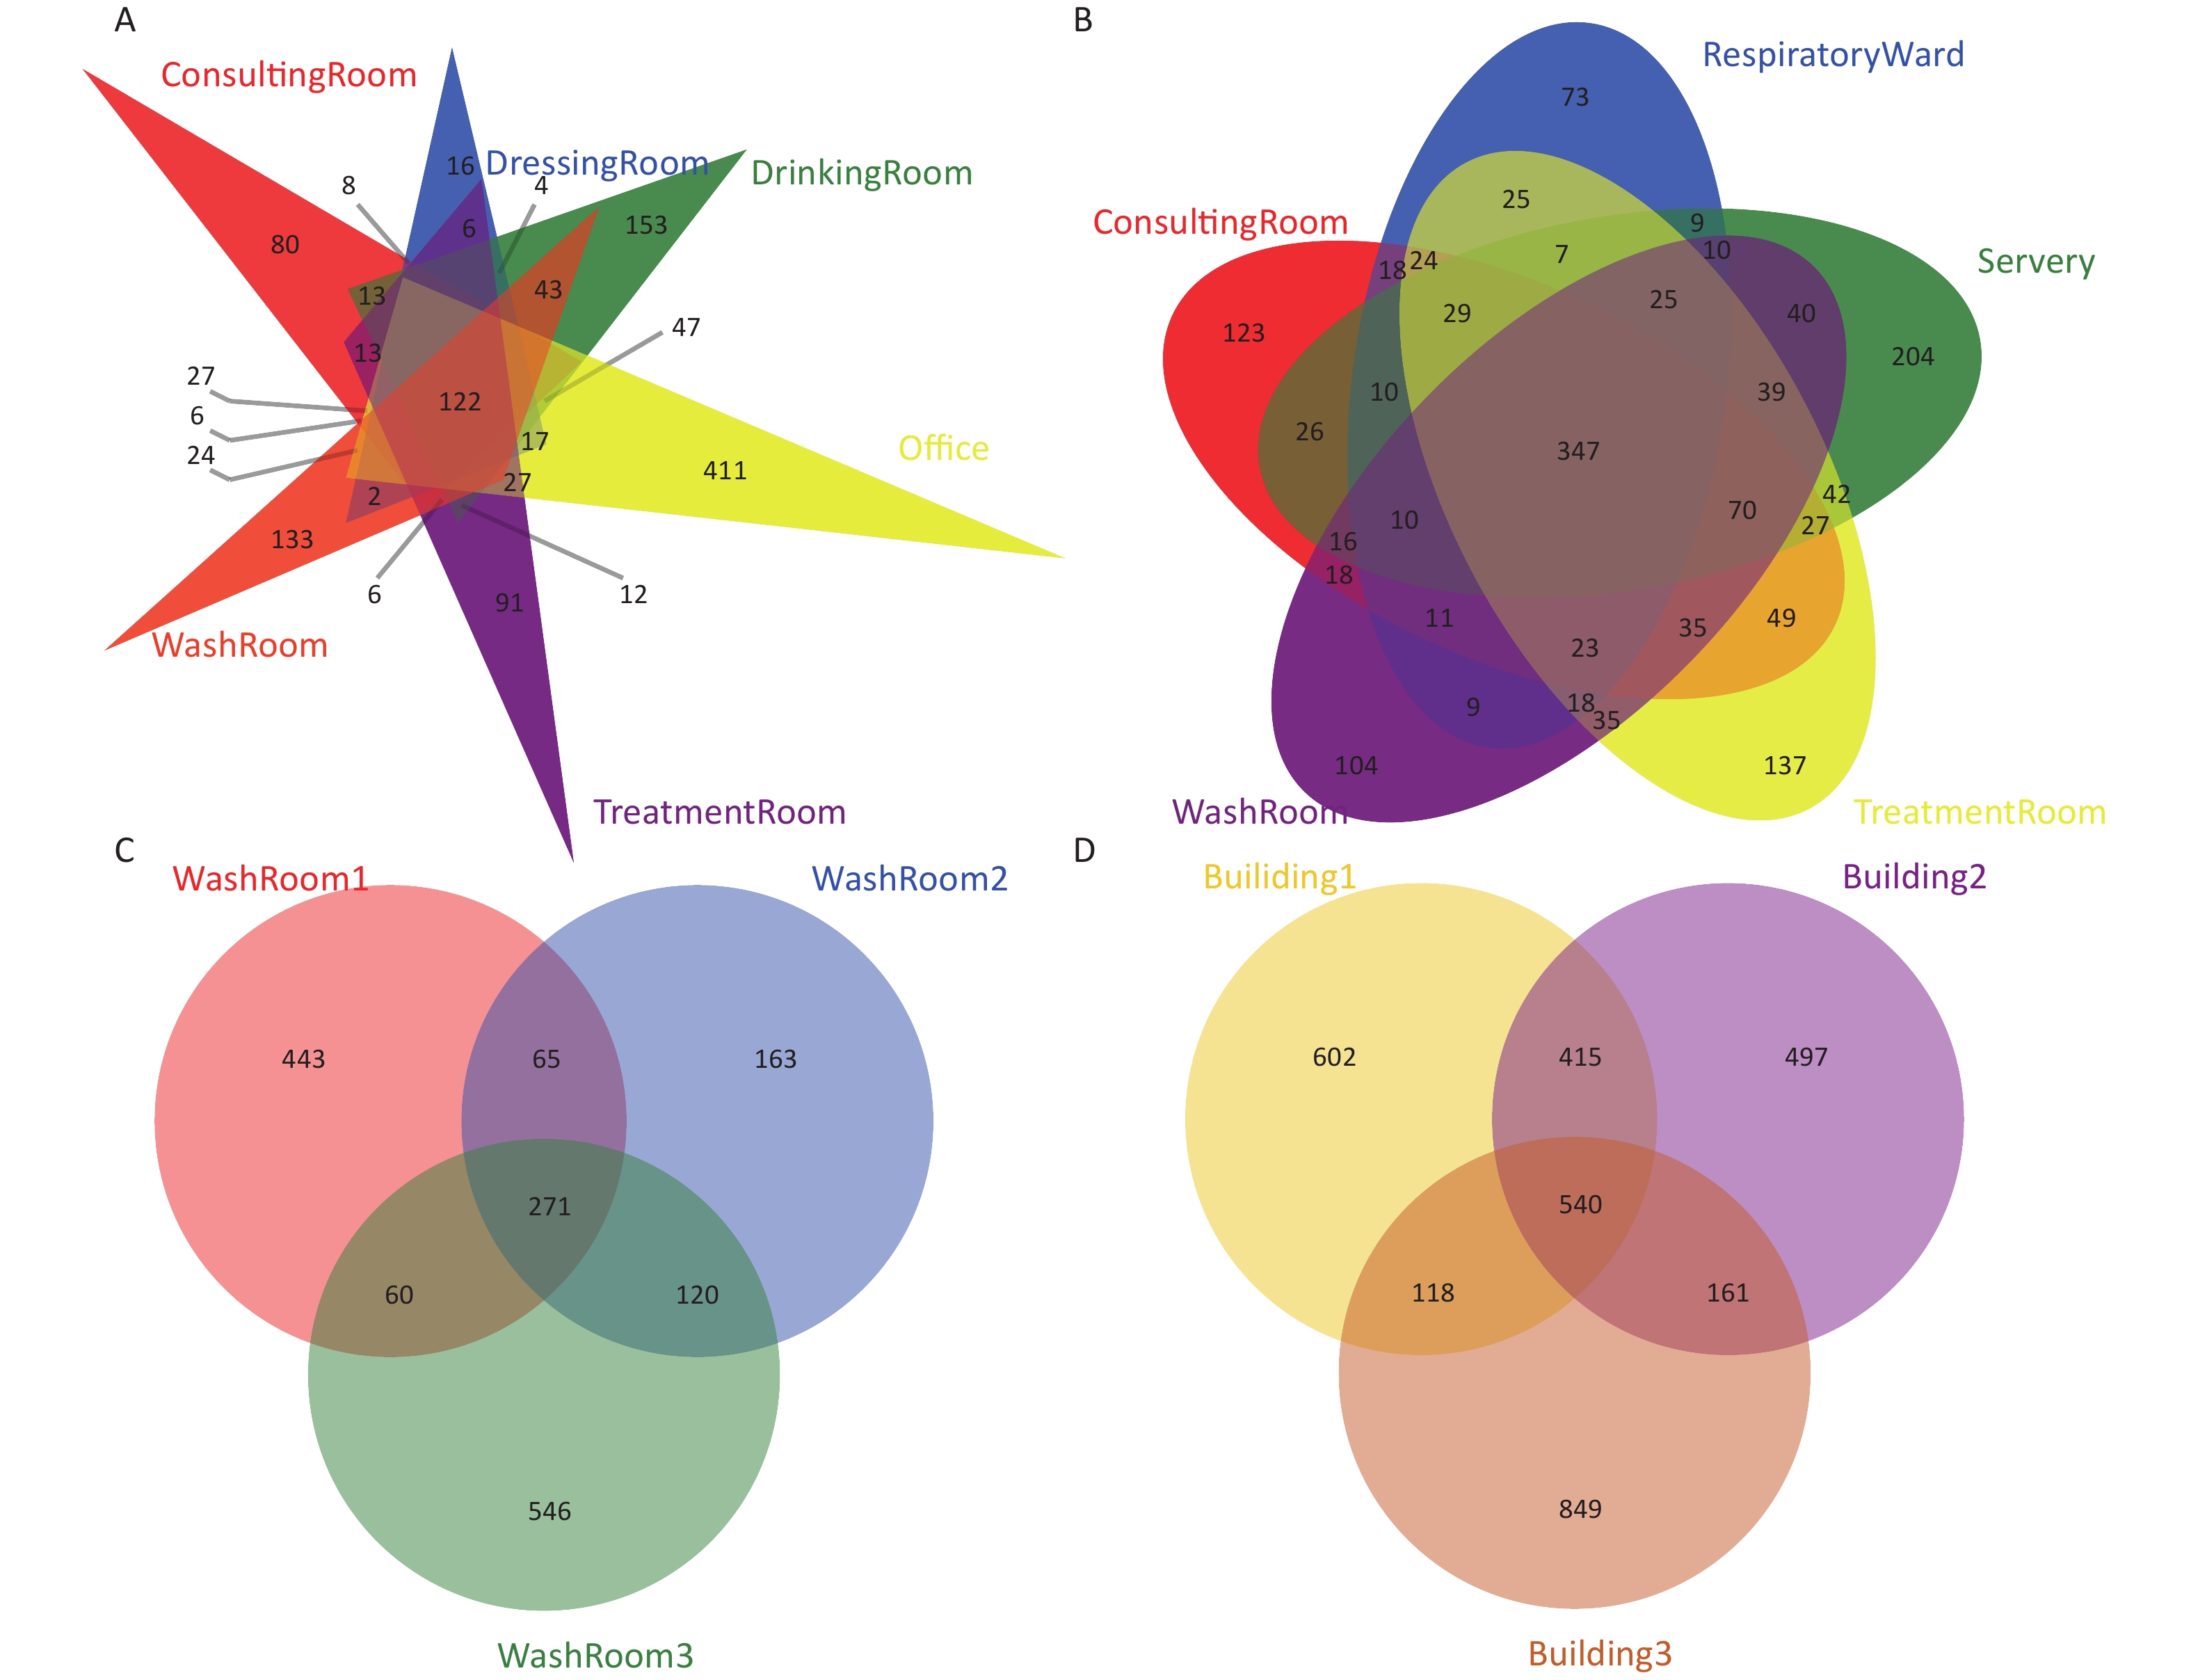
To evaluate the shared OTUs in different building taps in this hospital, Venn diagrams were constructed (Supplementary Figure S1, available in www.besjournal.com). There were 122, 347, and 271 shared OTUs present in water samples collected from building 1, building 2, and building 3, respectively. Five hundred and forty shared OTUs were found in the three buildings, with the 10 most abundant genera identified as Novosphingobium, Mycobacterium, Sphingomonas, Pseudomonas, Sediminibacterium, Hyphomicrobium, Bradyrhizobium, Nitrospira, Sphingopyxis, and Erythromicrobium.
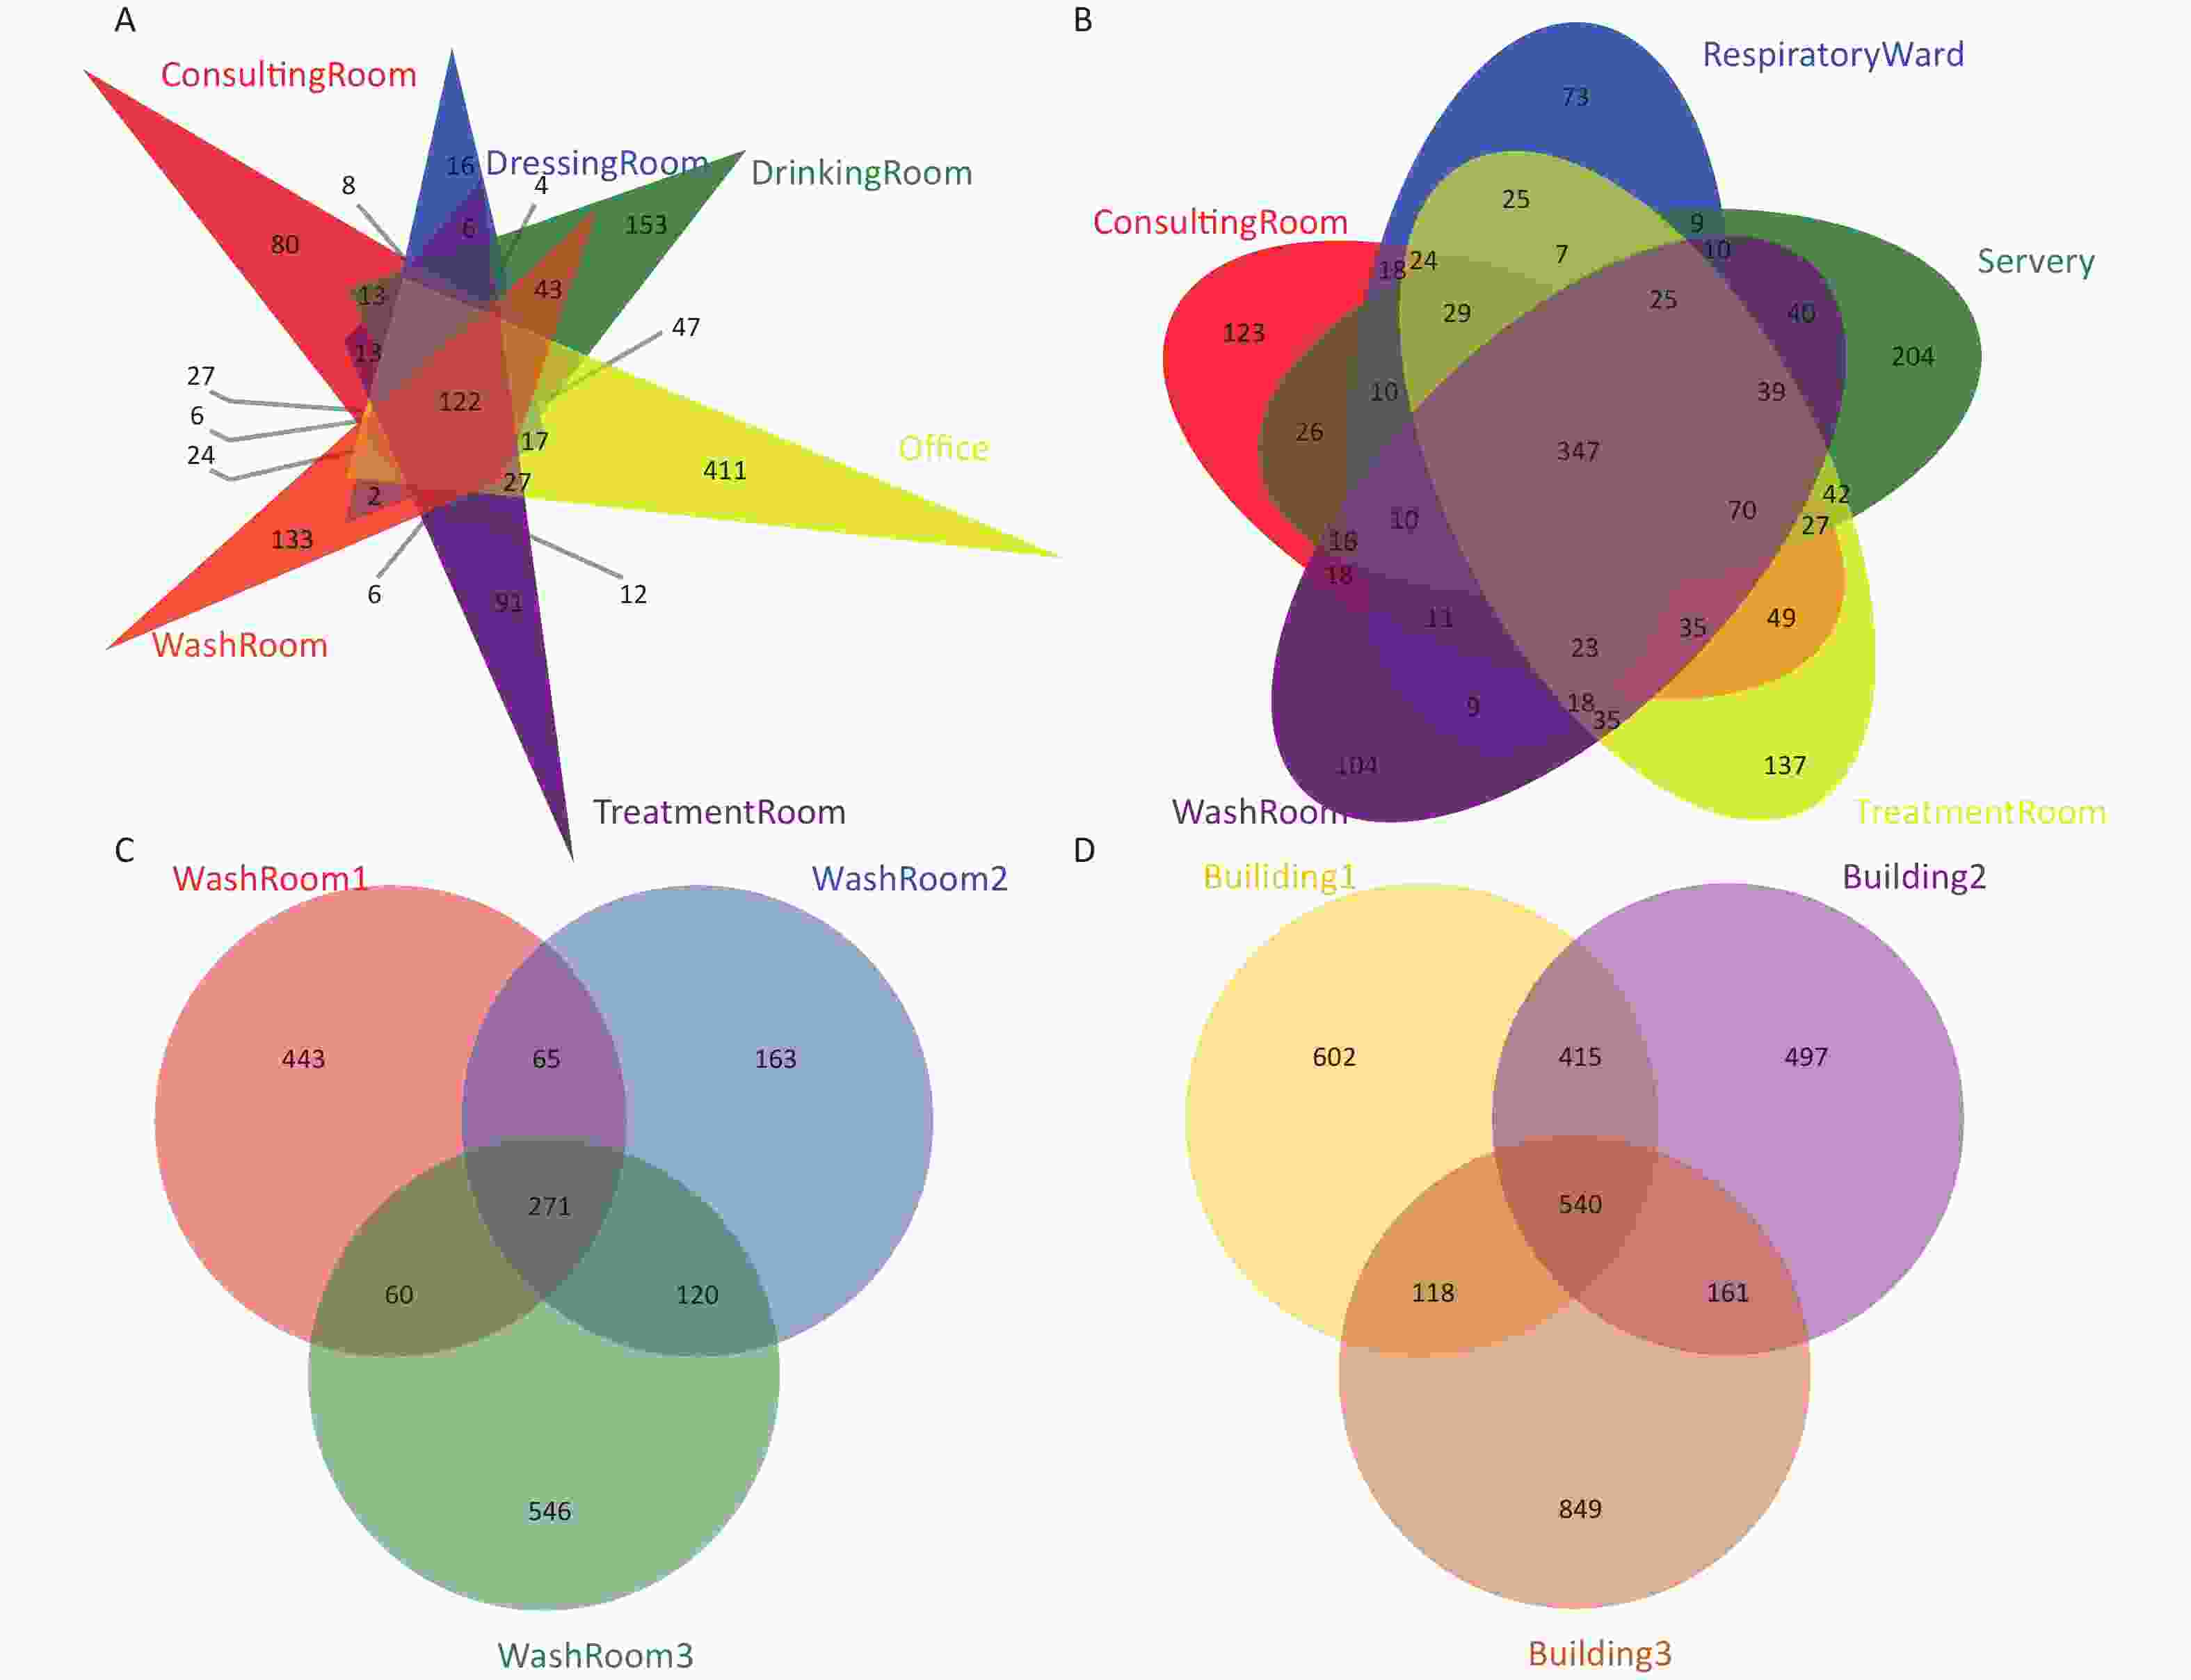
Figure S1. Venn diagrams showing the number of unique and shared OTUs in the hospital water system. (A) The number of unique and shared OTUs in building 1 (including consulting room, dressing room, drinking room, office, washroom and treatment room samples); (B) The number of unique and shared OTUs in building 2 (including consulting room, respiratory ward, servery, treatment room, and washroom samples); (C) The number of unique and shared OTUs in building 3 (three washroom samples); (D) The number of unique and shared OTUs among the three buildings
Microbial community richness and diversity indices in all the water samples are shown in Supplementary Table S7, available in www.besjournal.com. The coverage of all samples was above 99.7%, showing that sequencing depth was sufficient in this work. There were significant differences in the Sobs, ACE and Chao1 indexes in three buildings (P < 0.05), indicating the variation of the richness and diversity of the microbial community in different buildings.
Sample Coverage Sobs ACE Chao Shannoneven Simpsoneven Shannon Simpson 1st Consulting room 1 0.9988 377 419 426 0.4875 0.0188 2.89 0.141 1st Consulting room 2 0.9984 476 528 551 0.6162 0.0225 3.80 0.093 1st Dressing room 1 0.9995 244 260 265 0.5214 0.0256 2.87 0.160 1st Dressing room 2 0.9992 317 344 344 0.5031 0.0228 2.90 0.138 1st Drinking room 1 0.9991 492 522 564 0.6684 0.0355 4.14 0.057 1st Drinking room 2 0.9994 443 458 456 0.6520 0.0312 3.97 0.072 1st Office 1 0.9979 430 509 527 0.4498 0.0104 2.73 0.223 1st Office 2 0.9990 887 915 929 0.7244 0.0371 4.92 0.030 1st Treatment room 1 0.9993 310 339 340 0.4527 0.0122 2.60 0.264 1st Treatment room 2 0.9990 546 582 587 0.6478 0.0313 4.08 0.060 1st Wash room 1 0.9991 442 475 489 0.6699 0.0408 4.08 0.055 1st Wash room 2 0.9993 348 367 381 0.6404 0.0406 3.75 0.071 2nd Consulting room 1 0.9987 606 637 647 0.7293 0.0607 4.67 0.027 2nd Consulting room 2 0.9982 659 695 709 0.7072 0.0544 4.59 0.028 2nd Respiratory ward 1 0.9989 538 581 596 0.4911 0.0102 3.09 0.183 2nd Respiratory ward 2 0.9982 483 542 551 0.4742 0.0084 2.93 0.246 2nd Servery 1 0.9982 704 734 751 0.7433 0.0725 4.87 0.020 2nd Servery 2 0.9994 610 627 638 0.7681 0.0849 4.93 0.019 2nd Treatment room 1 0.9976 676 734 736 0.6788 0.0502 4.42 0.030 2nd Treatment room 2 0.9974 758 808 829 0.7060 0.0458 4.68 0.029 2nd Wash room 1 0.9979 576 633 638 0.5531 0.0112 3.52 0.155 2nd Wash room 2 0.9988 652 679 682 0.6500 0.0203 4.21 0.076 3rd Wash room 1 0.9995 901 919 925 0.7346 0.0396 5.00 0.028 3rd Wash room 2 0.9997 647 654 661 0.6244 0.0231 4.04 0.067 3rd Wash room 3 0.9993 1,046 1,069 1,094 0.6587 0.0240 4.58 0.040 Table S7. Bacterial community richness and diversity indices in all the water samples
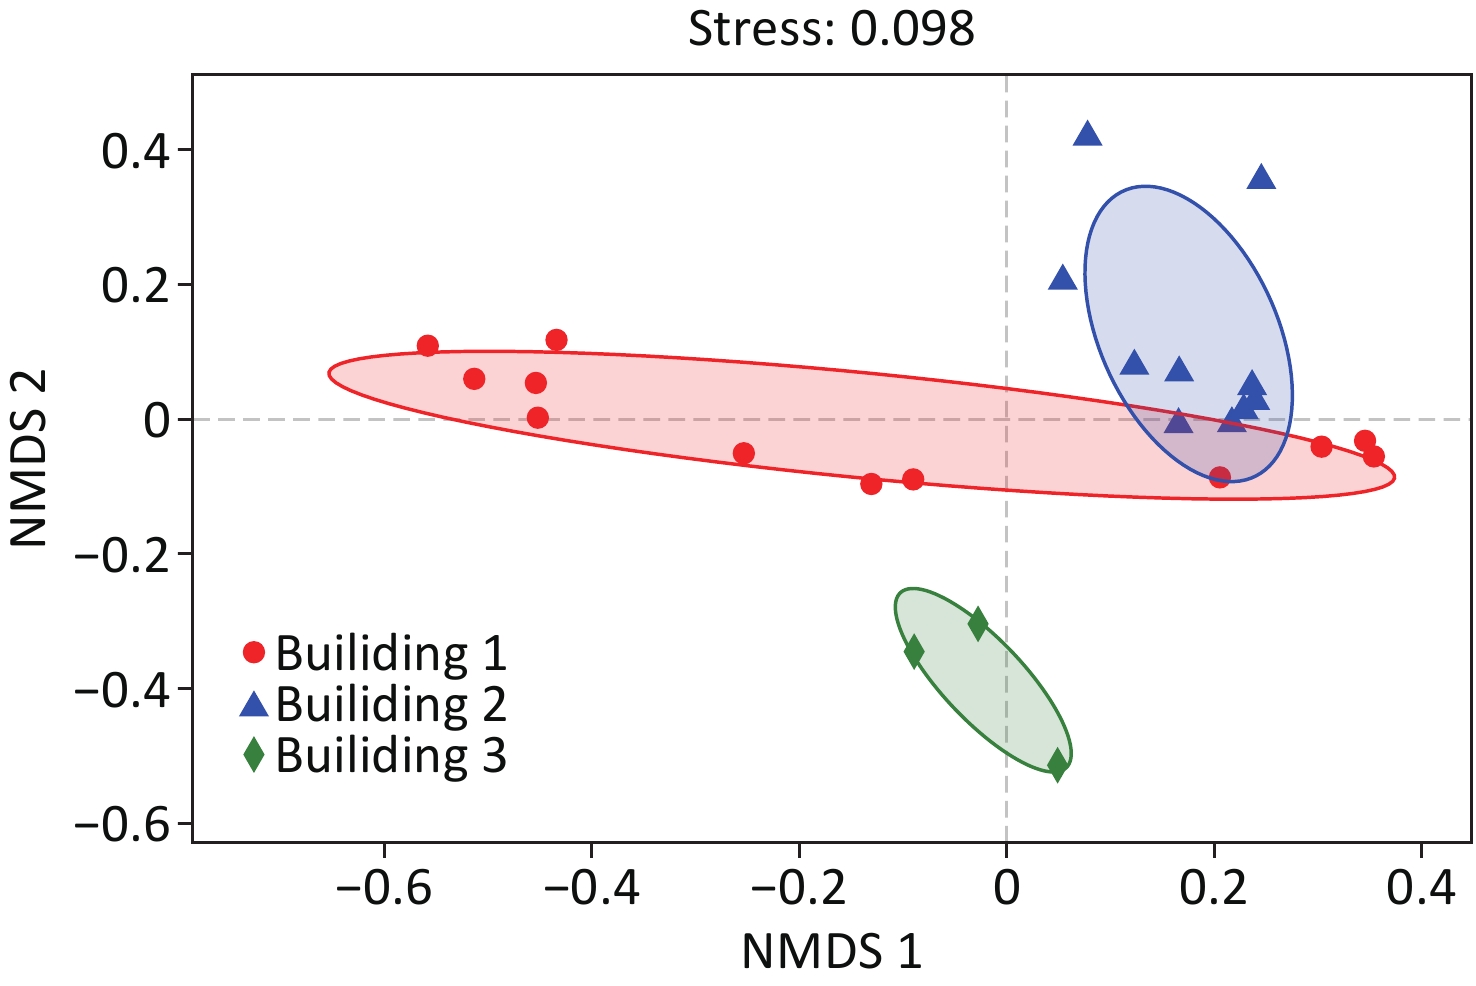
NMDS analysis of the samples based on Bray-Curtis distance matrices is illustrated in Figure 3. The result showed that the samples were clustered into three groups by different buildings. However, the samples of washroom and drinking room water collected from building 1 clustered closer to those of building 2, suggesting higher community similarity to building 2 water samples than the rest in building 1. ANOSIM analysis also demonstrated the difference in microbial community structures between different buildings (r = 0.44, P = 0.001).
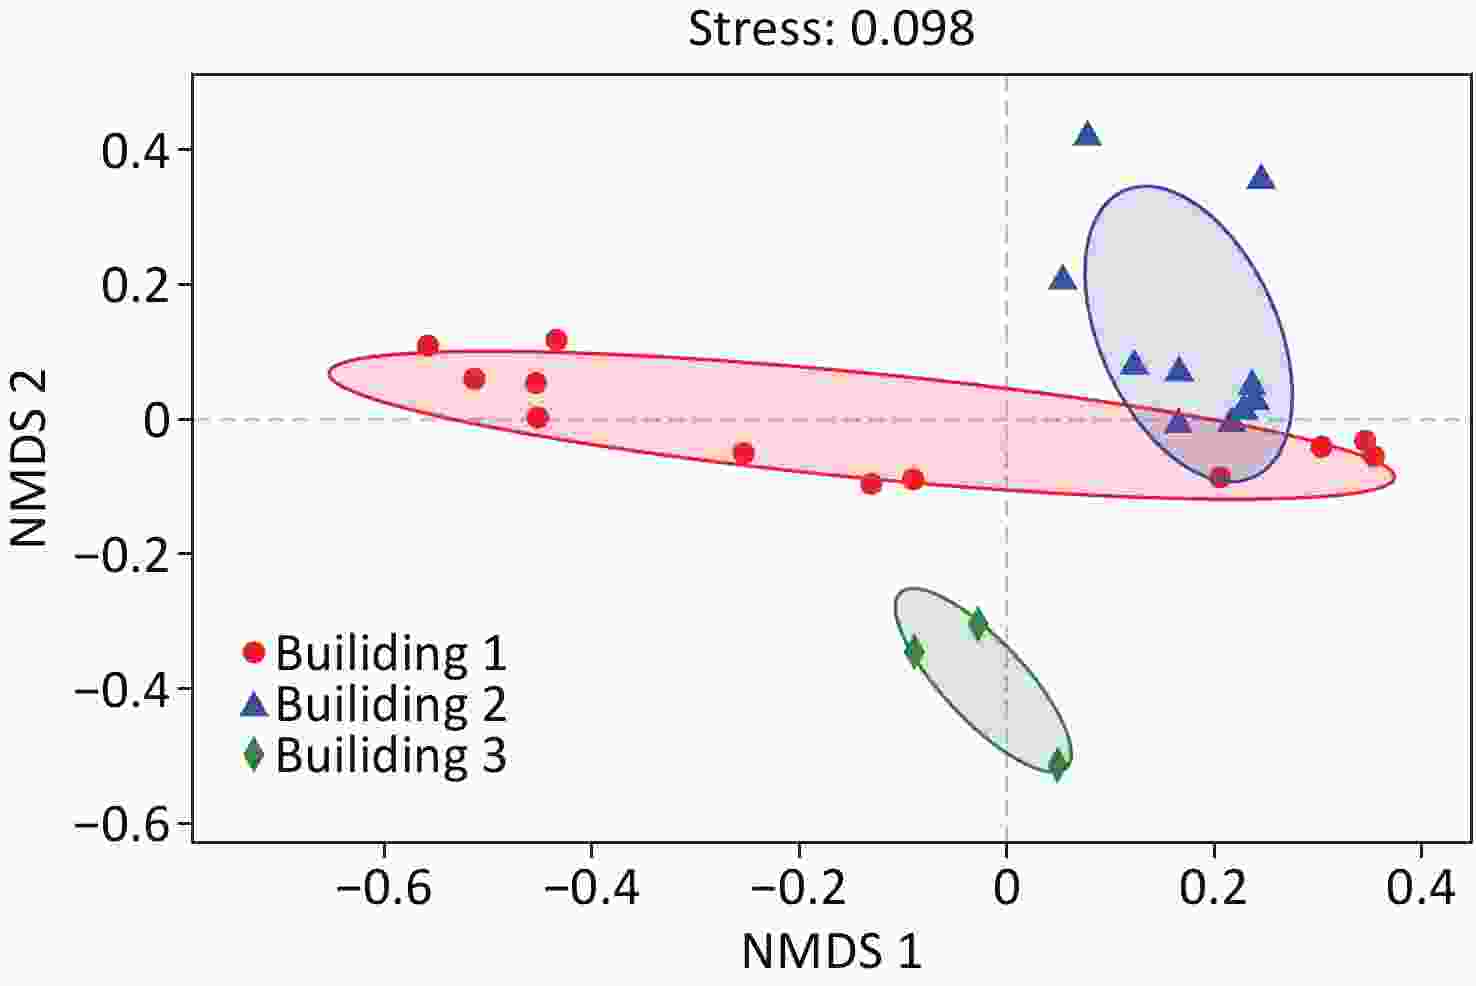
Figure 3. NMDS analysis of bacterial communities in the hospital water system, color-coded by sampling building. NMDS ordination was derived from pairwise Bray-Curtis distances matrices.
-
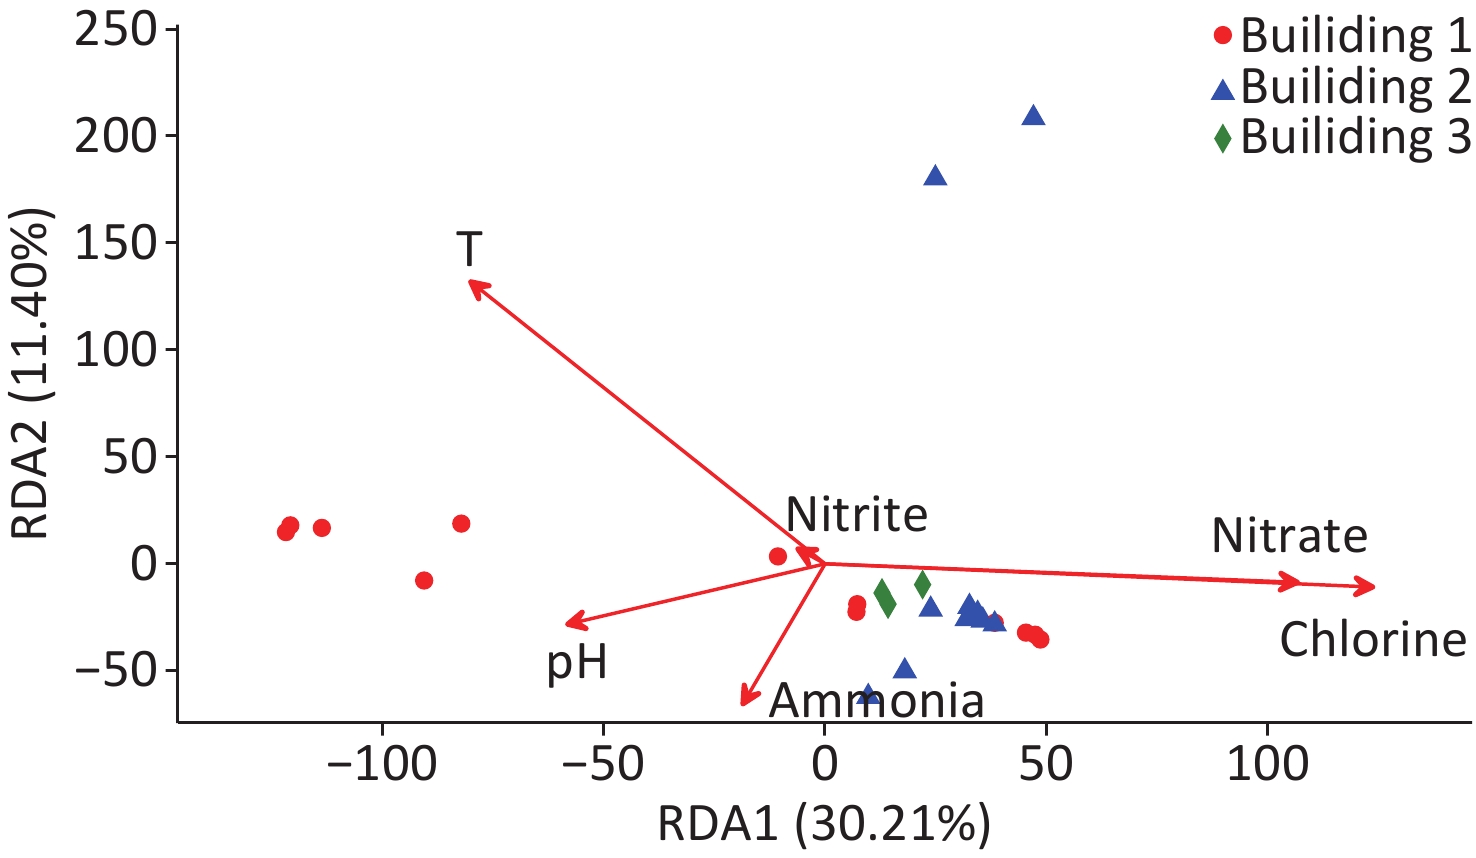
The relationships between water quality properties and microbial community composition were assessed with RDA (Figure 4). RDA1 axis showed a significant correlation with temperature, chlorine, and nitrate (P < 0.05), and the RDA2 axis showed a significant correlation with temperature (P < 0.05). Over 41.6% of the variation in bacterial community composition can be explained by the RDA1 axis and RDA2 axis. Similar to NMDS (Figure 3), the RDA results showed that the samples from building 3 tightly clustered into a group, and the samples from building 2 had the similar trend except that two samples were taken from the respiratory ward (i.e., points located in the upper of the figure); however, the samples collected from building 1 dispersed without obvious clustering. Total chlorine, nitrate, and temperature were the major environmental driver factors, showing a significant correlation with the bacterial community composition (P < 0.05).
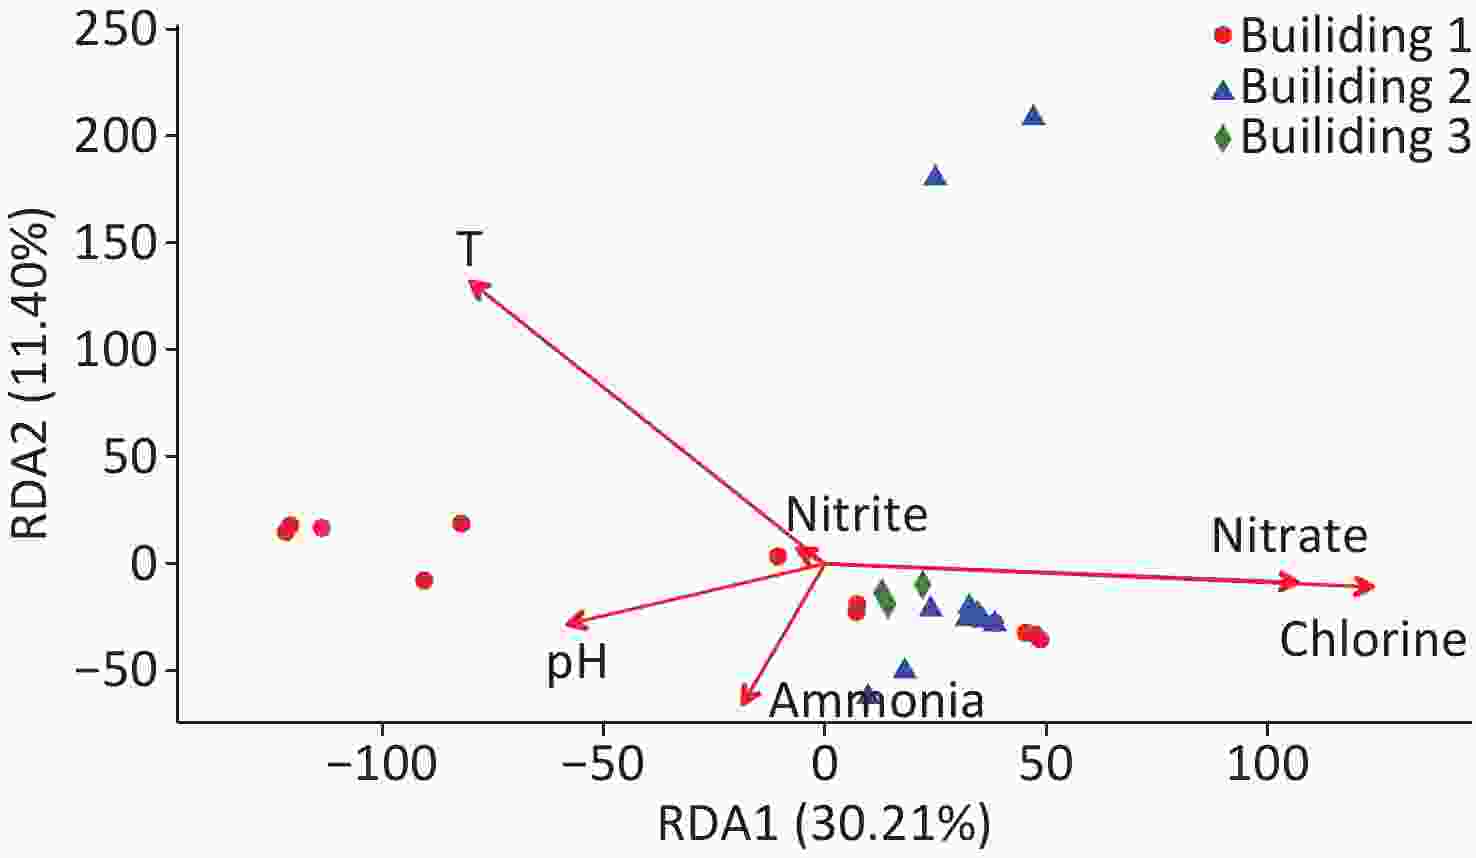
Figure 4. Redundancy analysis (RDA) of the bacterial community in the hospital water samples. RDA correlation plot showing variance in bacterial community composition explained by the water quality properties.
-
This research revealed a high prevalence of Legionella spp. and Mycobacterium spp. in water faucets and provided insight into these opportunistic pathogens and the broader bacterial community composition in a respiratory disease hospital water system, which may have implications for reducing microbial contamination risks of hospital water supplies.
Legionella spp. and Mycobacterium spp. were ubiquitously found in water supply systems, such as drinking water treatment trains, premise plumbing, water reservoirs, water storage tanks, water heaters and showerheads[28-33]. Because of the complexity of hospital water systems and the vulnerability of hospitalized patients, many of the infections associated with opportunistic pathogens have been reported in hospital environments[34]. However, to our knowledge, there have been few reports on a large-scale specialized respiratory system hospital in China using culture-independent methods.
In this study, Legionella spp. and Mycobacterium spp. were ubiquitously present (100%) in the hospital water system, while M. avium was only found in buildings for medical services. The finding was similar to one previous study on secondary water supply systems in Shanghai, demonstrating the ubiquity of Legionella and mycobacterial genera and the absence of M. avium in public and residential buildings[35]. Another one-year survey of opportunistic pathogens in the tap-water (including hospital, hotel, school, public office, and private dining room) of one northern city of China also showed high detection rates of Legionella spp. and Mycobacterium spp. (i.e., 100% FOD in 44 samples) by qPCR[36]. However, lower FOD of Legionella was also reported in private hospitals and university hospitals in Italy, which used chlorine dioxide as disinfection rather than chloramine[37,38].
NTM are environmental mycobacteria other than Mycobacterium tuberculosis and Mycobacterium leprae. Species such as M. avium, M. intracellulare, M. mucogenicum, M. kansasii, M. gordonae, M. fortuitum, and M. chelona are frequently reported opportunistic pathogens for humans. In this study, the high FOD of M. avium in tap water was in contrast to another study isolating NTM from patients in the same hospital during 2008–2012, demonstrating M. kansasii (45.0%), M. intracellulare (20.8%), M. chelonae/abscessus (14.9%) as the most frequently identified clones, with M. avium only accounting for 3.6% of clinical isolates[39]. Although we did not investigate other mycobacterial species in water samples and biofilm samples in the present study, it is likely that the existence of biofilms in the water systems can harbor a high level of opportunistic pathogens and potentially release them into the water. Different analytic methods employed in these two studies might also account for the differences. Our work applied molecular techniques with advantages of lower detection limits and higher specificity, while the study employed conventional culture methods, which was considered as the gold standard for identifying live pathogens[39]. It is also possible that the composition of Mycobacterium spp. in this hospital may demonstrate temporal changes.
Ecological interactions among bacteria are ubiquitous and complex in water, the pattern of which is determined by the bacterial population and water quality parameters[40]. As shown in Supplementary Table S4, MINE analysis identified 22 statistically significant associations between Mycobacterium spp. and other microbial genera, such as Methylosinus, Sediminibacterium, Novosphingobium, Bdellovibrio, Staphylococcus, Flavobacterium, and Ralstonia (P < 0.05). Similar to our previous study, the associations between Mycobacterium spp. and four bacteria genera including Novosphingobium, Flavobacterium, Ralstonia, and Arcobacter were found, suggesting their antagonistic or synergistic relationships in water systems[41]. In addition, Flavobacterium can produce some metabolites and components, such as dimethyl polysulfides, which result in the odor in tap water[42]. Notably, a positive significant association was identified between Mycobacterium spp. and pathogenic staphylococcus, which may increase virulence potential in water systems. On the contrary, a negative significant association was found between Mycobacterium spp. and Bdellovibrio. Bdellovibrio is a parasite or predator of other bacteria including some pathogens, which may act as natural inhibitors of bacterial growth in man-made water systems[43].
Chloramine has replaced free chlorine as a disinfectant in municipal water systems in shanghai, because it provides many benefits, including higher stability, lower production trihalomethanes, and haloacetic acids, and improves maintenance of disinfectant residual in distribution pipes[44,45]. Chloramine has been known to penetrate biofilm more strongly compared to chlorine, while it less effectively inactivated microorganisms near the biofilm surface[46]. It is reported that mycobacterial FODs in a chloraminated water potable system was higher than other chlorinated systems[47]. Donohue et al.[48] also found that the levels of NTM in chloraminated water were statistically higher than those in chlorinated water. M. avium was reported as one of the most frequently detected NTM in many water systems. Mycobacteria can be categorized into fast-growing species (colony formation 3–7 d, including M. abscessus, M. chelonae, and M. fortuitum) and slow-growing species (colony formation > 7 d, including M. avium, M. intracellulare, M. xenopi, and M. kansasii)[49,50]. As a slow-growing mycobacterium, M. avium was more disinfectant-resistant than fast-growing species[51].
According to another survey by Coniglio et al.[52], monochloramine was associated with a lower prevalence of Legionella colonization in complex piping systems. However, in our study, the occurrence of Legionella was 100%. Higher Legionella prevalence is likely associated with relatively low disinfectant levels in the present work. About 30% (7/25, 28.0%) of samples had total chorine concentrations lower than 0.5 mg/L, which is the disinfectant concentration recommended for the prevention of Legionellosis by the American Society of Heating, Refrigeration, and Air Conditioning Engineering[53]. In addition, there are many other factors influencing the growth and survival of Legionella species. For example, the free-living amoeba can serve as hosts for Legionella spp., providing an intracellular environment to protect from disinfectants in water systems[54].
Our study showed that the number of M. avium gene copies in water samples collected from the automatic faucet was higher than that collected from the manual faucet (P < 0.01). Faucets were likely to be an important source of healthcare-associated infections. One outbreak of M. mucogenicum bacteremia was reported to be associated with contaminated electronic faucets in a pediatric hematology-oncology department[55]. Studies also demonstrated that Legionella species and Pseudomonas aeruginosa had a similar trend with higher FODs in automatic/sensor (no-touch)/electronic faucets[56,57]. Some possible reasons included: low water flow, materials of electronic faucets internal components, bacterial colonization of internal magnetic valves and retrograde contamination from the faucet outlet[58].
Hospital water systems are complex ecosystems that colonize trillions of microorganisms interacting with each other and with their environment. Nitrate was one of the major drivers in microbial composition across all samples in this study (Figure 4). High relative abundances of Nitrospira has also been noted in our study. It has been reported that nitrification can occur in a chloraminated system, which can promote the growth of nitrifying bacteria[59]. Nitrification can also reduce water quality, leading to inadequate disinfectant residual and shift of microbial community structures[28].
Proteobacteria, one of the bacterial phyla with highest abundance in environmental water samples, was the most abundant phylum of gram-negative bacteria, mainly including five classes, viz Alphaproteobacteria, Betaproteobacteria, Gammaproteobacteria, Deltaproteobacteria, and Epsilonproteobacteria[60-62]. Proteobacteria widely existed in water systems, which is consistent with previous studies[35,63]. For example, Vaz-Moreira et al.[63] reported that Alphaproteobacteria predominated in tap water, while Gamma dominated in source water. The ubiquitous tap water genera comprised Proteobacteria of the class Alpha- (Blastomonas, Brevundimonas, Methylobacterium, Sphingobium, Sphingomonas), Beta- (Acidovorax, Ralstonia), and Gamma- (Acinetobacter and Pseudomonas). At phylum level, the relative abundances of Verrucomicrobia (P < 0.01) and Gemmatimonadetes (P < 0.01) were noted among the three hospital buildings. Verrucomicrobia and Acidobacteria classified as ‘sensitive taxa’ could act as biomarkers to distinguish samples between source and tap water according to a study by Han et al.[1], which assessed the impact of source water on tap water bacterial communities in 46 drinking water supply systems in China.
Several bacterial genera with a relatively high abundance were known to contain pathogenic species. Mycobacterium was (8.36%) the second most prevailing genus in all the water samples. Mycobacterium contained a series of pathogenic species, such as M. abscessus, M. chelonae, M. avium, M. gordonae, and M. kansasii. According to some studies, NTM infection in hospitals should consider the possibility of patient colonization or environmental contamination. In particular, M. gordonae derived from contamination of water supply systems or other environmental sources have been associated with the pseudo-outbreaks of hospital infection[18, 64]. In the Pseudomonas genus, some species, such as P. aeruginosa, can cause serious infections in immunocompromised patients with cancer, severe burns, and cystic fibrosis[65]. 30% to 50% of nosocomial infections by P. aeruginosa were caused by contaminated water in ICU wards, and the types of faucets and connecting pipes materials are important factors influencing the prevalence of P. aeruginosa[66].
-
Our results showed a ubiquitous presence of Legionella spp., Mycobacterium spp., and M. avium in the pulmonary hospital drinking water system, implying the hospital water system is an important reservoir for opportunistic pathogens. High-throughput sequencing indicated that a shared community of bacteria, mainly including Novosphingobium, Mycobacterium, and Sphingomonas, was present constantly in the three hospital buildings. The relative abundances of Firmicutes (phylum), Verrucomicrobia (phylum), Clostridia (class), and Gammaproteobacteria (class) in samples taken from manual faucets were higher than that those of samples taken from automatic faucets. Disinfectant residuals, nitrate, and temperature could significantly affect opportunistic pathogens and microbial diversity in a hospital water system. Our study also showed different pathogen contamination levels and variations of microbial community structures in different hospital buildings, implying their significant role in shaping the drinking water microbiome and determining the pathogen occurrence rates. Further research needs to focus on the survival mechanisms of opportunistic pathogens, such as M. avium, in hospital water systems and approaches to reduce risks of microbial contamination.
-
The authors declare that they have no competing interests.
Prevalence of Opportunistic Pathogens and Diversity of Microbial Communities in the Water System of a Pulmonary Hospital
doi: 10.3967/bes2020.034
Funds:
This work was supported by the National Natural Science Foundation of China [No. 51878468 and No. 51508397]; the Hospital Management Research Fund of Shanghai Medical Association [No. Q1902037]; the Fundamental Research Funds for the Central Universities; and the National Major Science and Technology Project for Water Pollution Control and Treatment [No. 2017ZX07201002]
- Received Date: 2019-06-05
- Accepted Date: 2020-02-20
-
Key words:
- Opportunistic pathogen /
- Microbial community /
- Hospital water system /
- Mycobacterium avium
Abstract:
| Citation: | TANG Wei, MAO Yu, LI Qiu Yan, MENG Die, CHEN Ling, WANG Hong, ZHU Ren, ZHANG Wei Xian. Prevalence of Opportunistic Pathogens and Diversity of Microbial Communities in the Water System of a Pulmonary Hospital[J]. Biomedical and Environmental Sciences, 2020, 33(4): 248-259. doi: 10.3967/bes2020.034

|

 Quick Links
 DownLoad: