


-
Metabolic syndrome (MetS) is a cluster of cardiovascular and diabetic risk factors, including abdominal obesity, hypertriglyceridemia, decreased high-density lipoprotein cholesterol (HDL), hyperglycemia, and hypertension[1,2]. One-quarter of adults were estimated to have MetS worldwide in 2015[3]. Driven by the growing obesity epidemic, the prevalence of MetS in children has increased over the recent decades[4,5]. MetS in childhood is likely to develop into lifelong health threats, predisposing the individuals to MetS, type 2 diabetes, and cardiovascular diseases (CVD) in adulthood[6,7]. Early screening of MetS in youths is considered to be an effective primary care strategy for preventing cardiovascular and metabolic diseases[6,7].
Although the components of MetS are mostly determined by objective approaches (e.g., laboratory tests), noninvasive and easy adiposity-related anthropometric measurements such as body mass index (BMI) and waist circumference have been proposed as feasible alternatives for identifying MetS in early stages because of the robust relationship between childhood obesity and MetS[4,8]. Many studies have reported good predictive capabilities of anthropometric indices for MetS among children and adolescents, with the area under receiver operating characteristic (ROC) curve (AUC) greater than 0.7[9-13]. For instance, one study on 16,914 participants aged 7–17 years reported that BMI z-score, waist circumference z-score, and waist-height ratio showed a good prediction for MetS with AUCs around 0.90, and waist-height ratio showed the best performance[10]. There is, however, little evidence on the applicability of anthropometric indices to predict MetS among adolescents with different nutritional status. It is widely observed that the prevalence of MetS is high in overweight and obese population[14]. Some studies have also shown that overweight and obesity without MetS do not increase the risk for CVD, but the presence of MetS significantly increased the risk for CVD and mortality[15,16]; this suggests the importance of identifying MetS in overweight and obese population for early intervention.
By conducting a cross-sectional study in primary and secondary students from seven provinces in China, we aimed to investigate the accuracy of four commonly used adiposity-related anthropometric indices, namely BMI percentile, waist circumference percentile, waist-height ratio, and waist-hip ratio, in identifying MetS among Chinese adolescents with different nutritional status. Our research covers the vast majority of Chinese adolescents, as 92.3% of the enrolled children had completed nine-year compulsory education in China and the enrollment rate of senior high school students was 86.0%[17]. The findings of the present study will contribute to better understanding of the effectiveness of these indices in MetS risk screening.
-
This study used the baseline data of a multicenter intervention study conducted in September 2013. Details of the intervention study have been described in previous publications[18,19]. Briefly, a multistage stratified cluster sampling method was used to recruit adolescents from seven provinces or municipality of China, including Liaoning, Tianjin, Shanghai, Hunan, Guangdong, Ningxia, and Chongqing, which covered all the seven geographical areas of China. In each province or municipality, 12–16 primary and secondary schools were randomly selected, and two classes were randomly selected from each grade for participant recruitment. A total of 16,756 students were recruited in the study. Participants with missing data for anthropometric measurements (n = 694), blood pressure (n = 92), fasting plasma glucose (n = 10), or lipid levels (n = 262) and those aged under 10 years (n = 6,185) were excluded from this study. The final analysis included a total of 9,513 adolescents aged 10–18 years.
This study was approved by the Ethical Committee of the Peking University Health Science Center (Approval No. IRB00001052-13034). Written informed consent was obtained from all the participating students and their parents.
-
At recruitment, height, weight, and waist and hip circumferences were measured by experienced technicians following standard procedures. Standing height was measured to the nearest 0.1 cm using a fixed stadiometer (model RGT-140, China), and body weight was measured using a lever-type weight scale to the nearest 0.1 kg (model TZG, China). Waist and hip circumferences were also measured to the nearest 0.1 cm.
Blood pressure was measured according to the recommendation of the National High Blood Pressure Education Program Working Group in Children and Adolescents[20] by using mercury sphygmomanometers (model XJ11D, China) and stethoscopes (model TZ-1, China). The participants were asked to sit quietly for at least 5 min before the first reading. Systolic blood pressure was determined by the onset of the first Korotkoff sound, and diastolic blood pressure was determined by the fifth Korotkoff sound. Blood pressure was measured twice with a 5-min gap between two measurements, and mean systolic and diastolic blood pressures were calculated.
After an overnight fast of 12 h, venous blood samples (2 mL) were obtained between AM 7:00–9:00 from the antecubital vein of each participant and collected into EDTA vacuum tubes. The samples were centrifuged at 1,509 xg
, aliquoted, and stored at −80 ℃. Levels of fasting plasma glucose, high density lipoprotein (HDL), and triglyceride (TG) were measured at a validated biomedical analysis laboratory. The glucose level was measured using the glucose oxidase method; the HDL level was measured using the clearance method; and the TG level was measured using the enzymatic method. -
Age- and sex-specific BMI percentiles were calculated based on the BMI growth charts for Chinese children and adolescents[21]. Four types of nutritional status, namely lean, normal weight, overweight, and obesity, were defined based on the age- and sex-specific BMI cutoffs equivalent to < 18 kg/m2, 18–23.9 kg/m2, ≥ 24 kg/m2, and ≥ 28 kg/m2 at 18 years of age, respectively[21]. Age- and sex-specific waist circumference percentiles were calculated based on the waist circumference growth charts for Chinese children and adolescents[22]. The waist-height ratio was calculated by dividing waist circumference by height. The waist-hip ratio was calculated by dividing waist circumference by hip circumference.
-
According to the criteria proposed by the International Diabetes Federation[2], MetS is defined by the presence of central obesity (< 16 years old: waist circumference ≥ age- and sex-specific 90th percentile; ≥ 16 years old: waist circumference ≥ 90 cm in males and ≥ 80 cm in females) and at least two other compromised components, including high TG (TG ≥ 1.7 mmol/L), low HDL (< 16 years: HDL < 1.03 mmol/L, ≥ 16 years: HDL < 1.03 mmol/L in males and < 1.29 mmol/L in females), hyperglycemia (fasting plasma glucose ≥ 5.6 mmol/L), and elevated blood pressure (systolic blood pressure ≥ 130 mmHg or diastolic blood pressure ≥ 85 mmHg).
-
Participant characteristics were compared among different nutritional status. Continuous variables were expressed as median and interquartile range, and categorical variables were expressed as frequency and percentage. The normality of continuous data was examined by Lilliefors and Shapiro-Wilk tests, which revealed that continuous variables were not normally distributed. The Kruskal-Wallis test and the chi-square test were used for comparing anthropometric indices and MetS components between different nutritional status. Partial correlations were performed between MetS components and anthropometric indices after adjusting for age and gender. ROC analyses were used to assess the predictive accuracy of anthropometric indices for MetS and its components. The AUC provides a measure of the model’s discriminatory ability. AUC should be greater than 0.5; the closer the AUC is to 1, the better is the diagnostic effect[23]. Pairwise comparisons of AUCs in models predicted using BMI percentile, waist circumference percentile, waist-height ratio, and waist-hip ratio within each group were conducted using the DeLong test[24]. Z test was used for comparing the AUCs predicted using the same variable in the overweight or obese group compared to the normal group. Multivariable logistic regression analysis was conducted for the total population and separately for children with different nutritional status to identify the strength of association of different indices (adjusting for age, sex, ethnicity, region, and home location) and MetS. ROC analyses and comparisons were conducted in MedCalc (MedCalc Software Bvba, Ostend, Belgium), and other statistical analyses were performed using SPSS for Windows (version 21.0, SPSS Inc., Chicago, IL, USA).
-
As shown in Table 1, a total of 9,513 children and adolescents aged 10–18 years were included in the analysis, and 51.5% of the sample were boys. The lean, overweight, and obese rates were 6.9%, 15.8%, and 10.0% respectively, with a larger proportion of boys than girls in the lean and obese groups. Han nationality accounted for the overwhelming majority, and no significant differences in nutritional status were observed between the Han group and the minority ethnicity groups. Each study region consisted of 13.6% to 15.9% of study subjects, and 58.0% of subjects lived in urban areas.
Item Lean group Normal group Overweight group Obese group Overall P N (%) 652 (6.85) 6,409 (67.37) 1,500 (15.77) 952 (10.01) 9,513 (100.00) Age (years, mean $ \pm $ SD) 13.44 ± 2.34 13.39 ± 2.19 13.07 ± 2.22 12.74 ± 2.30 13.28 ± 2.23 < 0.001 Sex (n, %) < 0.001 Boys 425 (8.68) 3,078 (62.88) 780 (15.93) 612 (12.50) 4,895 (51.46) Girls 227 (4.92) 3,331 (72.13) 720 (15.59) 340 (7.36) 4,618 (48.54) Ethnicity (n, %) 0.078 Han 599 (6.73) 5,982 (67.24) 1,416 (15.92) 900 (10.12) 8,897 (93.52) Minorities 53 (8.60) 427 (69.32) 84 (13.64) 52 (8.44) 616 (6.48) Region (n, %) < 0.001 Hunan 71 (5.41) 1,039 (79.19) 149 (11.36) 53 (4.04) 1,312 (13.79) Ningxia 96 (7.15) 986 (73.47) 186 (13.86) 74 (5.51) 1,342 (14.11) Tianjin 87 (5.74) 885 (58.38) 294 (19.39) 250 (16.49) 1,516 (15.94) Chongqing 89 (6.90) 903 (70.05) 195 (15.13) 102 (7.91) 1,289 (13.55) Liaoning 85 (6.05) 866 (61.68) 252 (17.95) 201 (14.32) 1,404 (14.76) Shanghai 66 (5.07) 836 (64.26) 241 (18.52) 158 (12.14) 1,301 (13.68) Guangzhou 158 (11.71) 894 (66.27) 183 (13.57) 114 (8.45) 1,349 (14.18) Home location (n, %) 0.014 Urban 403 (7.30) 3,753 (67.99) 840 (15.22) 524 (9.49) 5,520 (58.03) Rural 249 (6.24) 2,656 (66.52) 660 (16.53) 428 (10.72) 3,993 (41.97) Table 1. Sociodemographic characteristics of the studied adolescents
Table 2 shows anthropometric indices and MetS components stratified by nutritional status. From the lean group to the obese group, all the anthropometric indices and MetS variables presented an increasing trend, except for HDL that showed a decreasing trend. The prevalence of MetS components including central obesity, low HDL, high TG, hyperglycemia, and elevated blood pressure also increased from the lean group to the obese group. Overall, 2.84% of subjects from the total sample were detected to have MetS. The prevalence of MetS was 0.14% in the normal group, 4.47% in the overweight group, 20.38% in the obese group, and 0% in the lean group.
Item Lean group
(median, IQR,
or n, %)Normal group
(median, IQR,
or n, %)Overweight group
(median, IQR,
or n, %)Obese group
(median, IQR,
or n, %)Overall
(median, IQR,
or n, %)P Anthropometric indices BMI percentile 6.37
(3.22–9.18)49.60
(31.56–68.08)91.77
(88.49–94.74)99.08
(98.09–99.64)60.26
(33.00–85.54)< 0.001 WC percentile 20.33
(9.38–33.00)59.87
(40.52–75.80)91.31
(84.67–94.95)97.78
(95.99–98.90)68.44
(43.25–88.10)< 0.001 Waist-height ratio 0.38
(0.37–0.40)0.42
(0.40–0.44)0.48
(0.46–0.50)0.55
(0.52–0.57)0.43
(0.40–0.47)< 0.001 Waist-hip ratio 0.80
(0.77–0.83)0.81
(0.78–0.84)0.86
(0.82–0.89)0.91
(0.86–0.95)0.82
(0.78–0.86)< 0.001 MetS components HDL (mmol/L) 1.39
(1.21–1.60)1.33
(1.14–1.55)1.24
(1.07–1.45)1.14
(0.98–1.32)1.30
(1.11–1.51)< 0.001 TG (mmol/L) 0.81
(0.63–1.05)0.85
(0.66–1.10)0.95
(0.75–1.24)1.15
(0.85–1.60)0.88
(0.68–1.16)< 0.001 Glucose (mmol/L) 4.67
(4.32–5.05)4.70
(4.35–5.02)4.83
(4.51–5.13)4.90
(4.54–5.26)4.74
(4.39–5.06)< 0.001 SBP (mmHg) 101.00
(95.25–110.00)106.00
(99.00–113.00)110.00
(102.00–120.00)118.00
(110.00–121.00)108.00
(100.00–117.00)< 0.001 DBP (mmHg) 65.00
(60.00–71.00)68.00
(60.00–72.00)70.00
(61.00–76.00)71.00
(68.00–80.00)69.00
(60.00–73.00)< 0.001 Central obesity 5 (0.77) 229 (3.57) 747 (49.80) 903 (94.85) 1,884 (19.80) < 0.001 Low HDL 88 (13.50) 1,090 (17.01) 354 (23.60) 318 (33.40) 1,850 (19.45) < 0.001 High TG 20 (3.07) 281 (4.38) 142 (9.47) 208 (21.85) 651 (6.84) < 0.001 Hyperglycemia 19 (2.91) 194 (3.03) 65 (4.33) 75 (7.88) 353 (3.71) < 0.001 Elevated BP 7 (1.07) 178 (2.78) 114 (7.60) 162 (17.02) 461 (4.85) < 0.001 MetS 0 (0.00) 9 (0.14) 67 (4.47) 194 (20.38) 270 (2.84) < 0.001 Note. BMI: body mass index; BP: blood pressure; DBP: diastolic blood pressure; HDL: high density lipoprotein; IQR: interquartile range; MetS: metabolic syndrome; SBP: systolic blood pressure; TG: triglyceride; WC: waist circumference. Table 2. Distribution of anthropometric indices and MetS components in the studied adolescents in different nutritional status
-
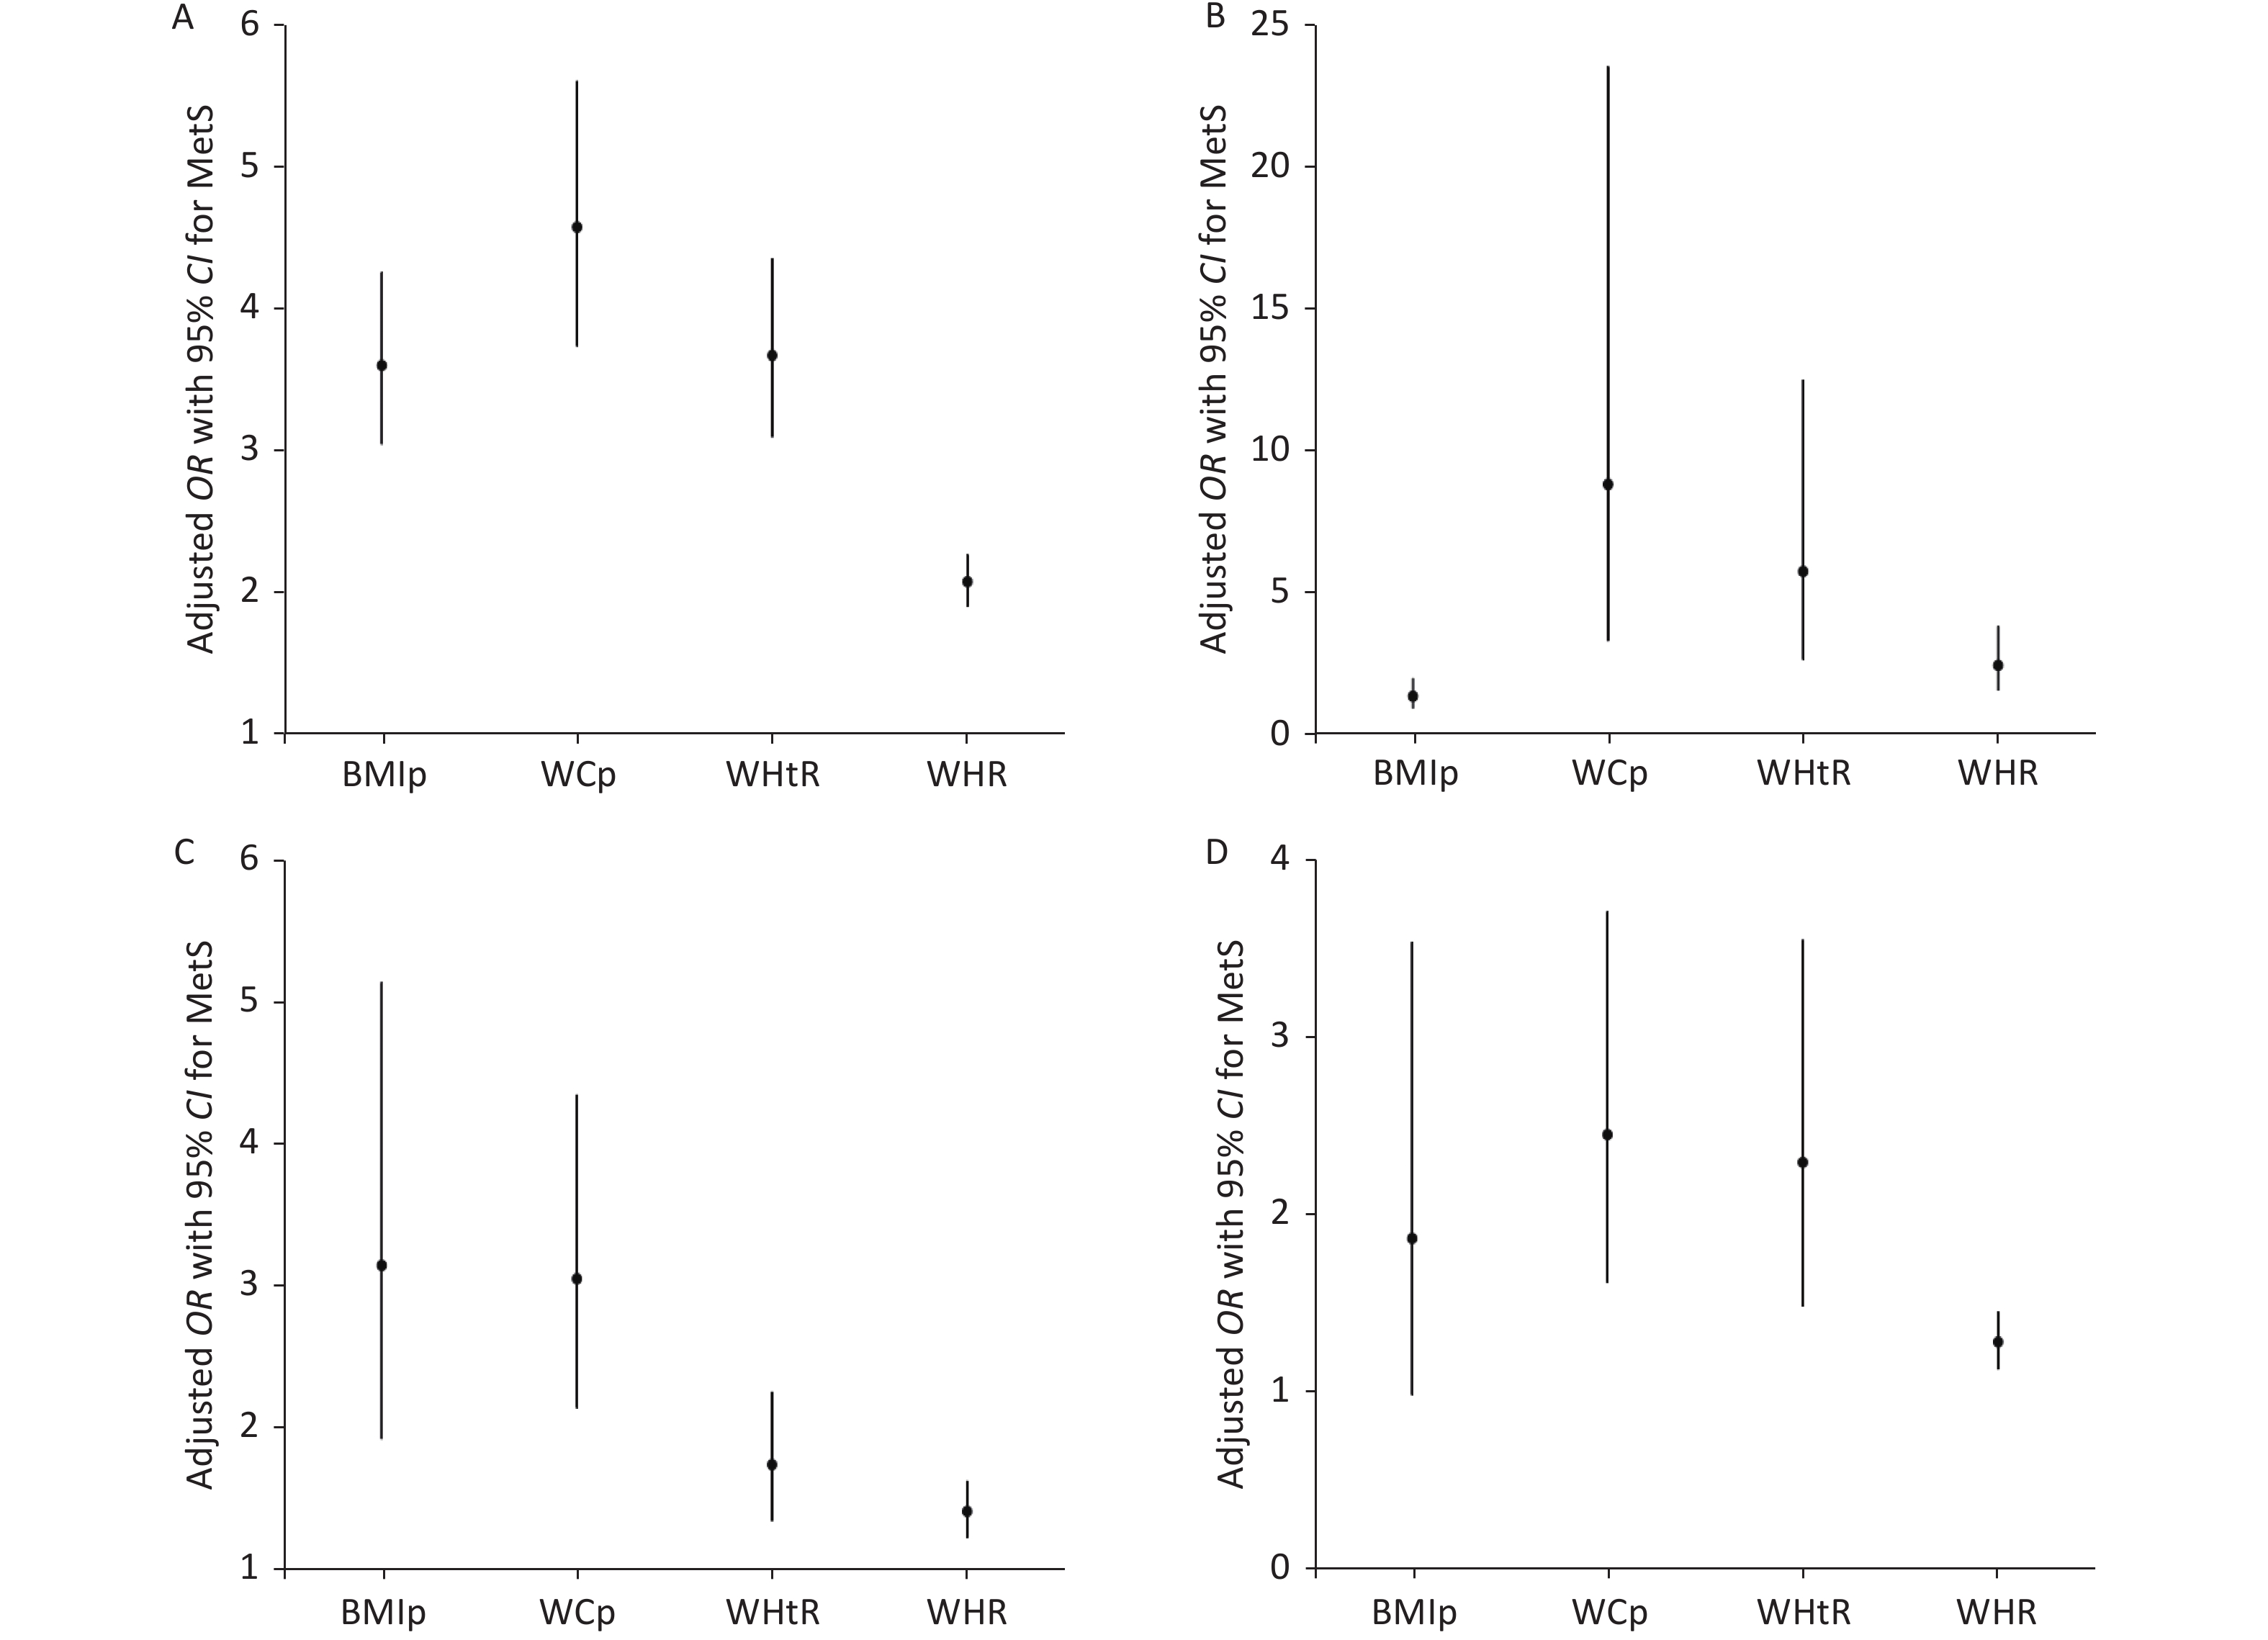
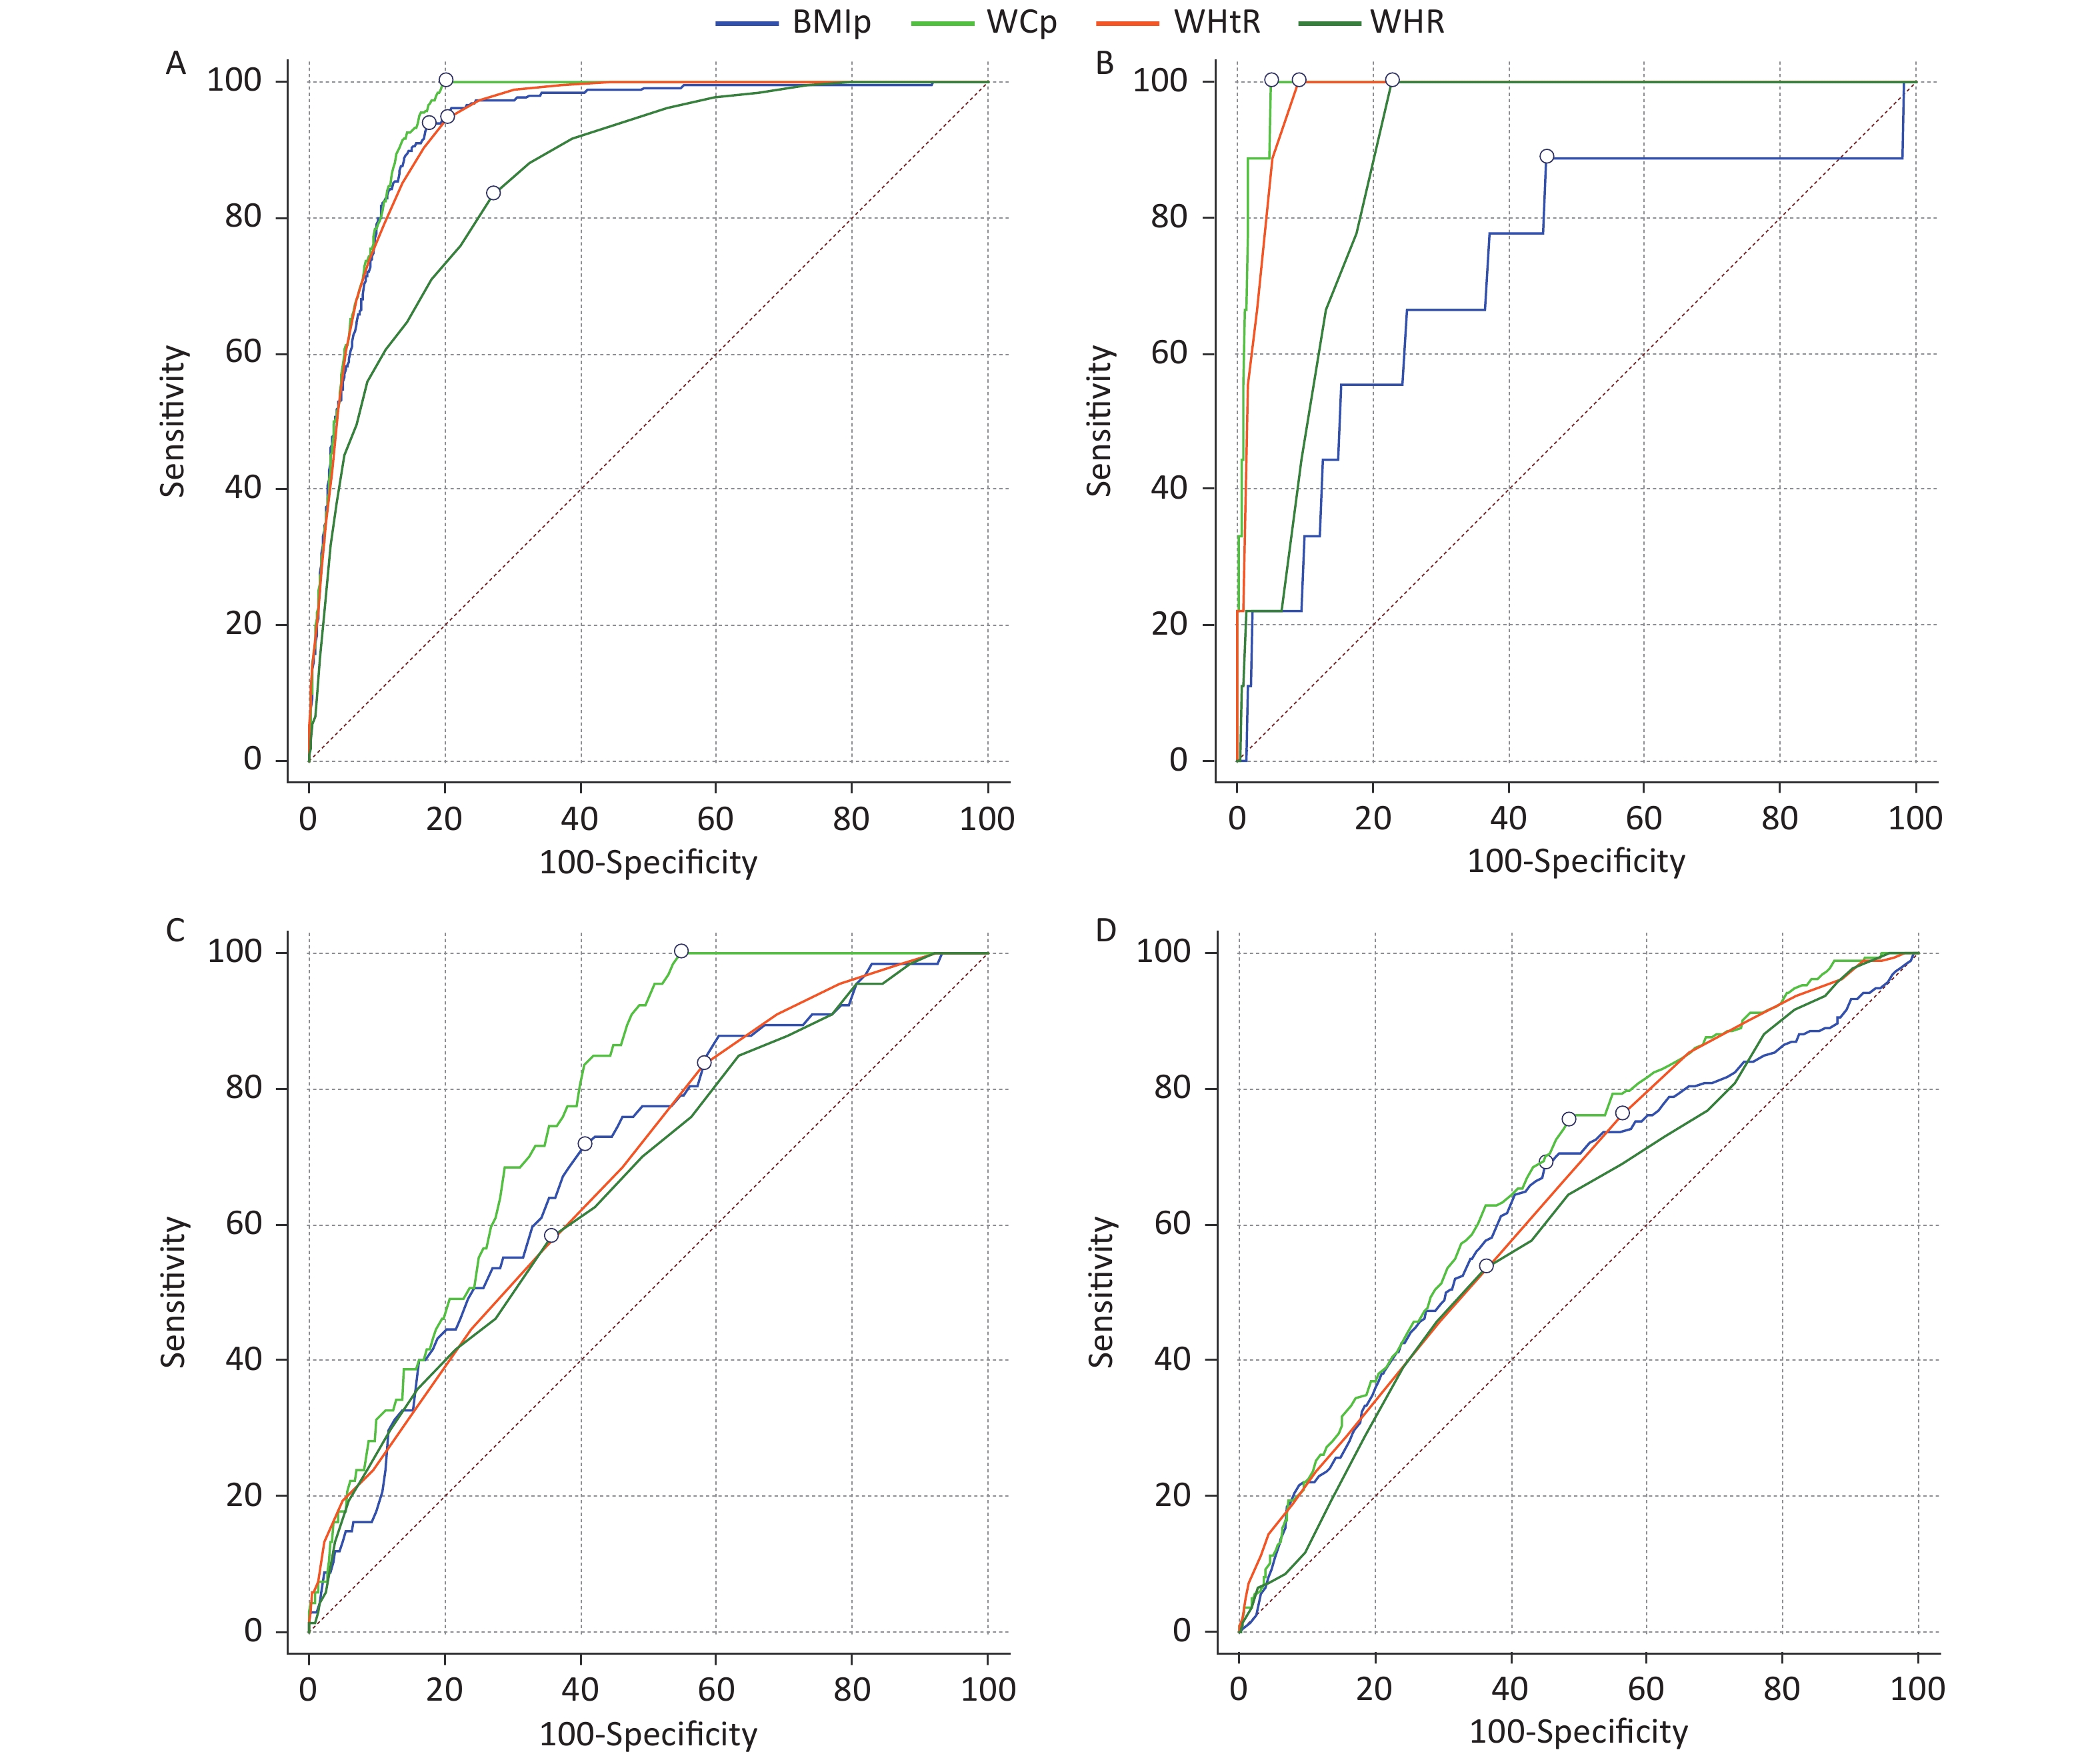
Table 3 shows the predictive performance of anthropometric indices for MetS. The four anthropometric indices showed good accuracy for predicting MetS, with AUCs ranging from 0.86 to 0.94 for the total sample. Waist circumference percentile showed the best AUC, followed by BMI percentile and waist-height ratio, while waist-hip ratio showed the lowest AUC. The cutoff value was determined based on the plot of ROC (Supplementary Figure S1, available in www.besjournal.com). Waist circumference percentile yielded the optimal accuracy at the cutoff of the 90th percentile. In addition, the odds ratio of MetS was the highest for one decile increase in the WC percentile as compared to all the other indices in the logistic regression models, after adjustment for age, sex, ethnicity, region, and home location (Supplementary Figure S2, available in www.besjournal.com).
Indices AUC (95% CI) Cutoff value Sensitivity (%) Specificity (%) Youden index Total sample BMI percentile 0.93 (0.92–0.94)2,4 89.97th 93.70 82.43 0.76 WC percentile 0.94 (0.94–0.95)5,6 89.97th 100.00 79.91 0.80 Waist-height ratio 0.93 (0.92–0.94)7 0.47 94.81 79.57 0.74 Waist-hip ratio 0.86 (0.84–0.88) 0.85 83.33 72.81 0.56 Normal group BMI percentile 0.73 (0.53–0.93)2,3 52.79th 88.89 54.48 0.43 WC percentile 0.99 (0.98–1.00)5,6 90.15th 100.00 94.91 0.95 Waist-height ratio 0.98 (0.96–0.99)7 0.46 100.00 90.78 0.91 Waist-hip ratio 0.89 (0.85–0.94) 0.84 100.00 77.11 0.77 Overweight group BMI percentile 0.69 (0.63–0.75)2 92.65th 71.64 59.32 0.31 WC percentile 0.77 (0.73–0.81)5,6,8 89.97th 100.00 45.08 0.45 Waist-height ratio 0.68 (0.62–0.74)8 0.47 83.58 41.87 0.25 Waist-hip ratio 0.66 (0.60–0.73)8 0.87 58.21 64.27 0.22 Obese group BMI percentile 0.63 (0.58–0.67)2 99.06th 69.07 54.88 0.24 WC percentile 0.67 (0.63–0.71)6,9 97.50th 75.26 51.45 0.27 Waist-height ratio 0.64 (0.60–0.68)7,9 0.53 76.29 43.67 0.20 Waist-hip ratio 0.60 (0.56–0.65)9 0.92 53.61 63.72 0.17 Note. 1Abbreviations: AUC: area under receiver operating characteristic curve; BMI: body mass index; CI: confidence interval; MetS: metabolic syndrome; WC: waist circumference. 2Significant difference in the AUCs of BMI percentile and WC percentile (P < 0.05). 3Significant difference in the AUCs of BMI percentile and waist-height ratio (P < 0.05). 4Significant difference in the AUCs of BMI percentile and waist-hip ratio (P < 0.05). 5Significant difference in the AUCs of WC percentile and waist-height ratio (P < 0.05). 6Significant difference in the AUCs of WC percentile and waist-hip ratio (P < 0.05). 7Significant difference in the AUCs of waist-height ratio and waist-hip ratio (P < 0.05). 8Significant difference in AUCs between the normal and overweight groups (P < 0.05). 9Significant difference in AUCs between the normal and obese groups (P < 0.05). Table 3. Areas under the receiver operating characteristic curves, optimal cutoff points, and validity parameters of different anthropometric indices in predicting MetS by nutritional status1
Further analyses were conducted for different nutritional status. In the normal group, waist circumference percentile, waist-height ratio, and waist-hip ratio showed a good range of AUCs from 0.89 to 0.99, but BMI percentile showed fair discrimination (AUC = 0.73) for MetS. In the overweight group, waist circumference percentile exhibited fair discrimination (AUC = 0.77) for MetS, while other indices showed poor AUCs ranging from 0.66 to 0.69. In the obese group, poor discriminatory abilities were observed for all the anthropometric indices for MetS, with AUCs ranging from 0.60 to 0.67. The Youden indices suggested that waist circumference percentile had a better performance than the other three measures in all subgroup analyses. We also performed the age- and sex-adjusted AUCs for the abovementioned analyses, which showed similar results (Supplementary Table S1, available in www.besjournal.com).
Indices MetS Central obesity Low HDL High TG Hyperglycemia Elevated BP Total sample BMI percentile 0.93 (0.92–0.94) 0.95 (0.94–0.96) 0.60 (0.58–0.61) 0.70 (0.68–0.72) 0.59 (0.56–0.63) 0.74 (0.71–0.76) WC percentile 0.94 (0.93–0.95) 0.99 (0.98–0.99) 0.60 (0.59–0.62) 0.70 (0.67–0.72) 0.59 (0.56–0.62) 0.73 (0.70–0.75) Waist-height ratio 0.93 (0.92–0.94) 0.97 (0.97–0.97) 0.60 (0.59–0.62) 0.70 (0.67–0.72) 0.57 (0.54–0.60) 0.68 (0.66–0.71) Waist-hip ratio 0.88 (0.86–0.90) 0.89 (0.88–0.90) 0.57 (0.55–0.58) 0.65 (0.62–0.67) 0.55 (0.52–0.59) 0.62 (0.59–0.65) Normal group BMI percentile 0.70 (0.50–0.90) 0.82 (0.80–0.85) 0.52 (0.50–0.53) 0.59 (0.55–0.62) 0.54 (0.50–0.58) 0.59 (0.55–0.63) WC percentile 0.98 (0.97–0.99) 0.98 (0.98–0.99) 0.53 (0.51–0.55) 0.58 (0.54–0.61) 0.54 (0.50–0.58) 0.59 (0.54–0.63) Waist-height ratio 0.98 (0.96–0.99) 0.95 (0.94–0.96) 0.51 (0.49–0.53) 0.57 (0.54–0.61) 0.51 (0.47–0.55) 0.51 (0.46–0.55) Waist-hip ratio 0.92 (0.88–0.97) 0.91 (0.90–0.92)* 0.51 (0.49–0.53)* 0.52 (0.48–0.55) 0.51 (0.47–0.55) 0.52 (0.48–0.56) Overweight group BMI percentile 0.69 (0.63–0.74) 0.73 (0.70–0.75) 0.57 (0.54–0.61) 0.58 (0.53–0.63) 0.50 (0.43–0.58) 0.54 (0.48–0.61) WC percentile 0.77 (0.73–0.81) 0.97 (0.96–0.98)* 0.58 (0.54–0.62) 0.59 (0.55–0.64) 0.55 (0.48–0.63) 0.50 (0.44–0.55) Waist-height ratio 0.68 (0.62–0.74) 0.85 (0.83–0.87) 0.57 (0.54–0.61) 0.57 (0.52–0.62) 0.55 (0.47–0.63) 0.56 (0.50–0.62) Waist-hip ratio 0.70 (0.64–0.76) 0.81 (0.79–0.84) 0.57 (0.53–0.60) 0.58 (0.53–0.63) 0.55 (0.47–0.62) 0.58 (0.52–0.63) Obese group BMI percentile 0.67 (0.62–0.72) 0.78 (0.70–0.85) 0.65 (0.61–0.70) 0.62 (0.57–0.66) 0.51 (0.43–0.59) 0.65 (0.60–0.70) WC percentile 0.62 (0.56–0.68) 0.88 (0.80–0.97) 0.58 (0.51–0.65) 0.59 (0.54–0.63) 0.51 (0.44–0.58) 0.62 (0.56–0.68) Waist-height ratio 0.62 (0.57–0.67) 0.93 (0.90–0.96) 0.59 (0.55–0.63) 0.60 (0.56–0.64) 0.50 (0.44–0.57) 0.57 (0.52–0.62) Waist-hip ratio 0.62 (0.58–0.66) 0.88 (0.83–0.93) 0.59 (0.55–0.63) 0.60 (0.56–0.64) 0.54 (0.48–0.61) 0.56 (0.51–0.61) Note. AUC: area under receiver operating characteristic curve, MetS: metabolic syndrome, BMI: body mass index, WC: waist circumference, HDL: high-density lipoprotein cholesterol, TG: triglyceride, BP: blood pressure. *The adjusted AUCs were significantly different from unadjusted values in Table 3 and Table 4. Table S1. The sex-age-adjusted AUCs and 95% confidence intervals of anthropometric indices for MetS and the components stratified by nutritional status
-
Table 4 shows the AUCs of anthropometric indices for each MetS component. In the total sample, the four anthropometric indices exhibited a better prediction for central obesity, with AUCs ranging from 0.87 to 0.99, while the prediction for low HDL and hypertension had AUCs below 0.6 for most cases. BMI percentile, waist circumference percentile, and waist-height ratio showed a better performance in general than waist-hip ratio.
Indices Central obesity Low HDL High TG Hyperglycemia Elevated BP Total sample BMI percentile 0.96 (0.95–0.96)2,3,4 0.59 (0.58–0.61)2,4 0.71 (0.68–0.73)4 0.59 (0.55–0.62) 0.73 (0.70–0.75)3,4 WC percentile 0.99 (0.99–0.99)5,6 0.61 (0.59–0.62)5,6 0.70 (0.68–0.72)6 0.58 (0.55–0.61) 0.72 (0.69–0.74)5,6 Waist-height ratio 0.97 (0.97–0.98)7 0.59 (0.58–0.61)7 0.70 (0.68–0.72)7 0.58 (0.55–0.61) 0.68 (0.66–0.71)7 Waist-hip ratio 0.87 (0.86–0.88) 0.53 (0.51–0.54) 0.64 (0.61–0.66) 0.58 (0.55–0.61) 0.62 (0.59–0.65) Normal group BMI percentile 0.85 (0.82–0.87)2,3 0.53 (0.51–0.54)2 0.60 (0.56–0.63)4 0.52 (0.48–0.56) 0.58 (0.54–0.62) WC percentile 0.99 (0.99–0.99)5,6 0.54 (0.52–0.56)5 0.59 (0.55–0.62)6 0.52 (0.48–0.56) 0.58 (0.53–0.62) Waist-height ratio 0.95 (0.94–0.96)7 0.52 (0.50–0.54) 0.58 (0.55–0.61)7 0.51 (0.47–0.55) 0.51 (0.46–0.55) Waist-hip ratio 0.86 (0.85–0.88) 0.55 (0.53–0.57) 0.50 (0.46–0.54) 0.54 (0.50–0.58) 0.52 (0.48–0.56) Overweight group BMI percentile 0.75 (0.72–0.77)2,3,8 0.57 (0.54–0.61)2,4,8 0.59 (0.54–0.63) 0.54 (0.46–0.61) 0.52 (0.46–0.57) WC percentile 0.94 (0.93–0.95)5,6,8 0.61 (0.58–0.65)5,6,8 0.58 (0.54–0.63) 0.56 (0.49–0.63) 0.51 (0.46–0.56) Waist-height ratio 0.82 (0.80–0.84)7,8 0.58 (0.55–0.61)7,8 0.57 (0.52–0.61) 0.53 (0.46–0.60) 0.54 (0.49–0.60) Waist-hip ratio 0.74 (0.72–0.77)8 0.52 (0.49–0.56) 0.56 (0.51–0.62)8 0.51 (0.44–0.58) 0.56 (0.50–0.61) Obese group BMI percentile 0.78 (0.70–0.85)2,3 0.61 (0.57–0.64)2,4,9 0.61 (0.56–0.65) 0.51 (0.44–0.58) 0.61 (0.56–0.66) WC percentile 0.93 (0.90–0.96)5,6,9 0.65 (0.62–0.69)5,6,9 0.61 (0.57–0.65) 0.50 (0.43–0.57) 0.64 (0.60–0.69)5,6,9 Waist-height ratio 0.88 (0.84–0.92)7,9 0.60 (0.56–0.63)7,9 0.60 (0.56–0.65) 0.52 (0.46–0.59)7 0.59 (0.54–0.64)9 Waist-hip ratio 0.83 (0.77–0.88) 0.54 (0.51–0.58) 0.58 (0.53–0.62)9 0.58 (0.51–0.65) 0.56 (0.51–0.61) Note. 1Abbreviations: AUC: area under receiver operating characteristic curve; BMI: body mass index; BP: blood pressure; HDL: high density lipoprotein; MetS: metabolic syndrome; TG: triglyceride; WC: waist circumference. 2Significant difference in the AUCs of BMI percentile and WC percentile (P < 0.05). 3Significant difference in the AUCs of BMI percentile and waist-height ratio (P < 0.05). 4Significant difference in the AUCs of BMI percentile and waist-hip ratio (P < 0.05). 5Significant difference in the AUCs of WC percentile and waist-height ratio (P < 0.05). 6Significant difference in the AUCs of WC percentile and waist-hip ratio (P < 0.05). 7Significant difference in the AUCs of waist-height ratio and waist-hip ratio (P < 0.05). 8Significant difference in AUCs between the normal and overweight groups (P < 0.05). 9Significant difference in AUCs between the normal and obese groups (P < 0.05). Table 4. AUCs and 95% confidence intervals of the four anthropometric indices for each MetS component by nutritional status1
Similar results were observed in the stratified analysis. All anthropometric indices showed a relatively good prediction for central obesity, with AUCs ranging from 0.74 to 0.99; waist circumference percentile showed the best AUCs. Poor prediction ability was observed for low HDL, high TG, hyperglycemia, and elevated blood pressure, with AUCs below 0.6.
-
The increasing incidence of MetS in adolescents has been a growing public concern worldwide. In the present study, the overall prevalence of MetS was 2.8%, which is consistent with a previous study in China (3.3%)[25]. All anthropometric indices, including BMI percentile, waist circumference percentile, waist-height ratio, and waist-hip ratio, showed good predictive performance with AUCs greater than 0.8 in the total sample. When stratified by nutritional status, the predictive performance of all the indices significantly decreased in the overweight and obese groups compared to that in the normal group. Comparatively, waist circumference percentile showed better performance for predicting MetS than the other three measures.
Although MetS and its components were more prevalent in the overweight and obese groups, the AUCs of most anthropometric indices among the overweight and obese groups were less than 0.7. Consistently, many studies have shown that BMI, waist circumference, waist-height ratio, waist-hip ratio, and other indicators had limited predictive accuracy for MetS in obese adolescents[11,13,26]. The majority of overweight/obese subjects had high levels of waist circumference and waist-height ratio[27]; thus, the discriminatory accuracy in these subjects was limited by smaller intervals of anthropometric indices. In contrast, among subjects with normal BMI, all anthropometric indices showed a good predictive performance for MetS in terms of AUCs, sensitivity, specificity, positive predictive value, and negative predictive value. Our findings suggest that anthropometric indices, especially waist circumference-related indices, can be used as an effective and convenient tool for screening MetS in the overall population and subjects with normal BMI. For overweight and obese adolescents, more specific diagnostic tests should be conducted, considering the poor predictive power of anthropometric indices and relatively low costs of diagnostic tests for MetS components.
In our present study, the four anthropometric indices showed good ranges of AUCs for MetS and central obesity; however, poor to fair accuracy was observed for the other MetS components, with AUCs ranging from 0.53 to 0.73 in the overall population. The findings were consistent with existing studies that anthropometric indices predicted MetS well but had comparatively poorer accuracy for dyslipidemia, hypertension, and hyperglycemia in children and adolescents[28,29]. In a recent meta-analysis, the pooled AUCs for predicting MetS, elevated TG, low HDL, hypertension, and hyperglycemia by using BMI, waist circumference, and waist-height ratio were 0.81–0.87, 0.67–0.73, 0.69–0.70, 0.64–0.68, and 0.57–0.57, respectively[30]. Although visceral fat content is thought to be the primary cause of metabolic disorders[31,32], anthropometric indices are indirect indicators for body weight or fat, which may limit the predictive accuracy[33-35]. The poor predictive performance for MetS components may be explained by multiple factors related to serum lipid level, fasting glucose level, and blood pressure, such as genetic polymorphism and dietary patterns.
We also found that compared to other indices, waist circumference percentile had a relatively better predictive performance for MetS regardless of BMI category. The superiority of waist circumference percentile for predicting MetS agreed with the conclusion of Perona et al. that waist circumference was the strongest anthropometric discriminators of MetS in Spanish adolescents among a list of 10 classic and novel anthropometric indices such as BMI, waist circumference, waist-height ratio, waist-hip ratio, and body fat percentage[29]. Some studies, however, reported different findings. One study in Brazil reported that waist-height ratio had the best AUC for MetS among BMI, waist circumference, waist-height ratio, and conicity index regardless of sex and age[36]. A national study in Korean children and adolescents showed that the AUCs for MetS and its components were similar for BMI percentile, waist circumference percentile, and waist-height ratio[28]. The predictive performance may vary across populations with different age, sex, and ethnicity[37]. These inconsistent results may be attributed to the different criteria used to define MetS and various combinations of anthropometric indices evaluated in different studies. In the present study, we used age- and sex-specific percentiles for BMI and waist circumference instead of actual values, which considers the impact of growth and sexual development.
The present study has several limitations that should be addressed. First, school-based sampling and the absence of final year students may weaken the representativeness of the adolescent population, especially for out-of-school adolescents. Second, we did not include participants in the pubertal stage, which has shown to be an important factor in MetS and should be considered in future studies[38,39]. Third, our study was cross-sectional in design; thus, data regarding the duration of obesity and recent changes in body weight were unavailable, which may help to better predict MetS[40]. We were also unable to evaluate prediction accuracy over time. As previous studies have suggested the instability of diagnosing MetS among adolescents over time[41], more prospective cohort studies are needed to investigate the association between adiposity-related anthropometric indices and MetS.
-
Despite the limitations, this study compared the discriminatory ability of four commonly used anthropometric indices, namely BMI percentile, waist circumference percentile, waist-height ratio, and waist-hip ratio, for MetS in adolescents with different nutritional status based on a multicenter study in China. All anthropometric indices, especially waist circumference percentile, showed a good prediction for MetS in the total sample and subjects with normal weight, while poor predictive results were observed for subjects with overweight and obesity. These findings may provide evidence for the use of anthropometric indices in youths with different BMI categories. Anthropometric indices, especially waist circumference percentile, can be used as an early screening tool for MetS in Chinese adolescents, while more specific tests should be conducted among adolescents who are overweight and obese.
-
We also acknowledge the support from all the team members and the participating students, teachers, parents, and local education and health staffs.
-
The authors’ contributions were as follows: LI Ya Mei, data analysis and manuscript drafting; ZOU Zhi Yong, data curation and manuscript drafting; MA Ying Hua, funding acquisition, project design and organization; LUO Jia You, JING Jin, ZHANG Xin, LUO Chun Yan, WANG Hong, ZHAO Hai Ping, and PAN De Hong, project design, investigation and quality control; LUO Mi Yang, study design and manuscript editing.
-
The authors declare no conflict of interest.
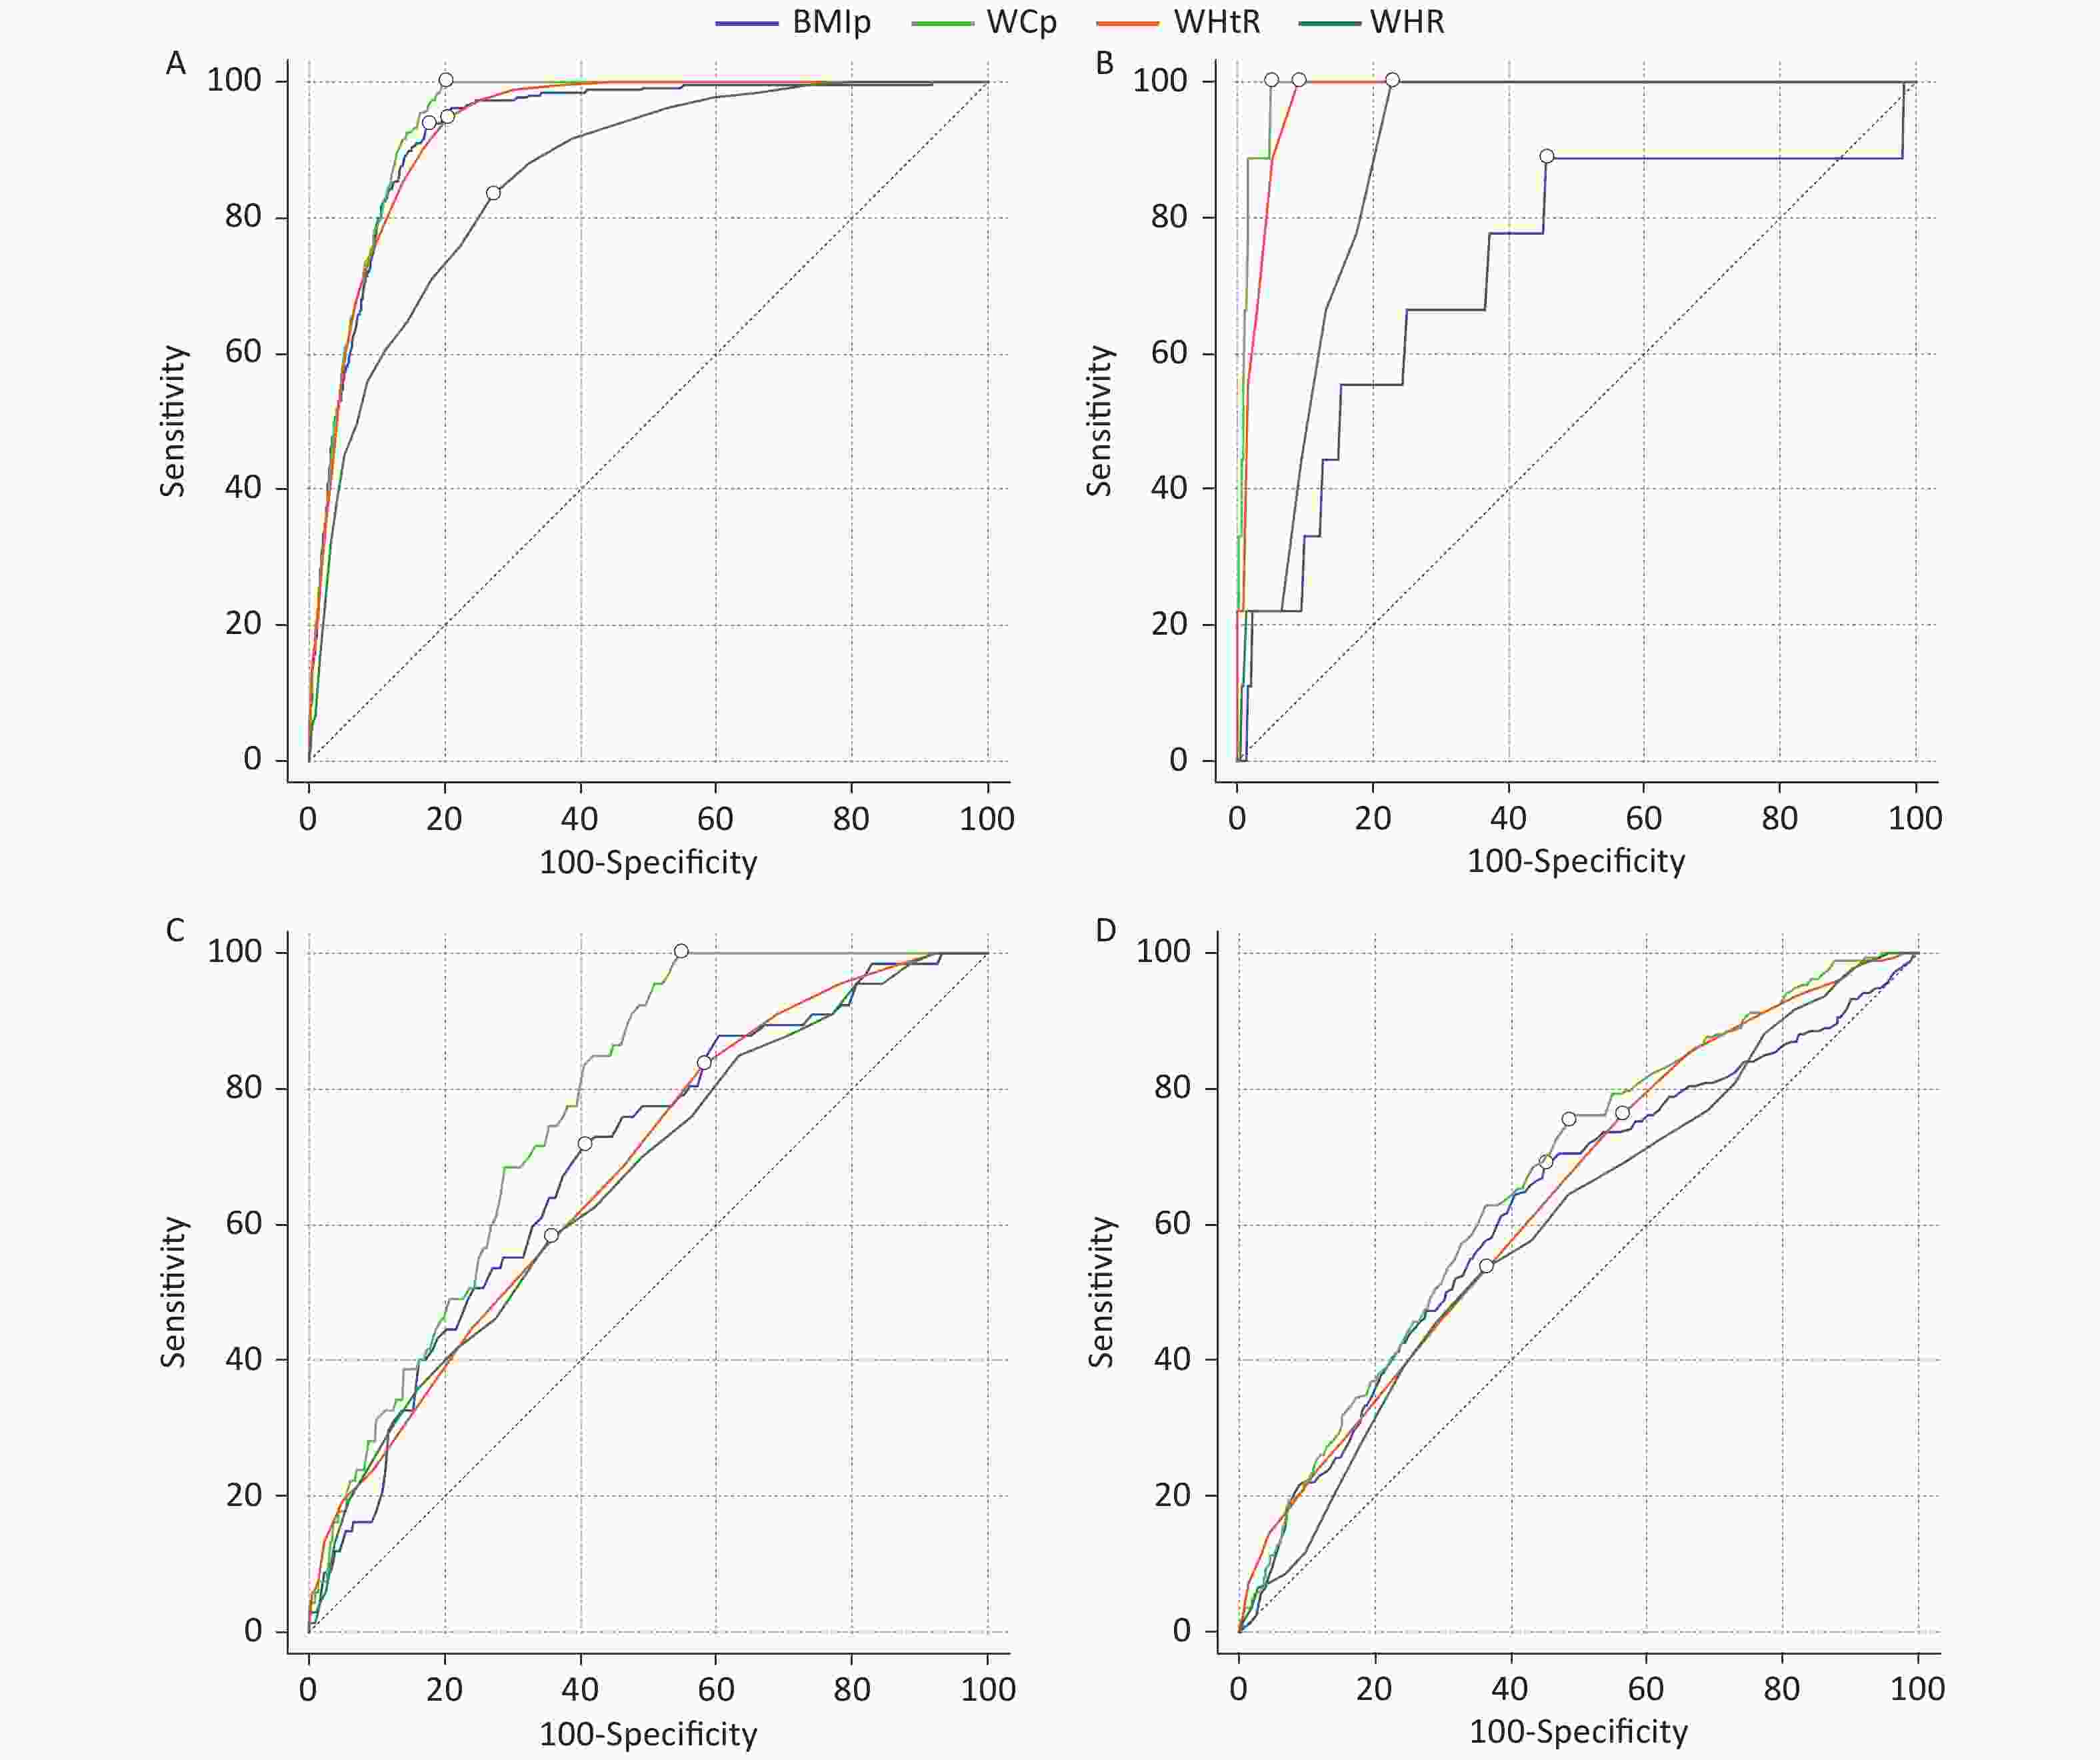
Figure S1. The receiver operating characteristic (ROC) curves of four anthropometric indices for screening metabolic syndrome: (A) model for the total sample, (B) model for normal group, (C) model for overweight group, and (D) model for obese group. The small circle on each ROC curve means the cut-off point. BMI: body mass index, WC: waist circumference.
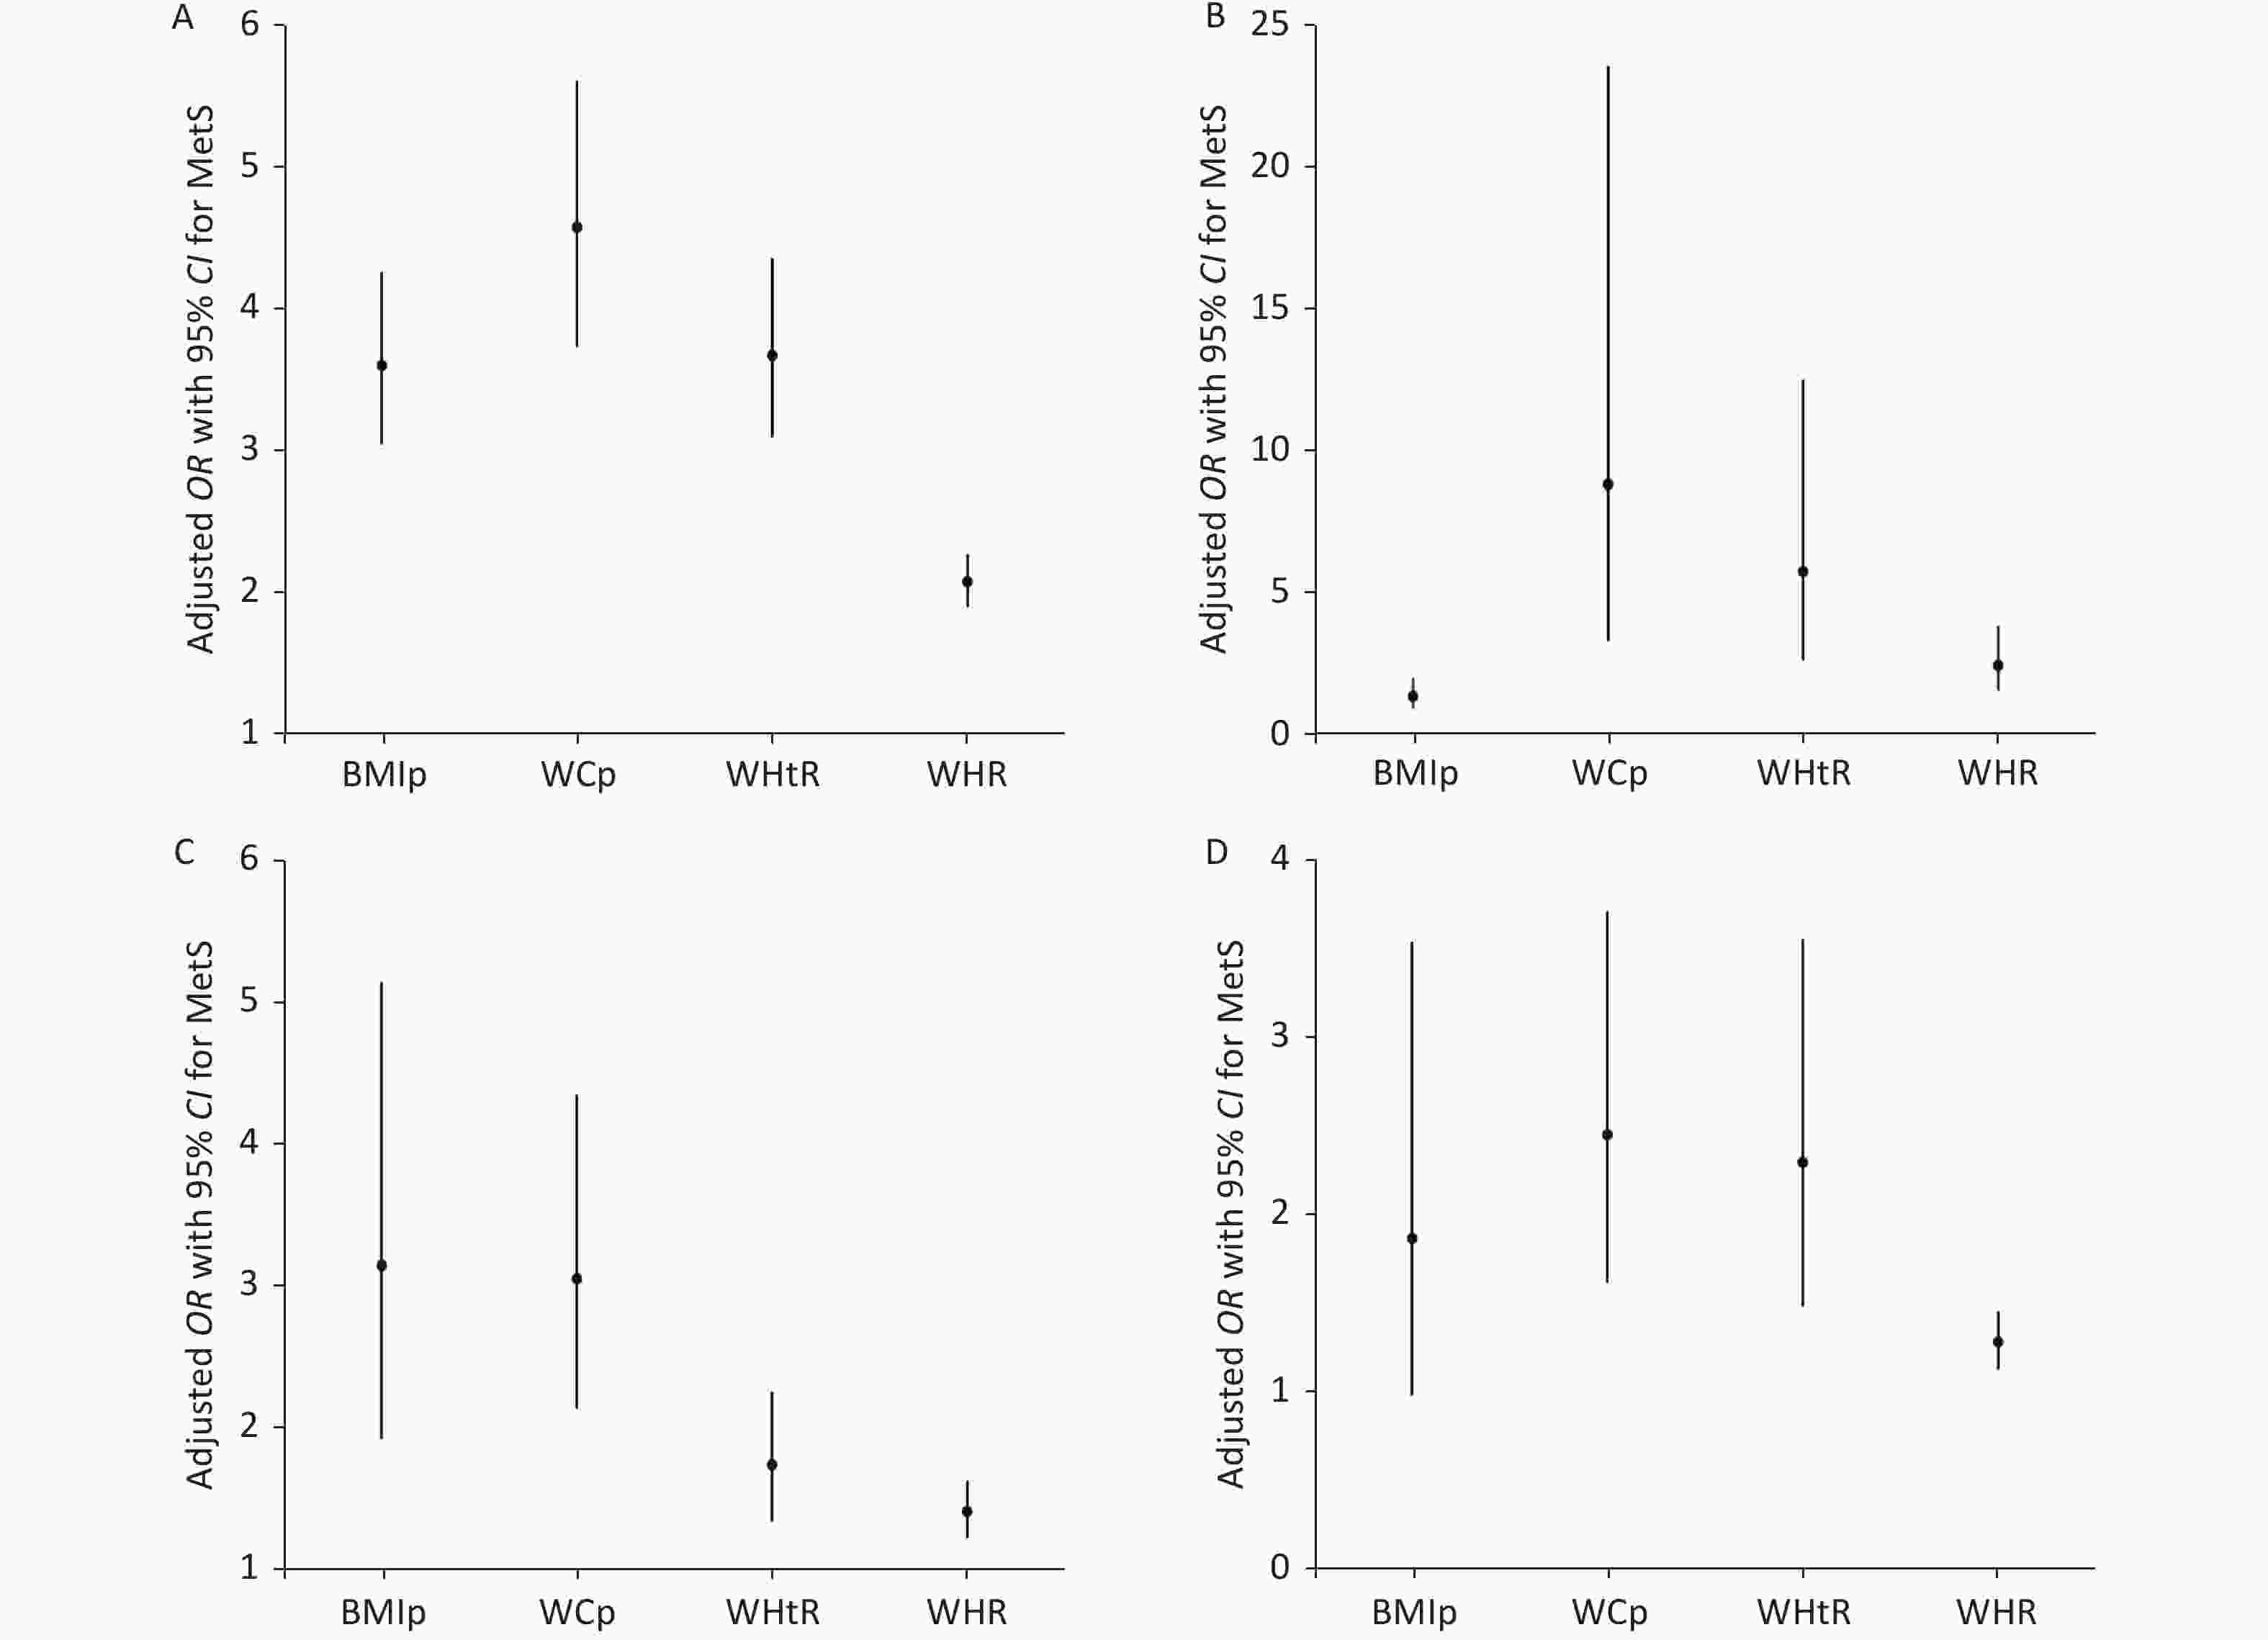
Figure S2. Adjusted odds ratios for metabolic syndrome for one decile increase in anthropometric variables. All the models are adjusted for age, sex, ethnicity, region, and home location: (A) model for the total sample, (B) model for normal group, (C) model for overweight group, and (D) model for obese group. BMIp: body mass index percentile, WCp: waist circumference percentile, WHtR: waist-height ratio, WHR: waist-hip ratio.
HTML
Study Design and Participants
Study Measurements
Adiposity-related Anthropometric Indices
Definition of MetS
Statistical Analyses
Basic Characteristics of the Studied Sample
Predictive Performance of Anthropometric Indices for MetS Stratified by Nutritional Status
AUCs of Anthropometric Indices for MetS Components Stratified by Nutritional Status
 20412.pdf
|

|

 Quick Links
 DownLoad: