

 下载:
下载:

-
Cardiovascular diseases (CVDs) are the leading cause of death globally[1, 2]. The annual number of deaths attributed to CVDs increased from 2.51 million to 3.97 million between 1990 and 2016 in China, accounts for more than 40% of deaths in China[3-5]. Metabolic syndrome (MetS) is a cluster of metabolic abnormalities that include conditions such as central obesity, increased blood pressure (BP), increased fasting plasma glucose (FPG), increased triglycerides (TG), and decreased high-density lipoprotein cholesterol (HDL-C)[6]. MetS was associated with an increased risk of developing CVDs and type 2 diabetes mellitus (T2DM)[3, 6-8]. China National Health and Nutrition Surveillance (2010–2012) revealed that the overall prevalence rate of MetS among Chinese adults was 11.0%. Thus, investigating the cause underlying the high rate of MetS prevalence might provide important public health implications for the prevention of CVDs.
Over the last few decades, meat consumption increased significantly among Chinese adults, in particular, consumption of pork was higher compared to other livestock and poultry[9-11]. Numerous studies were focused on the relationship between red meat intake and the prevalence of MetS as red meat is rich in saturated fatty acids[12-15]. But most of these studies revealed an inconsistent association between MetS and red meat intake. Few studies showed that red meat consumption was associated with a significantly higher prevalence and incidence of MetS and central obesity in individuals[13, 16, 17]. Fresh red meat and processed red meat consumption were also associated with a higher risk of MetS, whereas replacing fresh red meat or processed red meat with other protein-rich foods resulted in a lower risk of MetS[18]. However, a cross-sectional study in the Chinese population over 15 years of age revealed that MetS prevalence negatively correlated with livestock meat consumption[19]. Another Chinese study showed that high animal meat intake had a high risk of MetS in men, but was absent in women[20]. Excessive iron accumulated in the body was proposed as one of the risk factors for CVDs[21]. Iron overload, characterized by increased levels of serum ferritin is the primary indicator for diagnoses of iron overload-related diseases[22, 23]. Elevated serum ferritin levels were positively associated with MetS[24]. Previous studies focused on the relationship between red meat intake and MetS, without analysis of the serum ferritin levels. Therefore, it would be interesting to determine whether higher usual intake of red meat was related to elevated serum ferritin levels. Furthermore, most of the previous studies mainly used single 24-hour recalls or food frequency questionnaire (FFQ) to estimate red meat or specific red meat intake but, these do not specifically represent an individual’s usual intake. Therefore, a longitudinal study on the relationship of red meat usual intake with MetS and elevated serum ferritin levels among adults in China is necessary.
In the present study, we used the National Cancer Institute (NCI) method to estimate the usual intake of the daily or episodically consumed foods, and dietary assessment was mainly based on the usual dietary intake. China Health and Nutrition Survey (CHNS) data were used to longitudinally assess the association between red meat usual intake and MetS. In addition, we establish the contribution of red meat to elevated serum ferritin levels among Chinese adults. Our studies help to understand the basis of increased red meat consumption to increased rates of CVDs.
-
The CHNS is an ongoing longitudinal and household-based survey that has completed ten waves (1989–2015). The survey originally covered eight provinces (including Jiangsu, Hubei, Hunan, Guangxi, Guizhou, Liaoning, Shandong, and Henan). In 2011, the CHNS included additional provinces of Beijing, Shanghai, and Chongqing and in 2015 it included Shanxi, Yunnan, and Zhejiang. Although the CHNS is not considered as a national representative survey, the data gathered from these provinces provided significant statistical variability in terms of demographic distribution, geographic distribution, economic strata, and public resources which could be considered as a representative dataset for all the provinces in China. It was approved by the institutional review committees of the University of North Carolina at Chapel Hill (UNC-CH) and the National Institute for Nutrition and Health, Chinese Center for Disease Control and Prevention. The detailed survey protocol was described previously elsewhere[25].
Fasting blood samples were collected from individuals in 2009 and 2015. The present study used samples from 5,132 eligible participants (6,378 participated in both the two waves; then excluded those age over 75 in 2009) who aged 18–75 in 2009 and participated in these two waves. Pregnant women or lactating mothers were excluded. Participants who were previously diagnosed with diabetes, hypertension, cancer, and MetS in the 2009 wave were excluded because these diseases affected their dietary habits. Participants lacking complete data of dietary measures, blood pressure, waist circumference, fasting blood, and serum ferritin determinations in 2009 and 2015, and those with missing sociodemographic variables in 2009 were excluded as well. Finally, a total of 2,797 participants were included in the analysis.
-
Dietary assessment used foods usual intake which was estimated by 3 consecutive days 24-hour recalls and FFQ in 2009[26-28]. The three consecutive days 24-hour recalls mainly recorded the type, amount, type of meal, and place for all the food items consumed at an individual level and were entered into a household level inventory for the same three days. These 3 consecutive days were randomly allocated from Monday to Sunday and included at least one weekend. Changes in the household inventory as well as the wastage were used to calculate total household consumption. The percentage of the oil and condiments were determined from the household inventory for each member as the ratio of their individual energy intake and to the energy intake of all members combined. Dietary intake data was linked to the China Food Composition Table[29], and we calculated the average of total energy intake (TEI) and nutrients intake (dietary fiber, carbohydrate, and dietary fat) from all the food items consumed over the period of 3 days. The FFQ included 74 food items and 9 food categories (including rice, wheat, and wheat products, other staple cereals and tubers, legumes, vegetables, fruits, dairy products, meats including pork, beef, mutton, poultry, fish, and shrimp, eggs, snacks, alcohol, and soft drinks). For each of the food items listed above, participants reported the frequency of habitual consumption [daily, weekly, monthly, annually, or never (the reference category)] and the amount consumed each time for a period of 12 months.
For this study, we have defined total red meat as fresh red meat and processed red meat. Fresh red meat included muscle and organ meat from pork, beef, and mutton that had not been treated, whereas processed red meat included all the products of all types of red meat that were undergo treated, such as sausages, salami, ham, and luncheon meats[13]. Red meat is episodically consumed food in China, so we performed the National Cancer Institute (NCI) method to estimate the usual intake of foods. The NCI method was developed specifically to deal with episodically consumed or no daily consumed foods, which consists of a two-part model with correlated person-specific effects[30-32]. The first part consists of estimating the probability of consuming a specific food using logistic regression analysis with a person-specific random effect (mixed model). Part I was represented as:
$$ \begin{aligned} & \text{Logit} \left( {24\text{HR}\;\text{Probability}} \right) = {\text{Intercept}}_{\text{I}} + {\text{Slope}}_{\text{I}}\\ & \quad \times \text{Coveriate} + \text{Person}_- \text{Specific} \; \text{Effect}_{\text{I}} \end{aligned}$$ (1) where, for probability P, Logit (P) = log (P/1 − P). The intercept, slope, and variance was person-specific, and I (shown in subscript) indicated their association with Part I. Covariate represented the effect of personal characteristics, such as age, sex, or body mass index. The model allowed for multiple covariates[31]. The second part specified the consumption-day amount and may be represented as:
$$ \begin{aligned} & \text{Transformed} \left( \text{24HR Amount} \right) \!=\! {\text{Intercept}}_{\text{II}} \!+\! {\text{Slope}}_{\text{II}} \\ &\times {\text{Coveriate}} + {\text{Person}}_-{\text{Specific Effect}}_{\text{II}} \\ &+ {\text{Within}}_- {\text{person Variability}}_{\text{II}} \end{aligned}$$ (2) where II (shown in subscript) indicated that these parameters were associated with Part II, and differed from those in Part I. Two or more 24 HR on a number of individuals with reports of the food of interest were required to distinguish between- and within-person variation in the model of part II[31]. The model was specified on the transformed scale where the person-specific effect and within-person random variability were normally distributed. Moreover, additional information from FFQ was included in the model as a covariate[31, 33]. The details of the NCI method were described previously elsewhere [30-32].
-
Height, weight, and waist circumference were measured by health workers who were trained with standardized procedures. Height was measured to the nearest 0.1 cm using a Stadiometer (model 206, SECA) without wearing shoes. Weight was measured to the nearest 0.1 kg with SECA 880, with participants standing and wearing a single layer of clothing. We calculated the body mass index (BMI) using weight in kilograms divided by measured height in squared meters, and divided it into three categories underweight (BMI < 18.5 kg/m2), normal (18.5 kg/m2 ≤ BMI < 24.0 kg/m2) and overweight/obesity (BMI ≥ 24.0 kg/m2)[34]. Waist circumference was measured by a SECA tape measure. At least a 10-min rest period between the systolic blood pressure (SBP) and diastolic blood pressure (DBP) was set between the BP measurements. All the measurements were done on the participant’s left arm in a seated position and averaged to the nearest mmHg according to standard procedures. We used the mean of three satisfactory measurements for all the analyses. The requirements for the measurement process were described previously [35].
Blood samples were collected by health workers by venipuncture after an overnight fast. Glucose, TG, HDL-C, and ferritin of all the samples were measured according to standard procedures in a national lab in Beijing[36]. FPG was measured by the GOD-PAP (Randox Laboratories Ltd., London, UK). The concentration of serum HDL-C and TG were measured by the enzymatic method and CHOD-PAP (Kyowa Medex Co., Ltd, Tokyo, Japan), respectively. Serum ferritin levels were determined by radioimmunoassay method.
-
MetS was diagnosed as per the guidelines of the International Diabetes Federation (IDF) and AHA/NHLBI criteria with a modified waist circumference cutoff for Chinese adults[37]. A person diagnosed with MetS had to meet any three or more of the criteria listed: (1) Elevated WC (using the Chinese values: ≥ 90 cm in man, ≥ 80 cm in female); (2) raised TG (TG ≥ 150 mg/dL (1.7 mmol/L) or drug treatment for elevated triglycerides); (3) reduced HDL-C [< 40 mg/dL (1.0 mmol/L) in males, < 50 mg/dL (1.3 mmol/L) in females or drug treatment for reduced HDL-C]; (4) raised BP [systolic BP (SBP) ≥ 130 mmHg or diastolic BP (DBP) ≥ 85 mmHg or antihypertensive drug treatment in a patient with a history of hypertension]; (5) raised FPG (≥ 100 mg/dL or drug treatment of elevated glucose).
-
Standard questionnaires were used to collect the sociodemographic characteristics data such as age, gender, educational level, lifestyle factors (e.g. smoking, drinking alcohol, physical activity), household income, and community information. Participants were grouped into three categories based on their age (18–44 years, 45–59 years, and 60–75 years) and classified smoking status as current (Yes) and ever/never (No). Alcoholic status was categorized as drinking (Yes) and non-/ever drinking (No). The household incomes were calculated according to the household size and grouped as low, middle, and high-income groups. The urbanization index was calculated based on 12 multidimensional components reflecting the heterogeneity in economic, social, demographic, and infrastructural characteristics at the community level[38], and categorized as low, middle, and high. Physical activity classification included four domains: occupational, household chores, leisure time activities, and commute related activities. Participants reported all activities as an average of all the hours spent in activities per week, and we converted the time spent in each activity into a metabolic equivalent of task (MET) hours per week based on the Compendium of Physical Activities. We grouped the total MET-hours per week as low, middle, and high groups. Based on the National Bureau of Statistics, we divided all provinces covered in the present study into east (include Jilin, Jiangsu, and Shandong), central (include Hubei, Heilongjiang, Hunan, and Henan) and west (include Guangxi and Guizhou).
-
Total red meat usual intake was grouped into quartiles for all the subsequent analyses. For the baseline characteristics of the participants, categorical variables were presented as percentages and used chi-square analysis to test the differences across quartiles of total red meat usual intake. All continuous variables were tested for normality and expressed with skewed distribution variables as medians (interquartile ranges) and were subjected to non-parametric statistical hypothesis tests of the Kruskal-Wallis test. A series of multivariable logistic regression models were constructed to assess the association between the risk of the usual intake of total red meat and specific red meats and MetS, adjusted for potential confounding factors including demographic, socioeconomic, lifestyle factors, and dietary factors in the models. Because the small amount consumed, processed red meat were consumed for the first three quartiles, total red meat was used in the multivariable logistic regression. Linear trends were tested by assigning median values to quartiles of consumption of total red meat or specific red meats and this variable was modeled as a continuous term. In addition, we estimated the association of the total red meat or specific red meats usual intake and serum ferritin levels by quantile regression model by adjusting the confounding factors. All the statistical analyses were conducted using the SAS 9.4 (SAS Institute, Inc., Cary, NC, USA). P < 0.05 was considered significant.
-
The baseline characteristics of all the participants across the quartile of total red meat usual intake are listed in Table 1. Baseline characteristics data revealed that participants who had a higher total red meat usual intake were overweight young men who smoked and had higher urbanicity index, higher household income, lower physical activities, high alcohol consumption rates. Furthermore, the top quartile of total red meat usual intake appeared to be those with relatively higher TG and FBG levels, and lower HDL-C and blood pressure. Participants showed significant differences in the dietary intake among the quartile of total red meat usual intake. To summarize, participants with higher total energy, dietary fat intake, and lower dietary fiber intake had higher total red meat intake. It was interesting to observe that adults with the lowest and highest quartile of total red meat usual intake had higher vegetables and fruits intakes.
Table 1. Baseline characteristics of all the participants according to the quartile of red meat usual intake
Factors Q1 Q2 Q3 Q4 P-value Participants 699 699 700 699 Total red meat (g/d) 15.26
(11.44, 20.07)40.46
(33.76, 45.75)66.99
(59.89, 73.78)104.18
(91.17, 123.41)Age (years), n (%) < 0.001 18−44 204 (29.18) 228 (32.62) 265 (37.86) 276 (39.48) 45−59 193 (27.61) 207 (29.61) 204 (29.14) 210 (30.04) 60−75 302 (43.2) 264 (37.77) 231 (33.00) 213 (30.47) Gender, n (%) < 0.001 Men 297 (42.49) 308 (44.06) 337 (48.14) < 0.001 Women 402 (57.51) 391 (55.94) 363 (51.86) < 0.001 Regions, n (%) < 0.001 East 231 (33.05) 285 (40.77) 230 (32.86) < 0.001 Central 391 (55.94) 273 (39.06) 271 (38.71) < 0.001 West 77 (11.02) 141 (20.17) 199 (28.43) < 0.001 Urbanization index, n (%) < 0.001 Low 381 (54.51) 234 (33.48) 187 (26.71) < 0.001 Middle 218 (31.19) 254 (36.34) 227 (32.43) < 0.001 High 100 (14.31) 211 (30.19) 286 (40.86) < 0.001 Household income, n (%) < 0.001 Low 304 (43.80) 226 (32.47) 193 (27.81) < 0.001 Middle 225 (32.42) 222 (31.90) 243 (35.01) < 0.001 High 165 (23.78) 248 (35.63) 258 (37.18) < 0.001 Physical activity, n (%) < 0.001 Low 244 (34.91) 205 (29.33) 231 (33.00) 252 (36.05) Middle 174 (24.89) 233 (33.33) 266 (38.00) 260 (37.20) High 281 (40.20) 261 (37.34) 203 (29.00) 187 (26.75) Smoking, n (%) 0.316 No 479 (68.53) 486 (69.53) 471 (67.29) 462 (66.09) Yes 220 (31.47) 212 (30.33) 229 (32.71) 237 (33.91) Alcohol, n (%) < 0.001 No 494 (70.67) 469 (67.10) 445 (63.57) 427 (61.09) Yes 205 (29.33) 229 (32.76) 255 (36.43) 272 (38.91) BMI, n (%) 0.305 Underweight 47 (6.72) 56 (8.01) 63 (9.00) 50 (7.15) Normal 427 (61.09) 413 (59.08) 431 (61.57) 434 (62.09) Overweight/obesity 225 (32.19) 230 (32.90) 206 (29.43) 215 (30.76) WC (cm) 80 (75, 87) 80 (74, 87) 79 (73, 86) 79 (73, 86) 0.006 SBP (mmHg) 120 (111, 131) 120 (110, 130) 120 (110, 129) 119 (109, 125) < 0.001 DBP (mmHg) 80 (71, 87) 79 (71, 84) 79 (71, 83) 77 (70, 81) < 0.001 HDL-C (mg/dL) 57 (50, 66) 58 (50, 68) 57 (50, 67) 56 (49, 65) 0.004 TG (mg/dL) 92 (66, 124) 92 (66, 124) 93 (65, 125) 97 (70, 132) 0.024 FBG (mg/dL) 89 (83, 96) 89 (83, 96) 90 (84, 96) 90 (84, 98) < 0.001 Serum ferritin (ng/mL) 65.46
(31.57, 119.56)66.08
(30.14, 121.66)70.54
(32.18, 131.96)84.88
(42.34, 155.56)< 0.001 TEI (kcal/day) 2047.89
(1633.48, 2491.71)2105.54
(1748.4, 2539.48)2157.35
(1821.03, 2680.92)2417.6
(2034.1, 2862.35)< 0.001 Dietary fiber (g/d) 11.33
(8.48, 15.12)10.54
(8.09, 15.11)10.27
(7.51, 14.18)9.79
(7.28, 13.53)< 0.001 Carbohydrate (g/d) 310.5
(241.2, 396.7)284.91
(226.86, 361.85)281.52
(226.69, 358.41)278.44
(222.87, 351.41)< 0.001 Dietary fat (g/d) 54.68
(37.28, 74.39)68.4
(50.6, 89.84)78.88
(59.87, 102.76)99.62
(75.21, 122.05)< 0.001 Vegetables (g/d) 296.71
(212.55, 392.42)299.36
(215.55, 390.75)303.85
(231.07, 386.47)332.79
(266.25, 400.73)< 0.001 Fruit (g/d) 0.77
(0.37, 4.07)1.19
(0.52, 53.94)1.57
(0.53, 56.03)1.89
(0.67, 63.95)< 0.001 Fresh red meat (g/d) 15.11
(11.38, 19.87)39.63
(32.94, 45.1)65.52
(58.68, 72.32)102.84
(89.7, 121.62)< 0.001 Processed red meat (g/d) 0.00 (0.00, 0.51) 0.00 (0.00, 0.73) 0.00 (0.00, 0.85) 0.38 (0.00, 0.94) < 0.001 Note. Q = quartile. Data of categorical variables are expressed as a percentage (%); Medians (interquartile ranges) were calculated for skewed parameters. -
The risk of metabolic syndrome was analyzed by red meat and specific red meat usual intake, which was divided into quartiles as listed in Table 2. The risk of metabolic syndrome increased linearly with an increase in red meat usual intake, after adjusting for all the potential confounders (age, gender, regions, urbanicity index, household income level, physical activity, smoking, alcohol, BMI, TEI, dietary fiber, carbohydrate, dietary fat, of vegetables and fruits usual intake). The risk of metabolic syndrome was highest in the top quartile of red meat usual intake (RR: 1.41; 95% CI: 1.05–1.90). In addition, for specific red meat, the risk of metabolic syndrome in relation to the amount of intake showed a significant difference only in fresh red meat usual intake. The top quartile of fresh red meat usual intake (RR: 1.37; 95% CI: 1.02–1.85) exhibited the highest risk of metabolic syndrome. As the intake increased, the risk of metabolic syndrome showed an increasing trend (P < 0.05). However, there was no association between the risk of metabolic syndrome and the processed red meat usual intake.
Table 2. The association between total red meat or its subtype usual intakes and the risk of MetS
Groups Q1 Q2 Q3 Q4 P-trend Total red meat Crude Ref 0.99 (0.78, 1.26) 1.02 (0.80, 1.29) 1.16 (0.91, 1.47) 0.197 Model 1 Ref 1.01 (0.80, 1.29) 1.08 (0.84, 1.38) 1.31 (1.02, 1.67)* 0.025 Model 2 Ref 1.00 (0.78, 1.30) 1.11 (0.86, 1.45) 1.37 (1.05, 1.80)* 0.013 Model 3 Ref 1.03 (0.79, 1.34) 1.14 (0.87, 1.49) 1.41 (1.05, 1.90)* 0.016 Fresh red meat Crude Ref 1.00 (0.79, 1.27) 1.12 (0.89, 1.43) 1.14 (0.90, 1.46) 0.184 Model 1 Ref 1.02 (0.80, 1.30) 1.19 (0.93, 1.51) 1.30 (1.01, 1.66)* 0.021 Model 2 Ref 1.01 (0.78, 1.31) 1.22 (0.94, 1.58) 1.35 (1.03, 1.77)* 0.014 Model 3# Ref 1.03 (0.79, 1.34) 1.24 (0.95, 1.63) 1.37 (1.02, 1.85)* 0.019 Processed red meat Crude Ref 1.27 (1.02, 1.59)* 1.22 (1.00, 1.50)* 0.024 Model 1 Ref 1.26 (1.01, 1.57)* 1.21 (0.98, 1.49) 0.037 Model 2 Ref 1.15 (0.91, 1.45) 1.13 (0.90, 1.41) 0.212 Model 3# Ref 1.14 (0.90, 1.45) 1.13 (0.90, 1.42) 0.164 Note. Q = quartile; Ref = reference group. Data are expressed as RR (95% CI). Crude: adjusted age and gender; Model 1: based on crude, adjusted regions and household income level; Model 2: based on model 1, adjusted baseline of body mass index, urbanicity index, smoking, drinking alcohol, physical activity, and TEI; Model 3: based on model 2, adjusted dietary fiber, fat, carbohydrate, usual intake of vegetables and fruits. #Model 3: based on model 2, adjusted dietary fiber, fat, carbohydrate, usual intake of vegetable, fruit and other types of red meat; *P < 0.05. -
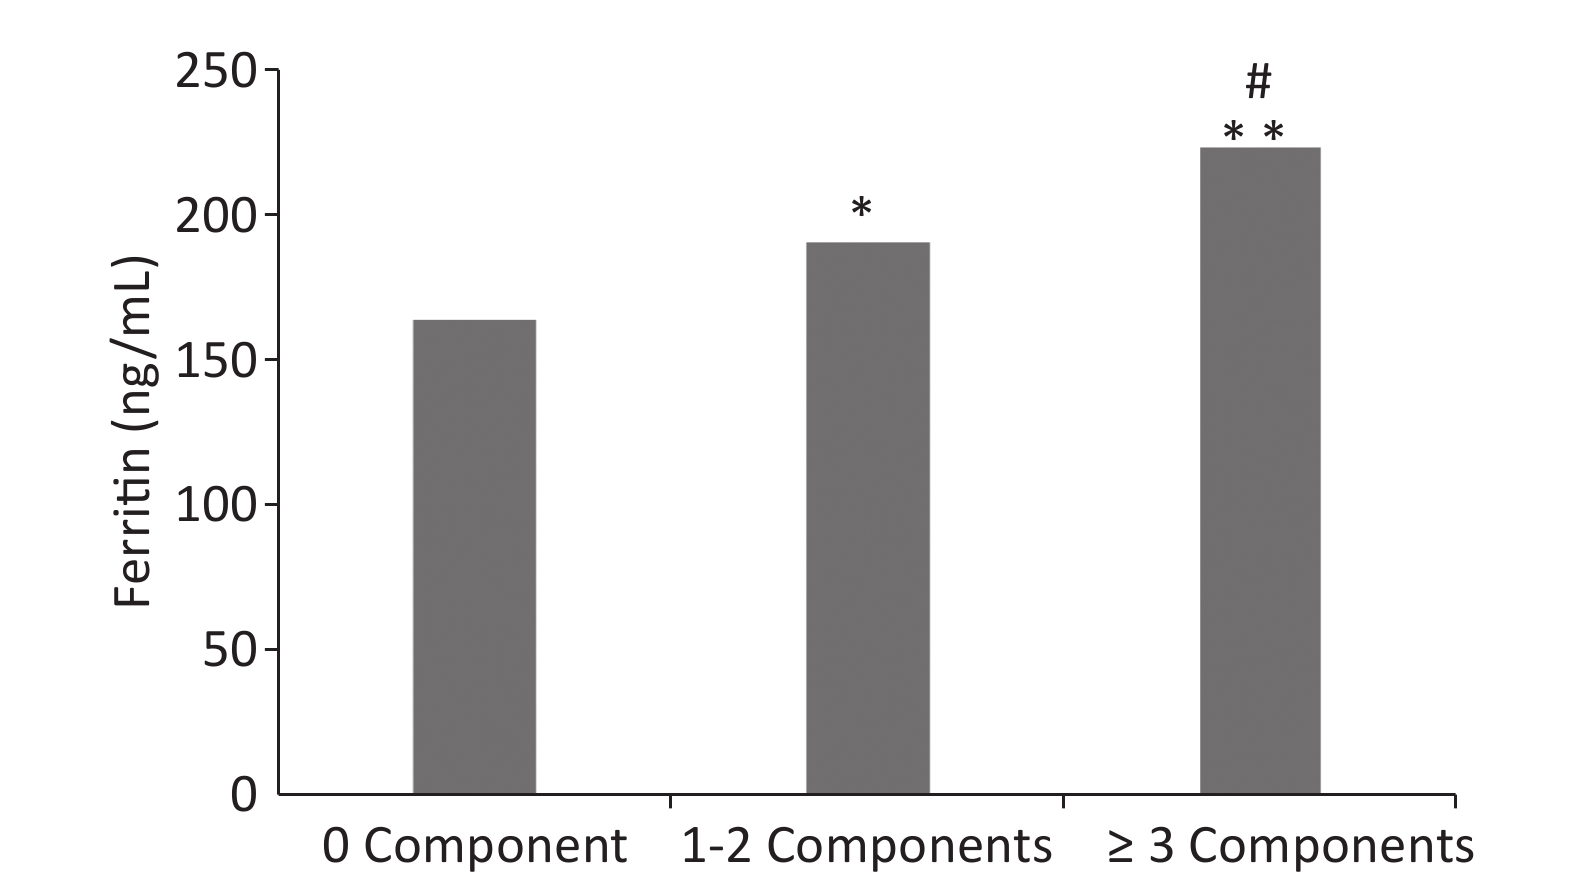
The association between metabolic syndrome risk factors and serum ferritin levels is shown in Figure 1. A number of risk factors responsible for metabolic syndrome and serum ferritin levels were positively correlated. The mean value of serum ferritin increased significantly with the number of risk factors related to metabolic syndrome (P < 0.05). In brief, a higher number of metabolic syndrome components were associated with greater serum ferritin concentrations.

Figure 1. Graph depicting differences in the average level of serum ferritin along with the number of MetS components.
-
Table 3 shows the serum ferritin quantile regression analysis among adults. The red meat usual intake had a significant positive association with serum ferritin levels across the entire conditional serum ferritin distribution (P < 0.05). The lowest serum ferritin association was seen at the 10th quantile and the highest at the 90th quantile (0.09, 0.20, 0.39, 0.61, and 0.89 at the 10th, 25th, 50th, 75th, and 90th quantiles, respectively). In addition, the fresh red meat usual intake was also positively associated with serum ferritin and the coefficients were statistically significant across the entire conditional distribution (0.22, 0.42, 0.63, and 0.88 at the 25th, 50th, 75th, and 90th quantiles, respectively). However, there was no association between processed red meat and serum ferritin levels.
Table 3. Estimation of coefficients from quantile regression analysis of serum ferritin by total red meatand its subtype usual intake
Groups Quantiles 10th 25th 50th 75th 90th Total red meat 0.09 (0.00, 0.17)* 0.20 (0.10, 0.31)* 0.39 (0.22, 0.55)* 0.61 (0.40, 0.82)* 0.89 (0.55, 1.23)* Fresh red meat1 0.08 (−0.01, 0.17) 0.22 (0.11, 0.33)* 0.42 (0.26, 0.57)* 0.63 (0.42, 0.85)* 0.88 (0.56, 1.20)* Processed red meat1 −0.15 (−0.86, 0.56) −0.23 (−0.94, 0.47) −0.66 (−1.61, 0.30) 0.23 (−0.89, 1.35) 0.14 (−1.76, 2.04) Note. Data are expressed as a coefficient (95% CI) and adjusted for gender, age, regions, urbanization index, household income, physical activity, smoking, drinking alcohol, baseline BMI, baseline serum ferritin, TEI, dietary fiber, carbohydrate, dietary fat, baseline of vegetables and fruits usual intake. 1: Adjusted for gender, age, regions, urbanicity index, household income, physical activity, smoking, alcohol drinking, baseline BMI, serum ferritin baseline, TEI, dietary fiber, carbohydrate, dietary fat, usual intake of vegetable, fruit and other types of red meat; *P < 0.01. -
The present study was based on data collected from 2,797 Chinese adults without MetS or other chronic diseases on the baseline. We found a significant longitudinal positive association between total red meat and fresh red meat usual intake and the risk of MetS. These associations showed an increasing trend. In addition, there was a positive association between MetS and serum ferritin levels as well as total red meat and fresh red meat intake had a significant association with serum ferritin levels. A similar association was not observed in the case of processed red meat.
Various potential mechanisms could explain the association between red meat usual intake and risk of MetS. Red meat contains large amounts of total fat, saturated fatty acids (SFA) and heme-iron. An earlier study has shown that a linear increase in SFA intake resulted from a high increment of red meat consumption[17]. Red meat consumption was accompanied by high energy intake. According to previous studies, total fat and SFA intake aggravated insulin resistance and increased the risk of obesity and CVDs[39, 40]. High levels of inflammatory mediators including lipid peroxidation and C-reactive protein might also be another reason for the increased risk of MetS[41]. In addition, iron overload might inhibit glucose metabolism and reduce the synthesis and secretion of pancreatic insulin[24, 42].
Earlier studies proved that red meat consumption was positively correlated with MetS, hypertension, overweight/obesity, and T2DM[16, 18, 43]. A longitudinal study from China showed that a greater intake of fatty fresh red meat was significantly associated with abdominal obesity risk in adult males[13]. However, two national representative cross-sectional studies suggested that livestock meat or pork was associated with a decreased MetS prevalence in China[15, 19]. The possible explanation for this might be that participants with MetS changed their lifestyles and dietary patterns, which were uncontrollable parameters and thus posed as the biggest limitation for these cross-sectional studies. Various studies defined the red meats differently, for example, Cocate’s study defined lean beef, high-fat beef, ground beef, lean pork, high-fat pork, and bacon/pork rinds as red meat [17]. Whereas, red meat was defined as pork, veal, beef, lamb and processed red meat (offal, ham, sausages, hamburgers, and bacon) in another study [18]. The lack of a uniform standard definition of red meat might lead to different results making it difficult to compare the results of these studies. The definition of red meat in the present study was according to the previous study[13]. Based on the usual intake of food, we found that high red meat or pork intake was positively associated with a high risk of MetS. Better economic conditions have resulted in high consumption of animal food in Chinese adults, especially pork and another livestock consumption. Previous studies have reported increased consumption of animal-based diets resulted in a transition to western dietary patterns in the Chinese population[44]. Excessive consumption of red meat was a risk factor for MetS, overweight/obesity and T2DM[12-14] thus guidelines for red meat intake were published in many countries. Dietary guidelines published in China (2016) recommended ‘Eat moderate amount of fish, poultry, eggs, and lean meats’, with emphasizes on lean meat with lower fat content. The recommendation of livestock and poultry meat intake was 50–70 g/d. In this study, the top quartile of red meat usual intake was 104.18 g/d, much more than the recommended value. In addition, the rapid development of the food industry, processed red meat products have emerged in large and would have a considerable influence on red meat consumption in the future.
In most regions of China, the red meat intake is mainly fresh pork [10, 11]. Cured and smoked pork were popular in south China (e.g. provinces of Guizhou, Hunan, and Guangxi), which were reported to be associated with an increased risk of T2DM, CVDs, and obesity[12, 45-47]. However, a similar relationship was not observed in the case of processed red meat. This could due to the fact that small amounts were consumed by participants during the entire survey period. The Chinese traditional processed red meat was seasonally consumed (mainly in winter and spring), but as the survey was conducted in autumn, this might lead to bias.
Elevated serum ferritin levels were reported to be associated with several metabolic disorders[48, 49]. A study reported that elevated ferritin concentrations were associated with a higher risk of type 2 diabetes and MetS in middle-aged and elderly Chinese adults independent of obesity, inflammation, adipokines[50]. A linear increase in the serum ferritin levels with the number of MetS components was confirmed in the present study. The exact mechanism underlying the association of the serum ferritin levels with MetS was unclear. Elevated ferritin levels might reflect systemic inflammation as well as elevated body iron stores, and inflammation was postulated to be involved in the physio pathological mechanisms responsible for MetS [51, 52]. High iron load and red meat consumption increased the risk of cardiovascular diseases[12, 53]. Furthermore, red meat was the main source of heme iron, which in turn is a major determinant of increased iron load[54]. These observations were consistent with our results that red meat and fresh red meat intake had a significant association with serum ferritin. A European study suggested that ferritin was a potential mediator linking red meat consumption to T2DM incidence but it could not prove the connection of the observed associations in the study[55]. Further research is required to confirm these findings, about ensuring the bioavailability of heme iron and its contribution to the development of MetS.
Our study design was biased. The first bias was that the CHNS was usually carried out from August to December and the dietary data of 24-hour recalls would not be true representation for all the four seasons. However, we performed the NCI method which was based on 24-hour recalls and FFQ and adopted the probability to consume a portion of food on a given day and the usual consumption-day amount to estimate the usual intake dietary intake[56]. Secondly, there were always recall biases and a potential underestimation or overestimation in dietary recalls as these were self-reported measurements by the participants. Thirdly, different ways of cooking might affect a participant’s health differently, particularly the fried and deep-fried cooking styles. Our study does not consider the cooking methods that might result in the modification of the association between red meat usual intake and the risk of MetS. Furthermore, the consumption of the Chinese traditional processed red meat was not reflected clearly in the present study. The 24-hour dietary recalls for three consecutive days were generally collected in autumn, and Chinese traditional processed red meat consumption was seasonal mainly in winter and spring. Therefore, according to the results of this study, the association of processed red meat usual intake with MetS might be underestimated. More national representative cohort studies are needed along with further work to clarify the current inconclusive outcomes regarding the association of processed red meat with MetS. Despite these limitations, CHNS (2015) is a large-scale, longitudinal epidemiological survey spanning 15 provinces, autonomous regions, and municipalities in the Chinese Mainland. CHNS had good quality control and the data from CHNS has been used in many relevant investigations for obtaining credible scientific evidence.
-
In conclusion, our observations confirmed that high red meat intake was associated with MetS and higher serum ferritin levels. These results encourage establishing public health policy measures to lower the consumption of red meat in order to decrease the burden of nutrition-related disease risk factors.
-
All authors made significant contributions to this study. HUANG Li Na analyzed the data and wrote the manuscript. WANG Hui Jun, WANG Zhi Hong, ZHANG Ji Guo, JIA Xiao Fang, and ZHANG Bing performed the surveys and helped in revising the manuscript. DING Gang Qiang critically reviewed the manuscript.
-
We thank all the participants in our study and the staff responsible for conducting the China Health and Nutrition Survey. The authors also acknowledge teams at the National Institute for Nutrition and Health, Chinese Center for Disease Control and Prevention, the Carolina Population Center, the University of North Carolina at Chapel Hill.
-
All authors have read and approved the final draft of the manuscript. Authors declare no competing interests.
doi: 10.3967/bes2020.003
Association of Red Meat Usual Intake with Serum Ferritin and the Risk of Metabolic Syndrome in Chinese Adults: A Longitudinal Study from the China Health and Nutrition Survey
-
Abstract:
Objective The present study aimed to investigate the association of red meat usual intake with metabolic syndrome (MetS), and explore the contribution of red meat usual intake to serum ferritin. Methods Based on the data from the longitudinal China Health and Nutrition Survey (CHNS), 2,797 healthy adults aged 18–75 years without hypertension, diabetes, and MetS were selected in 2009 as subjects and follow-up studies were carried out till 2015. We used the National Cancer Institute (NCI) method to estimate the usual intake of foods. Multivariable logistic regressions were performed to evaluate the association between red meat usual intake and the risk of MetS. Quantile regression analysis was used to study the relationship between red meat consumption and serum ferritin levels. Results After adjusting for potential confounders, red meat, and fresh red meat were positively associated with the risk of MetS (RR = 1.41, 95% CI: 1.05–1.90 and RR = 1.37, 95% CI: 1.02–1.85, respectively). These relationships showed increasing trend (P < 0.05). The level of serum ferritin increased significantly with the number of MetS components (P < 0.05). The quantile regression analysis showed that red meat and fresh red meat usual intake had a significant positive association with serum ferritin levels across the entire conditional serum ferritin distribution (P < 0.05). Processed red meat did not exhibit a similar association. Conclusion Higher red meat usual intake was associated with an increased risk of MetS and elevated serum ferritin levels. -
Key words:
- Usual intake /
- Red meat /
- Metabolic syndrome /
- Serum ferritin
-
Figure 1. Graph depicting differences in the average level of serum ferritin along with the number of MetS components.
*, **Indicates P < 0.05 and P < 0.01 in comparison to group 0 component respectively; #Indicates P < 0.05 in comparison to group 1-2 components.
Table 1. Baseline characteristics of all the participants according to the quartile of red meat usual intake
Factors Q1 Q2 Q3 Q4 P-value Participants 699 699 700 699 Total red meat (g/d) 15.26
(11.44, 20.07)40.46
(33.76, 45.75)66.99
(59.89, 73.78)104.18
(91.17, 123.41)Age (years), n (%) < 0.001 18−44 204 (29.18) 228 (32.62) 265 (37.86) 276 (39.48) 45−59 193 (27.61) 207 (29.61) 204 (29.14) 210 (30.04) 60−75 302 (43.2) 264 (37.77) 231 (33.00) 213 (30.47) Gender, n (%) < 0.001 Men 297 (42.49) 308 (44.06) 337 (48.14) < 0.001 Women 402 (57.51) 391 (55.94) 363 (51.86) < 0.001 Regions, n (%) < 0.001 East 231 (33.05) 285 (40.77) 230 (32.86) < 0.001 Central 391 (55.94) 273 (39.06) 271 (38.71) < 0.001 West 77 (11.02) 141 (20.17) 199 (28.43) < 0.001 Urbanization index, n (%) < 0.001 Low 381 (54.51) 234 (33.48) 187 (26.71) < 0.001 Middle 218 (31.19) 254 (36.34) 227 (32.43) < 0.001 High 100 (14.31) 211 (30.19) 286 (40.86) < 0.001 Household income, n (%) < 0.001 Low 304 (43.80) 226 (32.47) 193 (27.81) < 0.001 Middle 225 (32.42) 222 (31.90) 243 (35.01) < 0.001 High 165 (23.78) 248 (35.63) 258 (37.18) < 0.001 Physical activity, n (%) < 0.001 Low 244 (34.91) 205 (29.33) 231 (33.00) 252 (36.05) Middle 174 (24.89) 233 (33.33) 266 (38.00) 260 (37.20) High 281 (40.20) 261 (37.34) 203 (29.00) 187 (26.75) Smoking, n (%) 0.316 No 479 (68.53) 486 (69.53) 471 (67.29) 462 (66.09) Yes 220 (31.47) 212 (30.33) 229 (32.71) 237 (33.91) Alcohol, n (%) < 0.001 No 494 (70.67) 469 (67.10) 445 (63.57) 427 (61.09) Yes 205 (29.33) 229 (32.76) 255 (36.43) 272 (38.91) BMI, n (%) 0.305 Underweight 47 (6.72) 56 (8.01) 63 (9.00) 50 (7.15) Normal 427 (61.09) 413 (59.08) 431 (61.57) 434 (62.09) Overweight/obesity 225 (32.19) 230 (32.90) 206 (29.43) 215 (30.76) WC (cm) 80 (75, 87) 80 (74, 87) 79 (73, 86) 79 (73, 86) 0.006 SBP (mmHg) 120 (111, 131) 120 (110, 130) 120 (110, 129) 119 (109, 125) < 0.001 DBP (mmHg) 80 (71, 87) 79 (71, 84) 79 (71, 83) 77 (70, 81) < 0.001 HDL-C (mg/dL) 57 (50, 66) 58 (50, 68) 57 (50, 67) 56 (49, 65) 0.004 TG (mg/dL) 92 (66, 124) 92 (66, 124) 93 (65, 125) 97 (70, 132) 0.024 FBG (mg/dL) 89 (83, 96) 89 (83, 96) 90 (84, 96) 90 (84, 98) < 0.001 Serum ferritin (ng/mL) 65.46
(31.57, 119.56)66.08
(30.14, 121.66)70.54
(32.18, 131.96)84.88
(42.34, 155.56)< 0.001 TEI (kcal/day) 2047.89
(1633.48, 2491.71)2105.54
(1748.4, 2539.48)2157.35
(1821.03, 2680.92)2417.6
(2034.1, 2862.35)< 0.001 Dietary fiber (g/d) 11.33
(8.48, 15.12)10.54
(8.09, 15.11)10.27
(7.51, 14.18)9.79
(7.28, 13.53)< 0.001 Carbohydrate (g/d) 310.5
(241.2, 396.7)284.91
(226.86, 361.85)281.52
(226.69, 358.41)278.44
(222.87, 351.41)< 0.001 Dietary fat (g/d) 54.68
(37.28, 74.39)68.4
(50.6, 89.84)78.88
(59.87, 102.76)99.62
(75.21, 122.05)< 0.001 Vegetables (g/d) 296.71
(212.55, 392.42)299.36
(215.55, 390.75)303.85
(231.07, 386.47)332.79
(266.25, 400.73)< 0.001 Fruit (g/d) 0.77
(0.37, 4.07)1.19
(0.52, 53.94)1.57
(0.53, 56.03)1.89
(0.67, 63.95)< 0.001 Fresh red meat (g/d) 15.11
(11.38, 19.87)39.63
(32.94, 45.1)65.52
(58.68, 72.32)102.84
(89.7, 121.62)< 0.001 Processed red meat (g/d) 0.00 (0.00, 0.51) 0.00 (0.00, 0.73) 0.00 (0.00, 0.85) 0.38 (0.00, 0.94) < 0.001 Note. Q = quartile. Data of categorical variables are expressed as a percentage (%); Medians (interquartile ranges) were calculated for skewed parameters.  下载: 导出CSV
Table 2. The association between total red meat or its subtype usual intakes and the risk of MetS
Groups Q1 Q2 Q3 Q4 P-trend Total red meat Crude Ref 0.99 (0.78, 1.26) 1.02 (0.80, 1.29) 1.16 (0.91, 1.47) 0.197 Model 1 Ref 1.01 (0.80, 1.29) 1.08 (0.84, 1.38) 1.31 (1.02, 1.67)* 0.025 Model 2 Ref 1.00 (0.78, 1.30) 1.11 (0.86, 1.45) 1.37 (1.05, 1.80)* 0.013 Model 3 Ref 1.03 (0.79, 1.34) 1.14 (0.87, 1.49) 1.41 (1.05, 1.90)* 0.016 Fresh red meat Crude Ref 1.00 (0.79, 1.27) 1.12 (0.89, 1.43) 1.14 (0.90, 1.46) 0.184 Model 1 Ref 1.02 (0.80, 1.30) 1.19 (0.93, 1.51) 1.30 (1.01, 1.66)* 0.021 Model 2 Ref 1.01 (0.78, 1.31) 1.22 (0.94, 1.58) 1.35 (1.03, 1.77)* 0.014 Model 3# Ref 1.03 (0.79, 1.34) 1.24 (0.95, 1.63) 1.37 (1.02, 1.85)* 0.019 Processed red meat Crude Ref 1.27 (1.02, 1.59)* 1.22 (1.00, 1.50)* 0.024 Model 1 Ref 1.26 (1.01, 1.57)* 1.21 (0.98, 1.49) 0.037 Model 2 Ref 1.15 (0.91, 1.45) 1.13 (0.90, 1.41) 0.212 Model 3# Ref 1.14 (0.90, 1.45) 1.13 (0.90, 1.42) 0.164 Note. Q = quartile; Ref = reference group. Data are expressed as RR (95% CI). Crude: adjusted age and gender; Model 1: based on crude, adjusted regions and household income level; Model 2: based on model 1, adjusted baseline of body mass index, urbanicity index, smoking, drinking alcohol, physical activity, and TEI; Model 3: based on model 2, adjusted dietary fiber, fat, carbohydrate, usual intake of vegetables and fruits. #Model 3: based on model 2, adjusted dietary fiber, fat, carbohydrate, usual intake of vegetable, fruit and other types of red meat; *P < 0.05.
下载: 导出CSV
Table 3. Estimation of coefficients from quantile regression analysis of serum ferritin by total red meatand its subtype usual intake
Groups Quantiles 10th 25th 50th 75th 90th Total red meat 0.09 (0.00, 0.17)* 0.20 (0.10, 0.31)* 0.39 (0.22, 0.55)* 0.61 (0.40, 0.82)* 0.89 (0.55, 1.23)* Fresh red meat1 0.08 (−0.01, 0.17) 0.22 (0.11, 0.33)* 0.42 (0.26, 0.57)* 0.63 (0.42, 0.85)* 0.88 (0.56, 1.20)* Processed red meat1 −0.15 (−0.86, 0.56) −0.23 (−0.94, 0.47) −0.66 (−1.61, 0.30) 0.23 (−0.89, 1.35) 0.14 (−1.76, 2.04) Note. Data are expressed as a coefficient (95% CI) and adjusted for gender, age, regions, urbanization index, household income, physical activity, smoking, drinking alcohol, baseline BMI, baseline serum ferritin, TEI, dietary fiber, carbohydrate, dietary fat, baseline of vegetables and fruits usual intake. 1: Adjusted for gender, age, regions, urbanicity index, household income, physical activity, smoking, alcohol drinking, baseline BMI, serum ferritin baseline, TEI, dietary fiber, carbohydrate, dietary fat, usual intake of vegetable, fruit and other types of red meat; *P < 0.01.
下载: 导出CSV
-
[1] GBD 2017 Causes of Death Collaborators. Global, regional, and national age-sex-specific mortality for 282 causes of death in 195 countries and territories, 1980-2017: a systematic analysis for the Global Burden of Disease Study 2017. Lancet, 2018; 392. [2] Sacco RL, Roth GA, Reddy KS, et al. The heart of 25 by 25: achieving the goal of reducing global and regional premature deaths from cardiovascular diseases and stroke. Circulation, 2016; 133, e674−90. [3] Liu S, Li Y, Zeng X, et al. Burden of cardiovascular diseases in China, 1990-2016: findings from the 2016 Global Burden of Disease Study. JAMA Cardio, 2019; 4, 342−52. doi: 10.1001/jamacardio.2019.0295 [4] Chen W, Gao R, Liu L, et al. Chinese cardiovascular disease report 2017: a summary. Chin Circul J, 2018; 33, 1−8. [5] Zhou M, Wang H, Zhu J, et al. Cause-specific mortality for 240 causes in China during 1990-2013: a systematic subnational analysis for the Global Burden of Disease Study 2013. Lancet, 2016; 387, 251−72. doi: 10.1016/S0140-6736(15)00551-6 [6] Alberti K, George MM, Zimmet P, et al. The metabolic syndrome-a new worldwide definition. Lancet, 2005; 366, 1059−62. doi: 10.1016/S0140-6736(05)67402-8 [7] Reilly MP, Rader DJ. The metabolic syndrome: more than the sum of its parts? Circulation, 2003; 108, 1546−51. doi: 10.1161/01.CIR.0000088846.10655.E0 [8] Wannamethee SG, Shaper AG, Lennon L, et al. Metabolic syndrome vs framingham risk score for prediction of coronary heart disease, stroke, and type 2 diabetes mellitus. JAMA Inter Med, 2005; 165, 2644−50. doi: 10.1001/archinte.165.22.2644 [9] Popkin BM, Adair LS, Ng SW. Global nutrition transition and the pandemic of obesity in developing countries. Nutr Rev, 2012; 70, 3−21. doi: 10.1111/j.1753-4887.2011.00456.x [10] Wang ZH, Zhang Bing, Wang HJ, et al. Status of meat consumption patterns of the residents aged 18-59 in 15 provinces (autonomous regions and municipalities) of China in 2015. J Hyg Res, 2019; 48, 1−8. (In Chinese) [11] Wang LS, Zhang Bing, Wang HJ, et al. Status of meat consumption patterns of the elder residents in 15 provinces (autonomous regions and municipalities) of China. Food and Nutrition in China, 2018; 24, 13−9. (In Chinese) [12] Yip CSC, Lam W, Fielding R. A summary of meat intakes and health burdens. Eur J Clin Nutr, 2018; 72, 18−29. doi: 10.1038/ejcn.2017.117 [13] Wang Z, Zhang B, Zhai F, et al. Fatty and lean red meat consumption in China: differential association with Chinese abdominal obesity. Nutr Metab Cardiovasc Dis, 2014; 24, 869−76. doi: 10.1016/j.numecd.2014.03.002 [14] Stettler N, Murphy MM, Barraj LM, et al. Systematic review of clinical studies related to pork intake and metabolic syndrome or its components. Diabetes Metab Syndr Obes, 2013; 6, 347−57. [15] Li Y, Zhao L, Yu D, et al. Metabolic syndrome prevalence and its risk factors among adults in China: a nationally representative cross-sectional study. PLoS One, 2018; 13, e0199293. doi: 10.1371/journal.pone.0199293 [16] Babio N, Sorli M, Bullo M, et al. Association between red meat consumption and metabolic syndrome in a Mediterranean population at high cardiovascular risk: cross-sectional and 1-year follow-up assessment. Nutr Metab Cardiovasc Dis, 2012; 22, 200−7. doi: 10.1016/j.numecd.2010.06.011 [17] Cocate PG, Natali AJ, de Oliveira A, et al. Red but not white meat consumption is associated with metabolic syndrome, insulin resistance and lipid peroxidation in Brazilian middle-aged men. Eur J Prev Cardiol, 2015; 22, 223−30. doi: 10.1177/2047487313507684 [18] Becerra-Tomas N, Babio N, Martinez-Gonzalez MA, et al. Replacing red meat and processed red meat for white meat, fish, legumes or eggs is associated with lower risk of incidence of metabolic syndrome. Clin Nutr, 2016; 35, 1442−9. doi: 10.1016/j.clnu.2016.03.017 [19] Hu YS, Zhai FY, He YN, et al. Relationship between metabolic syndrome and dietary modalities in Chinese population. Pra Pre Med, 2008; 15, 1−8. (In Chinese) [20] He YN, Zhao WH, Bai GY, et al. Relationship between meat consumption and metabolic syndrome in adults in China. China J Epidemiol, 2018; 39, 892−7. (In Chinese) [21] Williams MJ, Poulton R, Williams S. Relationship of serum ferritin with cardiovascular risk factors and inflammation in young men and women. Atherosclerosis, 2002; 165, 179−84. doi: 10.1016/S0021-9150(02)00233-2 [22] Wang W, Knovich MA, Coffman LG, et al. Serum ferritin: past, present and future. Biochim Biophys Acta, 2010; 1800, 760−9. doi: 10.1016/j.bbagen.2010.03.011 [23] Robert E, Fleming, Ponka P. Iron overload in human disease. New Engl J Med, 2012; 366, 348−59. doi: 10.1056/NEJMra1004967 [24] Jin YL, He LP, Chen Y, et al. Association between serum ferritin levels and metabolic syndrome: an updated meta-analysis. Int J Clin Exp Med, 2015; 8, 13317−22. [25] Popkin BM, Du S, Zhai F, et al. Cohort Profile: the China Health and Nutrition Surveye monitoring and understanding socio-economic and health change in China, 1989-2011. Int J Epidemiol, 2010; 39, 1435−40. doi: 10.1093/ije/dyp322 [26] Li Y, Song J, Pan H, et al. Valldity of food freouency ouestlonnaire to l nvestigate the dletary energy and nutrients intake. Acta Nutr Sinica, 2006; 28, 143−7. (In Chinese) [27] Zhai FY, Barry M Popkin, Ma LM, et al. The evaluation of the 24-hour individual dietary recall method in China. J Hyg Res, 1996; 25, 51−6. (In Chinese) [28] Li YP, Wang Dong, He YN. Comparative study on the results of energy and nutrients intakes investigated by different evaluation methods. Chin J Prey Contr Chron Non-commtm Dis, 2007; 15, 79−83. [29] Yang YX, Wang GW, Pan XC. China food composition. Beijing: Peking University Medical Press, 2009; 384. [30] Tooze JA, Kipnis V, Buckman DW, et al. A mixed-effects model approach for estimating the distribution of usual intake of nutrients: the NCI method. Stat Med, 2010; 29, 2857−68. doi: 10.1002/sim.4063 [31] Tooze JA, Midthune D, Dodd KW, et al. A new statistical method for estimating the usual intake of episodically consumed foods with application to their distribution. J Am Diet Assoc, 2006; 106, 1575−87. doi: 10.1016/j.jada.2006.07.003 [32] National Cancer Institute. Usual dietary intakes: the NCI method. https://epi.grants.cancer.gov/diet/usualintakes/method.html. [2018-12-30]. [33] Souverein OW, Dekkers AL, Geelen A, et al. Comparing four methods to estimate usual intake distributions. Eur J Clin Nutr, 2011; 65 Suppl 1, S92−101. [34] National Health and Family Planning Commission of the People's Republic of China. WS/T 428-2013, Criteria of weight for adults. Beijing, 2013. [35] Huang L, Wang H, Wang Z, et al. Regional disparities in the association between cereal consumption and metabolic syndrome: results from the China health and nNutrition survey. Nutrients, 2019; 11. [36] Wang Z, Siega-Riz AM, Gordon-Larsen P, et al. Diet quality and its association with type 2 diabetes and major cardiometabolic risk factors among adults in China. Nutr Metab Cardiovasc Dis, 2018; 28, 987−1001. doi: 10.1016/j.numecd.2018.06.012 [37] Alberti KGMM, Eckel RH, Grundy SM, et al. Harmonizing the metabolic syndrome. Circulation, 2009; 120, 1640−5. doi: 10.1161/CIRCULATIONAHA.109.192644 [38] Jones-Smith JC, Popkin BM. Understanding community context and adult health changes in China: development of an urbanicity scale. Soc Sci Med, 2010; 71, 1436−46. doi: 10.1016/j.socscimed.2010.07.027 [39] Oh K, Hu FB, Manson JE, et al. Dietary fat intake and risk of coronary heart disease in women: 20 years of follow-up of the nurses' health study. Am J Epidemiol, 2005; 161, 672−9. doi: 10.1093/aje/kwi085 [40] Riserus U, Willett WC, Hu FB. Dietary fats and prevention of type 2 diabetes. Prog Lipid Res, 2009; 48, 44−51. doi: 10.1016/j.plipres.2008.10.002 [41] Ley SH, Sun Q, Willett WC, et al. Associations between red meat intake and biomarkers of inflammation and glucose metabolism in women. Am J Clin Nutr, 2014; 99, 352−60. doi: 10.3945/ajcn.113.075663 [42] Aune D, Ursin G, Veierod MB. Meat consumption and the risk of type 2 diabetes: a systematic review and meta-analysis of cohort studies. Diabetologia, 2009; 52, 2277−87. doi: 10.1007/s00125-009-1481-x [43] WANG ZH, ZHANG Bing, WANG HJ, et al. Study on the multilevel and longitudinal association between red meat consumption and changes in body mass index body weight and risk of incident overweight among Chinese adults. Chin J Epidemiol, 2013; 34, 661−7. (In Chinese) [44] Batis C, Sotres-Alvarez D, Gordon-Larsen P, et al. Longitudinal analysis of dietary patterns in Chinese adults from 1991 to 2009. Br J Nutr, 2014; 111, 1441−51. doi: 10.1017/S0007114513003917 [45] Jia H. Research on Prevalence and characteristic of obesity and relationship to the related diseases among rural adult residents in hazakh and uyger population from Xinjiang[M]//UNIVERSITY S. 2014. [46] Feskens EJ, Sluik D, van Woudenbergh GJ. Meat consumption, diabetes, and its complications. Curr Diab Rep, 2013; 13, 298−306. doi: 10.1007/s11892-013-0365-0 [47] Rouhani MH, Salehi-Abargouei A, Surkan PJ, et al. Is there a relationship between red or processed meat intake and obesity? A systematic review and meta-analysis of observational studies. Obes Rev, 2014; 15, 740−8. doi: 10.1111/obr.12172 [48] Ryoo JH, Kim MG, Lee DW, et al. The relationship between serum ferritin and metabolic syndrome in healthy Korean men. Diabetes Metab Res Rev, 2011; 27, 597−603. doi: 10.1002/dmrr.1211 [49] Hämäläinen P, Saltevo J, Kautiainen H, et al. Serum ferritin levels and the development of metabolic syndrome and its components: a 6.5-year follow-up study. Diabetol Metab Syndr, 2014; 6, 114. [50] Sun L, Franco OH, Hu FB, et al. Ferritin concentrations, metabolic syndrome, and type 2 diabetes in middle-aged and elderly chinese. J Clin Endocrinol Metab, 2008; 93, 4690−6. doi: 10.1210/jc.2008-1159 [51] Kell DB, Pretorius E. Serum ferritin is an important inflammatory disease marker, as it is mainly a leakage product from damaged cells. Metallomics, 2014; 6, 748−73. doi: 10.1039/C3MT00347G [52] Syauqy A, Hsu CY, Rau HH, et al. Association of dietary patterns with components of metabolic syndrome and inflammation among middle-aged and older adults with metabolic syndrome in Taiwan. Nutrients, 2018; 10. [53] Basuli D, Stevens RG, Torti FM, et al. Epidemiological associations between iron and cardiovascular disease and diabetes. Front Pharmacol, 2014; 5, 117. [54] Fang M, Mirutse G, Guo L, et al. Role of socioeconomic status and housing conditions in geriatric depression in rural China: a cross-sectional study. BMJ Open, 2019; 9, e024046. doi: 10.1136/bmjopen-2018-024046 [55] Wittenbecher C, Muhlenbruch K, Kroger J, et al. Amino acids, lipid metabolites, and ferritin as potential mediators linking red meat consumption to type 2 diabetes. Am J Clin Nutr, 2015; 101, 1241−50. doi: 10.3945/ajcn.114.099150 [56] Janet A, Tooze DM, Kevin W Dodd. A new method for estimating the usual intake of episodicallyconsumed foods with application to their distribution. J Am Diet Assoc, 2006; 106, 22. doi: 10.1016/j.jada.2005.10.008 -

 点击查看大图
计量
- 文章访问数: 2673
- HTML全文浏览量: 1112
- PDF下载量: 215
- 被引次数: 0


 Quick Links