


HTML
-
Hepatocellular carcinoma (HCC) is the sixth most common cancer worldwide, and is the third leading cause mortality of all malignancies[1]. China's burden represents more than half of HCC cases and deaths globally[2]. The 5-year survival rate for early-stage HCC patients, who are eligible for surgical resection, is between 50% and 70%. However, in most patients, HCC is detected at an advanced stage, with only 20% of these patients eligible for surgical treatment[3]. Sorafenib, a multi-target tyrosine kinase inhibitor[4], is a targeting drug approved by the Food and Drug Administration (FDA) of the USA for advanced hepatocellular carcinoma as Regorafenib, a second line therapy[5]. It has been proven to improve the survival of patients with advanced HCC[6-8] and has become the standardized care for the patients[6, 9]. Sorafenib-related toxicities, including the most frequently reported adverse events, hand-foot syndrome and gastrointestinal toxicity, may contribute to the dose reduction and failure of therapy, thus decreasing the survival benefits of sorafenib in a proportion of treated patients[1, 3, 10-12]. Clinical studies have shown that patients treated with sorafenib exhibit inter-individual variability in adverse events, clinical efficacy, and pharmacokinetics such as the sorafenib exposure, peak plasma concentrations, and the median time to peak plasma concentration[13-15].
In the liver, sorafenib can be metabolized to oxidative metabolites. This is mediated by cytochrome P450 enzymes (CYPs) and uridine diphosphate glucuronosyltransferase (UGT) 1A9. The human CYP system, expressed mainly in the liver[16], consists of eighteen families and forty-four subfamilies involved in specific endogenous functions. Only the CYP 1, 2, and 3 families, including a dozen of enzymes, mediate the oxidative biotransformation of most drugs, including sorafenib[17, 18]. More than 75% of prescribed drugs undergo CYP-dependent metabolism mediated by enzymes of the CYP3A, CYP2D6, and CYP2C families[17]. Although these enzymes have broad and overlapping substrate specificities, a single or a few enzymes can mediate the control of clinical concentrations of several drugs[18]. Alterations in the activities of a broad range of CYPs resulting from genetic polymorphism[17] can lead to the inter-individual variability in the pharmacokinetics of many clinical drugs and in the levels of internal drug exposure[19, 20]. The frequencies of different CYP genotypes vary among populations with diverse races and ethnic backgrounds[21-23]. However, the underlying correlation between the different CYP genotypes and sorafenib therapy had not been studied till now.
The CYP3A subfamily, of which the most abundant isoform is CYP3A4, is the largest family of cytochrome P450 system in the human liver. This subfamily accounts for the metabolism of about 50% of prescribed drugs[17, 24]. Although CYP3A5 is mostly expressed in extra-hepatic sites, CYP3A5 shares about 83% of its amino acid sequences with CYP3A4[24]. CYP2D6, the most polymorphic form of CYPs, accounts for only 2% of total number of CYPs in human adult liver. However, it is responsible for the biotransformation of 15% to 25% clinical used drugs[17, 18]. We proposed that inter-individual differences in the response of HCC patients treated with sorafenib may be due to the highly variable polymorphic forms of CYPs. In this study, we screened the frequencies of the significant genotypes of CYPs reported in Chinese population and investigated the relationship between the largest distributed genotypes of CYPs and the various responses of HCC patients to sorafenib therapy.
-
A total of 300 cases, defined as HCC by pathological diagnosis, were sampled randomly from the Eastern Hepatobiliary Surgery Hospital, the Second Military Medical University, China, from May 5th, 2010 to June 6th, 2013.
The inclusion criteria were as follows: (1) ages from 18 to 60 years old [25], (2) confirmation of HCC by pathologically histological examination, (3) confirmation of liver cirrhosis by imaging examinations, (4) infection with HCV or HBV, (5) tumor tissues enriched with blood vessels, (6) treatment with sorafenib.
The exclusion criteria were as follows: (1) absence of cirrhosis, (2) lack of evidence of HBV and HCV infection, (3) absence of rich blood vessels in tumor tissues, (4) presence of lung metastasis, breast metastasis, pancreas metastasis or metastasis into other organs, (5) pregnancy, (6) allergy to sorafenib or any identified contraindications to sorafenib.
Meanwhile, 300 blood samples were collected from the Chinese healthy population to make up the control group. Peripheral blood was collected from patients recruited into the study. Using a DNA extraction kit (Qiagen), genomic DNA was extracted from these samples according to the manufacturer's instructions, and then stored at -20 ℃.
-
Total DNA was extracted from whole blood using the DNAzolTM BD Reagent (Thermo Fisher), according to the manufacturer's protocols. PCR analyses were performed using an ABI 7300 Fast Real-Time PCR System (Applied Biosystems, Foster City, CA) and SYBR Green PCR kit (Applied TaKaRa, Otsu, Shiga, Japan).
-
Pathogen-free male Sprague-Dawley rats (weighing 160-180 g) were obtained from the Shanghai Experimental Center, Chinese Science Academy, Shanghai, and maintained at an animal facility under pathogen-free conditions. According to the results of genetic polymorphism tests using allele-specific PCR and long-fragment sequencing, a total of 120 rats were grouped into 4 groups based on the following genotypes, CYP3A4*1, CYP3A5*3, CYP2C19*2, and CYP2D6*10, respectively. The blood of rats was collected using retrobulbar venous plexus blood extraction. To build a rat model for induced liver cancer, daily chow was mixed with 0.001-0.015 ppm of aflatoxin and provided to rats recruited for seven months. Changes in hepatic and renal function parameters such as alanine aminotransferase (ALT), aspartate aminotransferase (AST), blood urea nitrogen (BUN), and creatinine (Cr) of peripheral blood were simultaneously monitored weekly. Alpha fetoprotein (AFP) and the weights of the rats were also evaluated. All the HCC rat models were treated with sorafenib via intragastric administration twice a day. Furthermore, hepatic and renal function and changes of the plasma concentration of sorafenib were all monitored weekly.
-
First, the peripheral blood genome DNA extraction kit (Qiagen) was used for DNA extraction. Allele-specific PCR and long-fragment gene sequencing was used to identify the frequencies of CYP450 polymorphs in the Chinese population.
-
All data in this study represents at least three experiments. Data was expressed as the mean ± SEM. Differences between groups were compared using Student's t-test or two-way ANOVA. Statistical significance was determined as P < 0.05. The analysis was performed using GraphPad Prism software (San Diego, CA, USA).
Clinical Blood Samples and DNA Extraction
PCR
Animal Experiments
CYP3A4 Genotype Identification
Data Analysis
-
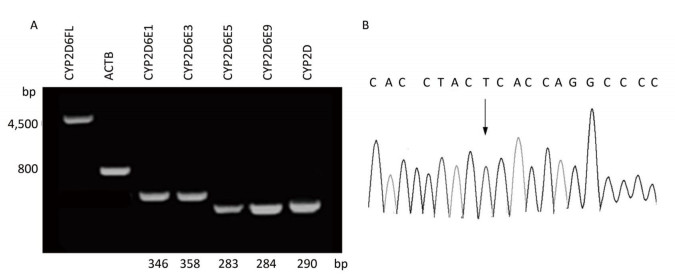
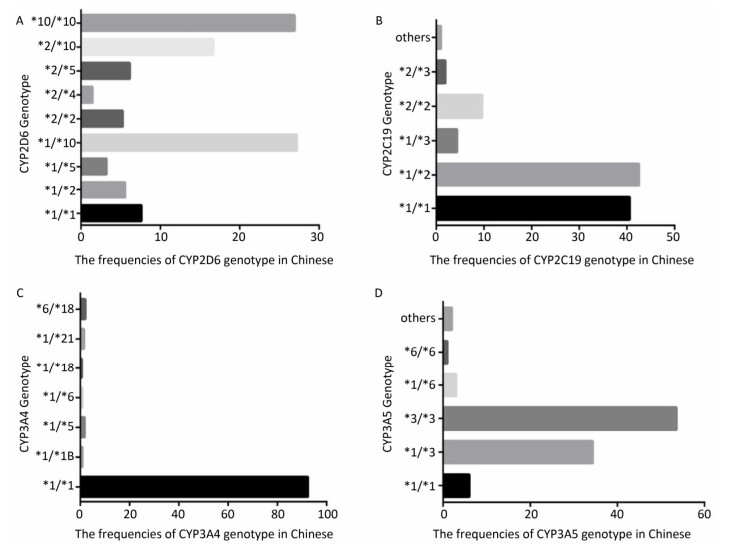
To identify the distribution of CYPs families and subfamilies within the Chinese population, a total of 600 blood samples, including 300 HCC patients and 300 healthy people were collected and DNA was extracted. We utilized allele-specific PCR and long-fragment gene sequencing technique (Supplementary Figures S1 and S2 available in www.besjournal.com). The results revealed that in the Chinese population, the most common member of CYP3A4 family was the wildtype with normal function. In both CYP3A5 and CYP2D6 families, two mutant types with weaker function had the highest expression level. In CYP2C19 family, the wild type and one mutant type was found in about 50% in Chinese population. This indicates that the function of CYP2C19 was evidently decreased in half of the population (Figure 1).
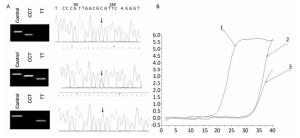
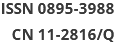
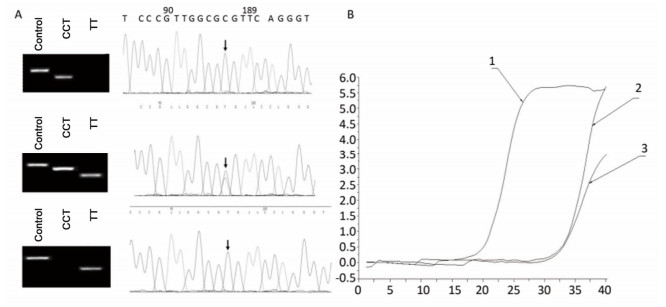
Figure Supplementary Figure S1. Allele-specific PCR for the detection of CYP3A5 gene polymorphism. A. Comparison of allele-specific PCR gel electrophoresis results and sequencing results of different allele loci. B. Allele fluorescence quantitative PCR test results.
Figure Supplementary Figure S2. Long fragment gene sequencing for detection of CYP2D6 gene polymorphism results. A. DNA gel electrophoresis results of different amplified CYP2D6 gene fragments. B. 10* sequencing results of CYP2D6 gene polymorphism.
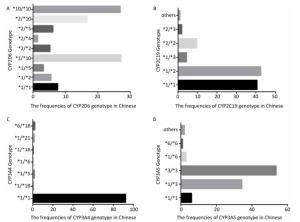
Figure 1. The respective mutational distribution of CYP2D6 (A), CYP2C19 (B), CYP3A4 (C), and CYP3A5 (D) in Chinese population (n = 600). The mRNA expression frequency of various CYP2D6, CYP2C19, CYP3A4, CYP3A5 genotypes is identified through Allele-specific PCR and Long-term gene sequencing.
-
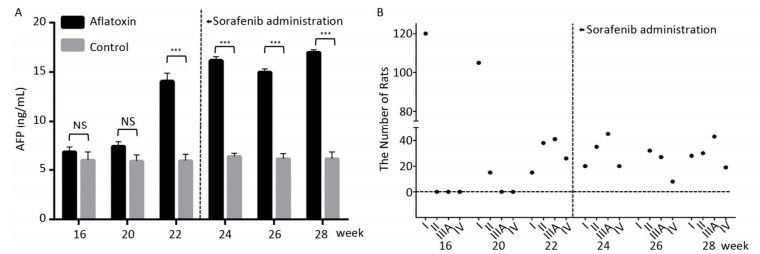
Since CYP450 plays a crucial role in the metabolic process of sorafenib, we assumed that predominantly expressing a mutant CYP genotype might closely influence drug efficacy and frequency of adverse effects. We planned to confirm our hypothesis using animal models. The rat chow was mixed with aflatoxin and fed to rats for 3 months. AFP levels (15 ± 2.5 ng/mL after 22 weeks) in peripheral blood increased significantly with the extension of feeding time compared to the control group (6 ± 0.9 ng/mL). However, after the administration of sorafenib on the 22th week, AFP levels stopped climbing and remain constant (Figure 2A). After comparing ultrasonography images to those from the control group, the HCC rat models were grouped into an early stage group (Ⅰ), an intermediate stage group (Ⅱ) and a terminal stage group (ⅢA and Ⅳ). After 22 weeks and before sorafenib treatment, 105 of 120 rats were induced into HCC successfully with an incidence rate of 87.5%. There were 38, 41, and 26 rats in early stage group (Ⅰ), intermediate stage group (Ⅱ) and terminal stage group (ⅢA and Ⅳ), respectively. However, after sorafenib treatment, most tumors responded to the drug and shrank significantly. After 6 weeks of treatment, only 19 rats remained in the terminal stage group (Figure 2B).
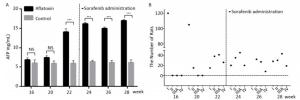
Figure 2. The therapeutic effect of sorafenib in aflatoxin-induced HCC rat model. (A) The changes of AFP levels (ng/mL) in aflatoxin-feeding group and control group before and after sorafenib administration. Sorafenib is administered at the 22th week. Two groups are compared at indicated times. Data are presented as mean ± SEM (n = 10). *P < 0.05, **P < 0.01, ***P < 0.001. (B) Tumor stage progression in aflatoxin-induced HCC rat before and after sorafenib administration. Sorafenib is administered at the 22th week.
-
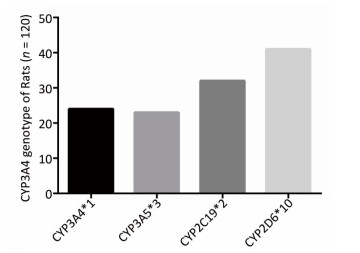
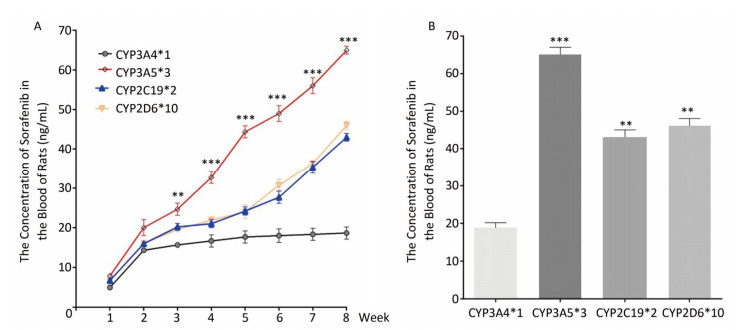
To determine the metabolic efficacy of certain CYP genotypes on sorafenib, we assigned cancer-induced rats into four groups based on their predominant CYP genotype expression (Supplementary Figure S3 available in www.besjournal.com). After receiving sorafenib treatment for eight weeks, the level of sorafenib plasma concentration varied significantly among the aflatoxin-induced HCC model rats with different genotypes of CYPs (Figure 3A). The rat models with the polymorphic form of CYP3A4*1 had the lowest levels of sorafenib plasma concentration (8 ± 2.5 ng/mL), while the rat models with the polymorphic form of CYP3A5*3 had the highest levels (67 ± 4.8 ng/mL) (Figure 3B).

Figure Supplementary Figure S3. The CYP genotype distribution of 120 rats.
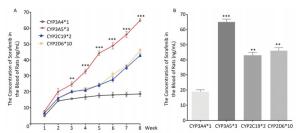
Figure 3. Different CYP genotypes greatly affect the concentration of sorafenib in the blood of rats. (A) Analysis of blood sorafenib concentration change in four different CYP genotype groups. Data are presented as mean ± SEM (n = 10). *P < 0.05; **P < 0.01; ***P < 0.001. CYP3A4*1 is compared with CYP3A5*3 at indicated times. (B) The blood sorafenib concentration of four groups at the 8th week. CYP3A4*1 is compared with the rest 3 groups. Data are presented as mean ± SEM (n = 10). *P < 0.05; **P < 0.01; ***P < 0.001.
-
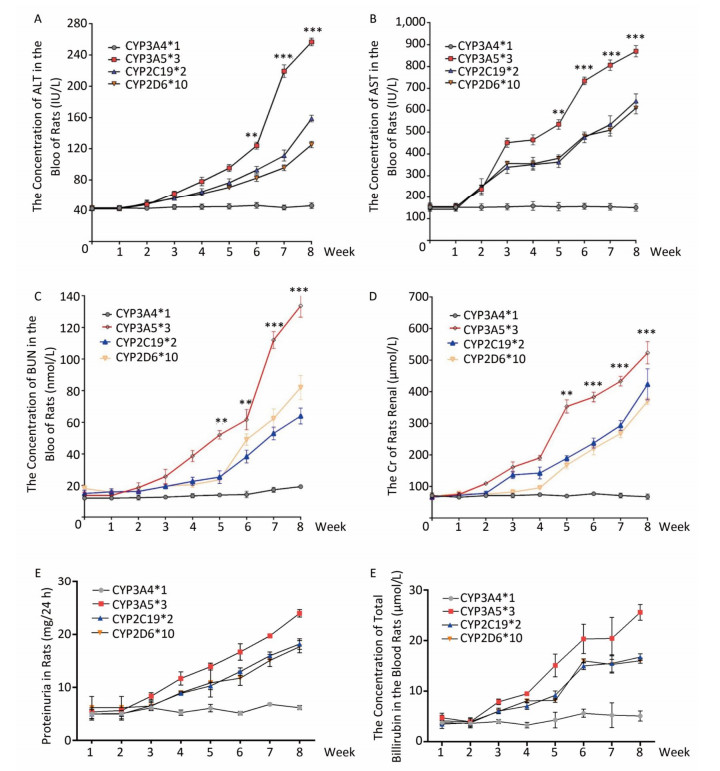
To explore the relationship between polymorphic forms of CYPs and variations in response to sorafenib therapy on rat models, we inspected damage to hepatic and renal function. Parameters related to hepatic injury, ALT and AST showed markedly different trends in different CYP genotypes. Rats in the CYP3A5*3 group showed the most severe liver injury, while rats in the CYP3A4*1 group showed the least severe injury (Figure 4A, 4B, 4F). Consistent with hepatic and renal injury-related parameters, BUN and Cr increased most quickly in the CYP3A5*3 group and slowest in the CYP3A4*1 group (Figure 4C, 4D, 4E).
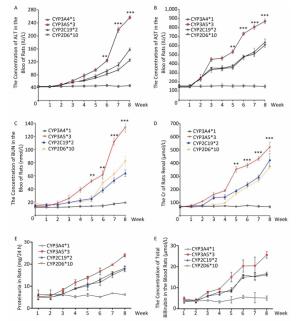
Figure 4. Sorafenib-related hepatic and renal damage vary significantly between four groups with different CYP genotype. (A) ALT. (B) AST. (C) BUN. (D) Cr. (E) Proteinuria. (F) Total bilirubin. Data are presented as mean ± SEM (n = 10). *P < 0.05; **P < 0.01; ***P < 0.001.
-
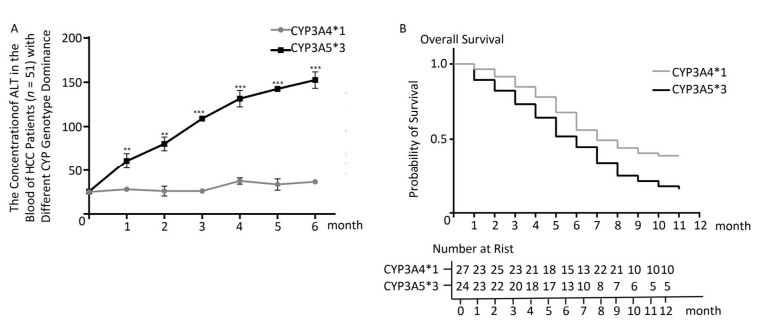
In HCC rat models, we confirmed that CYP genetic polymorphism plays an important role in sorafenib-induced organ damage and drug efficacy. To test the clinical significance of our findings, we recruited 51 advanced HCC patients the basic characteristics of the patients were shown in Table 1, 24 of which showed CYP3A5*3 expression dominance. The other 27 showed CYP3A4*1 expression dominance. After sorafenib administration, ALT levels increased quickly in the CYP3A5*3 group, with only little fluctuations in the CYP3A4*1 group (Figure 5A). AST levels exhibited the same tendency (data not shown). However, BUN and Cr showed no marked difference between the two different groups (data not shown), which is not concordant with other results. Intriguingly, rats in the CYP3A4*1 group showed improved survival compared to rats in the CYP3A5*3 group (Figure 5B).
Variables Data Age* 53.88 ± 13.67 Gender (Female, %) 3 (5.88) Preoperative AFP, n (%)* > 20 ng/mL 35 (68.63) ≤ 20 ng/mL 16 (31.37) HBV infection, n (%) 51 (100) HBV DNA, n(%) 32 (62.75) Total bilirubin (μmol/L)* 18.78 ± 8.63 Albumin (g/L)* 42.39 ± 4.20 ALT (U/L)* 72.02 ± 148.19 AST (U/L)* 83.74 ± 133.01 Portal hypertension, n (%) 14 (27.45) Cirrhosis, n (%) 20 (39.22) Tumor size (cm)* 6.90 ± 4.57 Vascular invasion, n (%) 13 (25.49) Tumor capsule, n (%) 20 (39.22) Note. AFP, alpha fetoprotein; HBV, hepatitis B virus; ALT, alanine aminotransferase; AST, aspartate aminotransferase. *Data were not available for all patients. Table 1. Baseline Characteristics of the Patients with HCC (n = 51)

Figure 5. The classification of CYPs in sorafenib treated HCC patients might have great clinical significance. (A) Analysis of blood ALT level in two patient groups with predominant CYP3A4*1 and CYP3A5*3 expression respectively. Data are presented as mean ± SEM (n = 10). *P < 0.05; **P < 0.01; ***P < 0.001. (B) Survival analysis of CYP3A4*1 and CYP3A5*3 patient group.
Screening of CYPs Genetic Polymorphism in Chinese Population
Construction of the Drug-induced HCC Animal Model
Correlation Analysis between Sorafenib Plasma Concentration and CYP Polymorphism
Correlation Analysis between Hepatic and Renal Function and CYP Polymorphism in HCC Rat Models Treated with Sorafenib
Possible Clinical Significance of CYP Classification in Sorafenib Treated HCC Patients
-
Sorafenib, as the first-line therapy for advanced HCC, undergoes CYP450 enzyme-dependent biotransformation[6, 9, 26]. Genetically, polymorphic CYP450 enzymes are primarily expressed in the liver. Most clinically administered drugs are metabolized by CYPs, especially by CYP3A4, CYP2D6, and CYP2C[17]. Therefore, various polymorphic forms of CYP among different populations may give rise to the variability in enzymatic activities[22, 27, 28], leading to great population-dependent differences in efficacy of clinically administered drugs and potential adverse events[29, 30]. However, no systemic research is currently available that describes the influence of CYP genetic polymorphism on sorafenib metabolism and its adverse actions.
In our study, polymorphisms of CYP3A4, CYP3A5, CYP2D6, and CYP2C19 genotypes were screened in the Chinese population. According to results of the screening, CYP3A4 genotypes primarily exist as wild types (CYP3A4*1/*1) with average function, similar to the results of previous studies in Chinese populations[17, 31]. The prevalence of CYP2D6 genotypes is approximately 50% wild type and 50% mutant type (CYP2D6*10) with decreased function, differing from what obtains in the Caucasian[32] and African[33] populations, but similar to results from previous studies in Asian populations[18, 34]. The most prevalent polymorphic form of CYP3A5 genotypes is also a mutant type (CYP3A5*3), which is also different from what obtains in Caucasian[35], Hispanic and Black populations[17]. The most predominant mutant type of CYP2C19 (CYP2C19*2) is expressed at about the same level as its wild type. Previous studies reported that CYP2C19*2, one of the predominant variant alleles, occurs primarily in Asians, encoding the CYP2C19 protein with no enzymatic activity[17, 18]. The results above show that the frequencies of different CYP3A4, CYP3A5, CYP2D6, and CYP2C19 genotypes varied significantly from each other and occur at varying frequencies in different ethnic populations. This indicates that the genetic polymorphisms of these CYPs may be the key factor responsible for the inter-individual variability observed in the metabolism of sorafenib.
The 105 aflatoxin-induced HCC rat models were established successfully from a total of 120 rats, which were divided into four groups based on genetic polymorphic forms of CYP3A4*1, CYP3A5*3, CYP2C19*2, and CYP2D6*10. They were treated with sorafenib. After the intervention, plasma concentration of sorafenib and changes in hepatic and renal function were monitored regularly. We found that rats expressing CYP3A5*3 had the highest plasma concentration of sorafenib and the most significant changes in hepatic and renal function. This was confirmed by the high levels of ALT, AST, BUN, and Cr in peripheral blood, compared to other rat groups. Alternatively, in the CYP3A4*1 group, none of the parameters showed obvious fluctuations. Furthermore, the levels of plasma concentration of sorafenib and changes to hepatic and renal function in the CYP2C19*2 and CYP2D6*10 groups were between the previously mentioned two groups. To clarify the clinical significance of our findings, we recruited 50 advanced HCC patients into our study and corroborated our findings in animal models. Furthermore, we found that CYP genotypes might have significant effects on the survival of sorafenib-treated patients.
Previous studies have reported that certain polymorphic forms of CYPs with decreased enzymatic functions, which mediate the biotransformation of other prescribed drugs, can lead to several severe and adverse drug effects. This may necessitate dose reduction or therapy termination. This suggests that patients with the polymorphic form of CYP3A5*3, which has compromised enzymatic activity, might suffer markedly more sorafenib toxicity than other patients[36, 37]. Therefore, we assumed that inter-individual variability in sorafenib efficacy and side effects might be explained by CYP polymorphism. Furthermore, damage to hepatic and renal function in sorafenib-treated patients is partly induced by accumulated toxicity of sorafenib. We propose that the clinical usage of sorafenib should be based on the genotype identification of CYPs in patients with advanced HCC. This would reduce the rate of adverse events and make the application range of sorafenib more accurate and effective. However, the underlying mechanism through which CYP polymorphism influences inter-individual variability in adverse events and sorafenib toxicity remains unknown, and should be the subject of future studies.
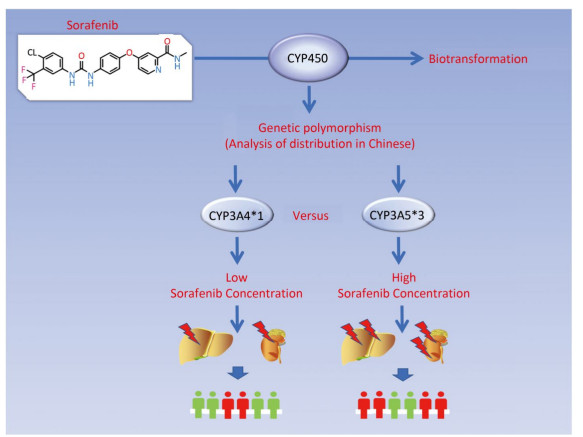
In summary, our study showed that the frequencies of CYP3A5, CYP3A4, CYP2C19, and CYP2D6 genotypes varied among different ethnics and populations. The CYP3A5*3 genotype exhibited the lowest enzymatic ability in sorafenib metabolism and led to severe hepatic and renal damage. Furthermore, inter-individual variability in the adverse events from sorafenib toxicity may be interpreted by genetic polymorphisms of CYPs (Figure 6). This suggests that monitoring of CYPs polymorphisms in certain populations could be used as a potential guide for sorafenib therapy.
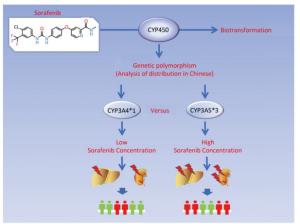
Figure 6. The model showing CYP polymorphism is related with sorafenib-induced side effect and patient survival.
-
The authors declare no competing interests in this work.
The Innovation Program of Shanghai Municipal Education Commission 2013ZZ060
International Science and Technology Cooperation Program of the Ministry of Science and Technology 2011DFA32980
a grant from the National Key Basic Research Program of China 973 Program 2012CB526706
National Natural Science Foundation of China 81271694
One Hundred Person Project of the Shanghai Health XBR2013117

 Quick Links
 DownLoad: