


HTML
-
Over the past 30 to 40 years, child and adolescent obesity has become a pressing public health problem in developed and developing countries, including China[1-5]. The increasing prevalence of obesity leads to greater burdens of disease (most notably cardiovascular diseases, diabetes, and cancer) on the economy, which could be predictable, preventable, controllable, and reversible[6-7].
Obesity is partly determined by genetic susceptibility, but obesogenic environments are necessary for its phenotypic expression[8]. In industrialized societies, the imbalance between rapid modernizing of food industries, marketing media, transportation, and health literacy[9-10] promotes high energy density intake and sedentary behaviors. Swinburn et al. have suggested a 2 × 4 grid for analysis, dividing environments into 2 levels (micro and macro) with 4 dimensionalities [physical (availability), economic, political (policy and regulation), and sociocultural (attitudes and beliefs)]. Within this framework, the environmental factors that influence food intake and physical activities are characterized as either obesogenic (promoting obesity) or leptogenic (promoting leanness)[11]. Research on obesogenic environments is important for planning comprehensive interventions that effectively target the specific influencing factors in macro- and microenvironments to slow or curb the prevalence of obesity in China[8]. We must develop systematic and integrated approaches to facilitate complementary and coordinated action among various concerned parties, such as governments, international organizations, civil society, and corporations[9].
Obesity is closely related to the geographical environment, the natural environment[12], economic activity, food production, transportation, social culture, policy, and regulations. Often, these factors are internally consistent within each Chinese province. Fighting obesity requires detailed global-, national-, provincial-, and community-level understanding of the problem's severity, magnitude, distribution, and underlying determinants. Few systematic studies have focused on the relationships between macroenvironmental factors and the prevalence of obesity in Chinese children and adolescents. This study collected obesity data for children and adolescents aged 7-17 from the 2011 Chinese Health and Nutrition Survey (CHNS) and provincial-level data from the China Statistical Yearbook 2011[13], the China Health Statistics Yearbook 2011[14], the China Education Yearbook 2011[15], the China Food Industry Yearbook 2011-2013[16], the Sixth National Population Census of the People's Republic of China, and the China Electric Power Yearbook 2011. We scanned the environmental factors of obesity, constructed analytic and predictive models of obesity prevalence, prioritized environmental factors for research and intervention, and constructed a thematic map of obesity among those aged 7-17 in 31 Chinese provinces in China (excluding the data of Hong Kong, Macao, and Taiwan) using a geographic information system (ArcGIS Desktop 10.3, Environmental System Research Institute, ESRI).
-
We used household data from the 12 provinces included in the 2011 CHNS: Beijing, Liaoning, Heilongjiang, Shanghai, Jiangsu, Shandong, Henan, Hubei, Hunan, Guangxi, Chongqing, and Guizhou. In each province, the CHNS used multistage, stratified, random cluster sampling to ensure a suitable representation of the population[17-18]. Using questionnaires, dietary surveys, and physical measurements, the survey collected data on health, nutrition, and socioeconomic variables at the community, household, and individual levels. The study protocols, instruments, and process of obtaining informed consent were approved by the Institutional Review Boards of the University of North Carolina at Chapel Hill and the National Institute for Nutrition and Health at the Chinese Center for Disease Control and Prevention. All subjects gave their written informed consent. Details were provided in the published profile of this cohort study[17-18]. We used data on children and adolescents aged 7-17 years with complete records of height and weight to assess the prevalence of obesity among that age group. We excluded from the analysis those with missing height or weight data. The final sample included 1, 416 participants. The CHNS measured height without shoes to the nearest 0.1 centimeter using portable Seca 206 wall-mounted metal tapes, and measured weight without shoes and in light clothing to the nearest 0.1 kilogram on calibrated Seca 880 beam scales (Digital Scales, Seca Ltd., Birmingham, UK). Body mass index (BMI) was the key outcome variable. We defined obesity according to the Body Mass Index Reference Norm for Screening Overweight and Obesity in Chinese Children and Adolescents (aged 7-18) developed in 2004 by the Working Group on Obesity in China, organized by the International Life Science Institute Focal Point in China. Relative to sex and age, this norm defines obesity as BMI > 95th percentile. This new BMI classification has been applied extensively in China[19].
By interviewing experts and reviewing the relevant literature, we determined the dimensionalities of obesogenic environmental factors and obtained relevant provincial data from the China Statistical Yearbook 2011[13], the China Health Statistics Yearbook 2011[14], the China Education Yearbook 2011[15], the China Food Industry Yearbook 2011-2013[16], the Sixth National Population Census of the People's Republic of China, and the China Electric Power Yearbook 2011. From 45 variables of 13 dimensionalities, we selected 12 variables of 11 dimensionalities to fit an analytic model of obesity prevalence in the 12 CHNS provinces with partial least squares regression (PLSR) and to fit a predictive model with Bayesian analysis to determine obesity prevalence in the provinces not surveyed. Finally, we constructed a thematic map of China's obesity prevalence among those aged 7-17 using a GIS.
-
Multiple linear regression is suitable to explore various influencing factors, to determine their relative importance, and to make predictions with regression models. However, the results of multiple linear regression are not reliable when the data are nonlinear, non-normal, multiple colinear, or from a small sample. Statisticians have developed methods such as principal component analysis and PLSR to solve these problems. In practice, the latter, originally proposed by econometrician Herman Wold in the 1960s, is more flexible and extensive. In recent years, PLSR has been applied successfully in many fields, notably medicine[20-23]. PLSR integrates linear regression, principal component analysis, and canonical correlation analysis to handle multiple colinear and small sample data, and is even applicable when the sample size is smaller than the number of independent variables with a stable regression[24-26]. PLSR can use variable importance in projection (VIP) for convenient variable screening.
In this study, we used the 12 surveyed provinces as a training sample to fit the analytical model Y = β0 + β1X1 + β2X2 +...+ βkXk + ε with PLSR, in which the dependent variable Y was provincial obesity prevalence and the independent variables X1, X2, …, Xk were provincial-level combinations of or single selected environmental factors supported by expert opinions or literature, or with statistical significance (P < 0.1) in simple linear regressions[2, 7, 9-11]. We obtained a prioritization of environmental obesity factors with VIP. However, although the PLSR model can explain the surveyed samples well, it cannot accurately predict unobserved samples because of overfitting. Additionally, a PLSR model cannot give 95% confidence intervals (CI) of parameter estimates. Therefore, we used Bayesian analysis, which suitable for stable regressions with small sample sizes, in SAS to optimize a predictive model with 95% CI for the estimated parameters and the deviance information criterion (DIC) model assessment tool to make prediction and inference. The predictive model was based on exploration of the relationship between obesogenic environmental factors and obesity rate. And the Bayesian posterior distribution model is on rapid convergence of the Markov chain Monte Carlo (MCMC) simulation, which allowed for stable predictions regarding the provinces not surveyed. From the Sixth National Population Census of the People's Republic of China, we took the proportions of children and adolescents in each of the 31 provinces as weights accounting for the total corresponding population, and we calculated the total inferred average prevalence of obesity among those aged 7-17 in the 31 provinces. Finally, we constructed a thematic map of obesity among that age group in the 31 provinces using a GIS. We primarily used SAS 9.4 (SAS Institute Inc., Cary, NC, USA) and ArcGIS Desktop 10.3 (Environmental System Research Institute, ESRI) throughout the process.
Study Design, Samples, and Key Variables
Statistical Analysis
-
The environmental factors scanned in this study, among total of 13 dimensionalities and 45 provincial variables, are listed in Table 1.
Dimensionality Level Macro Environmental Factor Micro Environmental Factor Economic status Provincial GDP Per capita income Per capita GDP Demographical data Provincial sex ratio Urban population density Dependent children ratio Urban-rural ratio Parents' educational level Illiteracy and semi-literacy rate School policies Physical education policy Health education policy Nutrition education policy Food industry development Annual production of dairy products Annual output of soft drinks Transportation capability Provincial cargo logistics transfer Passenger transport volume Media and marketing TV coverage Per capita consumption of food in province Grains, meat, vegetables, oils, sugar Grains, meat, poultry, vegetables, oils, sugar Dietary behaviors Dining out Healthcare services Average number of doctors Sanitary conditions of living environments Popularity of tap water Modified water source utilization ratio Flush toilet utilization ratio Sports facilities Per capita public green space area Sports equipment per 100 households Per capita paved road area Sedentary behaviors Public transportation (bus, taxi) Private cars, washing machines, tractors Screen viewing (mobile phone, TV, computer) Electricity owned per 100 households Table 1. Environmental Factors Scanned in the Study
-
We checked correlation among independent variables and formed combinations of variables with relatively small internal dependencies by dimensions. We used combinations of or single independent variables supported by expert opinions or relevant literature by dimensionalities, and the dependent variable (obesity prevalence in the 7-17 age group in the 12 CHNS provinces) as a training sample to test for linearity, independence, normality, and equal variance, and to perform a single factor linear regression. We obtained 12 independent variables that were eligible for simple linear regressions with statistical significance (P < 0.1) or that were supported by expert interviews or relevant literatures[2, 7, 9-11]. Table 2 shows the dependent variable and the 12 selected independent variables of 11 dimensionalities.
Variable Label No. Provinces Min Median Max M SD Provincial GDP (100 million yuan)1 gdp11* 31 507.46 10368.60 46013.06 14098.13 11401.35 Dependent children (%)2 chilrati11* 31 10.41 22.70 38.10 22.75 7.06 Modified water source use (%)3 mdwaterr11** 30 78.50 97.15 100.00 94.50 6.13 Healthcare (no. doctors/1, 000 persons)4 hlthcare11 31 1.04 1.73 5.24 1.99 0.82 Illiteracy rate of mothers (%)5 m_illi11 31 2.75 7.09 38.13 8.71 6.67 School policy score (points)6 schplcy11 31 0.00 3.00 9.00 2.61 2.43 Food industry level (10 thousand tons)7 foodindu11*** 31 0.46 31.00 345.36 69.61 85.09 Transportation capability (100 million FTK)8 ft_kilo11 31 38.50 2840.00 18918.20 4210.03 4143.69 Media (TV coverage %)9 media11* 31 91.40 97.70 100.00 97.29 2.13 Obesity prevalence (%)10 pctn11_4 12 0.00 11.25 24.66 10.65 6.57 Edible oils per capita (g)11 oilrpd11*** 31 8.03 18.11 29.42 17.98 6.25 Vegetables per capita (g)12 vegerpd11 31 48.11 221.64 411.86 240.63 86.45 Washing machines (no. units/100 households)13 washmr11* 31 8.47 65.75 101.47 62.42 25.74 Note. 1Gross domestic product by province in units of 100 million yuan; 2Ratio of people aged 0-14 to people aged 15-64 by province; 3Percentage of improved water source use by province; 4Average number of doctors per thousand people by province; 5Percentage of illiterate and semi-literate mothers among all those aged 15 and over; 6Comprehensive point score for school policies on physical education, health education, and nutrition education; 7Dairy products were used to represent the developmental level of the food industry by province; 8Cargo transportation by province in units of 100 million freight ton-kilometers; 9TV coverage was used to represent the developmental level of the marketing industry by province; 10Prevalence of obesity in children/adolescents aged 7-17 in 2011 by province; 11Average daily oil consumption in grams per person by province; 12Average daily consumption of vegetables in grams per person by province; 13Number of washing machines owned per 100 households by province. The total average obesity prevalence of the 1, 416 participants in the 12 surveyed provinces was 9.11%. In simple linear regression: *P < 0.1, **P < 0.05, ***P < 0.01. Table 2. Distribution of Observed Obesity Prevalence in 12 Provinces and Environmental Variables in 31 Provinces
-
We fitted an analytical model with PLSR according to Y = β0 + β1X1 + β2X2 +...+ βkXk + ε, in which the dependent variable Y was provincial obesity prevalence and the independent variables X1, X2, …, Xk were provincial combinations of or single independent variables that had statistical significance (P < 0.1) or that were supported by expert opinions or relevant literatures. We developed parameter estimates and a hierarchy of environmental obesity factors as in Table 3.
Parameter Original Estimate Standardized Estimate VIP Intercept -36.67779825 0.0000000000 gdp11 0.00006046 0.1058703859 1.03560 oilrpd11 0.16333126 0.1569353660 1.53510 vegerpd11 -0.00603443 -0.0692222505 0.67712 chilrati11 -0.07960009 -0.1043472277 1.02070 foodindu11 0.01212167 0.1412824089 1.38199 ft_kilo11 0.00010370 0.0853258715 0.83464 media11 0.31446806 0.0987461071 0.96591 washmr11 0.02556610 0.1012743674 0.99064 m_illi11 -0.12781732 -0.0845105340 0.82666 schplcy11 -0.09646236 -0.0415767208 0.40669 mdwaterr11 0.13622520 0.1158640006 1.13335 hlthcare11 0.36085791 0.0659804330 0.64540 Note. VIP: Variable importance in projection. Table 3. Parameter Estimates of the Obesity Prevalence Analytical Model with PLSR Based on 2011 Data
We found 2 kinds of environmental factors, obesity-promoting and obesity-impeding. By descending order of VIP, the obesity-promoting factors were edible oils per capita (average daily consumption in grams per person by province), food industry level (production of dairy products in units of 10, 000 tons by province, representing the development level of the food industry), modified water source ratio (percentage of households with improved water sources by province), provincial gross domestic product (GDP), washing machines (number of units owned per 100 households by province), media (TV coverage by province, representing the development level of the marketing industry), transportation capability (cargo transportation in 100 million freight ton-kilometers by province), and health care service (number of doctors per 1, 000 people by province). By descending order of VIP, the obesity-impeding factors were dependent child ratio (ratio children aged 0-14 to people aged 15-64 by province), illiteracy rate of mothers (number of illiterate and semi-literate mothers relative to total number of women aged 15 and older by province), vegetables per capita (average daily consumption in grams per person by province), school policy score (comprehensive point score of physical, health, and nutrition education).
-
From the predictive model we obtained a posterior distribution model through Bayesian analysis using the GENMOD Procedure in SAS 9.4. We fitted the predictive model with a DIC of 61.96 and with statistically significant parameter estimates (P < 0.05); we have 95% confidence that the intervals contain the overall parameters. Results of the parameter estimates are shown in Table 4. The predictive model yielded a spatial inference of the distribution of provincial obesity prevalence in which three provinces had predicted values above 15%, 10 provinces had values of 10%-15%, nine provinces had values of 5%-10%, and nine provinces had values below 5%.
Parameter Estimate SD Wald 95% CI Intercept 646.1034 161.7405 329.0979 to 963.1089 logoilrpd11 16.7047 1.8363 13.1057 to 20.3037 loggdp11 4.9868 0.9893 3.0477 to 6.9259 logmedia11 -162.2840 37.0773 -234.9540 to -89.6134 logwashmr11 2.9964 1.0572 0.9243 to 5.0684 Table 4. Parameter Estimates of the Obesity Prevalence Predictive Model with Bayesian Analysis Based on 2011 Data
-
Using the corresponding proportions of children and adolescents in each of the 31 provinces as weights accounting for the total population of the 31 provinces of China (based on data from the Sixth National Population Census of the People's Republic of China), we calculated that the total inferred average obesity prevalence among people aged 7-17 in the 31 provinces was 9.69%, higher than the average prevalence of 9.11% found in the 12 CHNS provinces surveyed in 2011.
-
We created an inferred child and adolescent obesity prevalence map of the 31 Chinese provinces using a GIS and found that obesity was clustered in northern and eastern provinces of China (Figure 1).
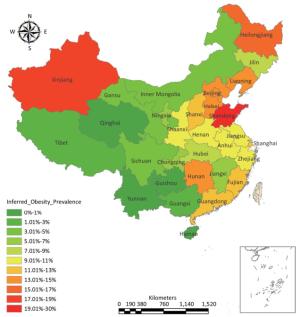
Figure 1. Inferred map of obesity prevalence among ages 7-17 in 31 Provinces based on CHNS 2011 data (%).
Dimensionality and Provincial Data
Selected Independent and Dependent Variables
Analytical Model
Optimization of the Predictive Model and Spatial Inference of Obesity Prevalence
Total Inferred Average Obesity Prevalence in 31 Chinese Provinces
Thematic Map
-
This study identified two kinds of environmental factors: obesity-promoting and obesity-impeding. In descending order of VIP, the obesity-promoting factors were edible oils per capita, food industry level, modified water source ratio, provincial GDP, washing machines, media (TV coverage), transportation capability, and health care service; the obesity-impeding factors were dependent children ratio, illiteracy rate of mothers, vegetables per capita, and school policy score. We additionally found that obesity was clustered in the northern and eastern provinces of China in the inferred prevalence map. Three provinces had predicted values above 15%, 10 provinces values of 10%-15%, nine provinces values of 5%-10%, and 9 provinces values below 5%. The total inferred average obesity prevalence among those aged 7-17 in the 31 analyzed Chinese provinces in 2011 was 9.69%.
From the China Statistical Yearbook 2011 we collected data on food consumption, including consumption of grains, meat, poultry, vegetables, oils, and sugar, as well as dining out behaviors. In single factor regressions we found that the consumption of edible oil is a sensitive and statistically significant (P < 0.01) indicator of provincial obesity prevalence. Studies by Su et al., based on 1997-2009 Chinese data on the 7-17 age group, found that percentage of energy intake from fat was positively related to overweight and obesity (odds ratio = 1.01; 95% CI 1.00, 1.02; P = 0.006)[27], and that by 2009 57.0% of children and adolescents aged 7-17 consumed over 30.0% of their energy from fat, the upper limit recommended by the Chinese Dietary Reference Intakes[28]. Popkin's studies have found that when incomes increase, households from lower income strata tend to add more oils and sugar to diets already high in energy density[29]. Therefore, regulating the intake of edible oils is a top priority for controlling obesity. Intake of vegetables, with their low energy density and abundance of micronutrients, can help curb the rate of increase in obesity prevalence[30-31].
We used annual production of dairy products and soft drinks as variables representative of the development level of the modern food industry in each province. We found that provincial annual dairy production was more representative, with statistical significance (P < 0.01). The modern food industry provides abundant inexpensive food, increases the accessibility of food, and plays a role in reducing protein energy malnutrition. But in sustained economic growth, with increase of purchasing power and decrease of physical activity, the excessive oil, salt, and sugar content of processed foods contributes to obesity in children and adults[11, 32].
In investigating environmental hygiene indicators such as modified water sources, tap water, and flush toilets, we found that the modified water source ratio was a sensitive indicator (P < 0.05). Since the 1950s, China has continuously improved the quality of available water sources; this has effectively controlled the prevalence of diarrhea, leading to improvement in the country's nutritional status and increase in BMI[33].
We examined a group of economic indicators, including provincial GDP, GDP per capita, and individual incomes, and found that provincial GDP is a sensitive indicator of provincial obesity prevalence (P < 0.1). This is in line with results of other research[18, 34-35]. Kinge et al. examining data on obesity in 412, 921 individuals from 70 countries from 2002 to 2013, used GDP per capita as a measure of economic development. Obesity was positively associated with national GDP[34]. As countries experience economic development, they see a significant increase in the prevalence of overweight and obesity in children and adolescents[35].
Demographic indicators considered included sex ratio, dependent children ratio, urbanization rate, and urban population density. We found that provincial dependent children ratio is a sensitive indicator of obesity level (P < 0.1). Most countries that experience economic development and urbanization also experience a continuous decline in dependent children ratio. This reflects national allocation of resources, fertility rate, work participation rate, and change in the amount of housework undertaken[36-37]. We propose that maintaining a moderately higher fertility rate may lower the rate of increase in obesity prevalence; further research is needed to explore this possibility.
Media marketing (represented in the present study by TV coverage) combined with transportation capacity and food industry development forms a powerful engine driving the consumption of processed foods and snacks[11, 32, 38]. Evidence from systematic reviews on the effects of food marketing to children shows that advertising is extensive and widespread worldwide. Most of this advertising and marketing is focused on fast food, processed food, snacks, and beverages with high fat, sugar, or salt content, which is linked to increase in obesity. Evidence also indicates that TV marketing influences children's food preferences, requests, and purchase behaviors. To promote responsible marketing to children to reduce the impact of foods high in saturated fats, free sugars, and salt, the WHO has published a Set of Recommendations on the Marketing of Foods and Non-alcoholic Beverages to Children (2010) and a framework for implementing these recommendations (2012).
A washing machine is a representative appliance that reduces daily household labor[39]. Health care service not only improves residents' nutrition, but can also help prevent obesity[40]. Educational institutions should guide doctors in shifting attention from treating chronic diseases caused by obesity to preventing obesity. Illiteracy among mothers may affect the availability of food in households and the mothers' practices in feeding their children[41]. Specific mechanisms require more research at the micro level.
The school policy score, which rates school approaches to nutrition, health, and physical education, is very important. Our study found a moderately antagonistic effect of school policy score on child obesity. In a reverse hypothesis, socioeconomic status and obesity are positively associated in countries with low development and negatively associated in countries with high development. The key is promotion of education and awareness. The study by Kinge and colleagues tested this relationship using data on 412, 921 people in 70 countries[34, 42].
The inferred overall average obesity rate of children and adolescents aged 7-17 in the 31 provinces in this study was found to be 9.69%, higher than the average of 6.4% reported for children and adolescents aged 6-17 in 2012 in the Report on Chinese Residents' Chronic Diseases and Nutrition 2015[4]. Wang Shuo et al. analyzed 2014 data on obesity among children and adolescents aged 7-18 from the Chinese National Survey on Students Constitution and Health and found regional differences in the prevalence of overweight and obesity, as well as obvious clustering in the occurrences of obesity in the northern and eastern provinces of China[5]. This distribution trend was consistent with the findings of our study.
During the past 30 to 40 years, continued social and economic development, availability of cheaper foods, modernization of the food industry, powerful cargo transport capacity, and strong media promotion have increased the accessibility of food, but nutrition and health have not received corresponding attention. Rapid industrialization has freed many people from the burden of heavy manual labor, and much of their increased spare time may be spent engaging in sedentary activities involving electronic devices[31, 43-45]. In obesogenic environments, this results in an imbalance between energy intake and expenditure[44]. We should continue to study how such imbalances form and how they can be reversed[46]. As a complement to nutrition, health, and physical education, systems-based environmental interventions can have a cost-effective and lasting influence on eating decisions and creation of supportive food environments[11]. Addressing the increasing prevalence of obesity requires concerted multidisciplinary and multisector measures. For example, education can promote increased consumption of vegetables and cooking methods that reduce oil consumption; national policies and regulations can guide food companies to produce healthier, less energy-dense foods[30]; and local governments can adjust construction standards to make cities more walkable[47].
The environmental factors that encourage obesity are complex and differ with time and place. Intervention is particularly needed in the northern and eastern regions of China. Multidisciplinary and multisector policies should focus on increasing consumption of vegetables, reducing consumption of oils, regulating food companies to reduce their products' energy density, and strengthening nutrition, health, and physical education to reduce and prevent obesity in children and adolescents. Further research is needed on the clustering of obesity in children and adolescents, the impact of socioeconomic factors, and the effect of mothers' education level on obesity. Combating obesity will require a series of nationally, regionally, provincially, and locally detailed studies of the issue's severity, magnitude, distribution, and underlying determinants. We call for regular monitoring of obesity in Chinese children and adolescents to ensure timely and appropriate influence on policy[9].
Studies from a macroenvironmental perspective are critical. Although our data were limited, we adopted PLSR and Bayesian analysis, which are suitable for modeling with small sample sizes, and thus fitted a stable predictive model. We examined obesogenic environmental factors and the prevalence and spatial distribution of child and adolescent obesity in China. This study helps to compensate for a lack of research in this field, and provides a foundation for policy making. However, the effects of dependent children ratio and parents' education on child and adolescent obesity requires further research based on detailed data. We will verify our conclusions using a larger sample size in future studies.
-
Given the complexity of child and adolescent obesity, concerted efforts are needed to reduce consumption of edible oils, to increase consumption of vegetables, and to strengthen nutrition, health, and physical education in Chinese schools. The northern and eastern regions are key areas requiring intervention. We suggest that obesity in Chinese children and adolescents should be regularly monitored, and that multidisciplinary and multisector policies should be adopted to control and prevent obesity in children and adolescents more promptly and appropriately.
-
This study used data from the CHNS. We thank the National Institute for Nutrition and Health, Chinese Center for Disease Control and Prevention; the Carolina Population Center, University of North Carolina at Chapel Hill; and the US National Institutes of Health (R01-HD30880, DK056350, R24-HD050924, and R01-HD38700) for financial support for the CHNS data collection and management.
-
GUO Chun Lei and ZHANG Bing contributed to the initial analytical design. WANG Hui Jun, FENG Guo Shuang, and LI Jun Ming directed the analysis. All authors contributed to the explanation of the analytical results. GUO Chun Lei wrote the first draft of the manuscript. ZHANG Bing, WANG Hui Jun, SU Chang, and ZHANG Ji Guo revised the manuscript.
-
The authors declare no conflicts of interest.

 Quick Links
 DownLoad: