


-
In 2016, there were 17.8 million (15.4-20.3 million) women living with HIV/AIDS across the world and the prevalence of reproductive desire among this group was 26%-49%[1]. If pregnant women living with HIV/AIDS are left untreated, the rates of HIV transmission from mother-to-child would range from 14% to 48%, depending on the presence and duration of breastfeeding[2].
The World Health Organization (WHO) has recommended two prevention of mother-to-child transmission (PMTCT) prophylaxis regimens in 2010, Options A and B. A third option (Option B+) was recommended by the WHO in 2012, in which all pregnant women living with HIV are offered lifelong triple antiretroviral therapy (ART), regardless of their CD4 cell counts. In summary, every PMTCT prophylaxis includes HIV laboratory testing for all pregnant women and children, maternal ART, and pediatric ART. Option B+ was the most cost-effective strategy, costing between USD 6, 000 and USD 23, 000 per infection averted compared with Option A; it averted more child infections than Option B[3].
Under PMTCT, several countries have been formally validated in terms of the elimination of mother-to-child transmission (MTCT) of HIV. Meanwhile, abortion and induced abortion among HIV-infected pregnant women continue to exist, which represent wasted resources as pregnant women lose the chance to have the baby they intended.
A 2008 global estimate indicated that the abortion rate (the number of abortions per 1, 000 women of childbearing age) accounted for 28% of all pregnancies[4]. Due to fear of infant infection, HIV-related stigma, family size, economic constraints, and partner and provider influence, HIV-positive women consider avoiding or terminating their pregnancy[5]. For example, in Brazil, the prevalence of induced abortion among pregnancies in women living with HIV/AIDS was 6.5%, whereas in women not living with HIV/AIDS, it was 2.9%[6]. In Cape Town, South Africa, a qualitative exploration of HIV-positive pregnant women's decision-making regarding abortion found that 15 of 24 HIV-positive women had an abortion[7].
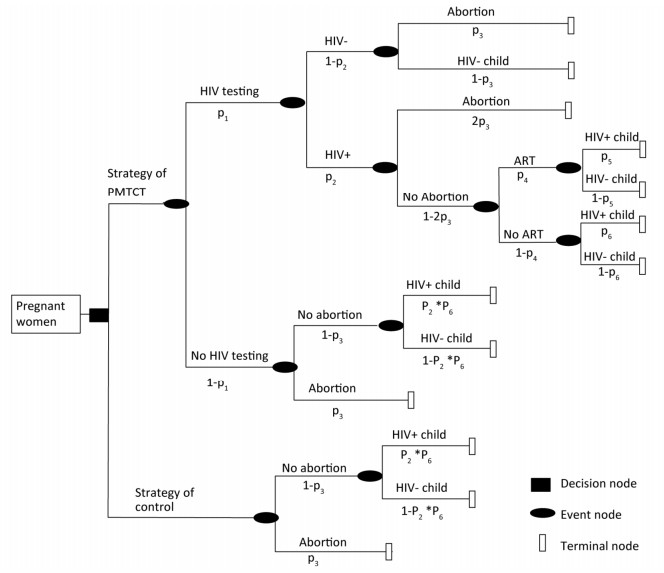
In this study, a decision tree model on benefits and loss was constructed to estimate the health and economic outcomes among pregnant women under PMTCT Option B+, in particular, the loss of abortion. (Figure 1)
Figure 1. Decision tree for the cost-effectiveness analysis of two strategies among all pregnant women.
In this study, a decision tree model was developed for the analysis of costs, benefits, and losses of PMTCT at the national level in South Africa, Kenya, and Vietnam, wherein the parameters of the decision tree model were cited journal articles and public data, as shown below. The cost in this study was defined as the cost covering laboratory tests and ART for all pregnant women and children under PMTCT and pediatric treatment (age 20 years)[3]. The numbers of pediatric infections averted and the disability-adjusted life year (DALY) averted were calculated, and 18.7 DALYs gained for each infection averted was referenced[8]. (Table 1)
Epidemiological Data South Africa Kenya Vietnam Reference National HIV prevalence among women aged 15-49 years 18.9% 7% 0.1% [17] Number of pregnant women living with HIV needing ARTs for preventing MTCT based on WHO methods 10, 000 (7, 900-12, 000) 74, 000 (59, 000-87, 000) 2, 800 (2, 400-3, 300) [18] MTCT rate with antiretroviral prophylaxis (%) 2.4% 6.7% 6.7% [14-16] MTCT rate without antiretroviral prophylaxis (%) 23.2% 24.0% 27.3% [14-16] PMTCT services ANC coverage 97% 92% 94% [17] HIV testing at ANC 81% 92% 94% [17] ART for HIV+ pregnant women 95% (87%-98%) 80% (65%-95%) 66% (55%-77%) [18] Costs for all mothers HIV test (per pregnancy) 3.50 3.50 3.50 Costs for mothers living with HIV CD4T cell test (per pregnancy) 20 20 20 Prophylaxis (TDF/3TC/EFV) per day (14 weeks of pregnancy up to 6 weeks postnatal) 0.27 0.27 0.27 [11] Costs for all children HIV test (per child) 3.50 3.50 3.50 Costs for children with unknown infection status Prophylaxis up to 6 weeks from birth (per child) 0.50 0.50 0.50 [19] Costs for HIV+ child Discounted (3%) lifetime cost of pediatric ART (per child) 4, 785 4, 785 4, 785 [12] Abortion ratio for HIV+ pregnant women (%) 19% 33% 31% [10, 20, 21] DALYs gained per infection averted 18.7 18.7 18.7 [8] GDP per capita (in USD) 5, 284.6 1, 350.0 2, 107.0 [9] HALE at birth (years) 55.7 58.9 67.5 [22] Table 1. Assumptions and Model Input
In this study, data from South Africa, Kenya, and Vietnam were used to illustrate high, intermediate, and low HIV prevalence, respectively, where national HIV prevalence among women aged 15-49 years was 18.9%, 7%, and 0.1%, respectively. HIV prevalence among pregnant women was assumed to be equal to the national HIV prevalence among women aged 15-49 years. GDP per capita (USD) in South Africa, Kenya, and Vietnam was USD 5, 284.6, USD 1, 350.0, and USD 2, 107.0 in 2016, respectively[9].
We assumed that twice as many pregnancies in women living with HIV/AIDS resulted in an abortion, compared with pregnancies in women not living with HIV/AIDS or unknown HIV state. Abortion ratio has conventionally been calculated by the number of abortions per 100 live births in Kenya and Vietnam and per 100 pregnancies in South Africa. In this study, the abortion ratio was quoted by the number per 100 pregnancies. As such, in Kenya and Vietnam, with abortion ratios of 30[10] and 31 per 100 live births, respectively, the abortion rates were calculated as 23.1% and 23.8%, respectively. In South Africa, 9.5% of pregnancies resulted in spontaneous abortion, and the abortion ratio among women living with HIV/AIDS was estimated at 19%. In Kenya and Vietnam, the abortion ratio among women living with HIV/AIDS was estimated at 46.2% and 47.6%, respectively.
We assumed a cohort of 100, 000 pregnant women in each country who were not aware of their HIV status. At their first antenatal care (ANC) visit in the first trimester, 66%-95% of pregnant women get HIV tested at a cost of USD 3.5 per test. If found to be HIV-positive, their CD4 cells are counted at a cost of USD 20 per test before ART. We assumed that the triple ARV prophylaxis of TDF/3TC/EFV single-pill fixed dose regimen was administered to pregnant women, starting from 14 weeks of gestation through 6 months of breastfeeding at a cost of approximately USD 0.27 per day, based on the 2016 antiretroviral reference price list of the Clinton Health Access Initiative[11].
We assumed that nevirapine was administered to the infant from birth through age 6 weeks, regardless of infant feeding patterns, at a total cost of USD 0.188 per day[11]. At age 18 weeks, the infant gets HIV tested at a cost of USD 3.50 per test. The lifetime cost of pediatric ART (per child) for HIV-positive children is referenced at USD 4, 875[12] based on the average costs of all regimens weighted by mortality for up to 20 years of life of the child, discounted at 3% annually.
The MTCT rate ranged from 23.2% in 2003 to 2.4% in 2012 in South Africa[13, 14]. In Kenya, this rate among mothers who received antiretroviral prophylaxis was 6.7% in YEAR and 24.0% among mothers who did not receive prophylaxis[15]. In a high HIV burden province in Vietnam, the MTCT rate reduced from 27.3% in 2008 to 6.7% in 2012[16].
In this study, the costs of HIV testing and ARTs of PMTCT were estimated, including the future costs of pediatric ART. The numbers of identified HIV-positive pregnant women, new pediatric HIV infections, pediatric infections averted, and abortions were calculated for different strategies. The value lost due to abortions was calculated, including the value gained for each infection averted.
The economic value created by pediatric infections averted was calculated by multiplying the estimated healthy life expectancy (HALE) by GDP per capita. Furthermore, health-related losses were estimated based on the number of abortions, whereas economic losses due to abortions were calculated by multiplying the estimated HALE loss due to abortions by GDP per capita.
In comparison with the control strategy, the incremental DALYs averted, the number of new pediatric infections averted, the incremental number of abortions, and the incremental economic and net benefits were calculated. We also calculated the incremental effectiveness and the incremental cost-effectiveness ratio (ICER) between the two strategies, defined as the additional cost per DALY averted.
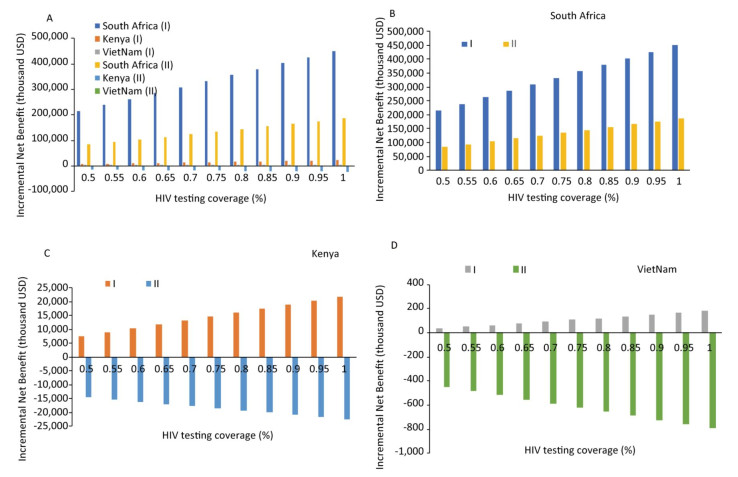
For further comparison between the PMTCT strategy and the control strategy, we conducted univariate sensitivity analyses to estimate the impact of the selected variable, i.e., the HIV testing coverage. The range for the selected variable was assumed from 50% to 100%. The primary outcome variables, including healthy life years gained (HLYG) and incremental net benefit (INB), were selected. HLYG was defined as HLYG attributed to the number of pediatric infections averted minus HLYG loss due to incremental number of abortions. INB was defined as economic gains attributed to pediatric infections averted minus economic loss due to incremental number of abortions and minus cost, that is,
HLYG = (Number of pediatric infections averted − Incremental number of abortions) × HALE
$$ \text{=}\sum{\frac{\left[ {{N}_{1}}-\left( {{N}_{2}}-{{N}_{3}} \right)\times \left( \text{Health}\ \text{life}\ \text{expectancy} \right) \right]}{{{\left( 1+r \right)}^{n}}}} $$ (1) INB = Economic gain attributed to pediatric infections averted − Economic loss of incremental number of abortions − Cost for PMTCT and pediatric treatment (20 years)
$$ \begin{align} &=\sum{\frac{{{N}_{1}}\times \left( \text{GDP}\ \text{per}\ \text{capital} \right)\times n}{{{\left( 1+r \right)}^{n}}}-} \\ &\sum{\frac{\left( {{N}_{2}}-{{N}_{3}} \right)\times \left( \text{GDP}\ \text{per}\ \text{capital} \right)\times n}{{{\left( 1+r \right)}^{n}}}-\text{Cost}} \\ \end{align} $$ (2) where N1 is the number of pediatric infections averted, N2 is the number of abortions under PMTCT, N3 is the number of abortions under strategic control, and n is HALE.
If economic losses due to abortion are not taken into account, the HLYG and economic losses of abortion are removed from outcomes.
In our model, under the strategy of PMTCT, the cost reached USD 6, 768, 170, USD 3, 308, 032, and USD 382, 405 in South Africa, Kenya, and Vietnam, respectively. Henceforth, the data presented are mentioned in the same order of the three countries reviewed. The ratio of the number of identified HIV+ women to that of unidentified HIV+ women was 4.3:1, 11.5:1, and 15.7:1, indicating that in countries with a higher HIV prevalence, there tends to be a more proportional number of unidentified HIV+ women. Although HIV testing coverage was 81%-94% and ARV coverage was 66%-95% in the three countries, the number of new pediatric infections was 10-1, 120. Compared with the control strategy, the ratio of the number of new pediatric infections was 28.47%, 39.27%, and 43.48%. The ratio of the number of abortions between the PMTCT strategy and the control strategy was 1.38:1, 1.15:1, and 1.06:1. The economic losses attributable to pediatric infections amounted to USD 401, 541-110, 726, 849 under PMTCT and USD 505, 909, 800-2, 056, 980, 346 under the control strategy. If economic losses due to abortion were taken into account, the net economic benefits would be negative for both PMTCT and control strategy, and for any country scenario. Otherwise, the net economic benefit was positive for PMTCT for any country scenario. The summarized results are presented in Table 2.
Items South Africa Kenya Vietnam PMTCT Control strategy PMTCT Control strategy PMTCT Control strategy Costs (in USD) PMTCT (HIV test, ARTs) 1, 373, 259 0 673, 375 0 333, 640 0 Pediatric treatment (20 years) 5, 394, 911 0 2, 634, 658 0 48, 765 0 Total cost 6, 768, 170 0 3, 308, 032 0 382, 405 0 Health outcomes Number of identified HIV+ women 15, 309 0 6, 440 0 94 0 Number of unidentified HIV+ women 3, 591 0 560 0 6 0 Number pediatric infections averted 2, 503 0 597 0 9 0 Number of new pediatric infections 1, 127 3, 934 551 1, 403 10 23 DALYs averted 46, 813 0 11, 167 0 163 0 Number of abortions 13, 101 9, 500 18, 975 16, 500 16, 446 15, 500 Economic outcomes (in USD) Economic loss owing to abortions 1, 923, 040, 773 1, 394, 467, 021 725, 747, 774 631, 085, 021 1, 025, 445, 792 966, 461, 517 Economic gain owing to pediatric infections averted 363, 407, 322 0 22, 834, 031 0 560, 518 0 Net benefit (economic loss owing to bortions excluded) 356, 639, 152 0 19, 525, 999 0 178, 113 0 Net benefit (economic loss owing to bortions included) -1, 566, 401, 621 -1, 394, 467, 021 -706, 221, 775 -631, 085, 021 -1, 025, 267, 679 -966, 461, 517 Table 2. Costs and Health and Economic Outcomes
Compared with the control strategy, the incremental DALYs averted were 46, 813, 11, 167, and 163, whereas ICERs ($/DALY) were USD 145, USD 296, and USD 2, 346. The number of new pediatric infections decreased and more abortions occurred under PMTCT, which resulted in incremental economic gains related to pediatric infections averted and incremental economic gains owing to fewer abortions. If economic losses due to abortions were taken into account, the INB would be negative; otherwise, the INB ranged from USD 1, 370, 306 to USD 55, 797, 232. (Table 3)
Items South Africa Kenya Vietnam Incremental DALYs averted 46, 813 11, 167 163 ICER ($/DALY) 145 296 2, 346 Number of new pediatric infections averted 2, 807 852 13 Incremental number of abortions 3, 601 2, 475 946 Incremental economic gain owing to pediatric infections averted 363, 407, 322 22, 834, 031 560, 518 Incremental economic gain owing to abortions -528, 573, 752 -94, 662, 753 -58, 984, 275 Incremental net benefit (economic loss owing to abortions excluded) 356, 639, 152 19, 525, 999 178, 113 Incremental net benefit (economic loss owing to abortions included) -171, 934, 600 -75, 136, 754 -58, 806, 162 Table 3. Incremental Effectiveness and ICER, Compared with Control Strategy
The results of sensitivity analysis showed that HLYG and INB increased as the HIV test coverage increased, if abortion is not taken into account; however, if abortion is taken into account, both HLYG and INB decreased. In South Africa, a high HIV prevalence country, both HLYG and INB showed positive values under PMTCT compared with the control strategy, regardless of whether abortion was taken into account or not; these value overturned from positive to negative in Kenya and Vietnam. As shown in Figure 2, INB differed across the three countries depending on HIV test coverage, with similar effects on HLYG as on economic outcomes.
Figure 2. Sensitivity analysis: Impact of incremental net economic benefit on HIV test coverage (%). Regardless of whether economic losses due to abortions were excluded (Ⅰ) or included (Ⅱ), the incremental net benefit was strongly influenced in the three countries.
To our knowledge, this study represents the first description of health and economic losses under PMTCT, in particular the losses attributed to abortions. Previous research has demonstrated that the measurement of the cost-effectiveness of PMTCT generally covered costs and health outcomes, such as the number of identified HIV+ women, MTCTs averted, quality-adjusted life years gained, and DALYs averted In our study, in addition to these items, the numbers of unidentified HIV+ women, new pediatric infections, and abortions were also calculated, including the economic losses due to abortions and new pediatric infections.
Our study showed that most pregnancies in women living with HIV had been detected in comparison with the control strategy, although there were higher proportions of pregnant women with HIV undetected where the prevalence of pregnant women with HIV was higher. In other words, in a country with a higher HIV prevalence, the coverage of HIV testing and antiretroviral prophylaxis should be enlarged, exceeding the 90-90-90 target for 2020 recommended by the WHO.
Second, under PMTCT, the ICER, compared with the control strategy, was 144 in South Africa, 296 in Kenya, and 2, 353 in Vietnam; these values varied depending on the HIV prevalence among pregnant women. A previous study in Malawi[23] reported that the comparative ICER between Option B+ and Option B ranged between USD 500 and USD 1, 300 per DALY averted.
Third, if economic losses due to abortion were taken into account, then the INB would drop sharply, especially in the country with a higher abortion rate. In Kenya and Vietnam, the incremental net economic benefit would overturn from positive to negative. HLYG and INB increased as the HIV test coverage increased, provided abortion is not taken into account; however, if taken, both HLYG and INB decreased. Abortion was found to have a strong impact on health outcomes, as the number of abortions was much more than that of pediatric infections averted. Even in the countries with a higher abortion ratio, namely, Kenya and Vietnam, the HLYG reversed into negative values with sensitivity analysis.
As we know that, due to fear of infant infection, HIV-related stigma, family size, and economic constraints, women living with HIV/AIDS prefer termination of their pregnancies, although they have reproductive desire and abortion is illegal in nations. Meanwhile, abortions harm women physically and psychologically, so much so that some women may lose the chance of being a mother. In addition, the transmission of HIV from an HIV-positive mother to her child can be reduced to below 2% with effective interventions. Therefore, we suggest that more knowledge about the interventions is offered to HIV-positive women to reduce their desire of abortion while in pregnancy.
This study has two limitations. First, the parameters of the decision tree model were cited journal articles and public data, not survey data, in which publication bias is unavoidable. Second, the costs of HIV tests and ART were calculated based on the reference price list of the Clinton Health Access Initiative, which is not the actual price of the nations. As we know that, in different nations, the price of HIV test and antiviral drugs varies significantly. Even in some nations, the price of HIV test and antiviral drugs would vary sharply in the future.
In conclusion, PMTCT detects the HIV status of pregnant women, averts pediatric infections, and creates good incremental economic net benefits, if abortion is not taken into account. However, the negative effects of abortion on health and economic outcomes far outweigh the benefits of pediatric infections averted. Thus, measures to reduce abortion are urgent and necessary for the elimination of MTCT of HIV.
QU SL and ZHANG T conceived the study and performed the analyses. WANG Q and DOU LX reviewed the literature to obtain model parameters. WANG AL and PANG XP provided critical review and assessment of model outcomes. All authors reviewed the literature, interpreted the data, and then wrote and revised the manuscript. The authors have no conflicts of interest to declare.
Estimating the Health and Economic Outcomes of the Prevention of Mother-to-child Transmission of HIV Using a Decision Tree Model
doi: 10.3967/bes2019.011
Funds:
National Science and Technology Major Project of the Ministry of Science and Technology of China 2015ZX10001001
- Received Date: 2018-08-15
- Accepted Date: 2018-12-04
| Citation: | QU Shui Ling, WANG Ai Ling, PAN Xiao Ping, WANG Qian, DOU Li Xia, ZHANG Tong. Estimating the Health and Economic Outcomes of the Prevention of Mother-to-child Transmission of HIV Using a Decision Tree Model[J]. Biomedical and Environmental Sciences, 2019, 32(1): 68-74. doi: 10.3967/bes2019.011

|

 Quick Links
 DownLoad: