

-
Cadmium (Cd) is considered a toxic element of which food is the major source of acquisition, which can lead to diseases such as renal dysfunction, cancer and osteoporosis[1]. Cd is classified as a group I carcinogen by the International Agency for Research on Cancer[2]. The results of dietary exposure to cadmium in Europe in 2012 showed that the contribution rate from the broad food categories of grain and grain products accounted for 26.9%, which was the food with the highest contribution rate to cadmium exposure[3]. Similarly, the contribution of cadmium from rice and noodles to the total cadmium intake of Chinese residents is higher than that of any other food[4]. A recent study of 484 rice samples from five contaminated areas in China found that more than 18% of rice contained Cd above the maximum levels of cadmium in China’s standard[5]. Rice is a staple food for more than half the world’s population, and this crop is more susceptible to Cd contamination than other crops. Cadmium pollution in rice poses a serious threat to food safety and human health.
The various forms of Cd in food could greatly affect its absorption, distribution and bioavailability of Cd in the human or animal organism, which may result in the different biological effects of Cd. Cd in rice binds to rice protein. Cd-binding protein in rice was isolated and expressed by Escherichia coli, and its molecular weight was found to be 26.34 kD[6]. The toxicity of Cd in rice may be overestimated if only the total amount of Cd in rice is used as the evaluation standard. In this study, rice-contaminated Cd was used as the research object to compare the utilization of Cd in rice with inorganic Cd2+ in rats. In vivo, the content of Cd in various tissues of the Cd rice and CdCl2 groups and the distribution of Cd in blood at different time points were determined, and the differences between the bioavailability of Cd in rice and CdCl2 were comprehensively compared.
Cadmium-contaminated rice (Natural contamination) was collected from Jiujiang city, Jiangxi province. Cadmium-contaminated rice and the animal tissue or plasma analysis for inductively coupled plasma mass spectrometry (ICP-MS, NexIon 350X; PerkinElmer, USA). Male SPF (Specific Pathogen Free, SPF) grade Sprague Dawley rats (Quality Certificate Number: 42000600026041) were purchased from Hubei Provincial Experimental Animal Research Center (Wuhan, China). This study was approved by the Animal Research Ethical Committee of Huazhong University of Science and Technology (Wuhan, China. IACUC Number: 654).
Fifty-four rats were randomly divided into three different groups for the blood metabolism experiment. Ninety rats were divided to exposure to low doses of cadmium for 28 d. The three groups were as follows: (1) negative control, (2) CdCl2 group (10 µg/kg bw by intragastric administration), and (3) Cd rice group (10 µg/kg bw by intragastric administration). Cd rice and ultra-pure water was added to the electric rice cooker at a ratio of 1:1.5 (g/mL), the steamed Cd rice was placed in a 40 ℃ oven at drying moisture, and the rice was shattered. An appropriate amount of Cd rice powder was mixed with ultra-pure water to make a mixture solution with a cadmium concentration of 0.5 µg/mL.
Eighteen rats in each group were randomly divided into three groups for alternate blood collection. One millilitre of orbital blood was collected from all of the rats at 0.5, 1, 2, 4, 8, 16, 32, and 48 h after intragastric administration, and collected in the anti-coagulation tubes, and stored at −20 ℃. Rats were euthanized by applying pressure to the neck and dislocating the cervical spine after anaesthetized at the last blood collection time point.
The body weights of all rats were measured every day to adjust the volume of oral administration. During the entire experimental period, there was no mortality in rats. Treatments were administered at 8:00 am every day. Rats (six from each group) from all the groups were sacrificed applying pressure to the neck and dislocating the cervical spine under anaesthesia after the last dose on the first, second, third, and fourth week from the initiation of the experiment. Blood and tissues were collected for the analysis. All samples were stored at −80 ℃ until analysis.
GraphPad Prism version 6.0 was used for the statistical analysis of data. Statistical analysis was carried out using IBM SPSS Statistics 19.0. Differences among groups were analysed by one-way analysis of variance (ANOVA), and significant differences are marked as ‘a, b, c’ for P < 0.05, ‘A, B, C’ for P < 0.01.
The proportion of ash, protein, starch and crude fat in the rice-contaminated Cd after cooking did not change notably compared with the proportions measured before treatment. The absorption and distribution of Cd in rice-contaminated Cd were evaluated using cooked Cd rice as the experimental raw material (Supplementary Table S1, available in www.besjournal.com).
Sample Moisture (g/100 g) Ash (g/100 g) Protein (g/100 g) Starch (g/100 g) Crude fat (g/100 g) Cd (mg/kg) Fodder 9.79 ± 0.04 5.28 ± 0.02 18.16 ± 0.31 64.24 ± 2.53 3.96 ± 0.16 0.0947 ± 0.0025 Rice 12.47 ± 0.02 0.31 ± 0.03 9.31 ± 0.04 74.65 ± 0.53 0.47 ± 0.02 2.3548 ± 0.0102 Cooked rice 7.46 ± 0.01 0.27 ± 0.01 9.52 ± 0.00 78.55 ± 3.69 0.42 ± 0.02 2.5370 ± 0.0125 Table S1. Composition of feed and experimental materials (n = 3, Mean ± SD)
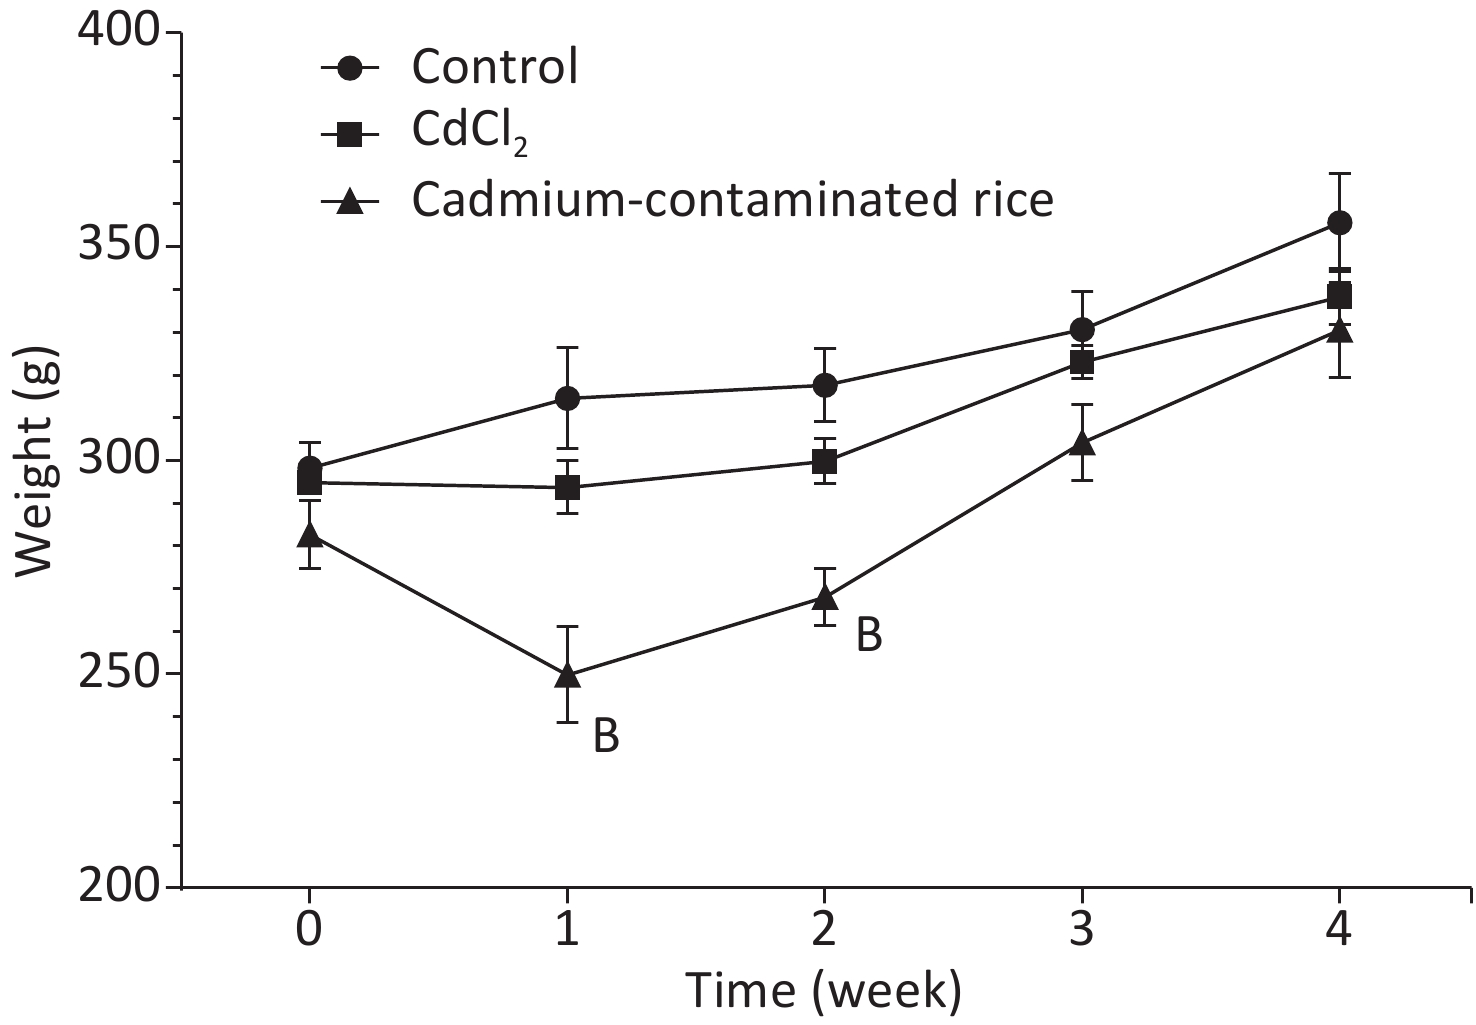
Weight changes can directly reflect the health of animals. The weight loss of rats in the Cd rice group was significantly lower than in the control group and in the CdCl2 group in the first week (P < 0.01). In contrast to the Cd rice group, the weight of rats in the CdCl2 group and the blank control group slowly increased. There was no significant difference (P > 0.05) in body weight between the three groups from week 3 to week 4 (Figure 1). During the experiment, there was no statistically significant difference (P > 0.05) in organ coefficients between the groups (Supplementary Table S2, available in www.besjournal.com).

Figure 1. Change in weekly body weight over a 28-d period for SD rats (n = 6, mean ± SD). B: significant difference from the control group (P < 0.01), whereas the absence of letters indicate no significant differences.
Control CdCl2 Cadmium-contaminated rice Heart 0.28 ± 0.02 0.29 ± 0.04 0.30 ± 0.02 Liver 3.68 ± 0.33 3.78 ± 0.39 3.54 ± 0.17 Spleen 0.24 ± 0.03 0.22 ± 0.04 0.24 ± 0.03 Lung 0.46 ± 0.07 0.50 ± 0.17 0.47 ± 005 Kidney 0.80 ± 0.05 0.76 ± 0.07 0.79 ± 0.10 Table S2. Relative weight of each organ in experimental rats (g/100 g BW, n = 6, Mean ± SD)
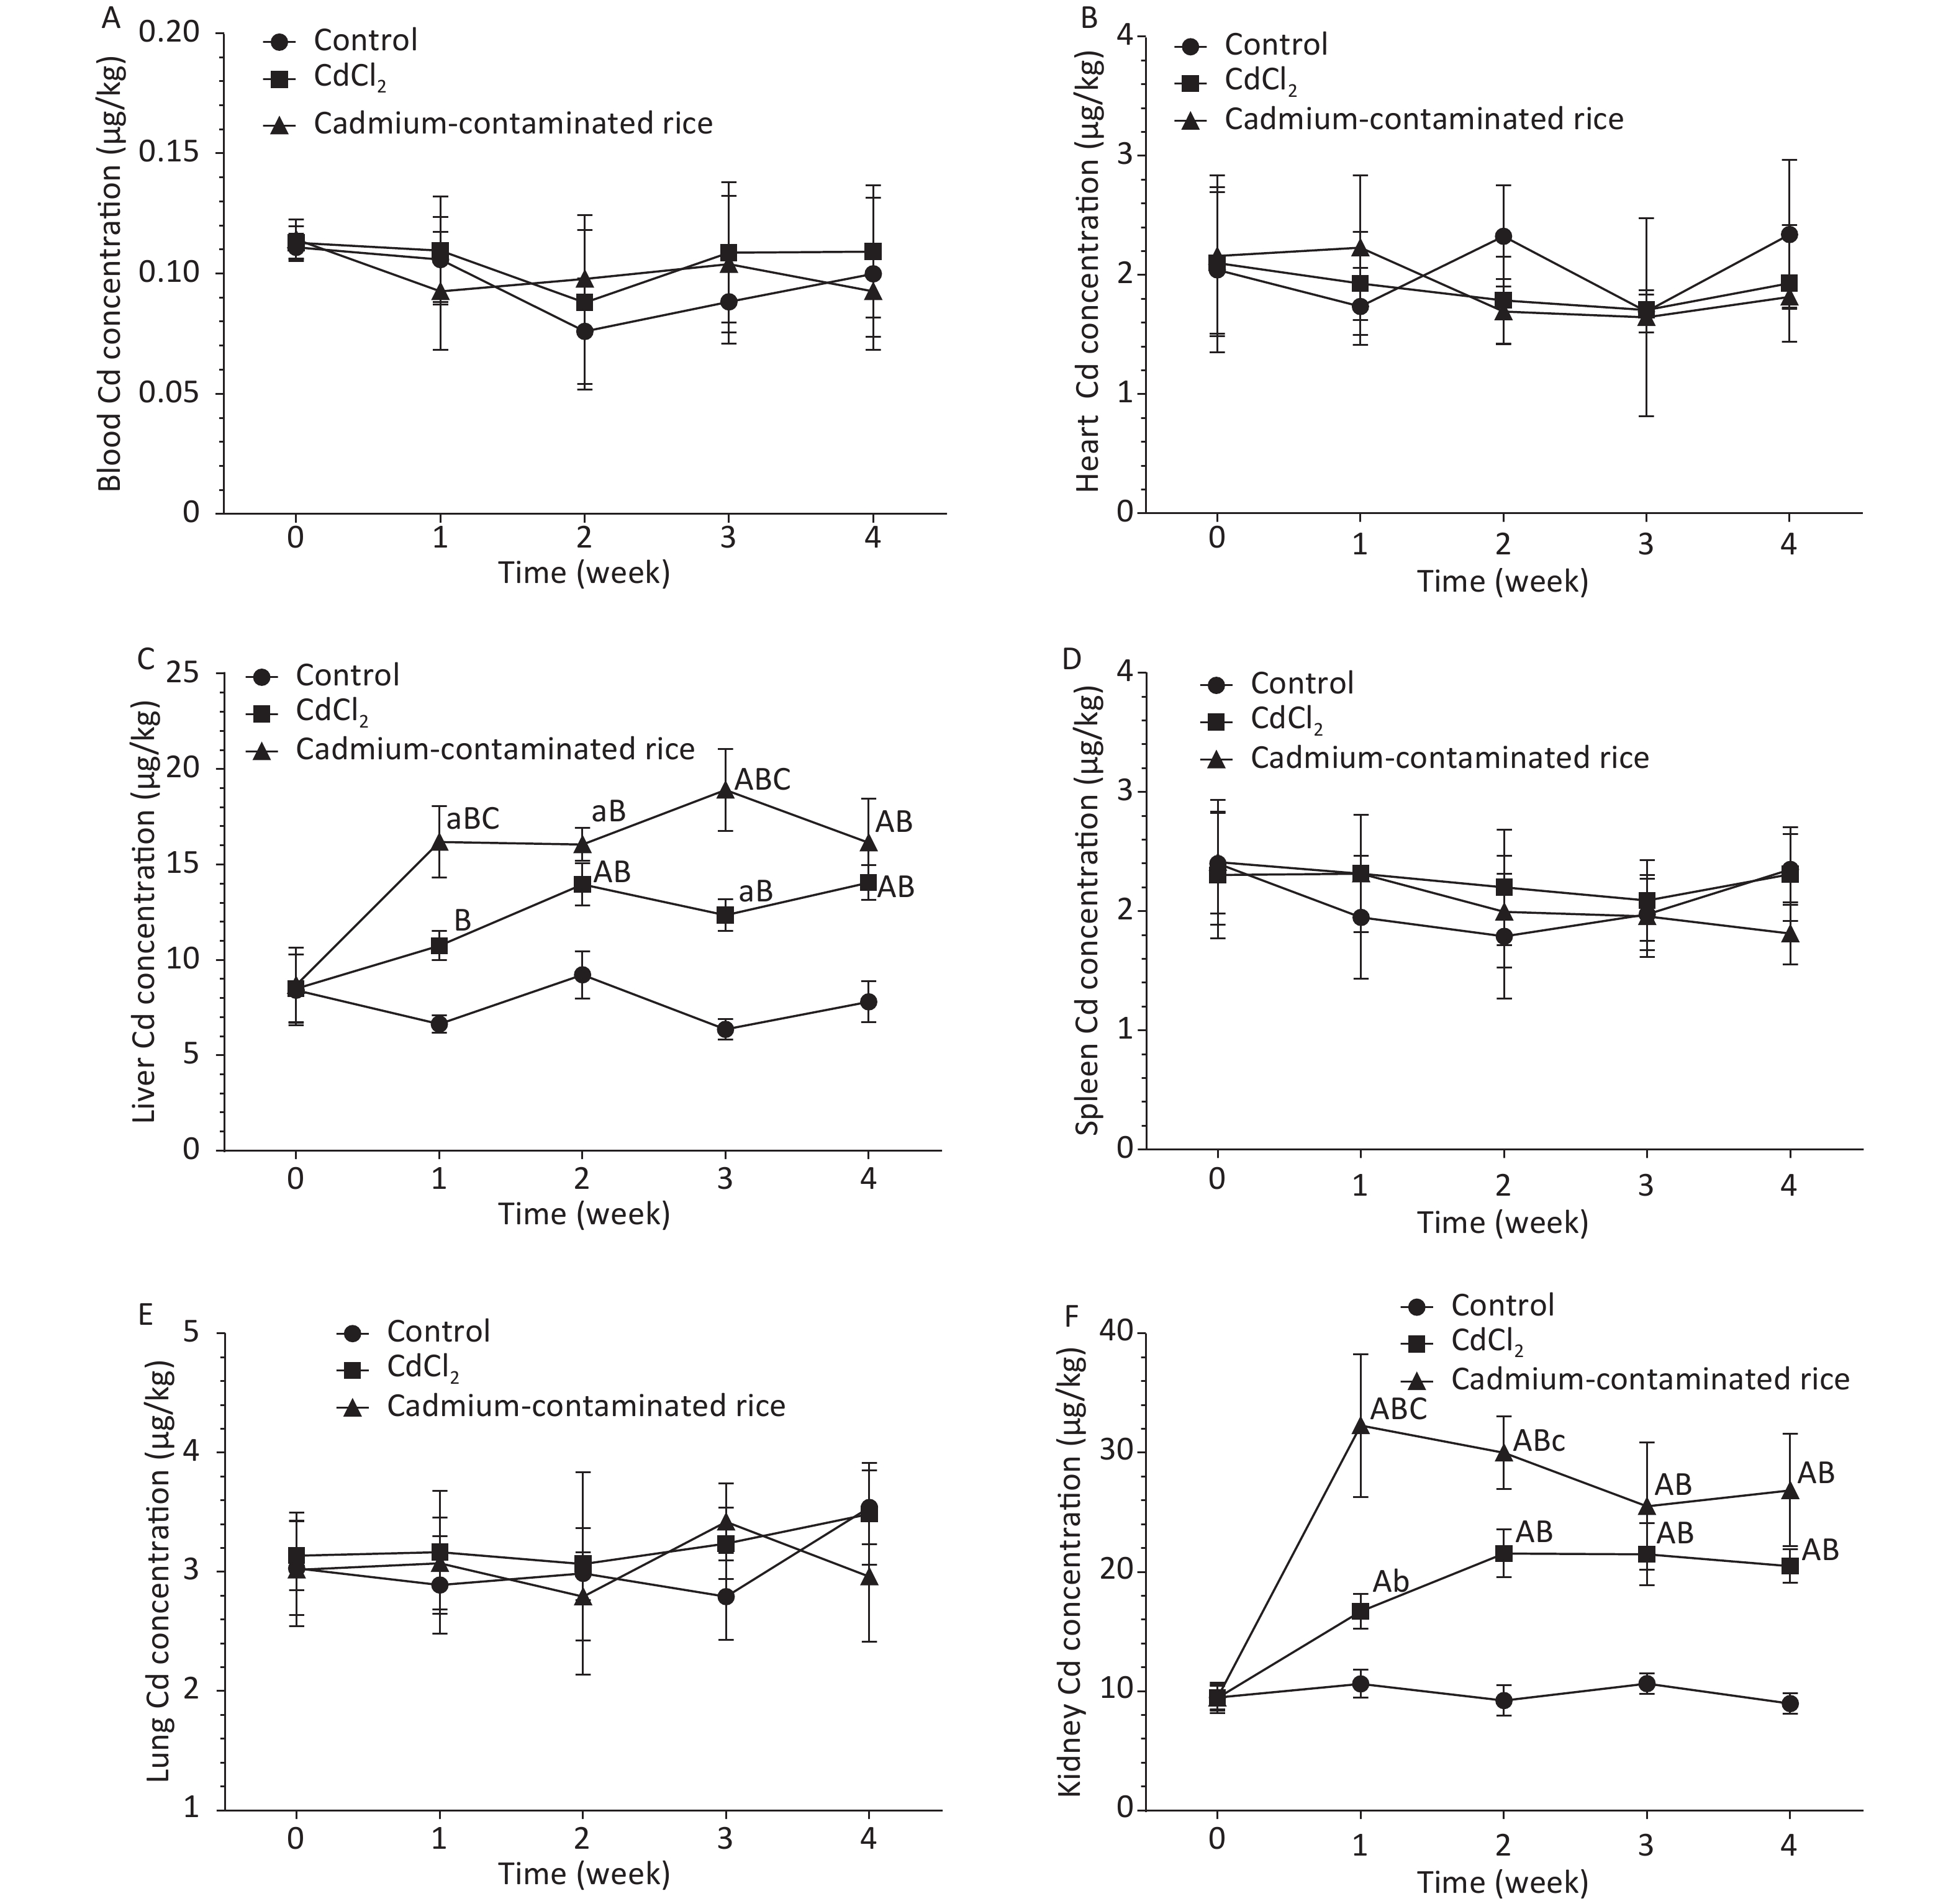
As demonstrated in Figure 2, the metabolic patterns of different forms of Cd in the CdCl2 group and Cd rice group were highly similar or the same in the blood. Blood Cd concentrations of rats in both the CdCl2 group and Cd rice group increased gradually at 2 h and reached a peak and then decreased rapidly. There were no statistically significant differences in the Cd levels in the blood of rats between the three groups (P > 0.05). At the same time, the Cd concentrations in the blood of rats in the CdCl2 group and Cd rice group remained at approximately 0.1020 μg/kg (Figure 3A). According to the accumulation results of Cd in the blood of rats, Cd was not observed to accumulate in the blood after digestion and absorption. With the increase of exposure time, the Cd concentrations in the heart, spleen, lung of rats in the CdCl2 group and the Cd rice group were largely the same as those of the blank control group. There was no significant difference in the Cd concentration between the three groups (P > 0.05), which indicated that Cd in the CdCl2 group and the Cd rice group did not accumulate heavily in the heart, spleen, lung of rats (Figure 3B, D, E).
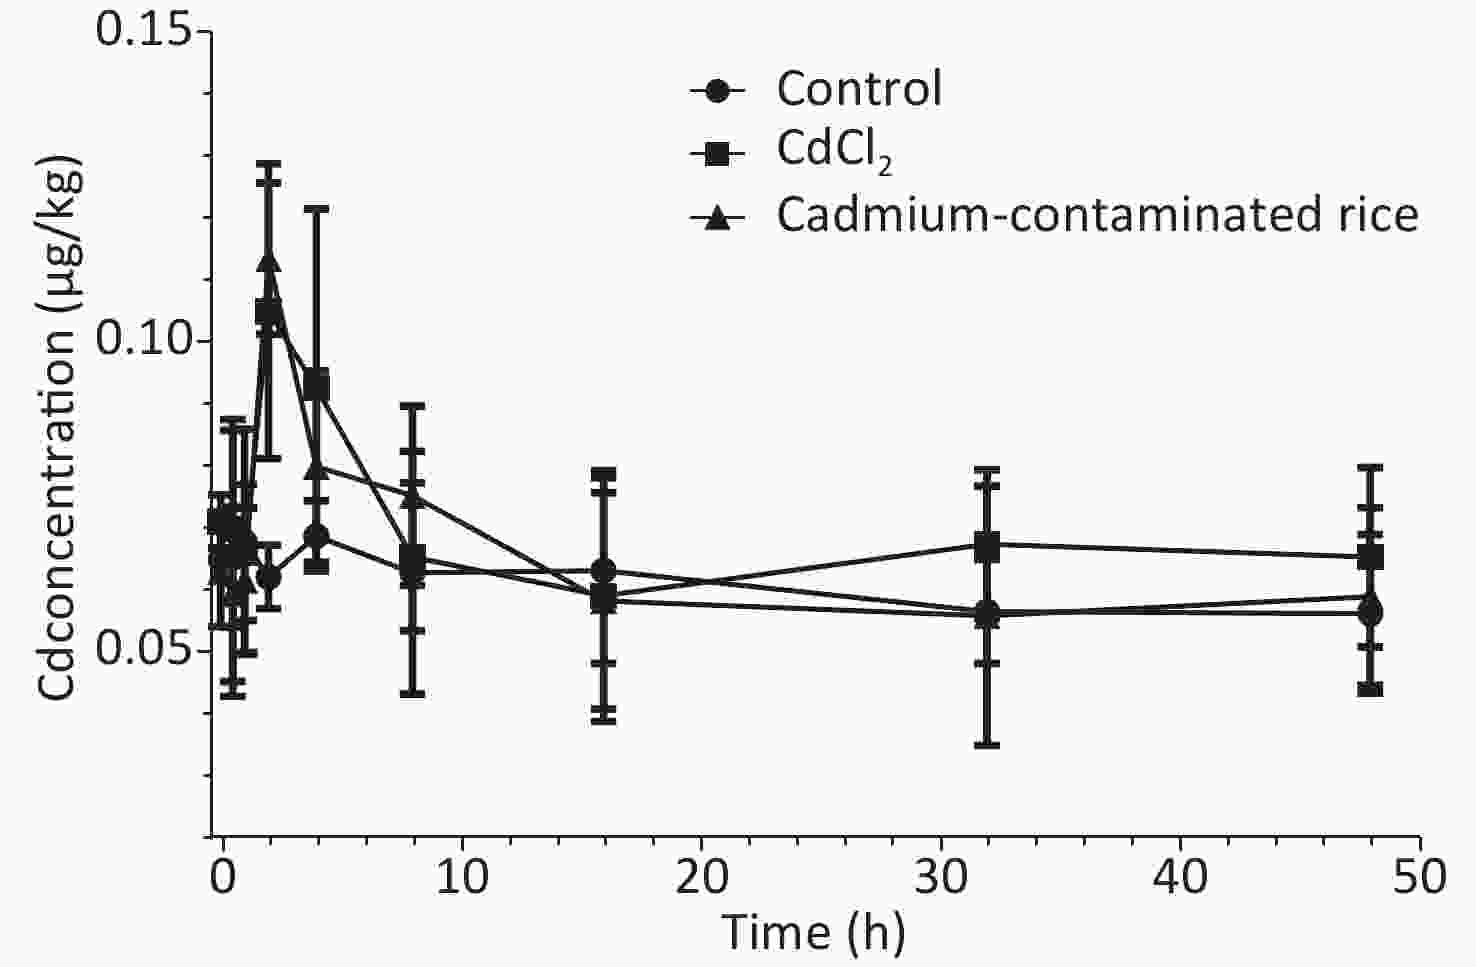
Figure 2. Concentration of cadmium in rat blood showed a time-dependent relationship after single intragastric administration (10 μg/kg body weight) to rats (n = 6, mean ± SD).
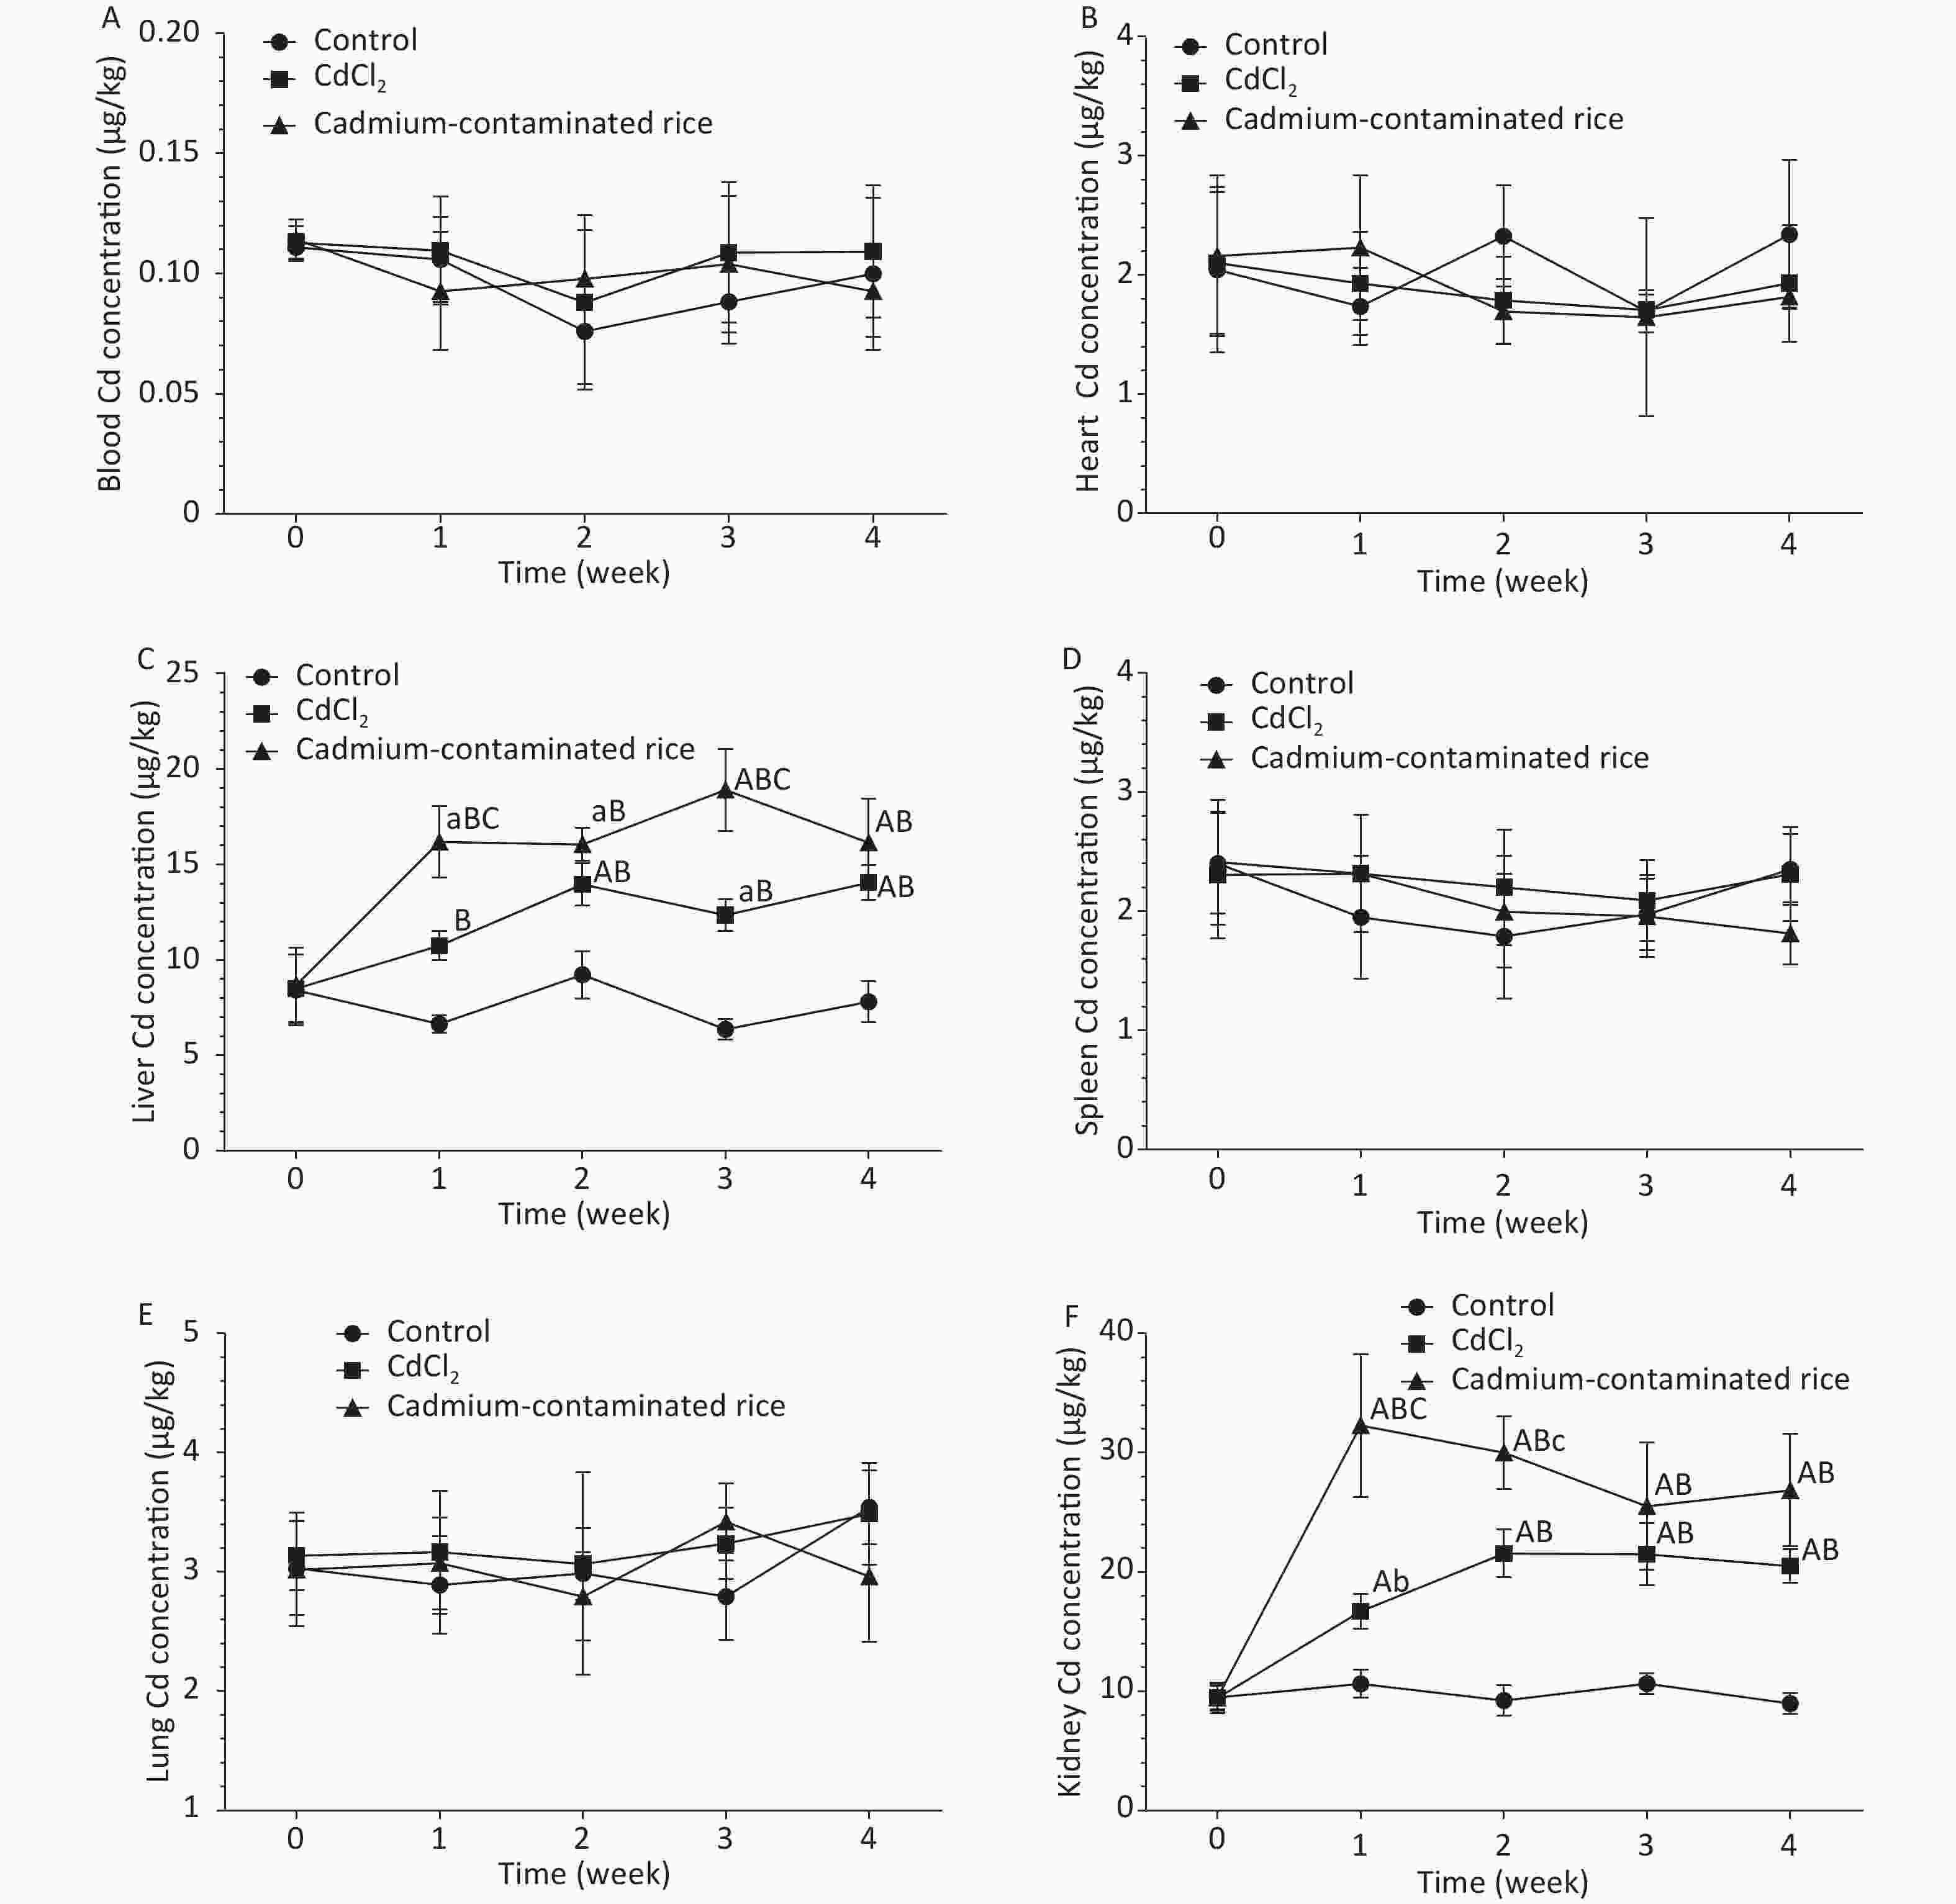
Figure 3. Cd accumulation in rat blood (A, n = 6), rat heart (B, n = 6), rat liver (C, n = 6), rat spleen (D, n = 6), rat lung (E, n = 6), rat kidney (F, n = 6). a: significant difference from 0 week (P < 0.05); A: significant difference from 0 week (P < 0.01); b: significant difference from the control group (P < 0.05); B: significant difference from the control group (P < 0.01); c: significant difference from the CdCl2 group (P < 0.05); C: significant difference from the CdCl2 group (P < 0.01); Absence of letters indicates no significant differences. The results are expressed as the mean ± SD.
Compared with the control group, the liver and kidney Cd concentrations of rats in the CdCl2 group and the Cd rice group were significantly increased (P < 0.01). In the fourth week, the Cd content in the livers of rats in the CdCl2 and Cd rice groups was 79.89% and 106.72%, respectively, higher than that of the control group (Figure 3C). The accumulation in the kidney of rats in the CdCl2 group and in the Cd rice group was 116.98% and 184.09%, respectively, higher than that of the negative control group (Figure 3F). Under the condition of the same concentration of Cd in the CdCl2 and Cd rice, the trend of Cd accumulation in rat liver is similar. It is worth noting that at the same time point, the Cd concentration in rat liver, kidney in the Cd rice group is significantly (P < 0.01) higher than in the CdCl2 group (Figure 3C, F).
During the continuous gavage of rats, the weight of rats in the CdCl2 group was slightly lower than in the control group, but the growth trend was the same. The weight of rats in the Cd rice group decreased slightly in the first week but then increased steadily. There was no significant difference in the organ coefficient between the groups, indicating that the doses selected in this experiment did not affect the growth of the experimental rats and ensured the normal physiological metabolism of the rats. In our study, we can clearly observe that the accumulation of Cd in the blood, heart, spleen and lung of rats in the control group, the CdCl2 group and the Cd rice group is similar, and there is no significant difference for the Cd level. Most results showed that Cd mainly accumulated in the liver and kidney[7]. In this study, there was a significant accumulation of Cd in the liver and kidney of rats in the the CdCl2 group andCd rice group. The content of Cd in the liver of rats in Cd rice group was 33.34% higher than that in CdCl2 group. In addition, the content of Cd in the kidney of rats in Cd rice group was 45.58% higher than that in CdCl2 group. According to the results of the study, under the condition of ingesting a low dose of Cd, the accumulation rule of Cd in CdCl2 and Cd rice in rats is kidney > liver, but less accumulation in blood, heart, spleen and lung. Kidney is the main accumulating organ for the low dose of Cd. These results showed that in Cd rice group, the Cd form was more likely to accumulate in rats than in CdCl2 group. Prankel et al. studied sheep and found that the accumulation caused by the addition of organic Cd in the feed was significantly more serious than that caused by the addition of CdCl2[8]. Phillips et al. also obtained similar results. In the short-term experiment, sheep absorbed more organic Cd in the forage than inorganic Cd added in the blank forage[9]. It’s worth noting that in the Philips study he noted that sheep fed with organic cadmium absorbed less calcium, iron and zinc than those fed with inorganic cadmium. The efficient lowering of Cd accumulation by a low dose of Zn in presence of a comparably high metallothioneins expression[10]. The absorption and accumulation of Cd in rice are different from those in CdCl2 in rats, which may be observed because the different forms of Cd binding in rice will affect the absorption, distribution and metabolism of Cd in animals, thereby affecting its accumulation in vivo. It may also be caused by differences in the amount of trace elements absorbed by the rats. The accumulation of cadmium in rice and ion cadmium is different, but further experiments and studies are needed to confirm. Although it is not yet possible to determine the extent of cadmium in rice and the mechanism of its effects on people, we must pay enough attention to it.
Comparison of the Absorption and Distribution of Cadmium via Cadmium Chloride and Cadmium-contaminated Rice in Rats
doi: 10.3967/bes2020.019
Funds:
This work was supported by the National Key Research and Development Programme of China [2017YFC1600500]; and Grain Industry Research Special Funds for Public Welfare Projects [No. 201513006-03]
- Received Date: 2019-09-26
- Accepted Date: 2020-01-16
| Citation: | WU Qian, WANG Lei, CHEN Yu Wei, ZHANG Hu, FANG Min, WU Yong Ning, GONG Zhi Yong. Comparison of the Absorption and Distribution of Cadmium via Cadmium Chloride and Cadmium-contaminated Rice in Rats[J]. Biomedical and Environmental Sciences, 2020, 33(2): 141-144. doi: 10.3967/bes2020.019

|

 Quick Links
 DownLoad: