


-
Alzheimer’s disease (AD) is the most common type of neurodegenerative dementia worldwide[1]. Deposition of extracellular amyloid protein β (Aβ)-producing amyloid plaques and intracellular tau aggregation-comprising neurofibrillary tangles are two typical pathological features of this disease. Patients progress from mild cognitive impairment (MCI) to dementia of the Alzheimer type (DAT) typically within approximately five years[1]. There is a growing belief that AD is a heterogeneous disease affected by numerous factors, including age, genetic factors, and environmental factors. Although abundant research has been performed, effective prevention and treatment strategies for AD have yet to be developed[2]. Therefore, it is urgent to identify biomarkers of AD for early diagnosis.
Triggering receptor expressed on myeloid cells 2 (TREM2) is a transmembrane protein primarily expressed on myeloid lineage cells peripheral and microglia in the brain. TREM2 plays an important role in regulating inflammatory signals and promoting microglial proliferation, phagocytosis and survival[3]. Rare variants of the TREM2 gene have been shown to increase the risk of developing AD, especially the R47H variant[4]. After proteolytic cleavage, soluble TREM2 (sTREM2) is released into the extracellular space and can be detected in the blood and cerebrospinal fluid (CSF). This has been confirmed by several experiments, indicating that AD patients present higher sTREM2 levels in the CSF than cognitively normal individuals[5]. However, owing to the limitations of lumbar puncture, it is difficult to widely use CSF biomarkers. In recent years, with extensive research on TREM2, the relationship between TREM2 and AD has attracted increasing attention at both the gene and protein levels. According to a recent study, TREM2 may play a protective role in the pathogenesis of AD[6]. These data suggest that TREM2 is closely related to AD.
In this study, we determined the concentration of TREM2 in the serum as well as its mRNA and protein levels in the monocytes of patients at different stages of AD and Parkinson’s disease dementia (PDD). In addition, the diagnostic value of sTREM2 was determined through relative operating characteristic curve (ROC) analysis. Moreover, we evaluated sTREM2 levels in the serum and hippocampus of an AD mouse model and analyzed the correlation between cognition and sTREM2 levels.
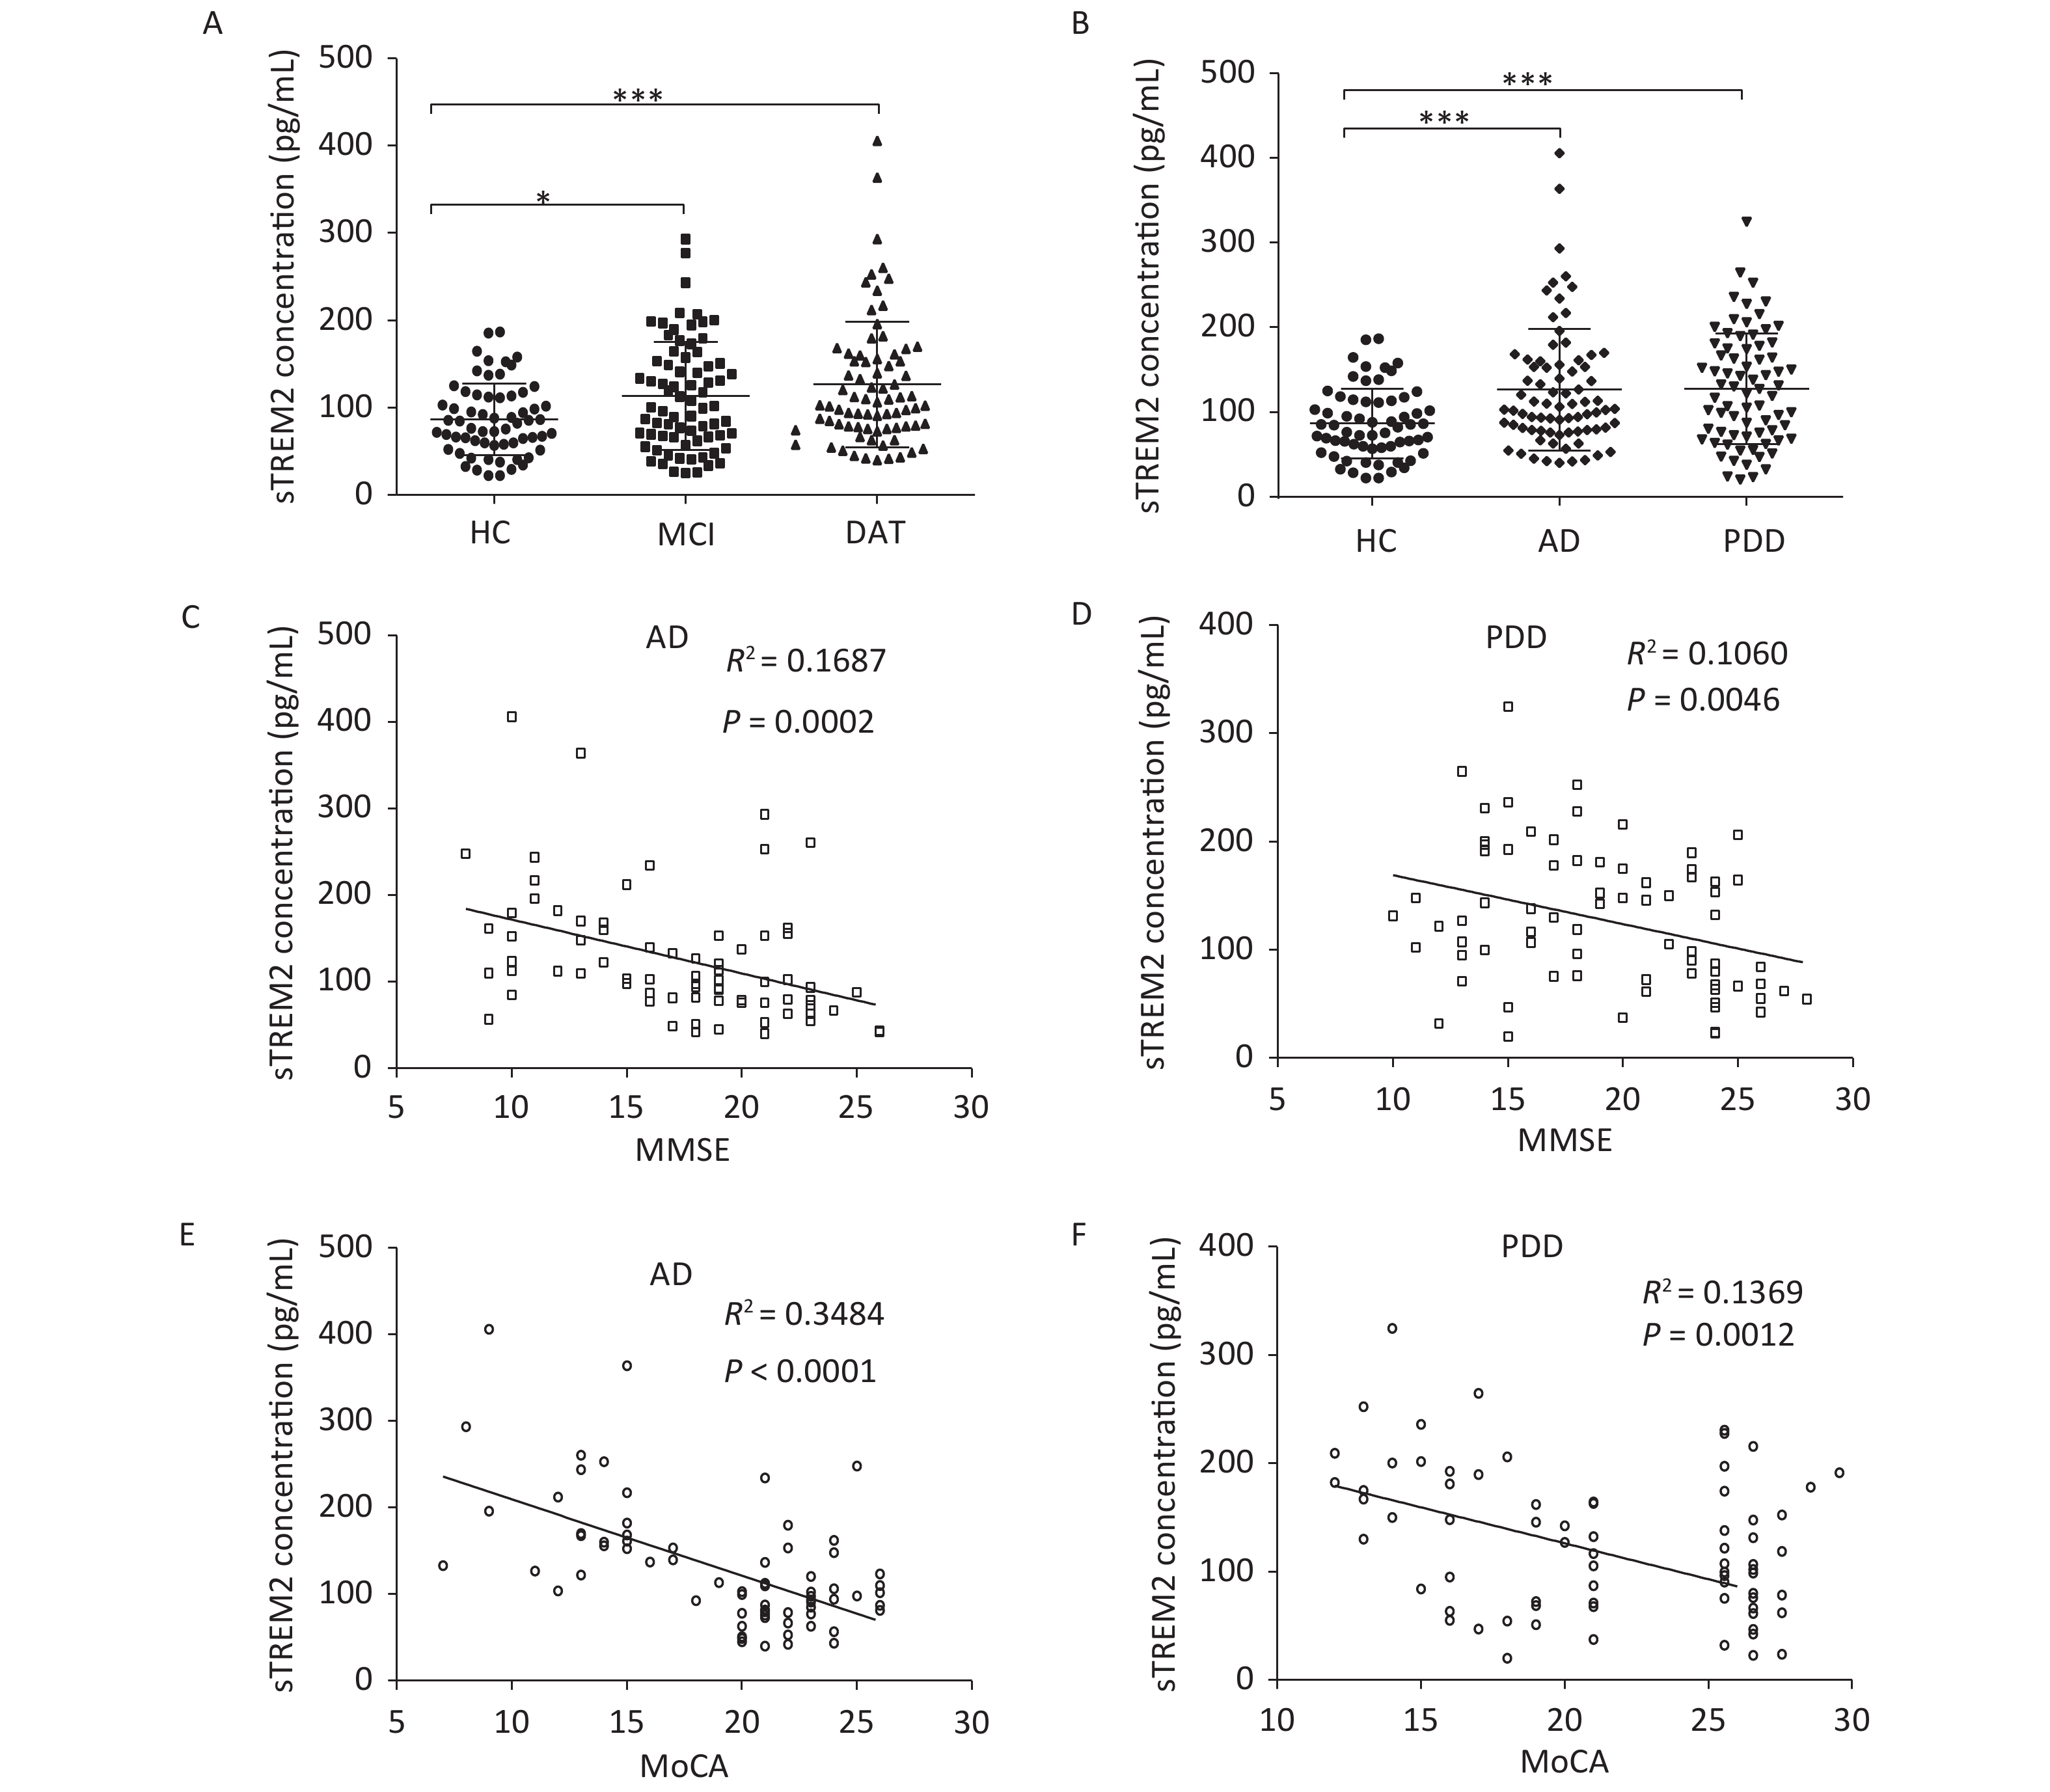
The level of sTREM2 in the serum was measured using ELISA. A total of 288 participants were recruited in this present study. According to the NINCDS-ADRDA diagnostic criteria, AD patients were categorized into the MCI and DAT groups. The cognitive status and severity of dementia were assessed based on the Mini-Mental State Examination (MMSE) and Montreal Cognitive Assessment (MoCA) scores. This study was approved by the Ethics Committee of Xuanwu Hospital of Capital Medical University (Beijing, China), and all participants or their guardians provided informed consent. The patients’ clinical data are shown in Supplementary Table S1, available in www.besjournal.com. Compared with the healthy control (HC) group, the MCI and DAT groups exhibited increased sTREM2 levels in the serum (Figure 1A). Meanwhile, the concentration of sTREM2 in PDD patients was also higher than that in HC subjects (Figure 1B). However, there was no obvious difference in sTREM2 levels between MCI and DAT as well as between AD and PDD patients.
Characteristics HC (n = 63) MCI (n = 74) DAT (n = 77) PD (n = 74) P value (vs. HC) Age (years) Min 52 50 50 50 Max 80 83 85 85 Mean ± SD 65.24 ± 6.92 68.64 ± 8.08 67.86 ± 7.87 67.64 ± 7.91 ns Gender, n (%) Female 29 (46.0%) 39 (52.7%) 44 (57.1%) 44 (59.5%) ns Male 34 (54.0%) 35 (47.3%) 33 (42.9%) 30 (40.5%) ns MMSE Min 22 16 8 10 Max 29 28 26 28 Mean ± SD 26.38 ± 2.31 23.15 ± 3.02 17.35 ± 4.74 19.30 ± 4.73 < 0.0001 MoCA Min 21 10 7 12 Max 29 26 26 26 Mean ± SD 25.70 ± 2.39 23.15 ± 3.02 20.89 ± 3.47 19.45 ± 4.81 < 0.0001 Note. HC: Health control; MCI: Mild cognitive impairment; DAT: dementia of Alzheimer type; PDD: Parkinson’s disease dementia. MMSE: Mini-Mental State Examination; MoCA: Montreal cognitive assessment scale. Min: Minimum; Max: Maximum; SD: standard deviation; ns: no significance. Data were compared by One-way ANOVA test (Kruskal-Wallis test), vs. HC. Table S1. Characterization of subjects in different groups
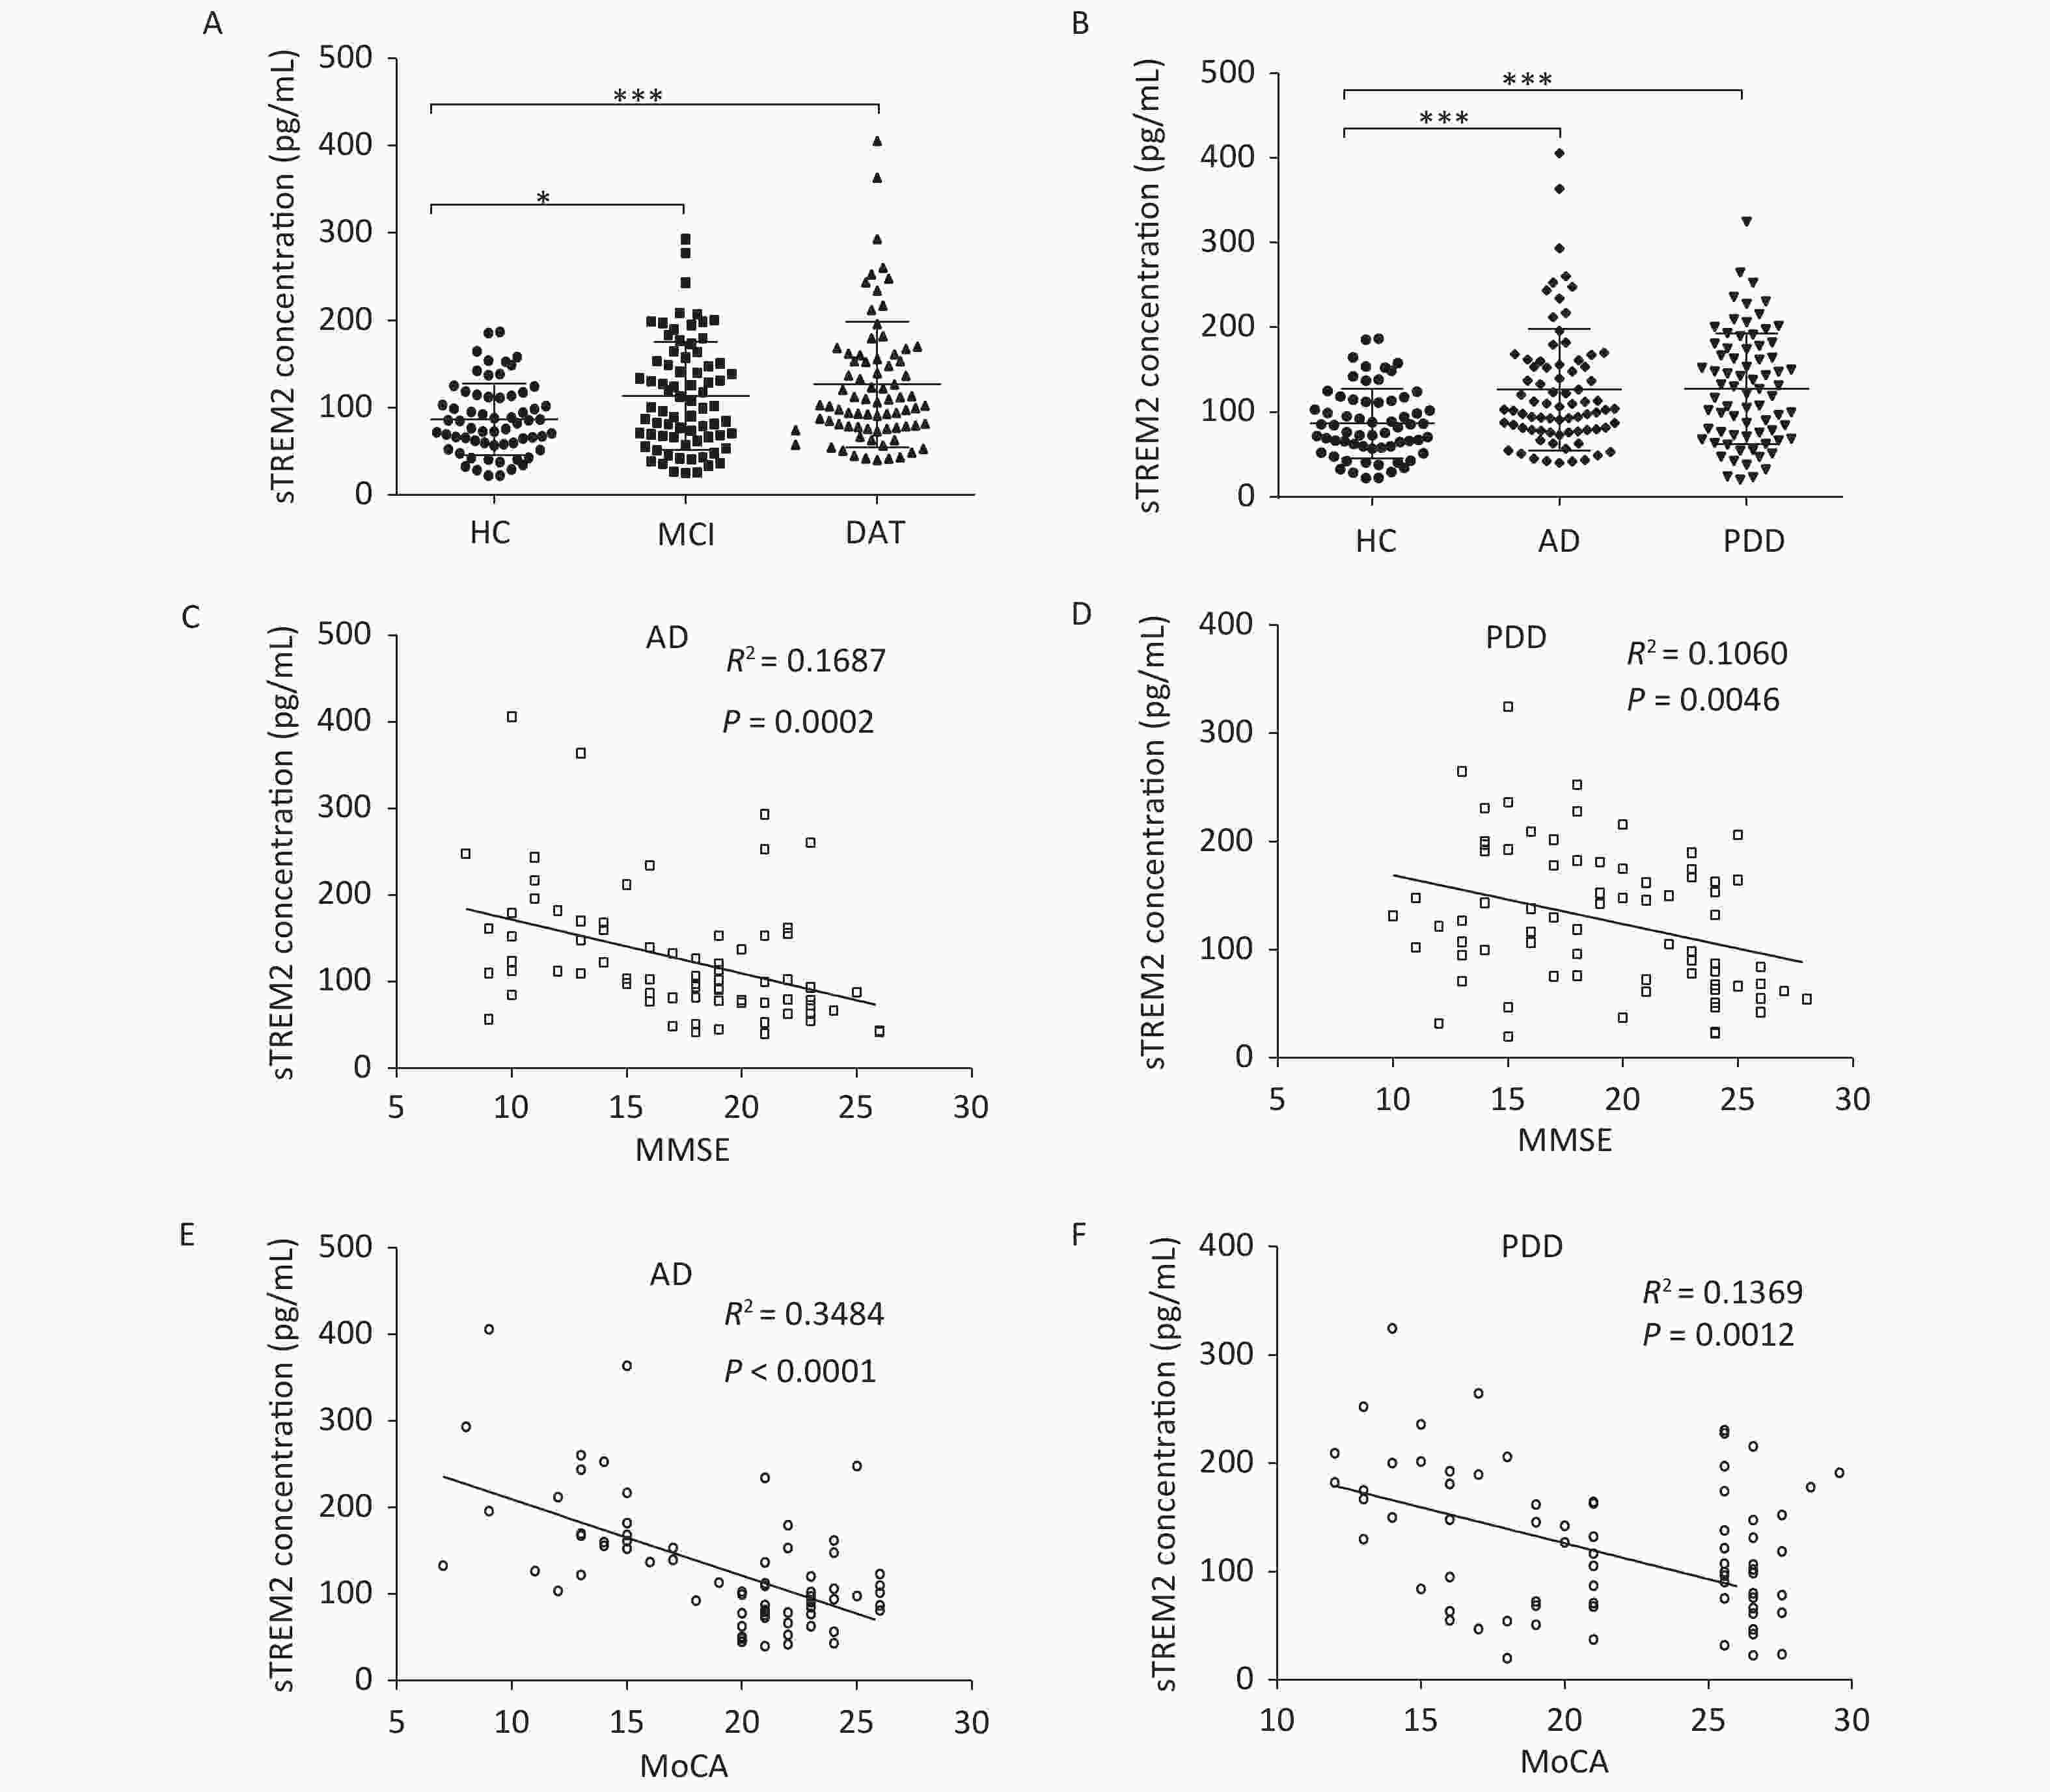
Figure 1. sTREM2 levels in the serum of different group subjects. (A) The serum levels of sTREM2 in MCI (n = 74) and DAT (n = 77) patients compared with HC (n = 63) subjects. (B) The serum levels of sTREM2 in AD (n = 77) and PDD (n = 74) patients compared with HC (n = 63) subjects (values represent mean ± SD, *P < 0.05, ***P < 0.001). (C) The correlation between serum sTREM2 level and the MMSE score in AD patients (R2 = 0.1687, P = 0.0002). (D) The correlation between serum sTREM2 level and the MMSE score in PDD patients (R2= 0.1060, P = 0.0046). (E) The relationship between the serum level of sTREM2 and the MoCA score in AD patients (R2 = 0.3484, P < 0.0001). (F) The relationship between the serum level of sTREM2 and the MoCA score in PDD patients (R2 = 0.1369, P = 0.0012). The data in (A) and (B) were analyzed using one-way analysis of variance (ANOVA). The data in (C)–(F) were analyzed by linear regression analysis. HC: Health control; MCI: Mild cognitive impairment; DAT: dementia of Alzheimer type; PDD: Parkinson’s disease dementia. MMSE: Mini-Mental State Examination; MoCA: Montreal cognitive assessment scale
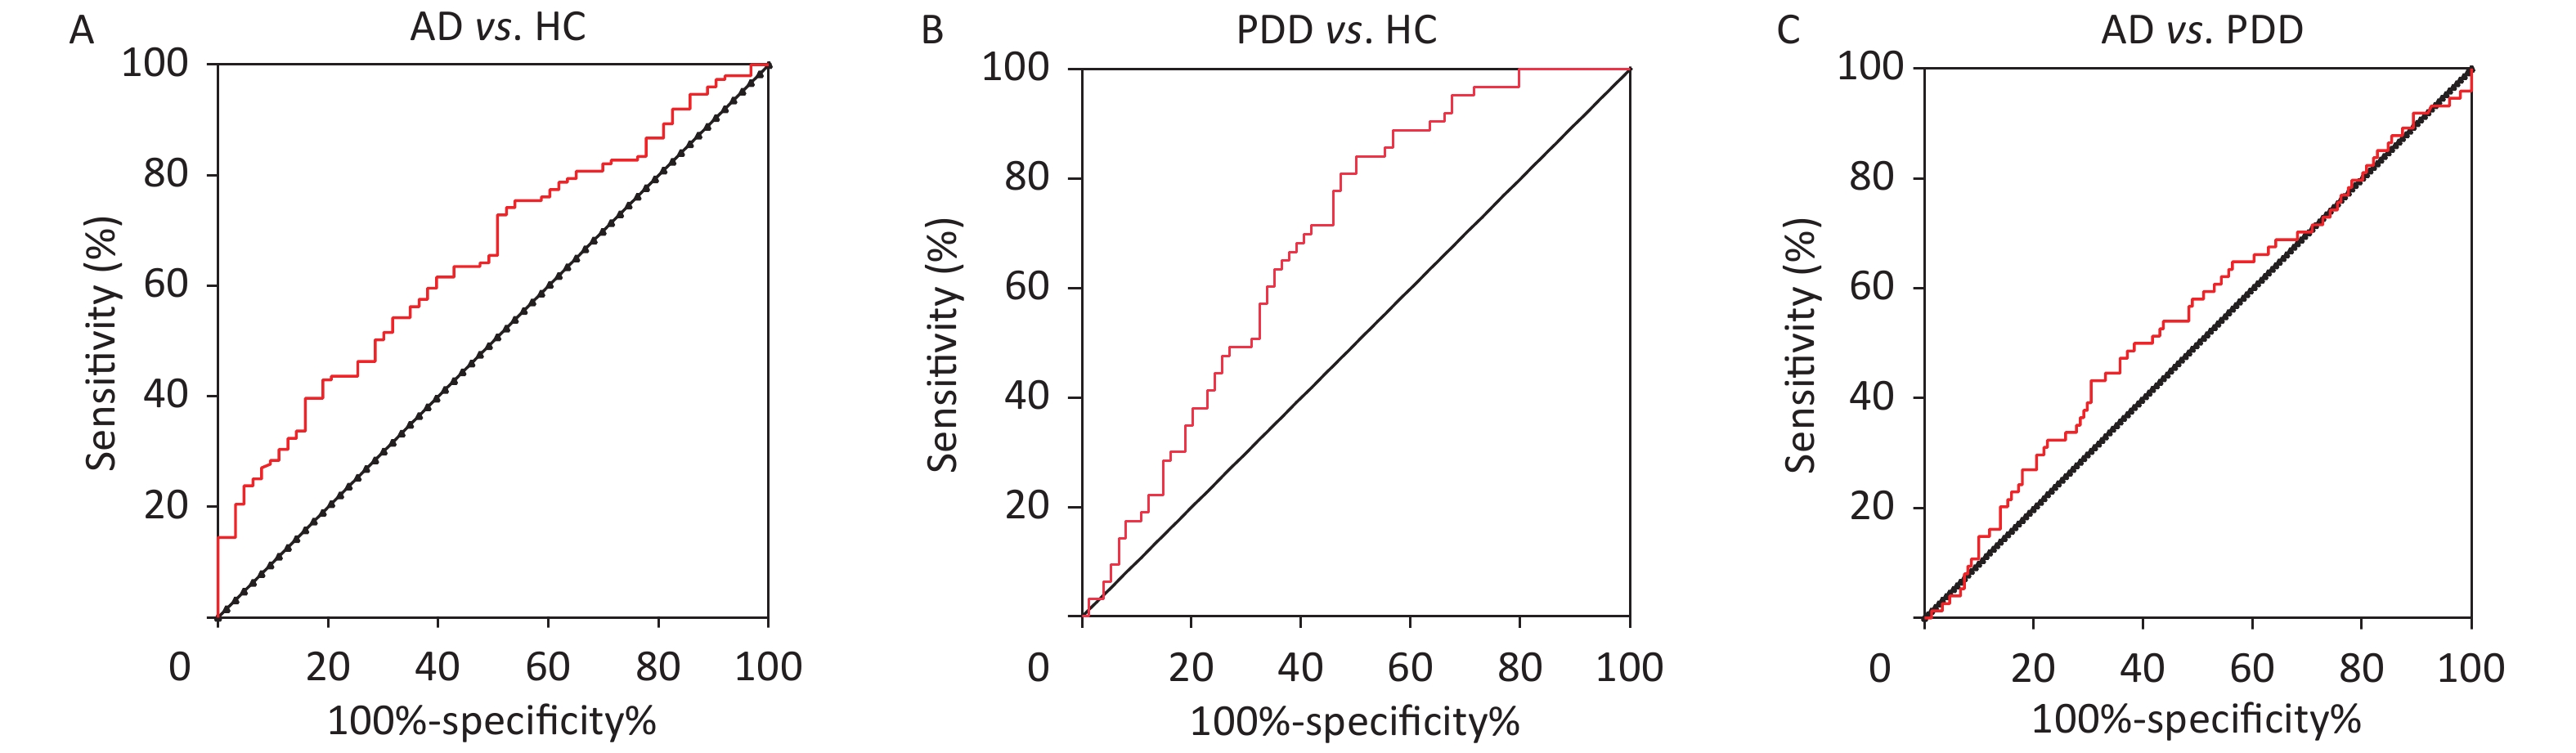
To further explore the relationship between sTREM2 and cognitive ability, we analyzed the correlation between sTREM2 levels and the MMSE/MoCA scores (Figure 1C–F). There was a negative correlation between sTREM2 levels and the cognition score (MMSE/MoCA) within the AD and PDD groups. Notably, this relationship was stronger in AD than in PDD patients. These results suggested that serum sTREM2 could be a potential marker for MCI diagnosis and monitoring of AD progression. To better interpret these test results, the diagnostic value of sTREM2 in the serum was further examined by ROC curve analysis. The sensitivity and specificity were 81.8% and 47.6%, respectively, and the area under the curve (AUC) was 0.6773 in discriminating AD from HC subjects. The sensitivity and specificity were 50.0% and 84.1%, respectively, and the AUC was 0.6862 in discriminating PDD from HC subjects. The sensitivity and specificity were 50.0% and 63.6%, respectively, and the AUC was 0.5217 in discriminating AD from PDD patients (Supplementary Figure S1, available in www.besjournal.com). The detailed data of diagnostic powers of sTREM2 are shown in Supplementary Table S2, available in www.besjournal.com.
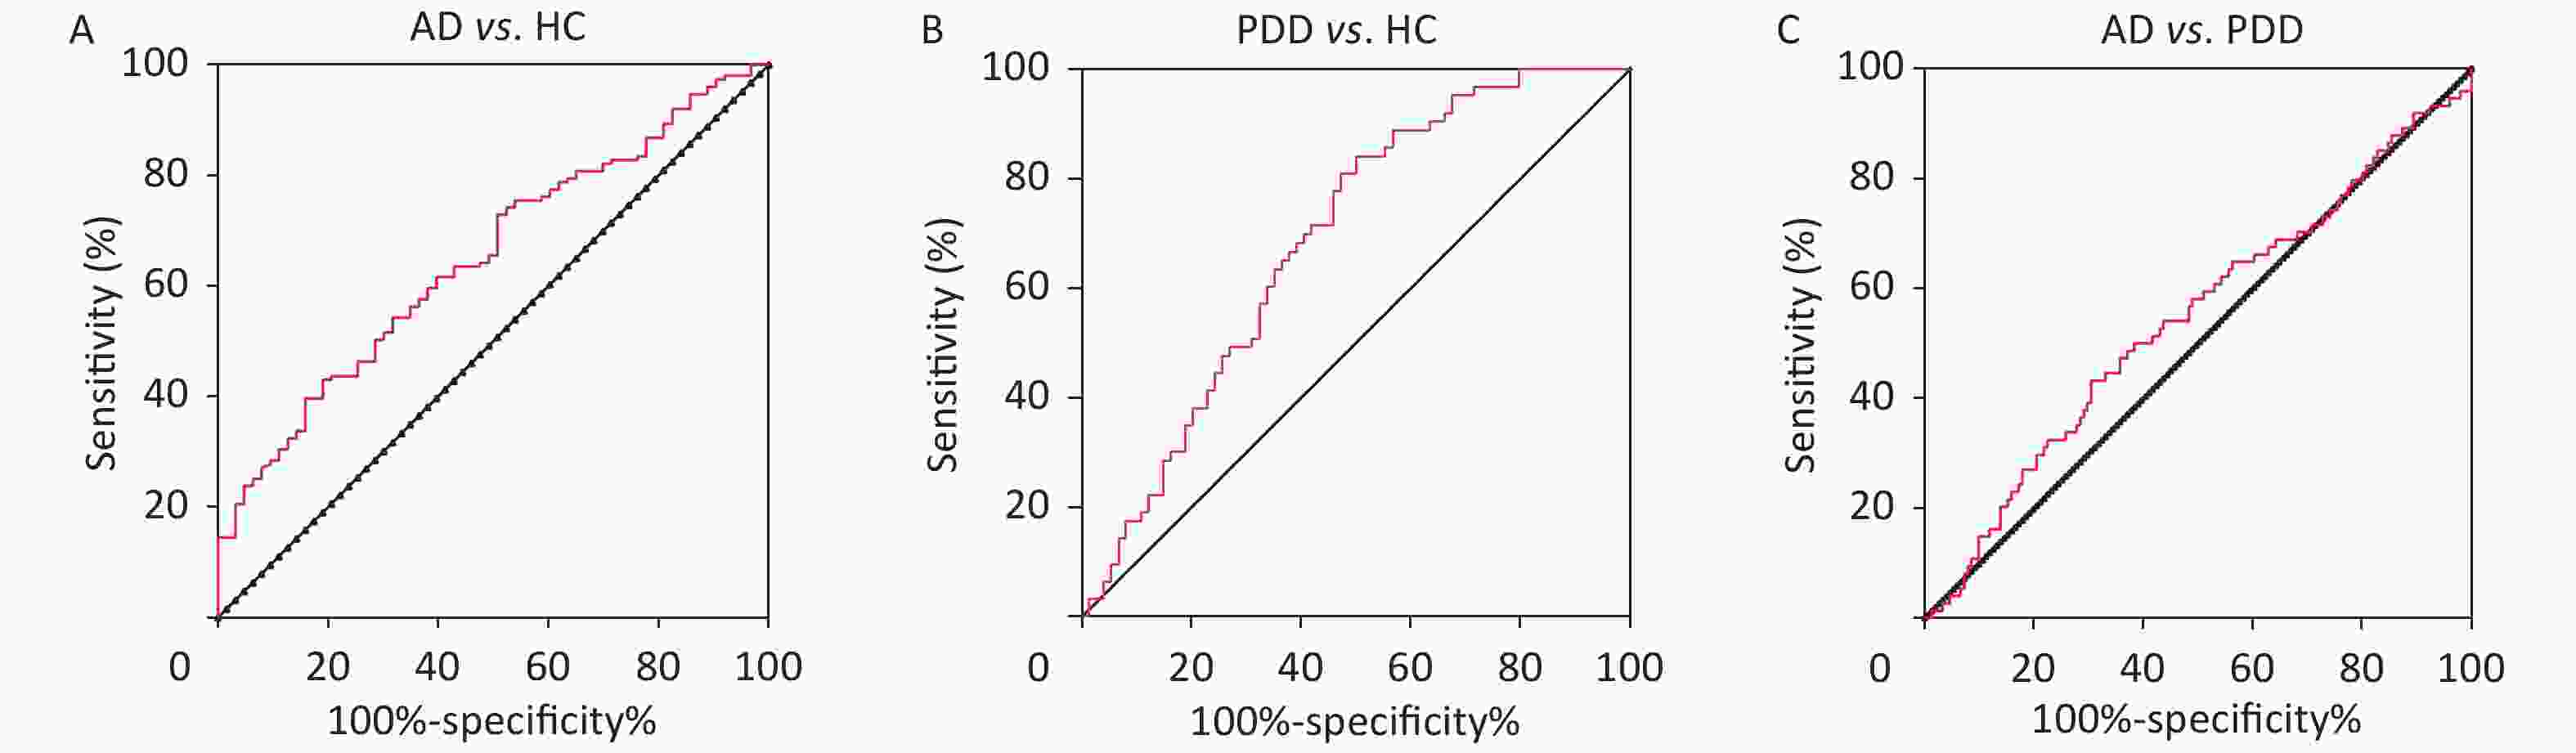
Figure S1. ROC curves of sTREM2 in the differential diagnosis of AD and PDD patients and HC subjects. (A) ROC curve of sTREM2 was used to distinguish AD from HC. (B) ROC curve of sTREM2 was used to distinguish PDD from HC. (C) ROC curve of sTREM2 was used to distinguish AD from PDD patients.HC: Health control; MCI: Mild cognitive impairment; DAT: dementia of Alzheimer type; PDD: Parkinson’s disease dementia.
Comparison group Cut-off value Sensitivity (%) Specificity (%) AUC 95% Confidence Inteval P value AD vs. HC 0.294 81.8 47.6 0.6773 0.5892−0.7654 0.000316 PDD vs. HC 0.341 50.0 84.1 0.6862 0.5980−0.7744 0.000178 AD vs. PDD 0.136 50.0 63.6 0.5217 0.4282−0.6151 0.6458 Note. AUC: Area under the curve; HC: Health control; AD: Alzheimer's disease; PDD: Parkinson’s disease dementia. Table S2. Diagnostic powers of the sTREM2 to discriminate between AD and the non-AD subjects
Furthermore, we measured TREM2 expression levels in the monocytes via RT-qPCR and western blotting analyses. The monocytes were isolated from EDTA anticoagulant-treated peripheral blood through Ficoll-Paque (P8900, Solarbio) density gradient centrifugation. The RT-qPCR primers were as follows:
TREM2: forward primer: 5’-GGTCAGCACGCACAACTTG-3’,
reverse primer: 5’-CGCAGCGTAATGGTGAGAGT-3’.
GAPDH: forward primer: 5’-GTCTCCTCTGACTTCAACAGCG-3’,
reverse primer: 5’-ACCACCCTGTTGCTGTAGCCAA-3’.
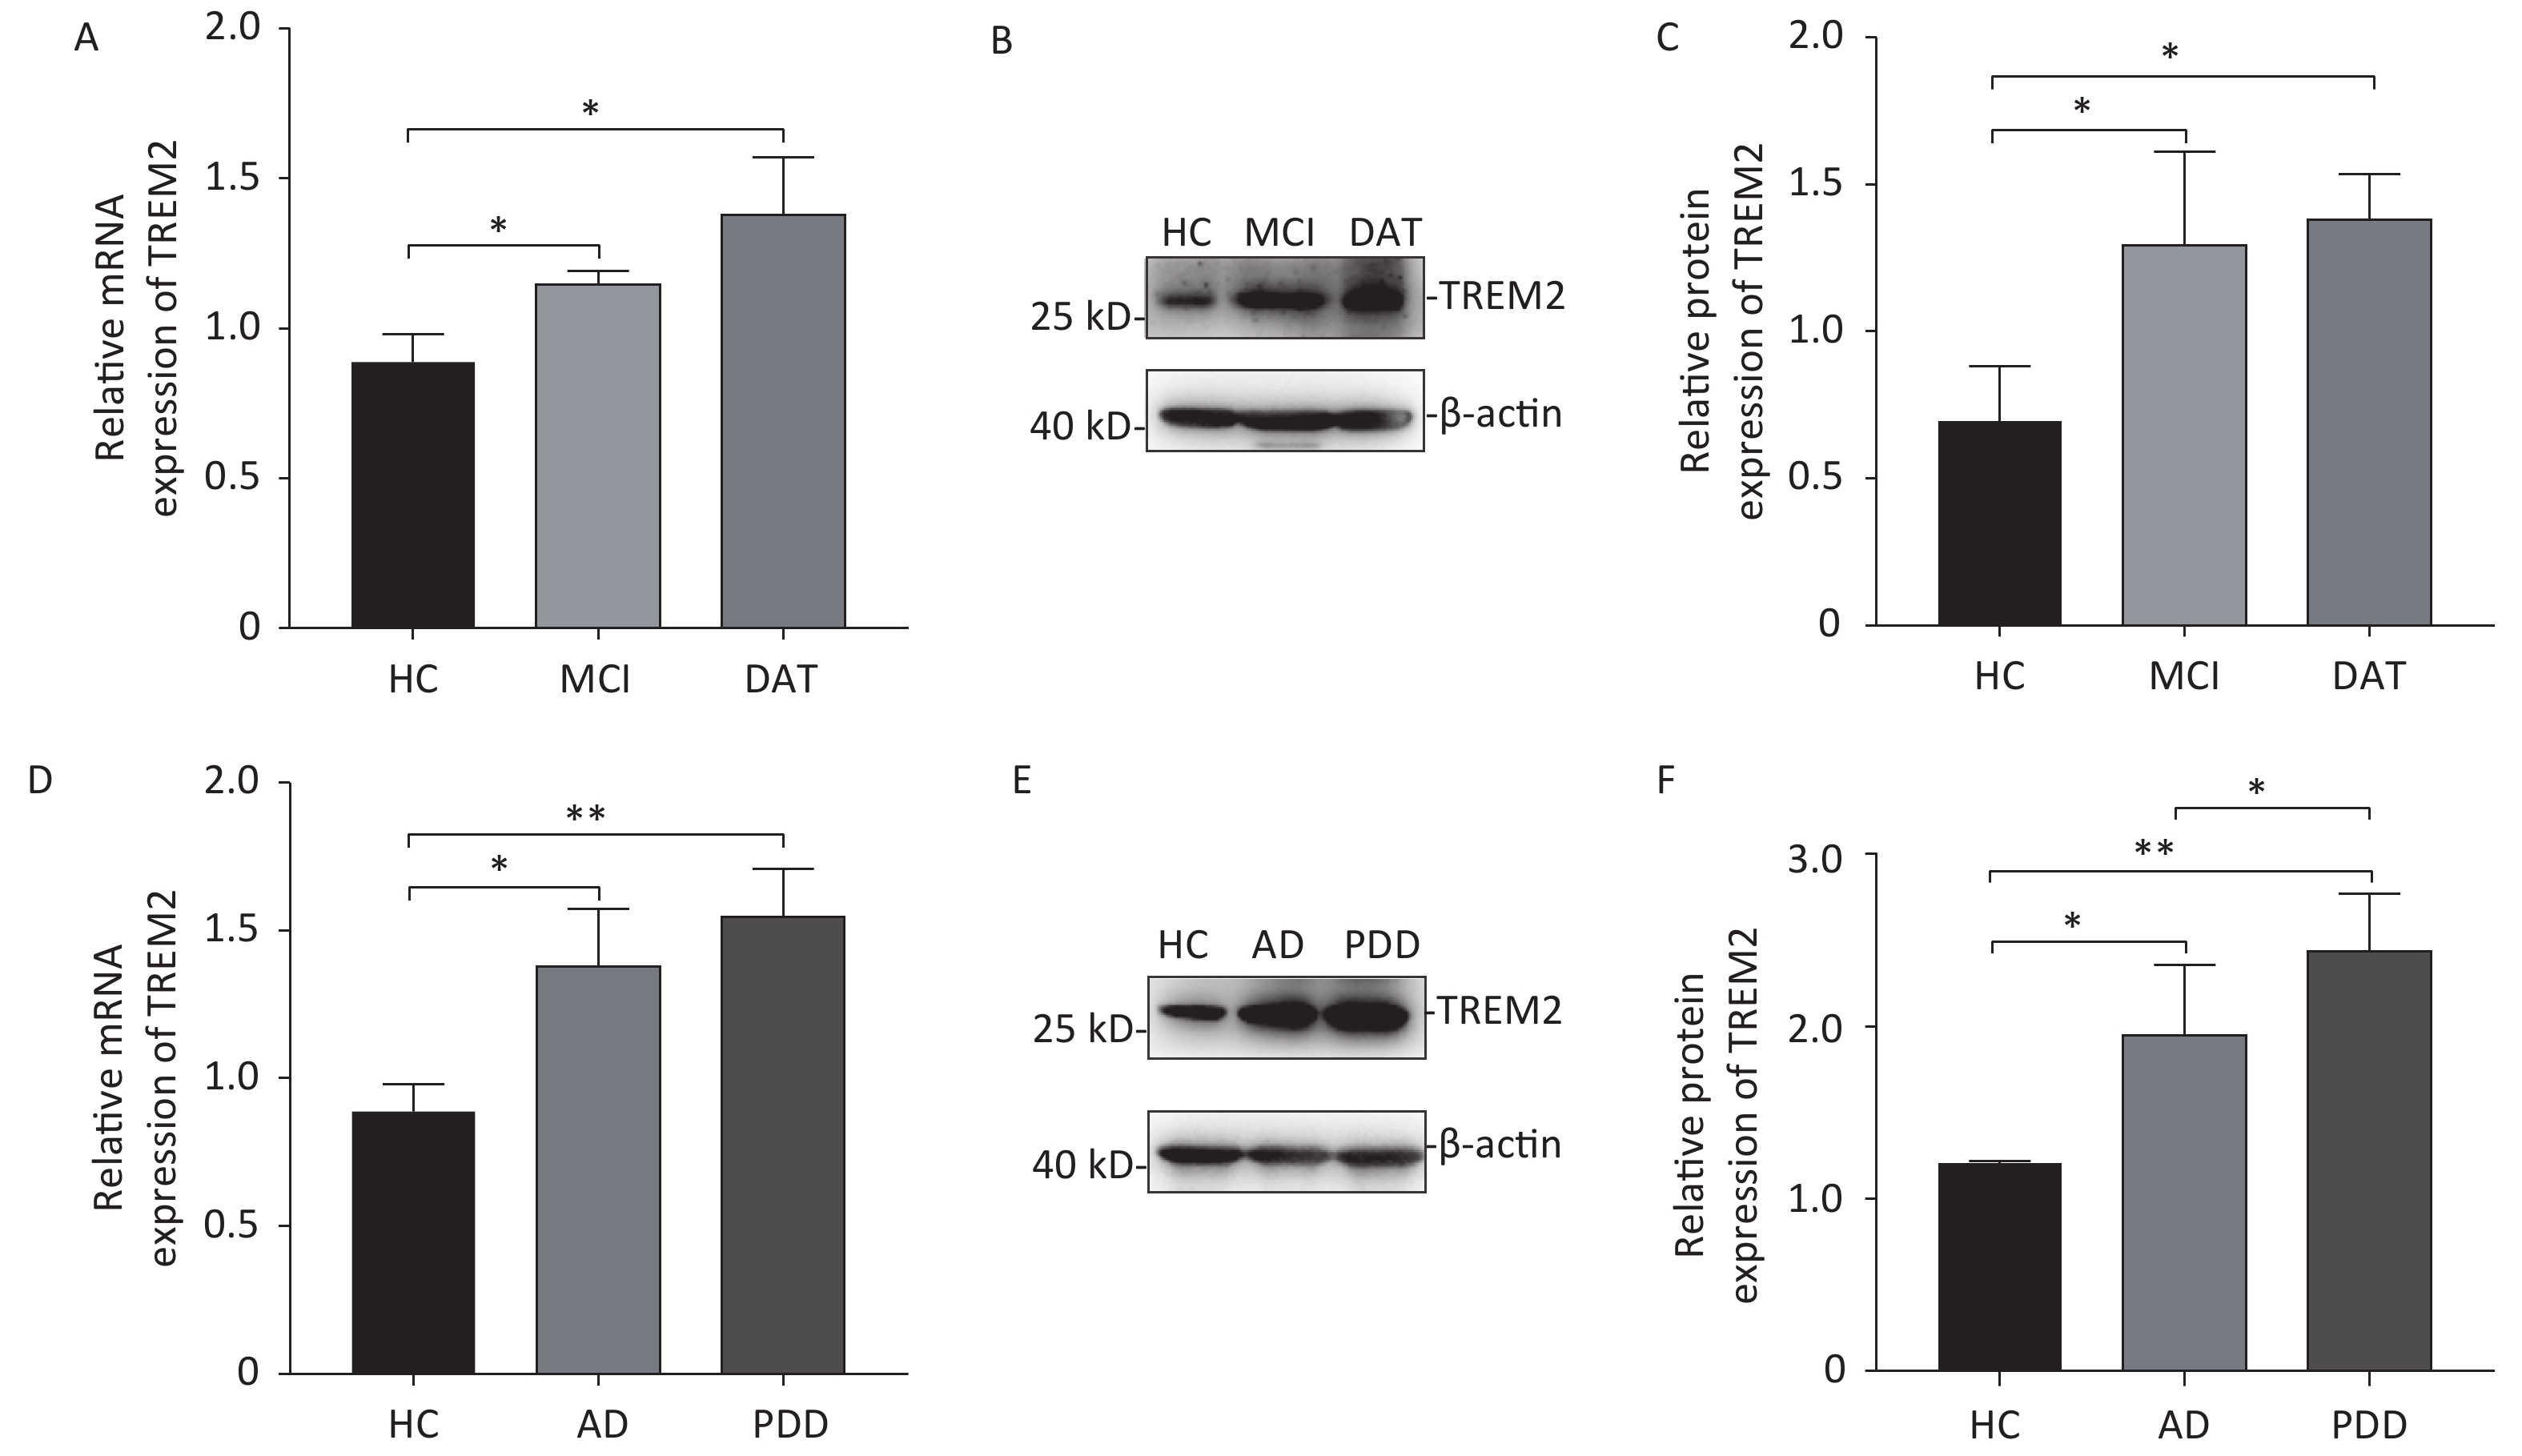
Increased expression of TREM2 was observed in the monocytes isolated from AD patients (both at the MCI and DAT stages) and PDD patients at both the mRNA and protein levels (Figure 2). Although there was no difference in TREM2 expression levels between MCI and DAT patients, a slight elevation in TREM2 expression was observed in the monocytes of PDD patients compared with that of AD patients. These results indicate that monocyte TREM2 can be used as a potential biomarker in the diagnosis of neurodegenerative disease.
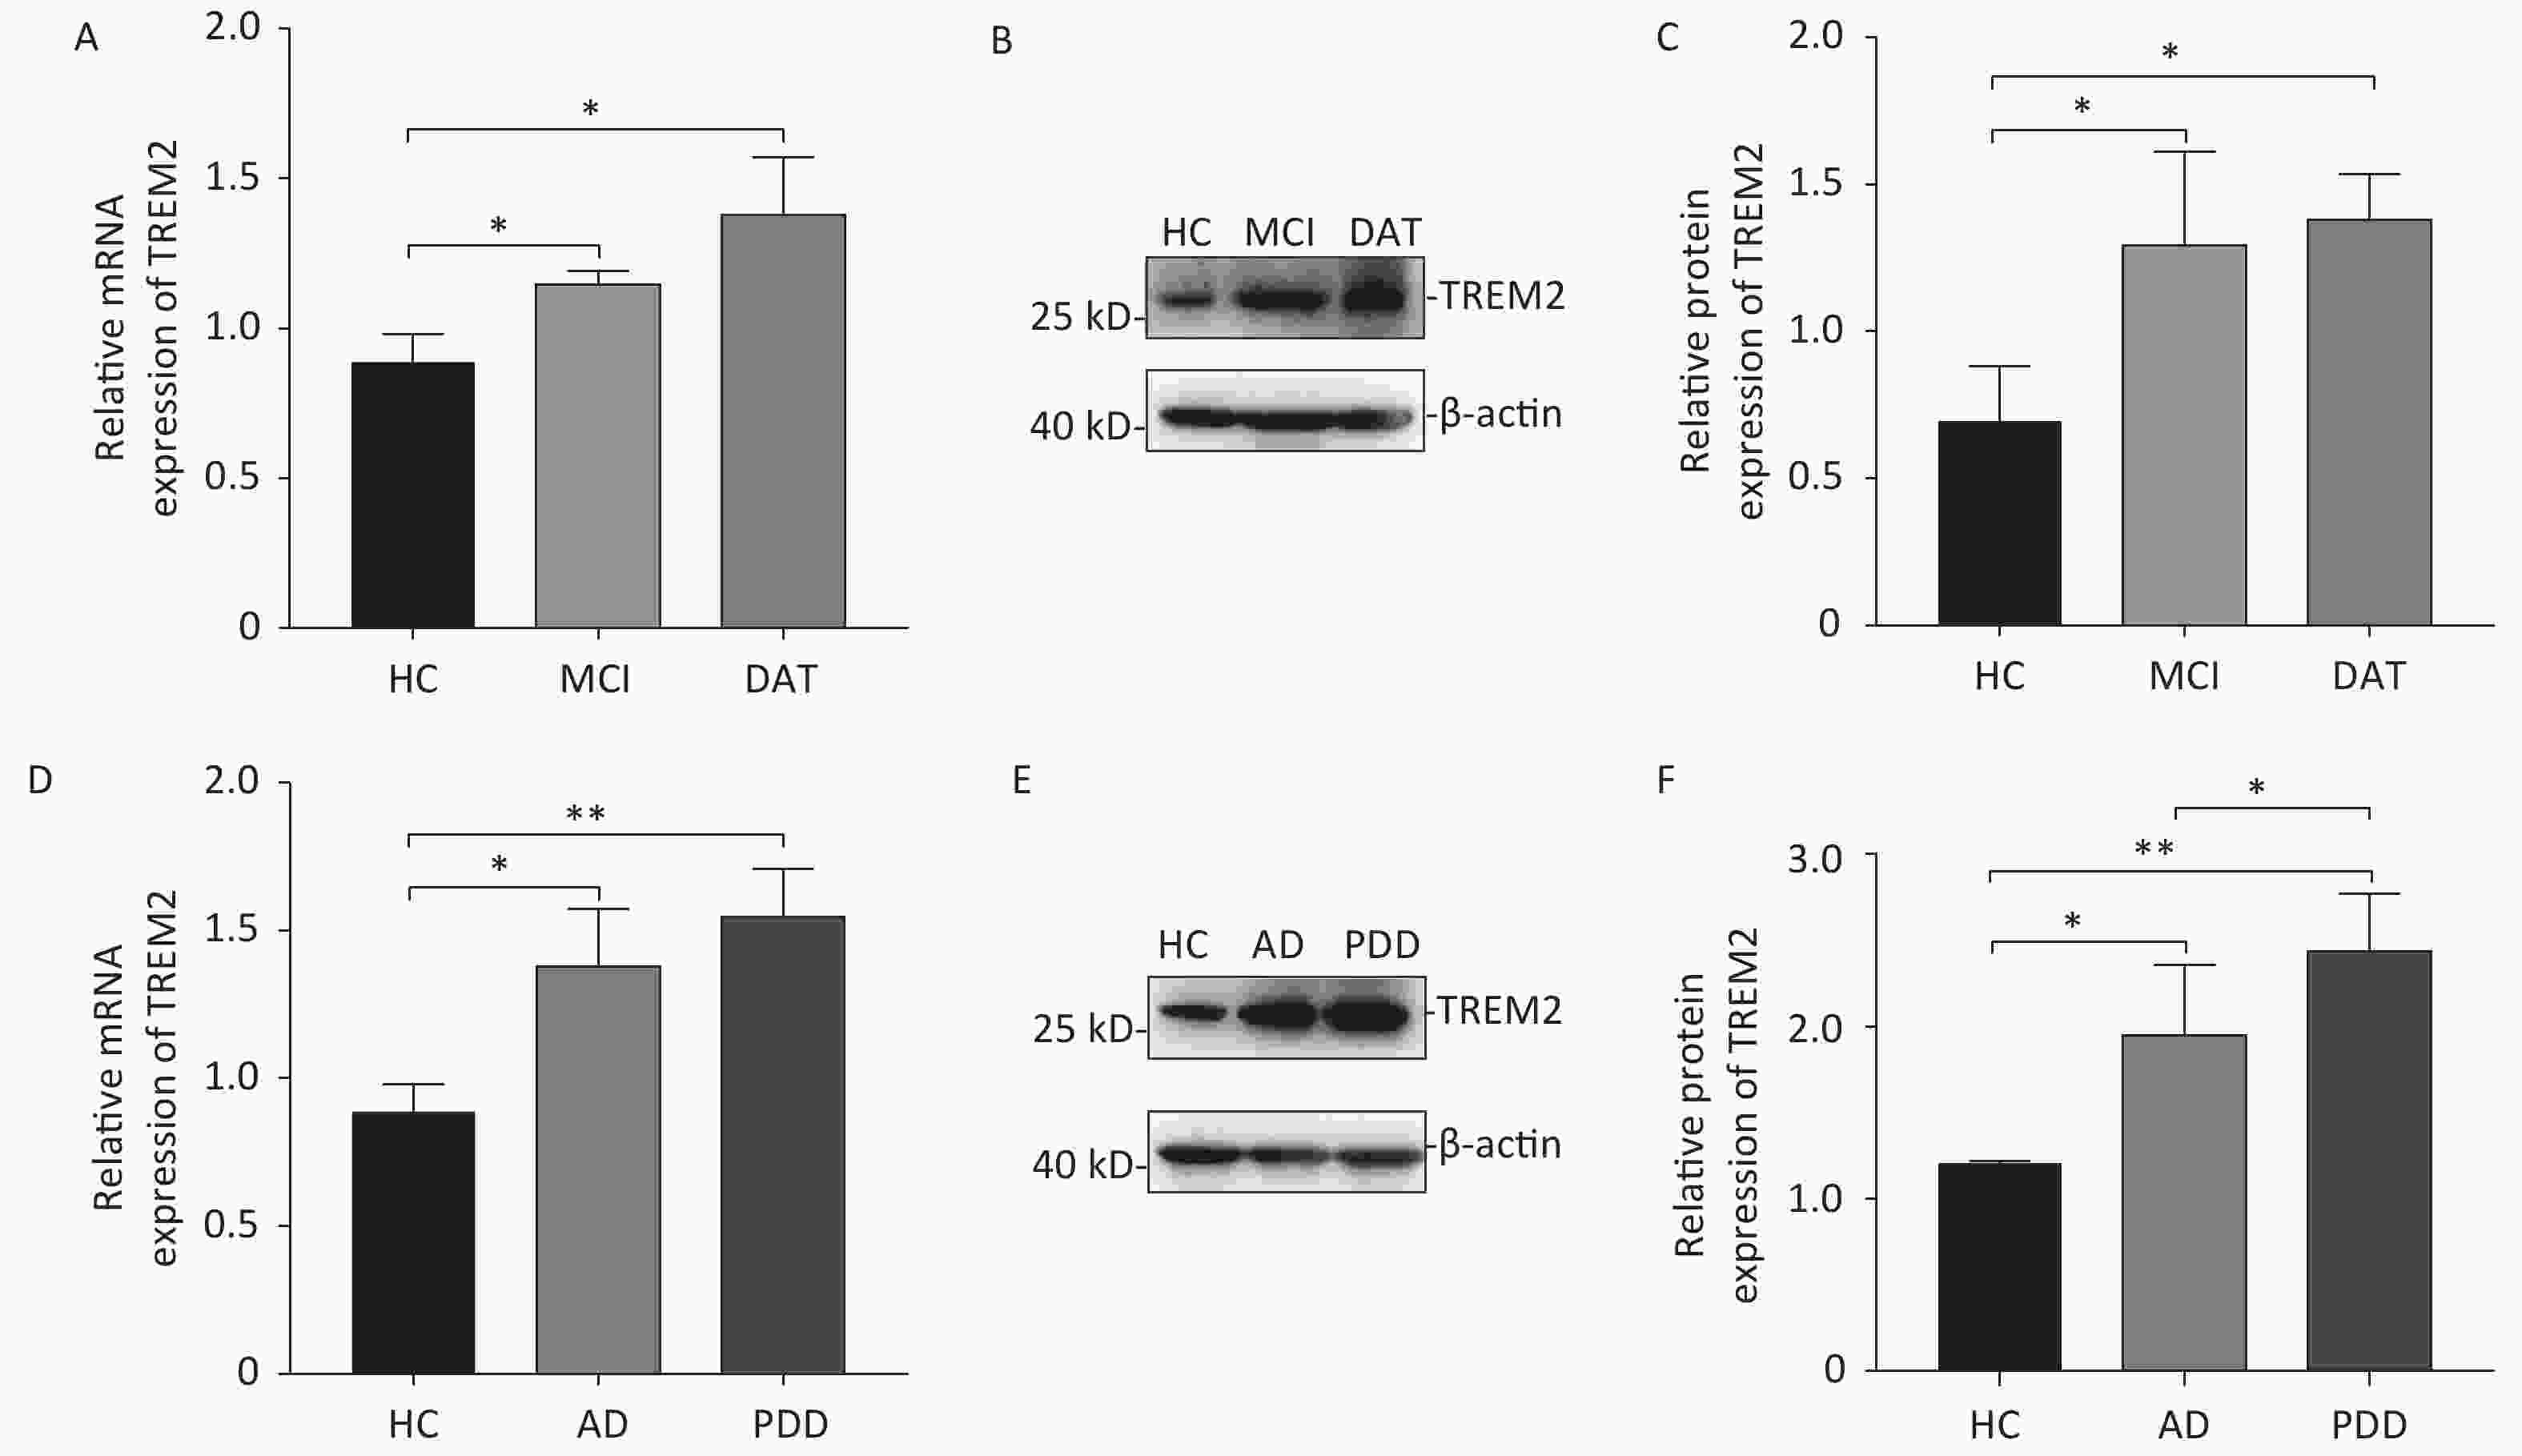
Figure 2. The mRNA and protein levels of TREM2 in the monocytes of different group subjects. (A) TREM2 mRNA levels in the monocytes of MCI and DAT patients compared with HC group. (B) TREM2 levels in the monocytes of HC, MCI and DAT subjects. (C) The relative TREM2 levels in the monocytes of HC, MCI, and DAT subjects. (D) TREM2 mRNA levels in the monocytes of AD and PDD patients compared with those of the HC group. (E) TREM2 levels in the monocytes of HC, AD, and PDD subjects. (F) The relative TREM2 levels in the monocytes of HC, AD, and PDD subjects. Data were analyzed using one-way ANOVA. Values represent mean ± SD, (*P < 0.05, **P < 0.01). HC: Health control; MCI: Mild cognitive impairment; DAT: dementia of Alzheimer type; PDD: Parkinson’s disease dementia.
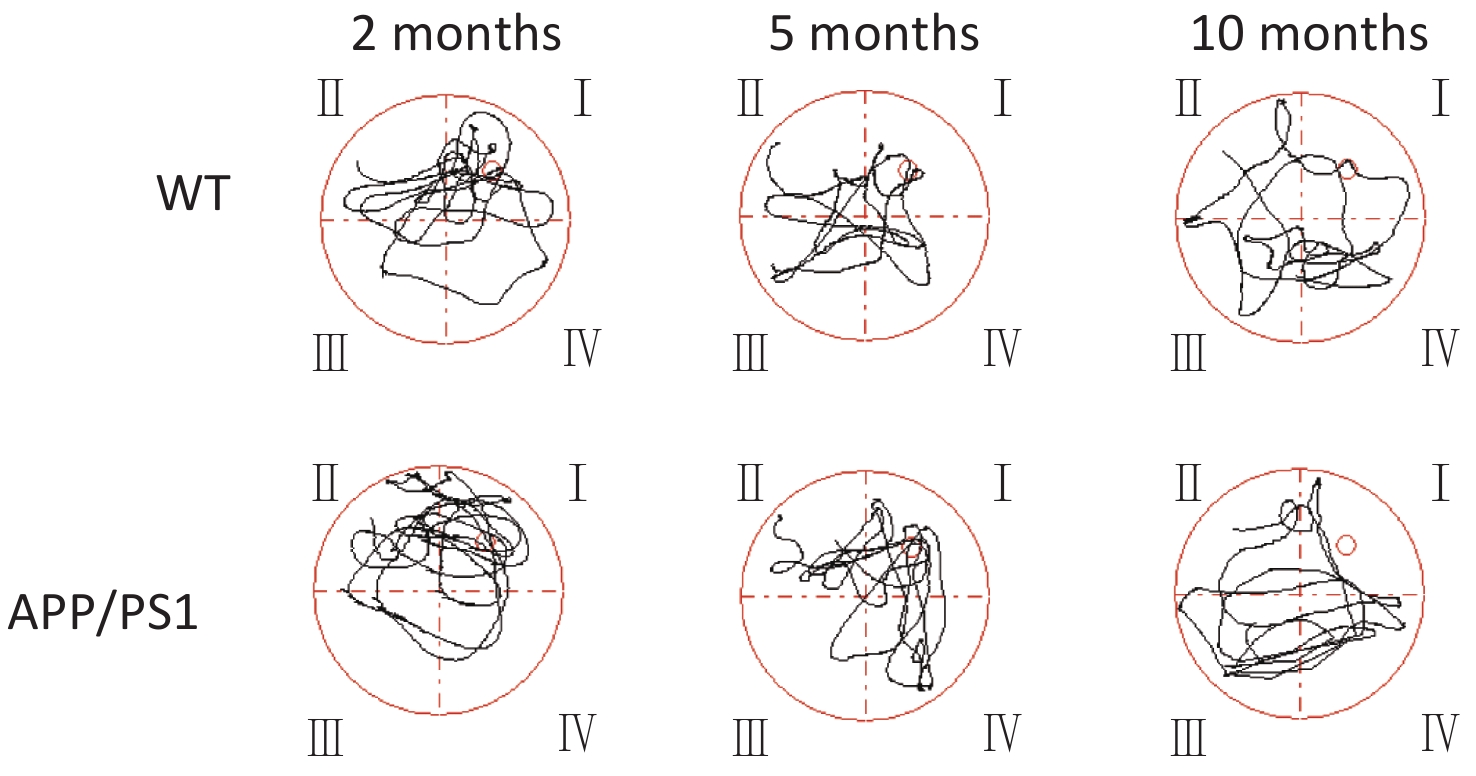
We further examined TREM2 expression levels in an AD mouse model and analyzed the correlation between cognition and the levels of sTREM2 in the mouse serum. We chose 2-, 5-, and 10-month-old AD mouse models (APPswe/PS1dE9 mice) and wild-type (WT) mice (C57BL/6J background; control group) to evaluate their spatial learning and memory ability using a Morris water maze (MWM) test. The representative swim traces for MWM tests are shown in Supplementary Figure S2, available in www.besjournal.com. According to the mean escape latencies (Figure 3A–C, G) and the time of across the platform (Figure 3D–F) during the training days, 10-month-old APP/PS1 mice had distinct cognitive deficiencies compared with age-matched WT mice. To examine the correlation between cognition and the levels of sTREM2, we measured TREM2 expression in the hippocampus and sTREM2 levels in the serum of different mouse groups. TREM2 levels increased both in the hippocampus and serum of the 5- and 10-month-old APP/PS1 mice compared with those in WT mice (Figure 3H, I). Moreover, sTREM2 levels in the serum showed a positive correlation with the escape latency of 10-month-old APP/PS1 and WT mice (Figure 3L). However, this correlation was not observed among the other groups of APP/PS1 and WT mice (Figure 3J, K). In addition, we analyzed the correlation between the expression levels of TREM2 in the hippocampus and sTREM2 concentration in the serum of each animal (n = 3 for each group) (Figure 3M). sTREM2 concentration was significantly positively correlated with the expression levels of TREM2 in the hippocampus. These results provide important evidence supporting the use of sTREM2 levels in the serum as the most easily available biomarker in human studies. Therefore, TREM2 expression is increased with aging in APP/PS1 mice and correlates with the progression of cognitive impairment of APP/PS1 mice.
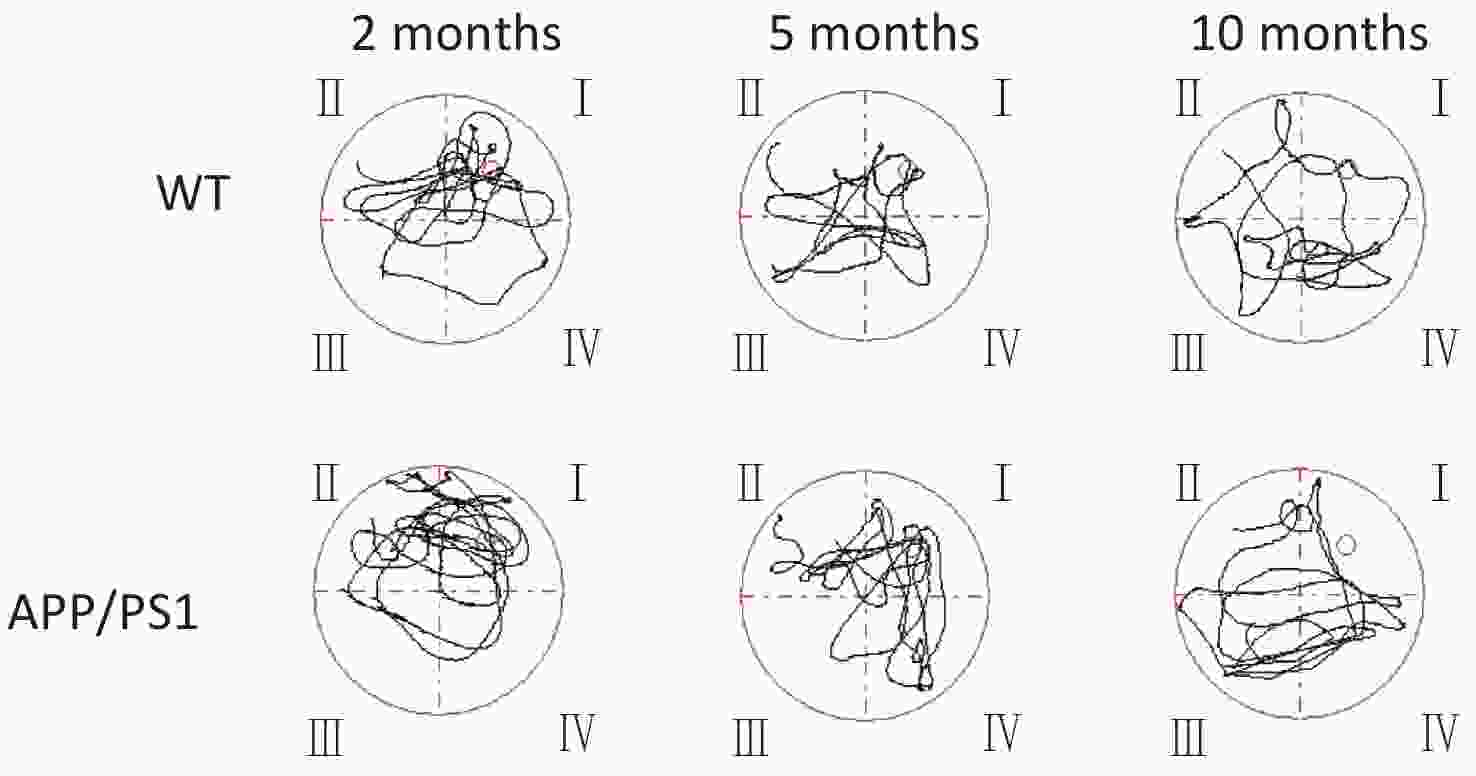
Figure S2. The representative swim traces for morris water maze (MWM) tests

Figure 3. Assessment spatial cognitive ability and TREM2 expression in the hippocampus and serum of different groups of APP/PS1 and WT mice. (A) The escape latency of APP/PS1 and WT mice at the age of 2 months (n = 6 for each group). (B) The escape latency of APP/PS1 and WT mice at the age of 5 months (n = 6 for each group). (C) The escape latency of APP/PS1 and WT mice at the age of 10 months (n = 6 for each group). (D) The time of across the platform of APP/PS1 and WT mice at the age of 2 months (n = 6 for each group). (E) The time of across the platform of APP/PS1 and WT mice at the age of 5 months (n = 6 for each group). (F) The time of across the platform of APP/PS1 and WT mice at the age of 10 months (n = 6 for each group). (G) Average escape latency of APP/PS1 and WT mice at different ages during the training days in the MWM test. (H) TREM2 levels in the hippocampus of 2-, 5-, and 10-month-old APP/PS1 and WT mice (n = 3 for each group). (I) sTREM2 levels in the serum of APP/PS1 and WT mice at different ages (n = 3 for each group). (J) Correlation between sTREM2 levels in the serum and cognitive ability in 2-month-old mice (R2 = 0.1318, P = 0.2461). (K) Correlation between TREM2 expression in the serum and cognitive ability in 5-month-old mice (R2 = 0.1158, P = 0.2790). (L) Correlation between TREM2 expression in the serum and cognitive ability in 10-month-old mice (R2 = 0.3811, P = 0.0325). (M) Correlation between TREM2 expression levels in the hippocampus and sTREM2 levels in the serum of mice. (R2 = 0.9064, P < 0.0001). The data in (A)–(G) and (I) were analyzed using one-way ANOVA. The data in (J)–(M) were analyzed using linear regression analysis. Values represent mean ± SD. *P < 0.05, **P < 0.01, ***P < 0.001, ****P < 0.0001.
Increasing evidence suggests that TREM2 plays a crucial role in AD pathogenesis. The APP/PS1 transgenic AD mouse model is widely used in the study of the pathogenesis and treatment of AD[7, 8]. We found that 10-month-old APP/PS1 mice showed significant cognitive impairment. Atrophy and neuronal inflammatory responses of the hippocampus and cortex are the typical features of AD[9]. In this study, we found that TREM2 expression was upregulated with aging and negatively correlated with cognitive ability.
Researchers have been working on identifying non-invasive AD biomarkers. CSF biomarkers (Aβ42, Aβ40, T-tau, and P-tau) and the mutations in APP, PSEN1, and PSEN2 genes have been included in the clinical diagnostic guidelines of AD. In recent years, several novel AD biomarkers have emerged, such as growth-associated protein 43 (GAP43), neurogranin, synaptotagmins, synaptosome-associated protein 25 (SNAP-25), neurofilament light protein (NFL), neuron-specific enolase (NSE), visinin-like protein 1 (VILIP-1), and YKL-40; but their role in AD pathology and their use as AD biomarkers have yet to be validated[10]. However, owing to the polymorphism of gene mutation sites and the traumatic nature of CSF collection, the clinical application of these biomarkers is limited. This study provides evidence that TREM2 can be used as a biomarker for the diagnosis of AD. First, we found that the serum concentration of TREM2 was slightly increased in the MCI group and significantly increased in the DAT group. Furthermore, sTREM2 was associated with the cognitive decline of AD patients. Moreover, according to ROC curve analysis, the sensitivity and specificity of sTREM2 levels could differentiate AD patients from HC subjects to some extent, suggesting that sTREM2 might act as a potential biomarker for AD. Second, the mRNA and protein levels of TREM2 were also found to be increased in the monocytes of AD patients. Finally, we found that sTREM2 concentration in the serum of APP/PS1 mice was negatively correlated with cognitive function in these mice. There is increasing evidence supporting a close link between TREM2 and AD. Our experimental results provide additional convincing data supporting this view.
Authors’ Contributions ZHANG Xiao Min and LIU Jing designed and performed the experiments, analyzed the data, and drafted the manuscript. CAO Min and YANG Ting Ting performed the experiments and statistical analysis. WANG Ya Qi, HOU Yu Li, SONG Qiao, and CUI Yu Ting performed the experiments and collected data and literature. WANG Pei Chang provided financial support, instructed manuscript format, and edited the final manuscript. All the authors contributed to revising the manuscript for intellectual content and approved the final version for publication.
HTML
 21095.pdf
|

|

 Quick Links
 DownLoad: