


-
Lead is a ubiquitous pollutant and Pb pollution is a global public health problem. Lead has been reported to induce multiple adverse effects, including reproductive toxicity, neurotoxicity, carcinogenicity, nephrotoxicity, immunotoxicity, and hypertension[1]. The traditional medical treatment available for Pb poisoning is chelation, which can save lives in individuals with very high blood Pb levels. The commonly used chelating agents include CaNa2EDTA and meso-2,3-dimercaptosuccinic acid. However, chelation therapy has strong short-term effects on the overall long-term management of Pb exposure.
Lycium barbarum (L. barbarum) is a famous traditional Chinese herbal medicine that nourishes the kidneys and liver, brightens eyes, reduces blood glucose and serum lipids, and has anti-aging, immuno-modulating, anticancer, and anti-fatigue effects[2]. Rhodopseudomonas palustris is a type of photosynthetic bacteria (PSB) that has various enzymes and active metabolites. It has physiological activities such as lipid regulation, antioxygenation, immunological competence, anti-tumor effects, and nontoxicity[3]. However, studies on the PSB-bioconverted extract of L. barbarum are few. Lycium barbarum polysaccharides have a Pb removal effect[4], and the culture solution of R. palustris can reduce the Pb content in the urine and blood of Pb-poisoned rats[5]. Thus, the R. palustris–bioconverted extract of L. barbarum may have a stronger Pb removal ability than either component alone. Simultaneously, the PSB-bioconverted extract of L. barbarum effectively eliminated the Pb content in the body tissues of Pb-poisoned mice and alleviated the symptoms of Pb poisoning. The results showed that, compared with the liquid-phase extraction of L. barbarum, the PSB-bioconverted extract of L. barbarum could effectively reduce the Pb content in the brain and liver of Pb-poisoned mice, and the consumption of L. barbarum was reduced. Compared with dimercaptosuccinic acid, the PSB-bioconverted extract of L. barbarum substantially reduced Pb content in the kidney and femur[6]. Therefore, we speculated that Rhodopseudomonas palustris bioconverting extract of Lycium barbarum (RPBL) may play a role in the prevention of lead acetate exposure (LAE). In our study, we used R. palustris to convert L. barbarum extract, and the experimental results indicated that RPBL is an effective mouse anti-Pb reagent[5].
1H-Nuclear magnetic resonance (1H-NMR) metabolomics has the potential to provide an efficient and unique assessment of organism health and aid in the identification of novel biomarkers. In the present study, a 1H-NMR-Orthogonal Partial Least Squares Discriminant Analysis (OPLS-DA)-based integrated metabolomic approach was adopted in conjunction with conventional clinical chemistry and histopathological examination to search for potential biomarkers in the plasma and urine of Sprague Dawley (S.D.) rats, determine the types of biomarkers, and evaluate the treatment effect of RPBL in rats with LAE.
Lycium barbarum (200 mg/mL, Guoyuan Chinese herbal medicine decoction pieces Co., Ltd., Mizhou City, China) was subjected to water extraction and 100 mL of the obtained extract activated with R. palustris (1 mL, Shanxi University, Taiyuan City, China) and the prepared medium was transferred to culture flasks. The culture flasks were placed under anaerobic conditions in the culture room with an illumination intensity of 2,500 Lux and temperature of 28 ± 2 °C. After 20 d of culture, RPBL was obtained.
Male S.D. rats (weighing 200 ± 20 g) were randomly divided into five group as follows: Control Group (CG) with drinking distilled water, Model Group (MG) treated with drinking distilled water containing lead (10 mg/mL, Beijing Boyuan Tailong Biotechnology Co., Ltd., Beijing, China), Positive medicine group treated with 2 mL Qizao oral solution (QZOS, Zhejiang Talison Pharmaceutical Co., Ltd., Zhejiang, China) based on the MG; High-dose group treated with 2 mL RPBL (H-RPBL) based on the MG; Low-dose group treated with 0.5 mL RPBL (L-RPBL) based on the MG. After 30 days, plasma samples of blood from different groups of mice were collected in heparin containers from Orbital venous blood sampling. And urine samples from each group of rats were collected into ice-cooled vessels containing 1% sodium azide overnight (from PM 9:00 to AM 9:00) on pre-day. Blood samples and urine were centrifuged at 2,800 ×g (Shanghai Luxiangyi Centrifuge Instrument Co., Ltd., Shanghai, China) for 10 min at 4 °C. All the samples were stored at -80 °C (Panasonic Electric China Co., Ltd., Dalian, China) until analysis.
After thawing at 4 °C, 450 μL of plasma was mixed with 350 μL of D2O and then centrifuged at 12,000 ×g (Shanghai Luxiangyi Centrifuge Instrument Co., Ltd.) for 20 min at 4 °C. The obtained supernatant (600 μL) was used to perform NMR analysis. Clinical chemistry analysis of the serum samples was carried out using a Hitachi 7020 Automatic Analyzer (Hitachi 7020 Automatic Analysis, Tokyo, Japan) with the appropriate kits. The following parameters were tested: alanine aminotransferase (ALT), aspartate aminotransferase (AST), alkaline phosphatase (ALP), and blood urea nitrogen (BUN). The data were expressed as the mean ± SD. Significant differences between the CG, MG, QZOS, H-RPBL, and L-RPBL groups were determined at a significance level of P < 0.05 using an independent-sample t-test in SPSS version 16.0.
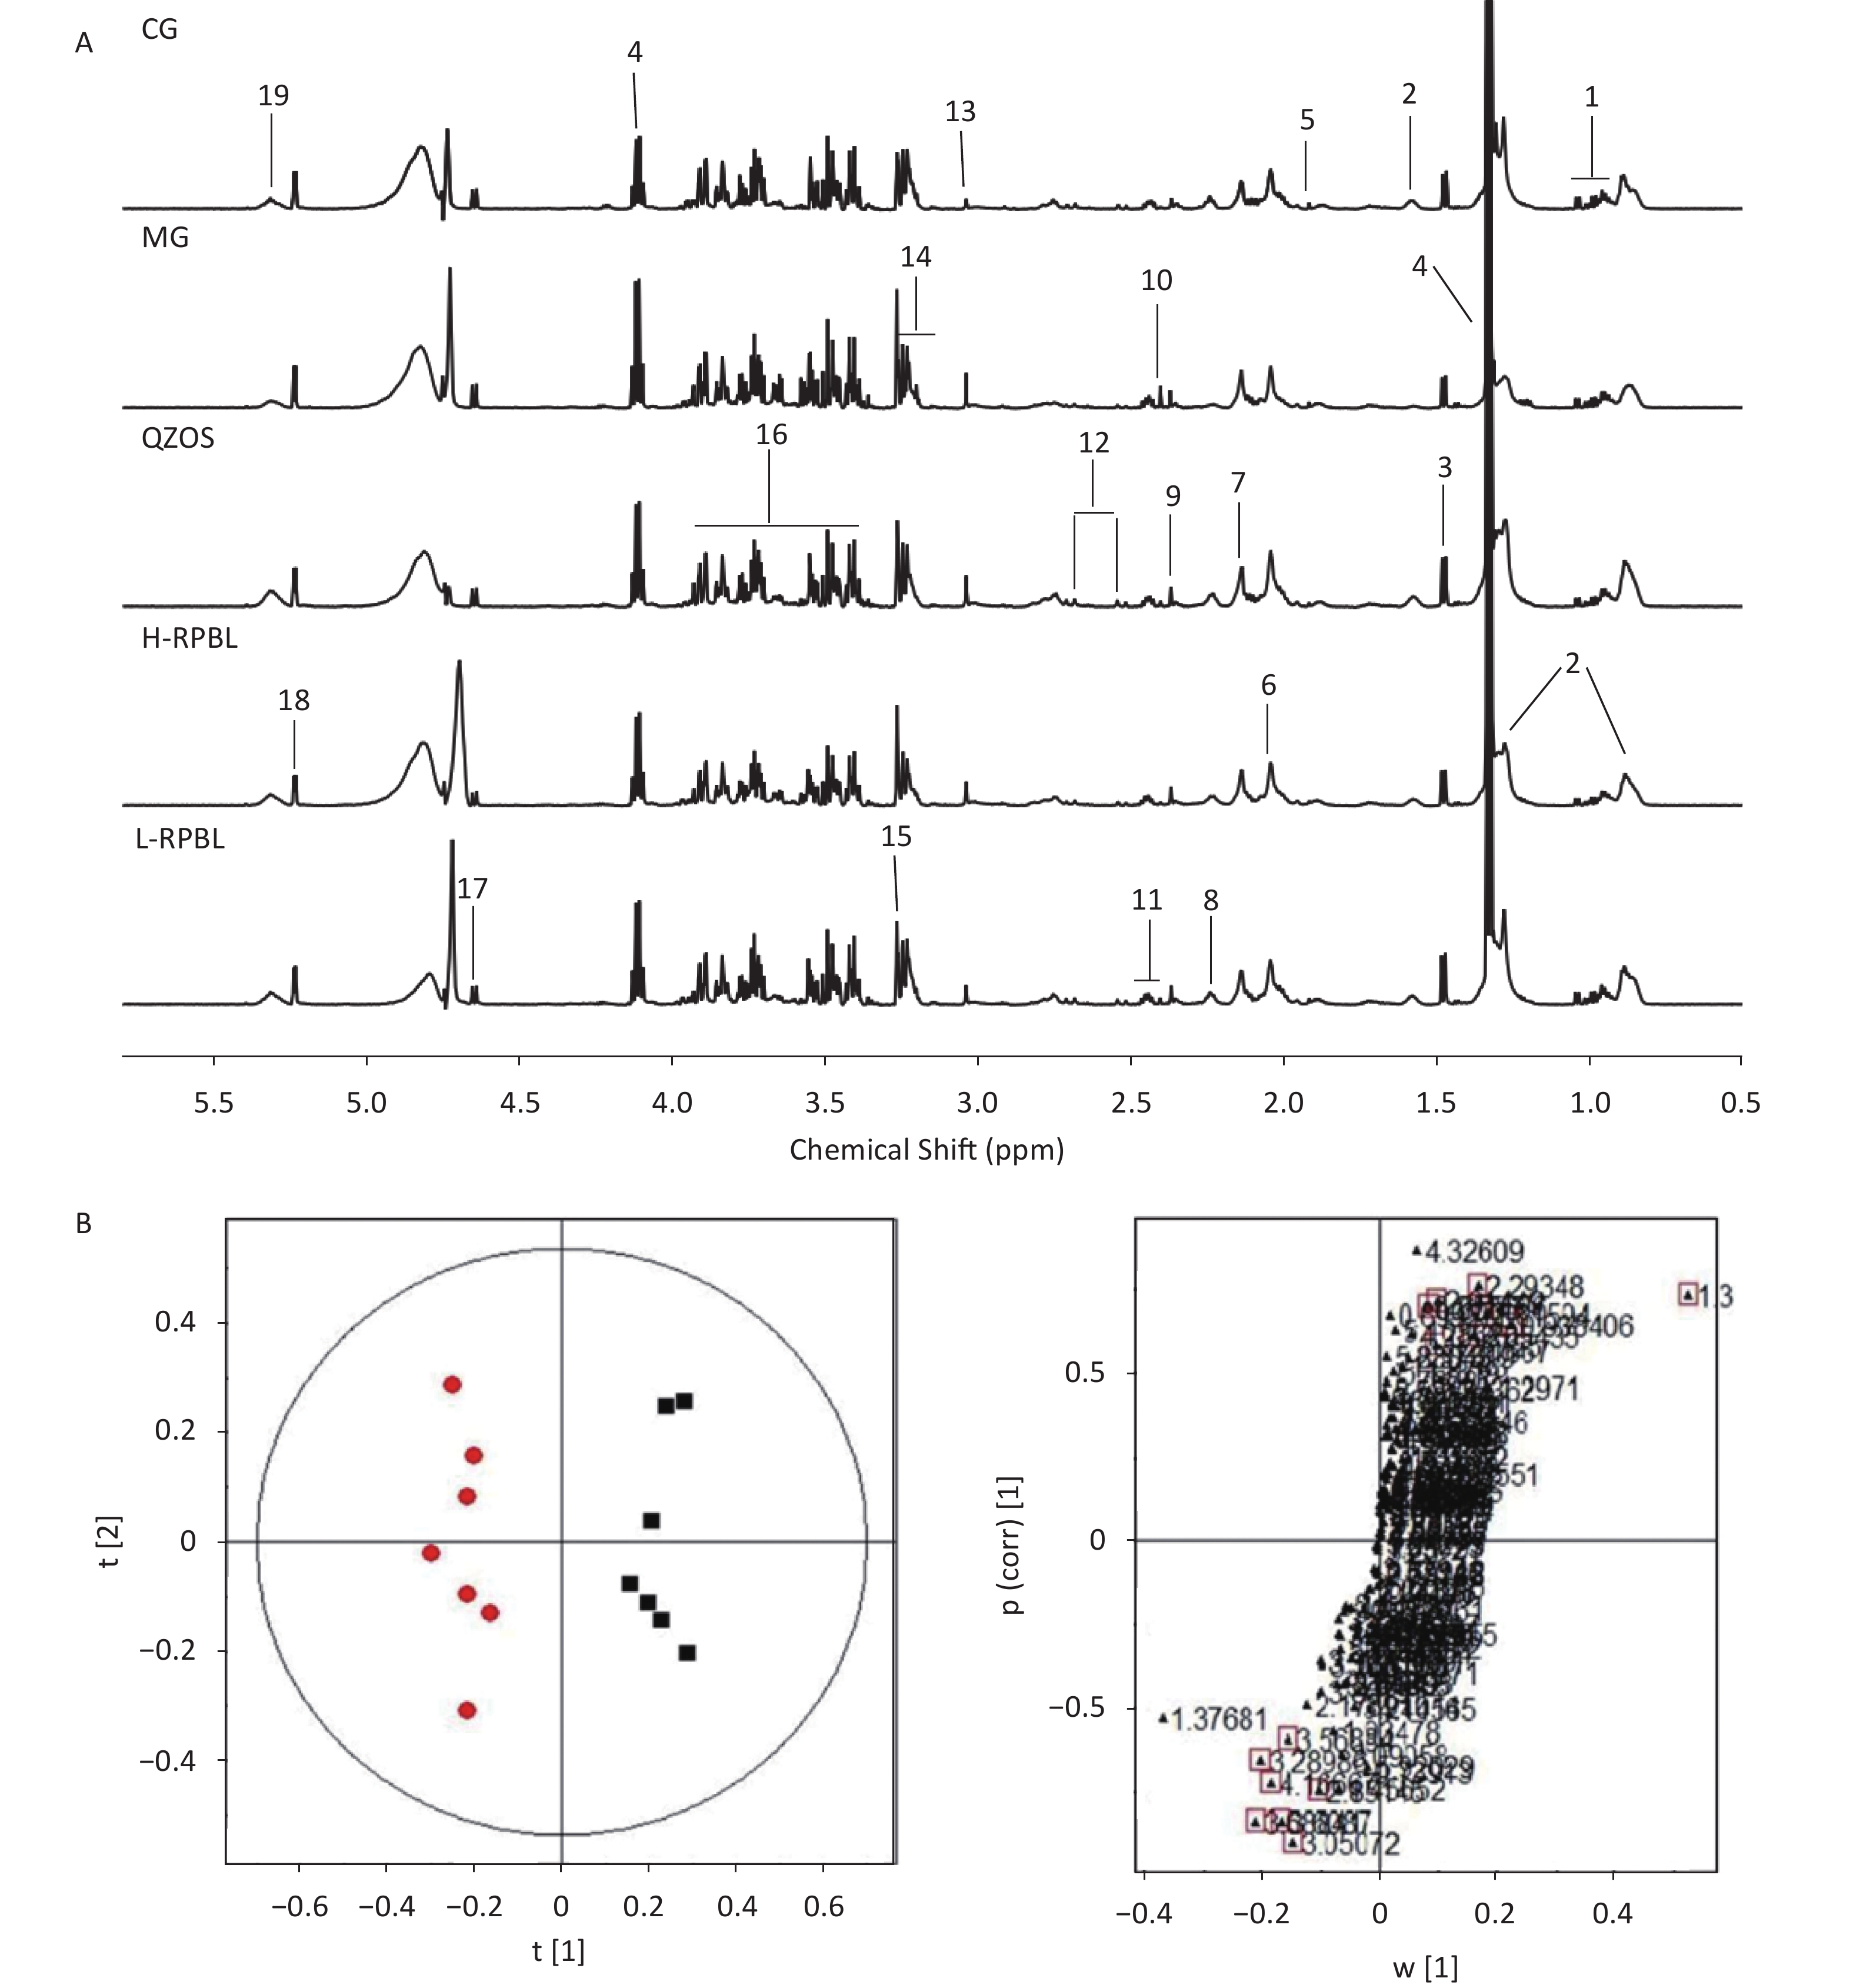
All integral data were imported into SIMCA-P (version 12.00; Umetrics, Umeå, Sweden) for multiple statistical analyses. Both Principal Components Analysis (PCA) and Partial Least Squares-Discriiminate Analysis (PLS-DA) are often used because of their ability to handle highly multivariate, noisy, collinear, and possibly incomplete data. Typically, OPLS-DA is built to identify individual differences and potential biomarkers that can reflect the differences between control and model groups. Typical 1H-NMR Carr-Purcell-Meiboom-Gill (CPMG) spectra of plasma samples from different groups are shown in Supplementary Figure S1A (available in www.besjournal.com), from which 19 endogenous metabolites were identified based on the literature. The plot of OPLS-DA scores obtained from the plasma NMR data showed a considerable separation between the CG and MG (R2X = 0.87, R2Y = 0.969, Q2 = 0.792). As shown in Supplementary Figure 1B, the metabolic profiles of the CG and MG could be completely separated along the t(1) axis, and different individuals in the groups were clustered, indicating that the serum metabolism of rats had substantialiy, changed after ad libitum consumption of lead acetate aqueous solution. Therefore, using OPLS data, serum samples from rats can be analyzed to obtain accurate identification of differentiated metabolites between groups.
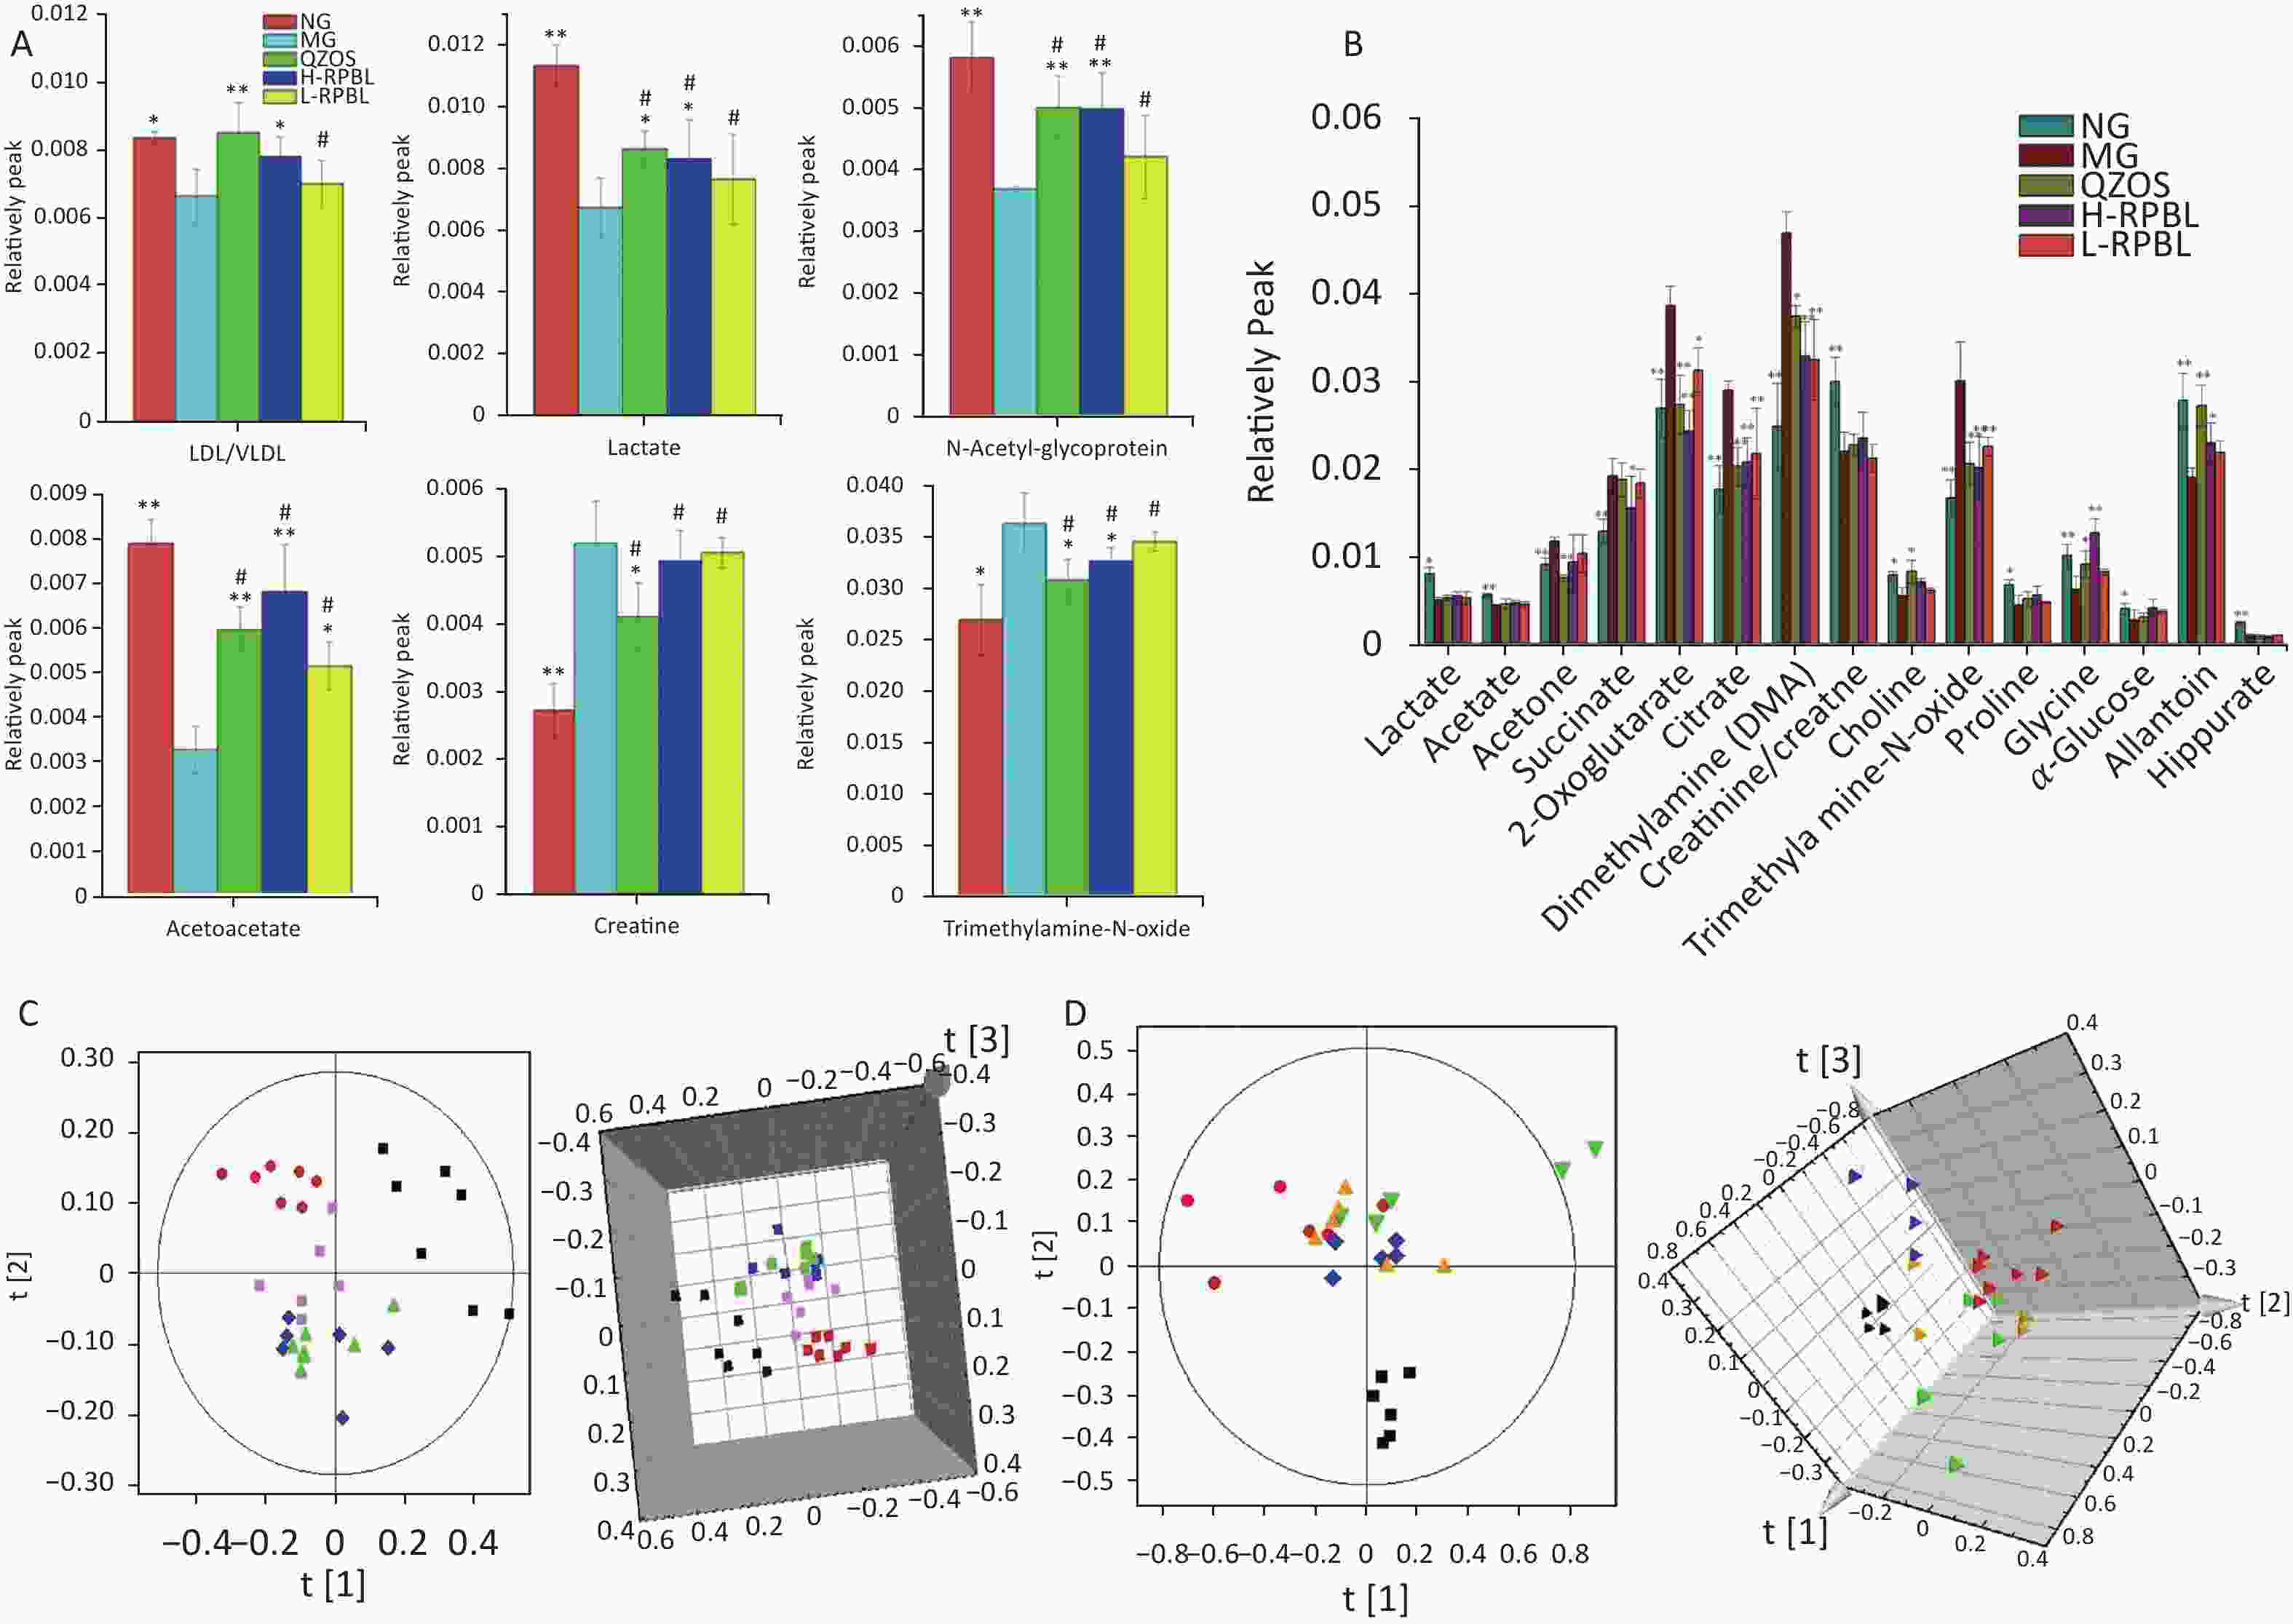
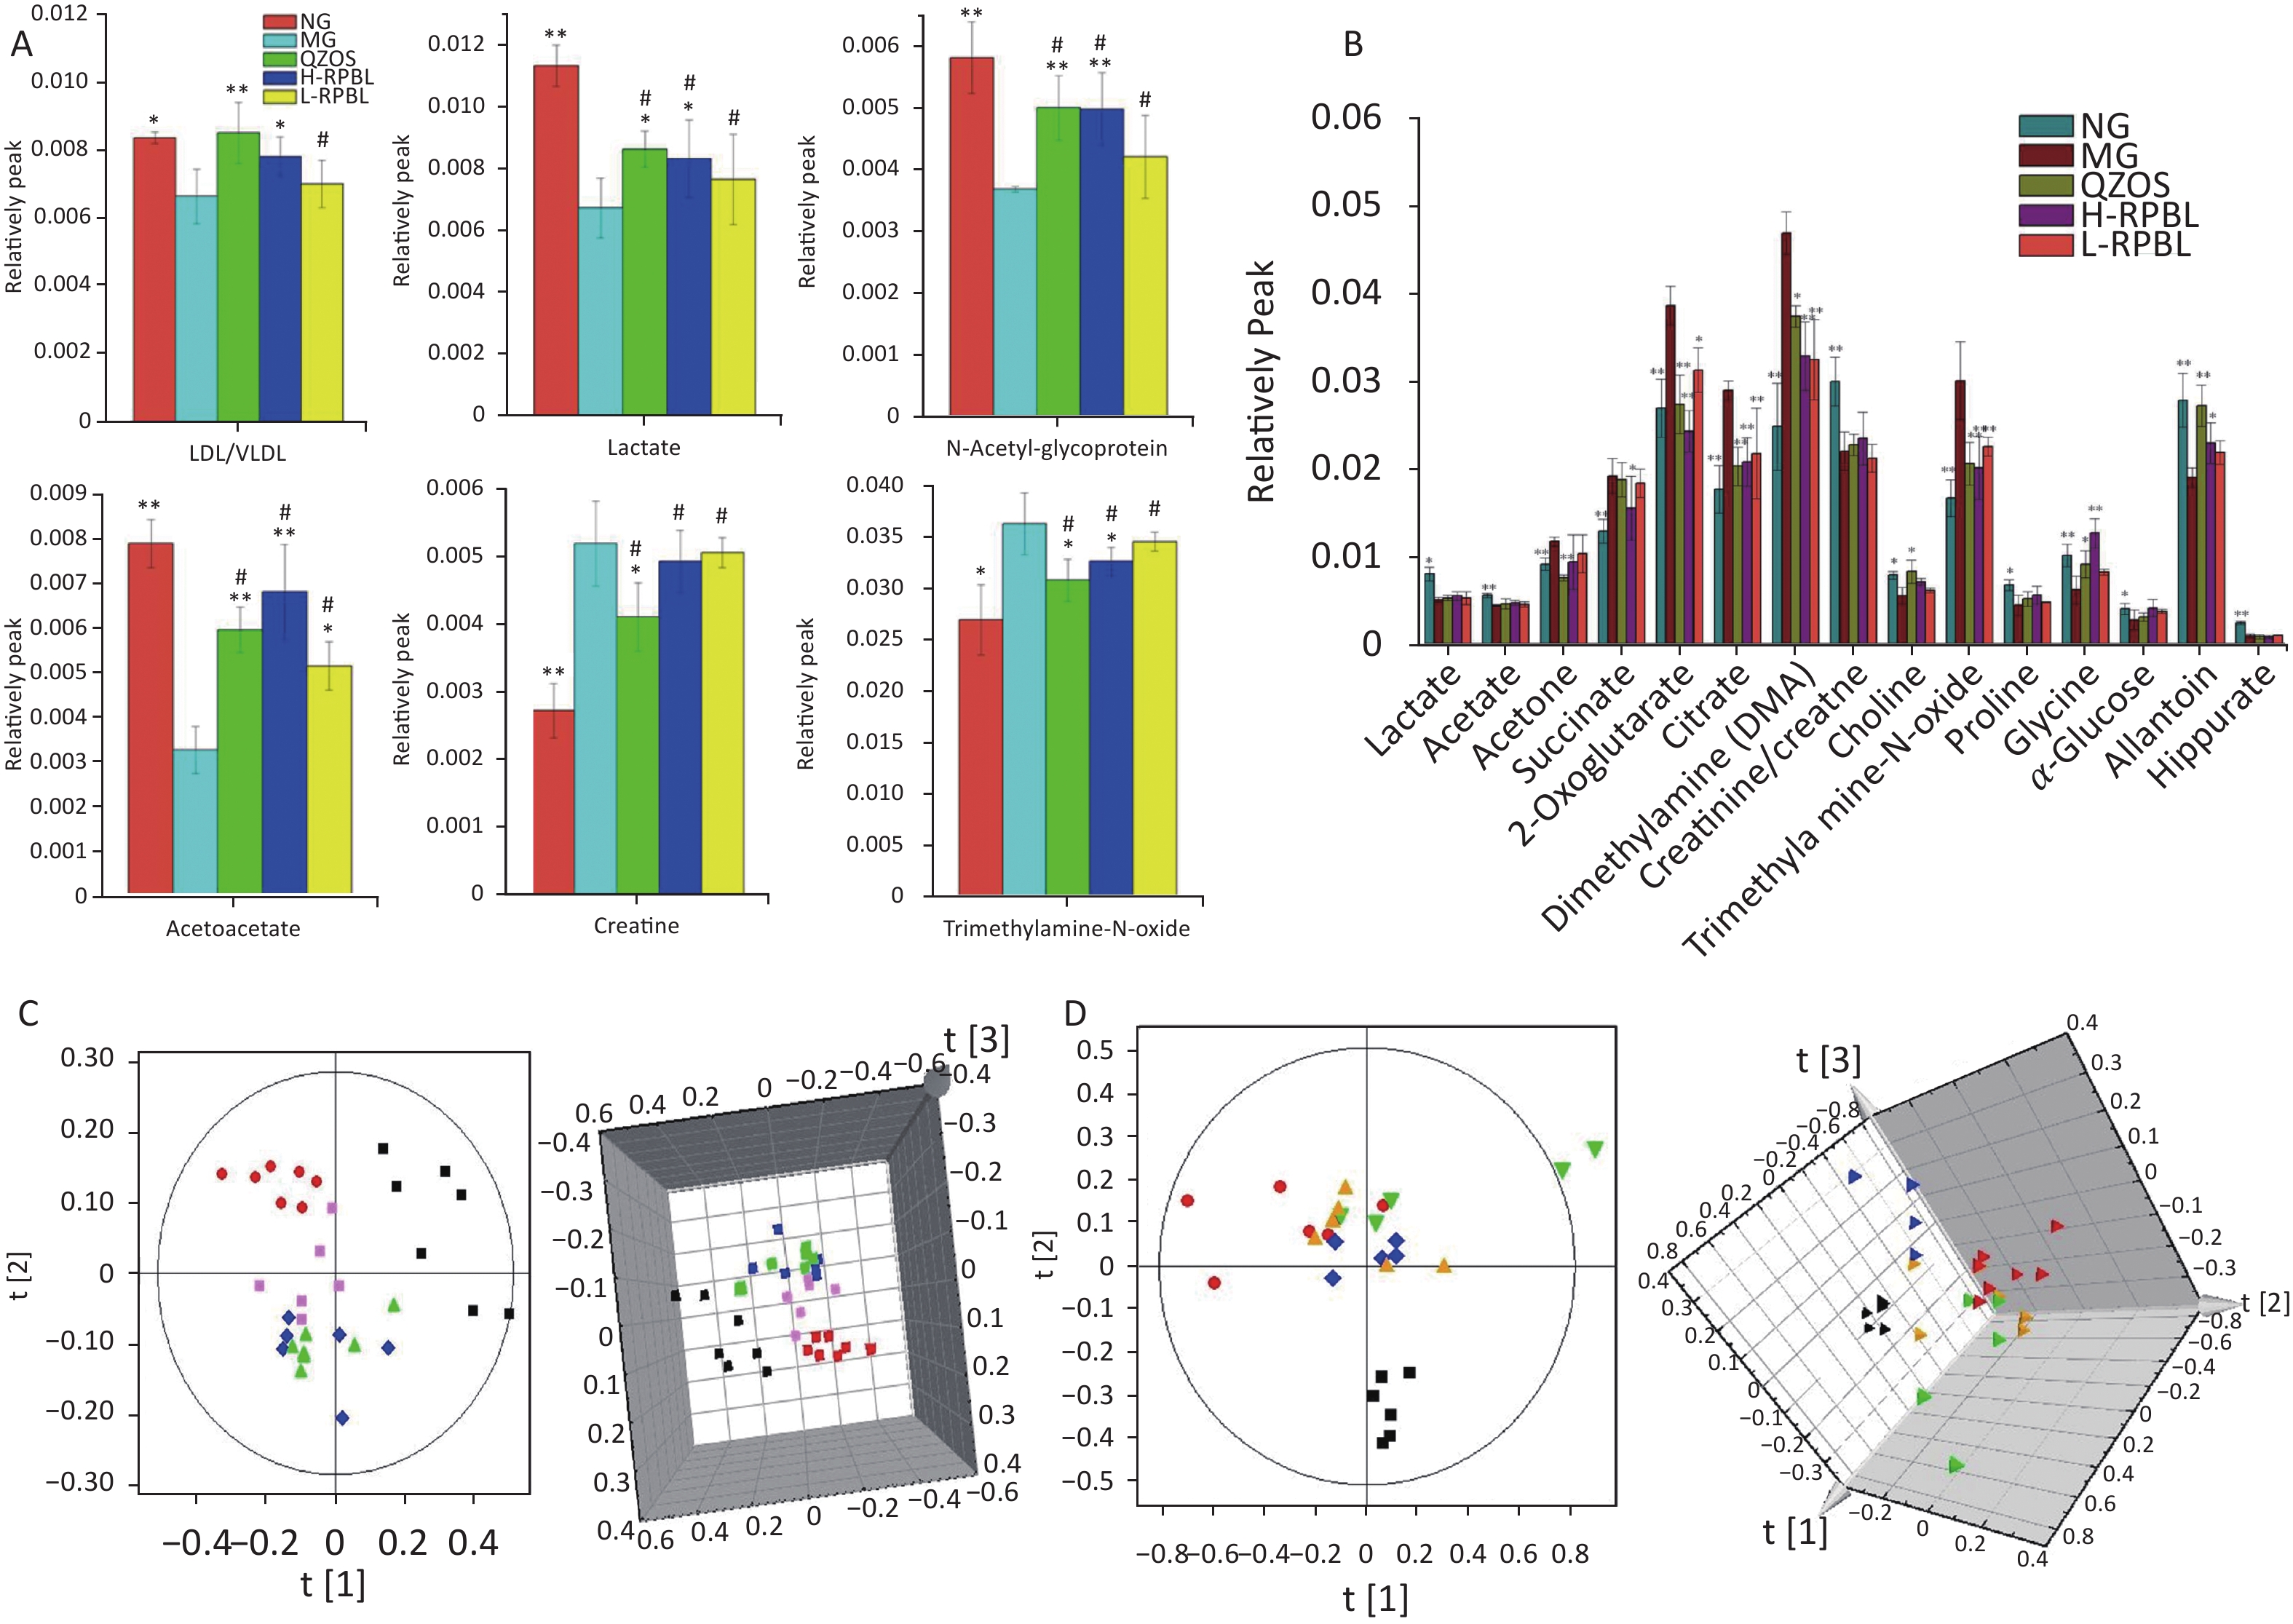
Figure 1. Changes in the relative intensity of target metabolites identified by NMR, and trajectory analysis of plasma and urine PCA score plots for the lead poisoning after RPBL and QZOS treatment.
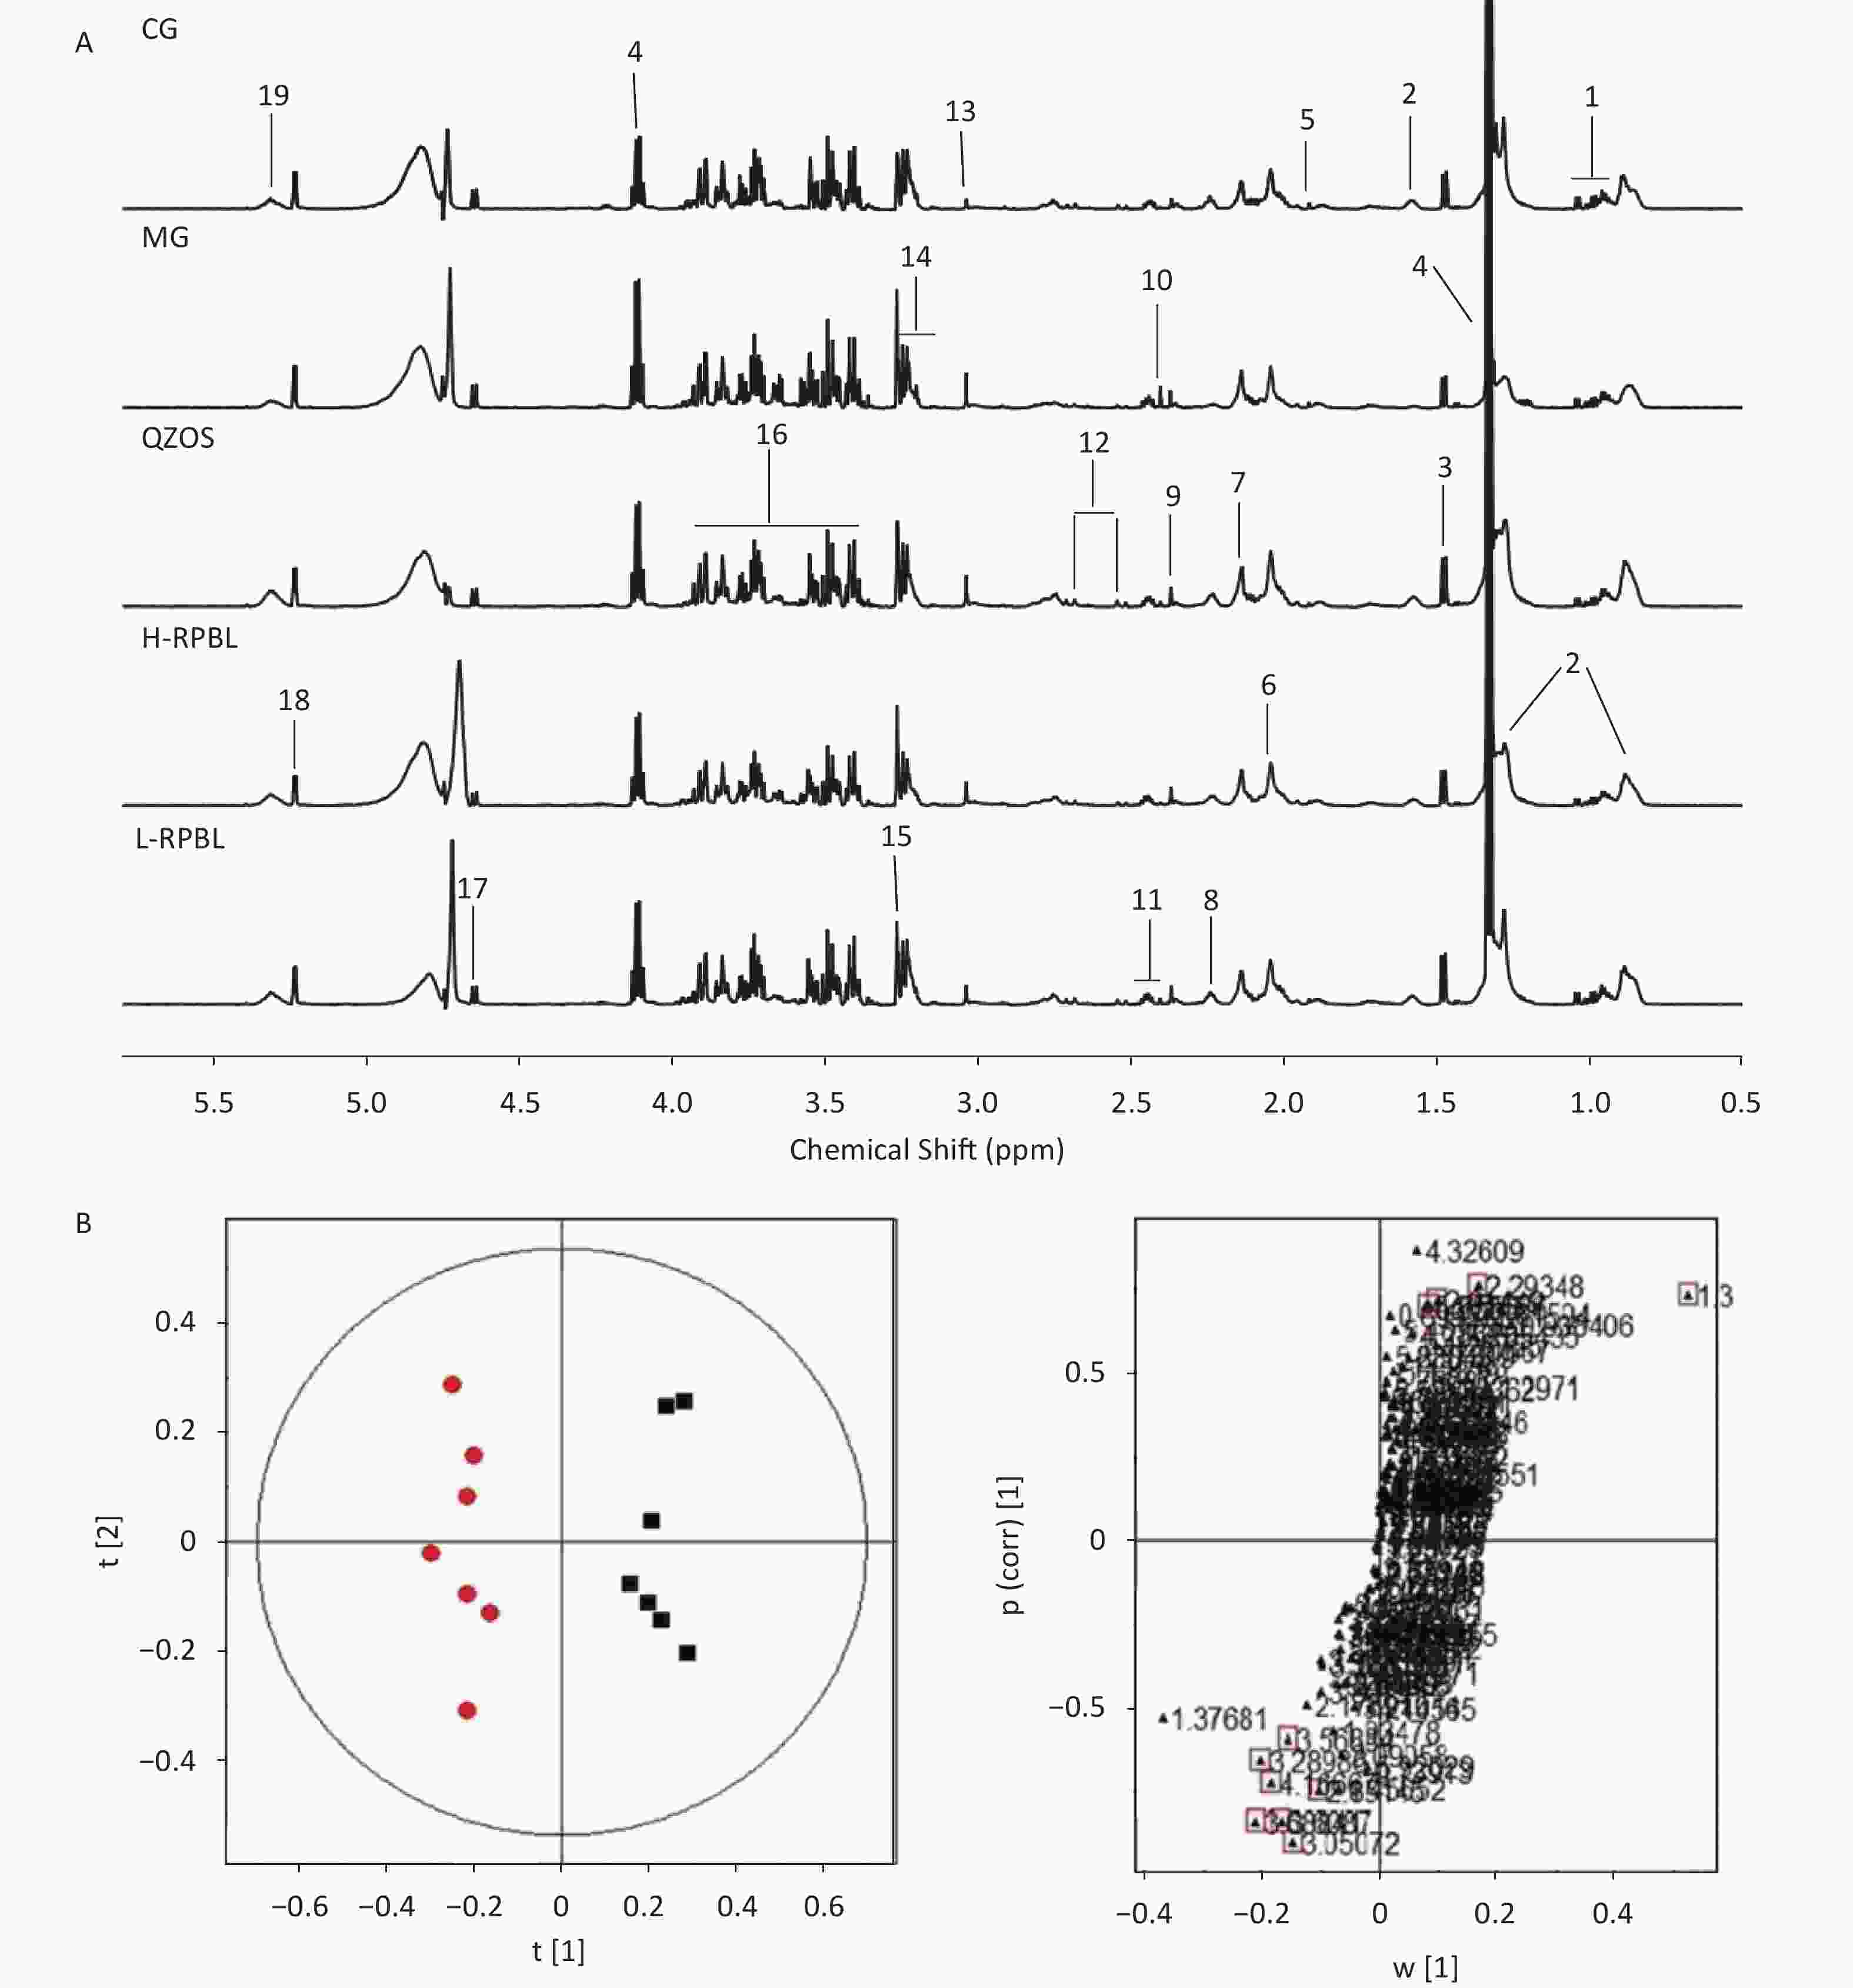
Figure S1. (A) Typical 1H-NMR CPMG spectra of plasma from five groups, CG; MG; QZOS; H-RPBL and L-RPBL. Main metabolites,1. Isoleucine/Leucine/Valine; 2. LDL/VLDL; 3. Alanine; 4. Lactate; 5. Acetate; 6. N-Acetyl-glycoprotein; 7. O-acetyl-glycoprotein; 8. Acetoacetate; 9. Pyruvate; 10. Succinate; 11. Glutamine/glutamate; 12. Citrate; 13. Creatine; 14. Choline; 15. Trimethylamine-N-oxide; 16. Glucose and amino acid; 17. β-Glucose; 18. α-Glucose; and 19. Unsaturated lipids. (B) OPLS-DA score plots in the left and corresponding loading plots in the right generated from the OPLS-DA of the NMR data derived from the plasma samples of rats. R2X = 0.87, R2Y = 0.969, Q2 = 0.792. CG (■) and MG (●). Combining the results of the OPLS-DA analysis with S-plots value plots and the P-values from the t-test (P < 0.05), six metabolites were identified as hypothetical biomarkers for distinguishing between the MG and CG[7], among which LDL/VLDL, lactate, N-Acetyl-glycoprotein (NAC) and acetoacetate were decreased, by contrary, creatine and trimethylamine-N-oxide (TMAO) were increased in the MG group than in the CG (Supplementary Table S1) to the independent-sample t-tests, we found that the peak areas of metabolites could be reversed after taking the RPBL (Figure 1A). It shows that after taking RPBL, the concentrations of the four metabolites (LDL/VLDL, lactate, NAC, acetoacetate) had up-regulated (P < 0.05, 0.01), while the two metabolites (creatine and TMAO) showed to down-regulated (P < 0.05, 0.01), which come back from the MG to the CG.
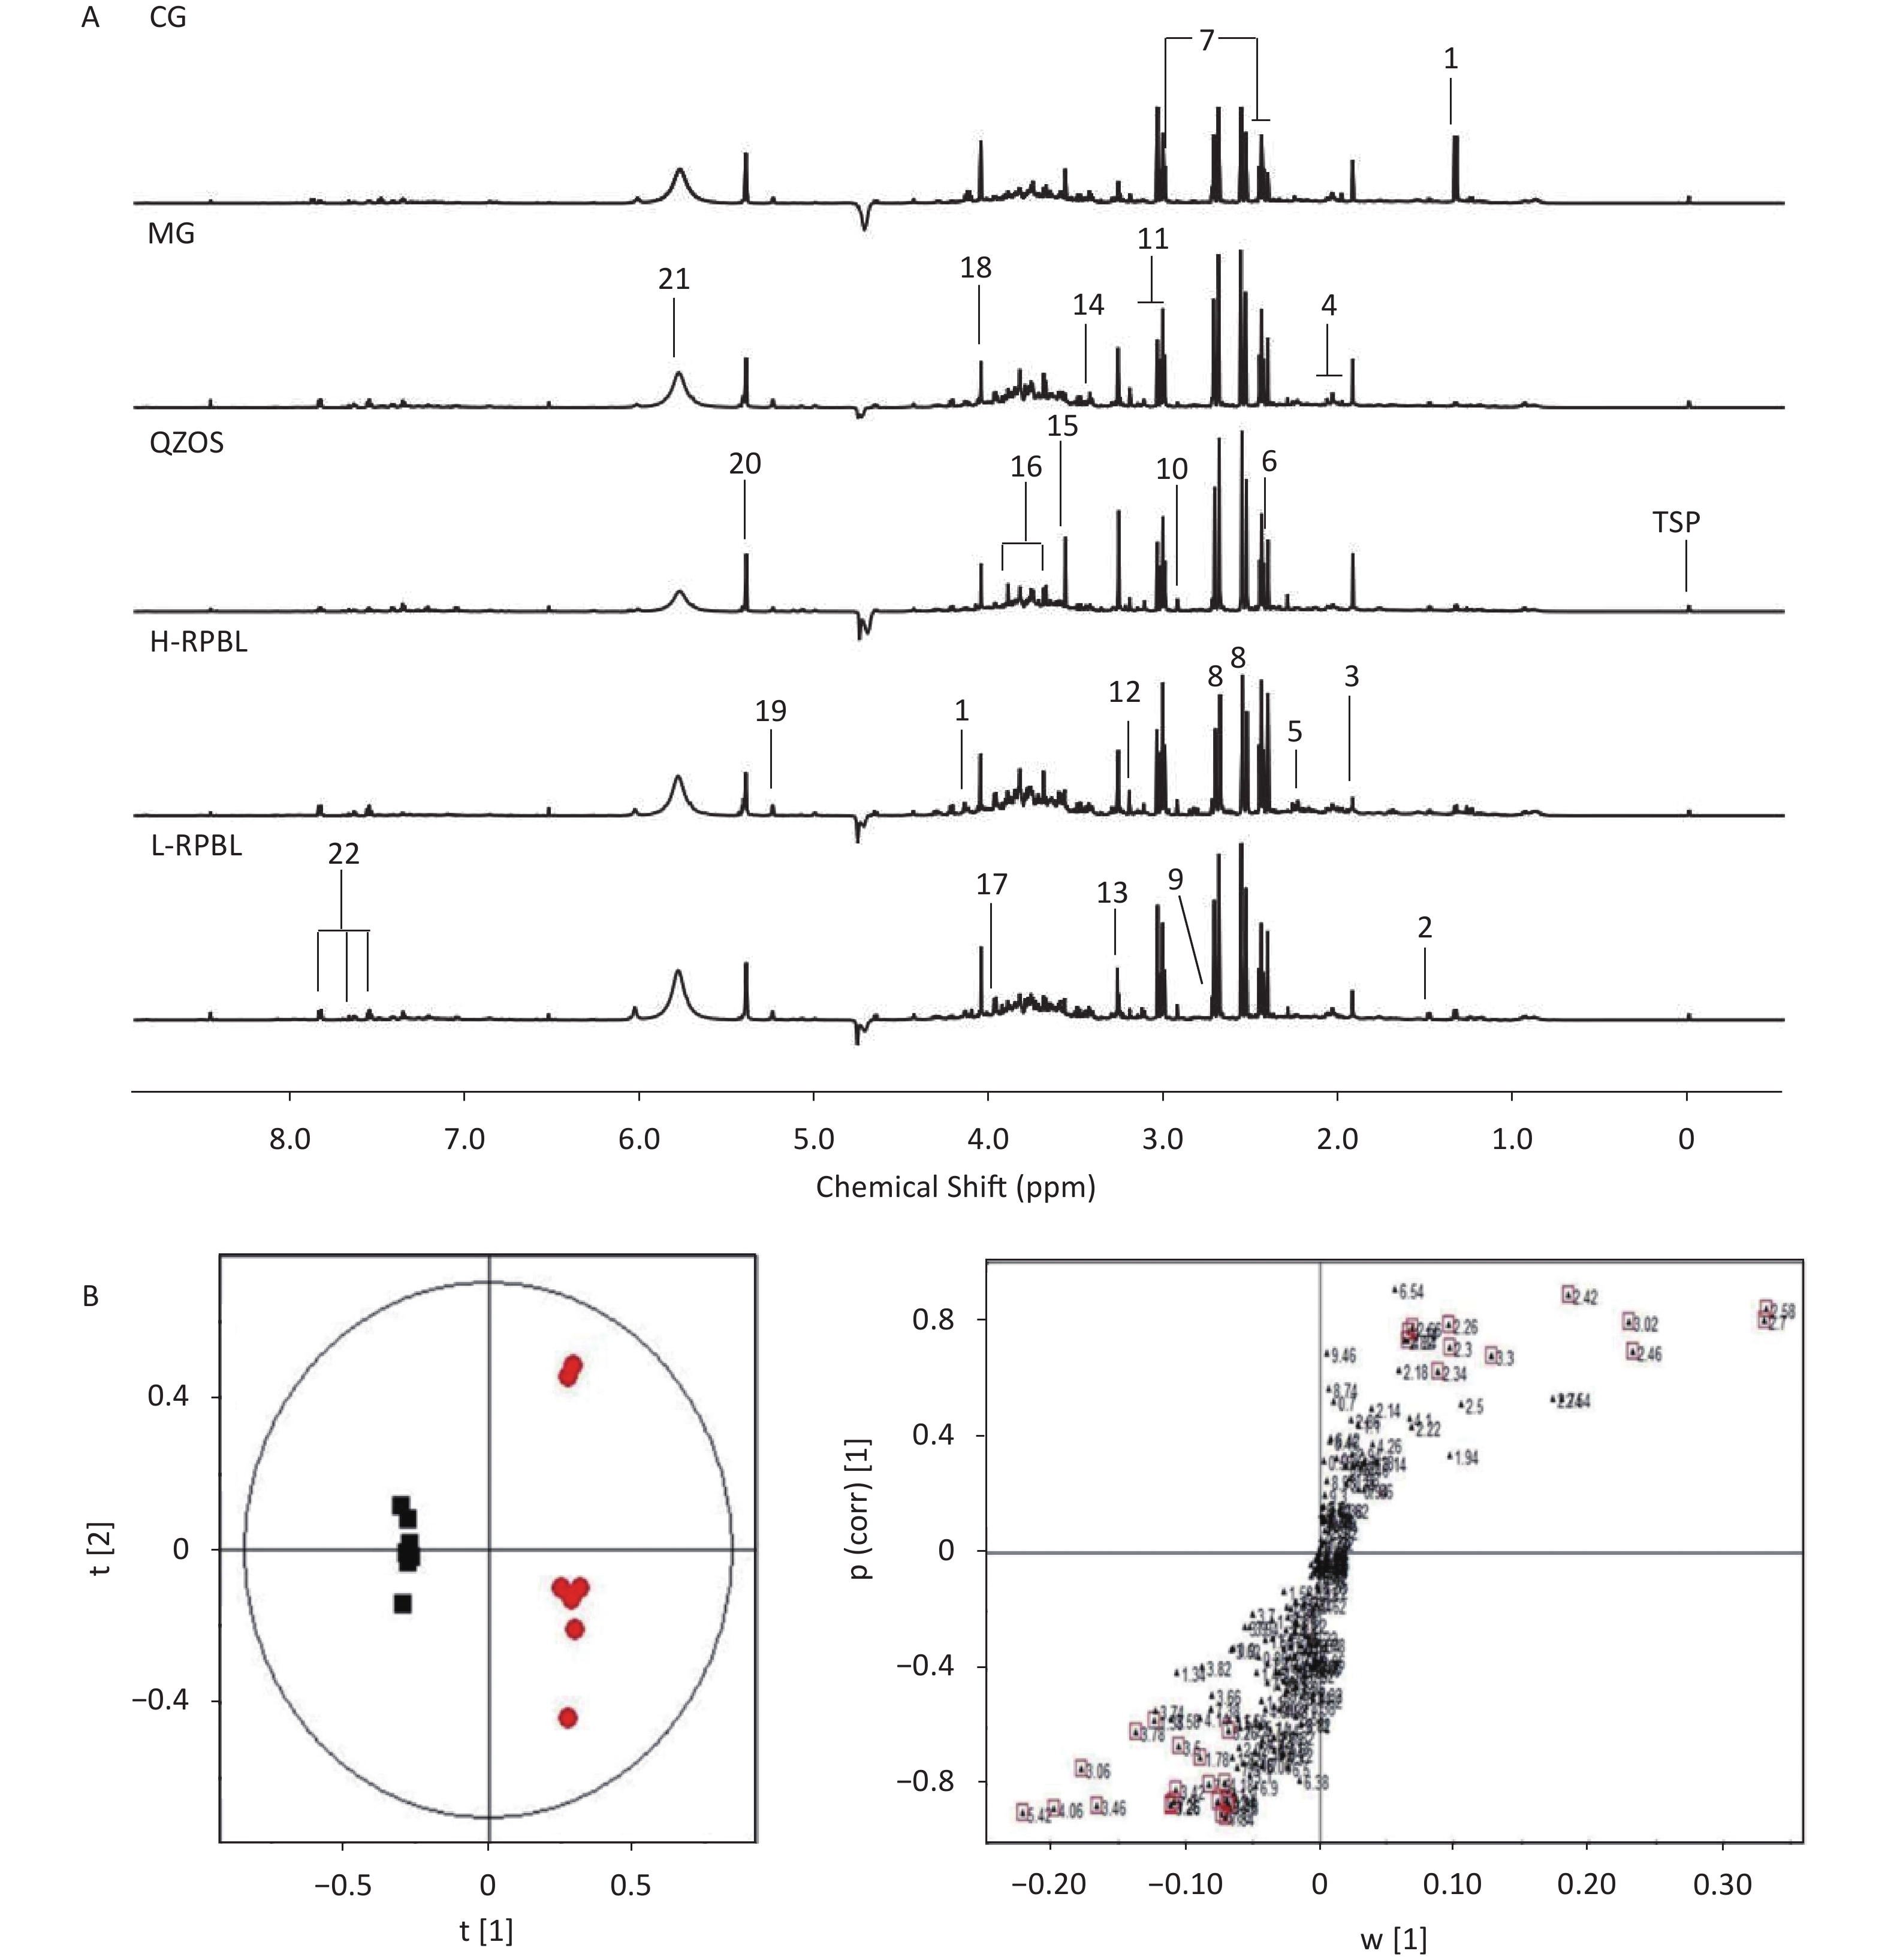
Aliquots (500 μL) of each urine sample was diluted with 50 μL of phosphate buffer containing D2O as a field lock and 0.1% sodium 3-trimethylsilyl-(2,2,3,3-2H4)-1-propionate as a chemical shift reference and centrifuged at 13,000 ×g for 20 min. An aliquot of 500 μL was transferred into a 5 mm NMR tube for NMR analysis. Typical 1H-NMR nuclear overhauser enhancement spectroscopy (NOESY) spectra of urine samples from the different groups are shown in Supplementary Figure S2A (available in www.besjournal.com). Twenty-two endogenous metabolites were identified according to published reports and are marked in the spectra. In this study, a multivariate analysis technique was used to visualize and detect subtle changes. An OPLS-DA of urine sample NMR data was performed to extract the metabolites that showed considerable changes. The analysis of OPLS-DA data is shown in Supplementary Figure S2B, where the metabolic profiles of the CG and MG can be completely separated along the t(1) axis, and different individuals in the groups were clustered, indicating that the urine metabolism of rats had substantially, changed after ad libitum consumption of the 1% lead acetate aqueous solution. The OPLS-DA score plots demonstrated a clear separation between the CG and MG, with a high explanation rate (R2X = 0.833) and a high prediction rate (Q2 = 0.946), suggesting that the model was reliable. Therefore, using OPLS-DA data, serum samples from rats can be analyzed to obtain accurate identification of differentiated metabolites between groups. Metabolites that were substantially, different between the CG and MG were selected from the S-plot. The purpose of the S-plot, combined with covariance and correlation information, is to select potential biochemically interesting compounds[7]. According to the protocol detailed above, 15 endogenous metabolites contributing to the separation of the MG and CG were detected in the urine samples (Supplementary Table S1, available in www.besjournal.com). Compared with the CG, MG treatment resulted in a substantial, increase in acetone, succinate, 2-oxoglutarate, citrate, dimethylamine and trimethylamine-N-oxide, whereas decreased the levels of lactate, acetate, creatinine/creatine, choline, proline, glycine, α-glucose, allantoin and hippurate. The administration of RPBL reversed the effects of MG treatment and metabolite levels were accordingly up- or down-regulated and restored to those of the CG. The relative peak area intensities of metabolites after RPBL administration is illustrated in Figure 1B. The metabolites lactate, acetate, creatinine/creatine, choline, proline, glycine, α-glucose, allantoin and hippurate were upregulated come back from the MG to the CG (P < 0.05), whereas the metabolites acetone, succinate, 2-oxoglutarate, citrate, dimethylamine, and trimethylamine-N-oxide were down-regulated (P < 0.05).

Figure S2. (A) Typical 1H-NMR NOESY spectra of urine from five groups, CG; MG; QZOS; H-RPBL and L-RPBL. Main metabolites, 1. Lactate; 2. Alanine; 3. Acetate; 4. N-acetylglucosaminidase; 5. Acetone; 6. Succinate; 7. 2-oxoglutarate; 8. Citrate; 9. Dimethylamine; 10. Dimethylglycine; 11. Creatinine/creatine; 12. Choline; 13. Trimethylamine-N-oxide; 14. Proline; 15. Glycine; 16. Glucose and amino acid; 17. Tyrosine; 18. Creatinine; 19. α-Glucose; 20. Allantoin; 21. Urea and 22. Hippurate. (B) OPLS-DA score plot based on 1H NMR spectra of urine samples from the CG and MG. OPLS-DA loading plot to the right of Figure 1(B). Key, CG (■); MG (●). (R2X= 0.833, R2Y= 0.997, Q2 = 0.946).
No. Metabolites Chemical shift1H (ppm) Content variance 1 LDL/VLDL 1.26(m),0.86(t) ↓* 2 Lactate 1.33(d),4.12(q) ↓* Plasma 3 N-Acetyl-glycoprotein 2.05(s) ↓* 4 Acetoacetate 2.33(s) ↓* 5 Creatine 3.05(s) ↑* 6 Trimethylamine-N-oxide 3.28(s) ↑* 1 Lactate 1.34(d),4.13(q) ↓* 2 Acetate 1.94(s) ↓* 3 Acetone 2.26(m) ↑* 4 Succinate 2.42(s) ↑* 5 2-Oxoglutarate 2.46(t),3.02(t) ↑* 6 Citrate 2.58(d), 2.66(d) ↑* 7 Dimethylamine (DMA) 2.7(s) ↑* Urine 8 Creatinine/creatine 3.06(s),4.06(s) ↓* 9 Choline 3.26(s) ↓* 10 Trimethylamine-N-oxide 3.3(s) ↑* 11 Proline 3.42(m) ↓* 12 Glycine 3.54(s) ↓* 13 α-Glucose 5.26(d) ↓* 14 Allantoin 5.42(s) ↓* 15 Hippurate 7.54(t),7.62(q),7.86(d) ↓* Note. ↑, content increased; ↓, content decreased. *P < 0.01. Table S1. Identification and trends of potential biomarkers related with MG vs CG in rat plasma and urine based on OPLS-DA loading plots of the NMR spectral regions
Trajectory analyses of the urine and plasma samples of CG, MG, QZOS, H-RPBL, and L-RPBL groups were compared. The PCA score plots (3-D) of both plasma (Figure 1C) and urine (Figure 1D) samples showed enhanced separation among the five groups and the values of the H-RPBL group were closer to those of CG than those of the L-RPBL group. Compared to the L-RPBL group, the metabolic pattern of the rats in the H-RPBL group approached that of the CG closely. Additionally, the metabolic patterns of the QZOS and H-RPBL groups partially overlapped, illustrating that the efficacy of H-RPBL and QZOS in preventing the effects of LAE was very similar.
The biochemical parameters for the CG, MG, QZOS, H-RPBL, and L-RPBL groups are summarized in Table 1. The AST, ALT, ALP, and BUN levels in the MG were significantly different from those in the CG (P < 0.05). The three indicators AST, ALP, and BUN in the L-RPBL group were significantly different from those in the MG (P < 0.05). However, only two indicators, ALT and ALP, in the QZOS group were significantly different from those in the MG (P < 0.05).
Parameters CG MG QZOS H-RPBL L-RPBL AST (U/L) 18.65 ± 1.53 24.39 ± 1.44# 21.43 ± 2.43 15.21 ± 1.17#* 20.79 ± 2.55* ALT (U/L) 18.14 ± 1.37 22.77 ± 0.61# 17.29 ± 1.47* 17.46 ± 2.83* 16.09 ± 2.70# ALP (U/L) 15.19 ± 0.97 23.22 ± 3.13# 14.09 ± 3.12* 14.06 ± 2.19* 12.61 ± 3.04* BUN (mmol/L) 5.29 ± 0.47 3.96 ± 1.58# 5.49 ± 1.16 4.81 ± 0.36# 5.15 ± 0.18* Note. #Significant difference from normal group at P < 0.05. *Significant difference from model group at P < 0.05. AST, aspartate aminotransferase; ALT, alanine aminotransferase; ALP, alkaline phosphatase; BUN, blood urea nitrogen. CG, Control Group; MG, Model Group; QZOS, Qizao oral solution. Table 1. Plasma biochemical parameters in different group (mean± SD)
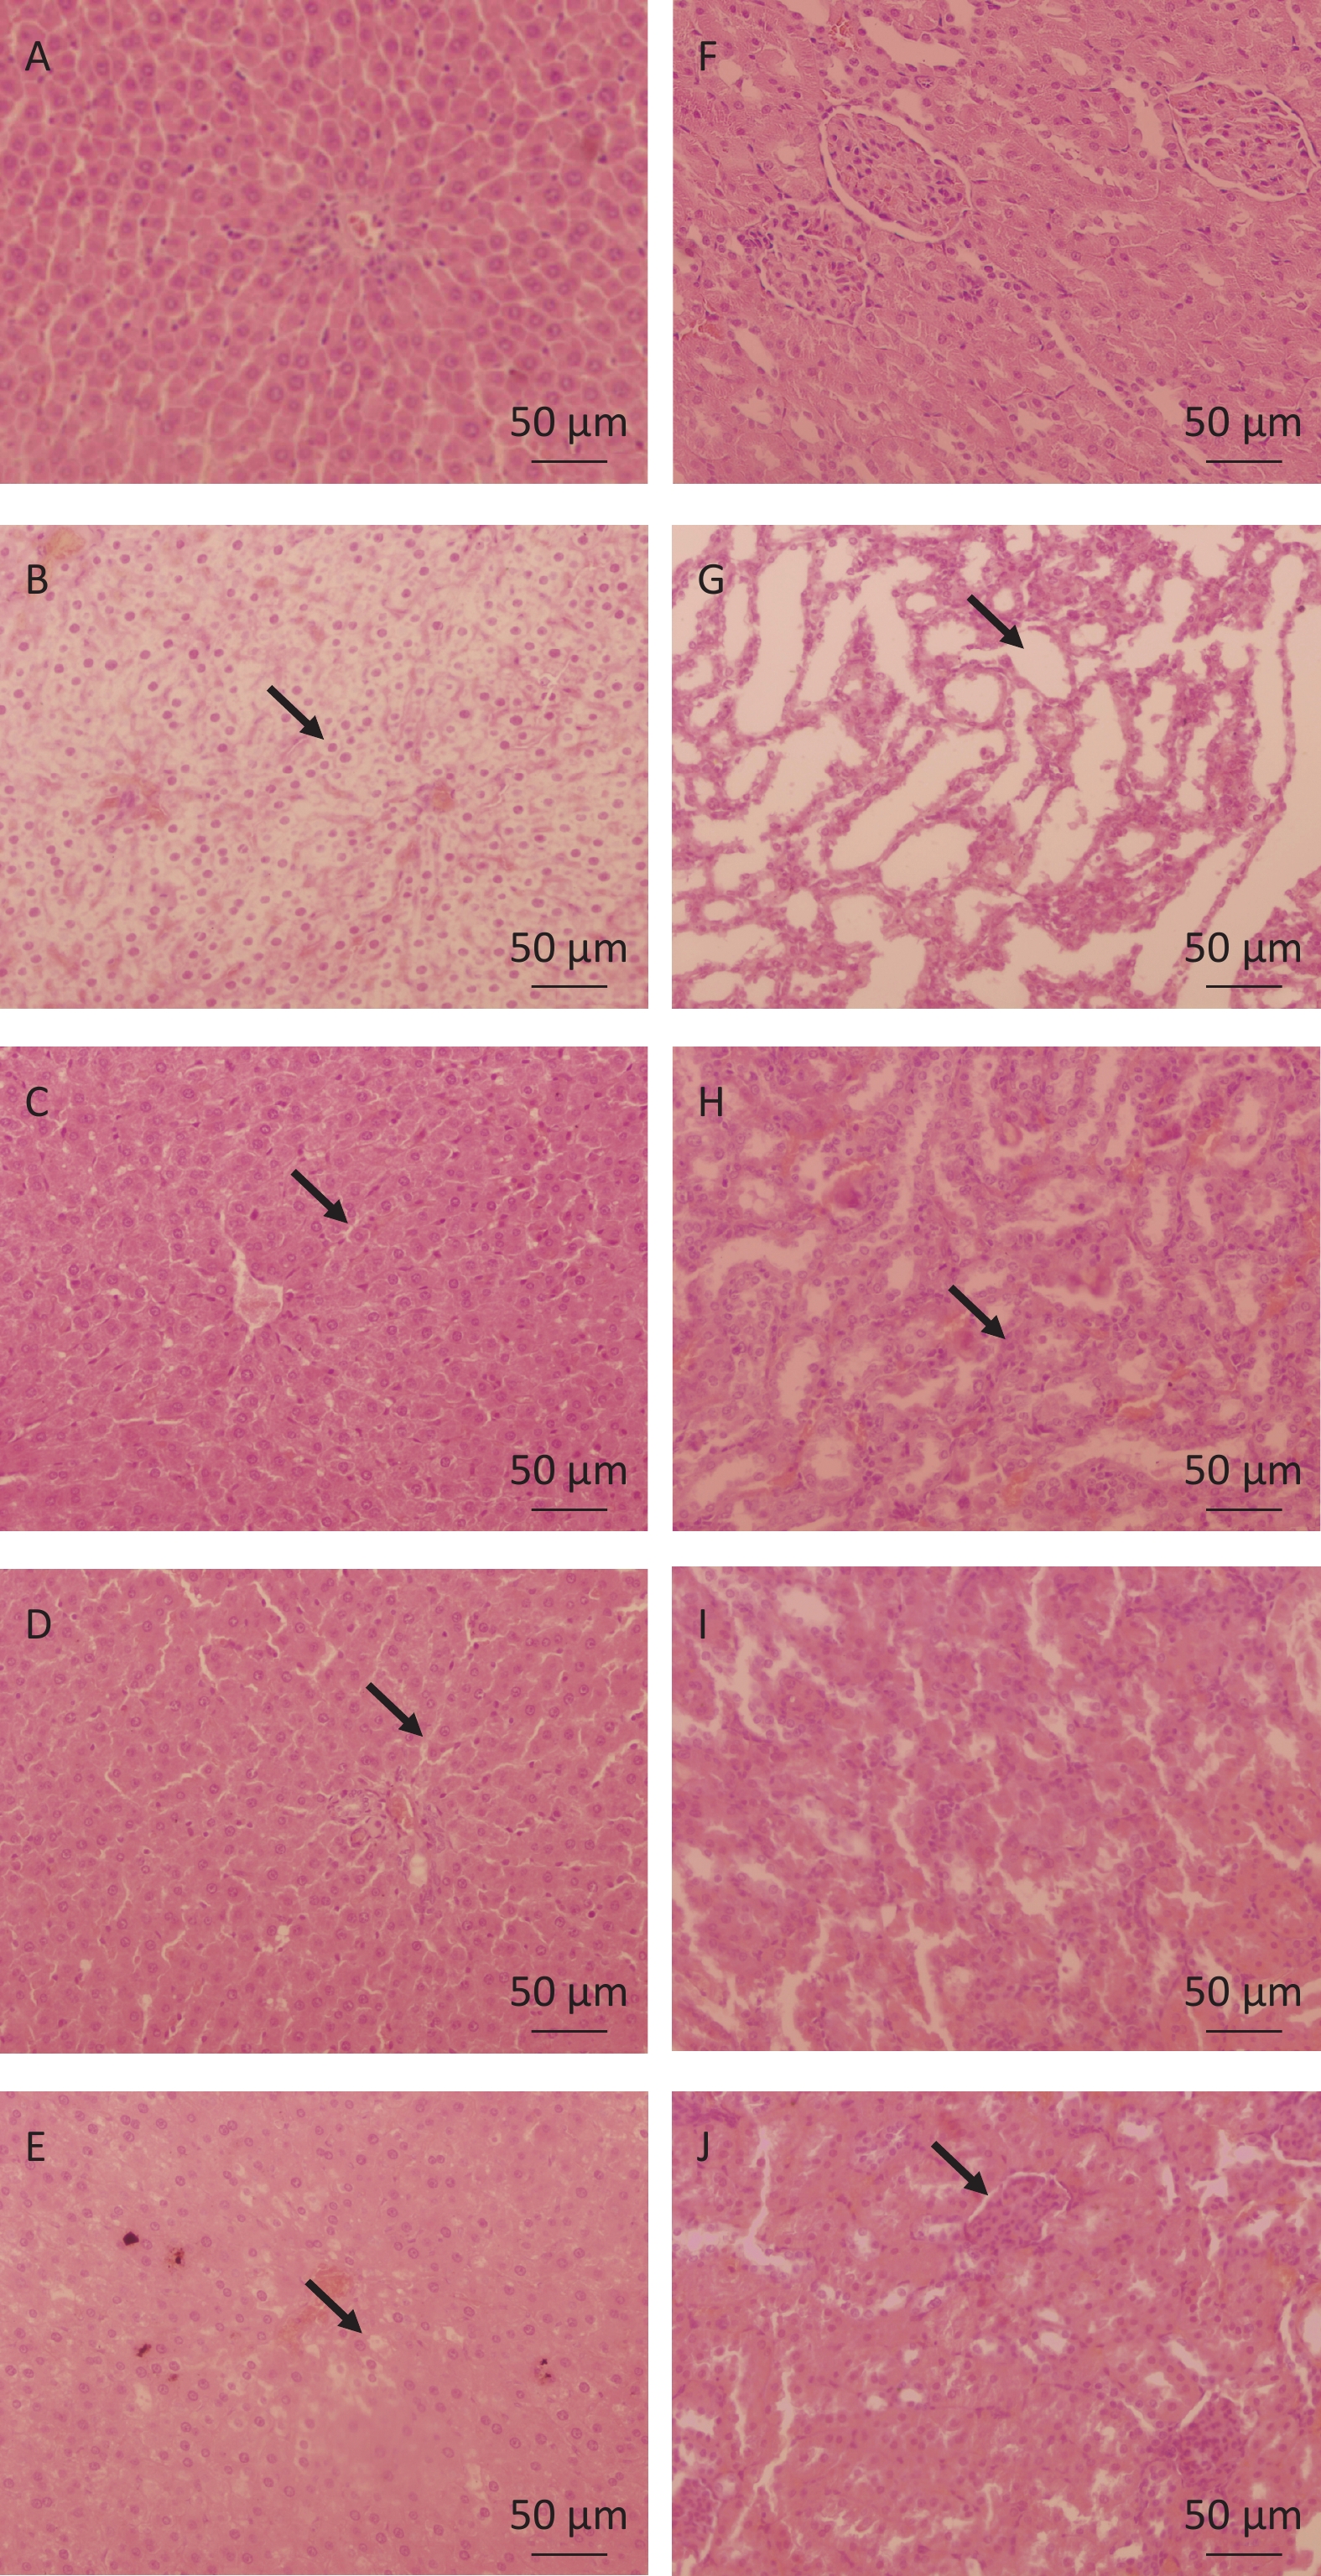
The liver and kidney samples were fixed in 10% formalin and processed for light microscopy. All sections were stained with hematoxylin and eosin, and evaluated in a non-blinded manner to further observe the pathological changes in the liver and kidney tissues. The results of liver pathological analyses are shown in Figure 2. Histopathological examination of the liver tissue depicted marked hydropic changes in hepatocytes of the MG (Figure 2B) compared to those in the CG (Figure 2A). Additionally, the liver tissue in the H-RPBL (Figure 2A) and QZOS (Figure 2C) groups was similar to that in the CG, and (Figure 2E) hepatocytes in the L-RPBL group showed minor hydropic changes. The results of kidney pathological analyses are shown in Figure 2. Histopathological examination of the kidney tissue depicted distinct changes in protein in the MG (Figure 2G) compared to that in the CG (Figure 2F). Furthermore, the kidney tissue in the H-RPBL group (Figure 2I) was similar to that in the CG; however, a few kidney tubules in the QZOS group (Figure 2H) presented basophilic changes, whereas a large number of basophilic tubule changes were observed in the kidneys of the L-RPBL group (Figure 2J).
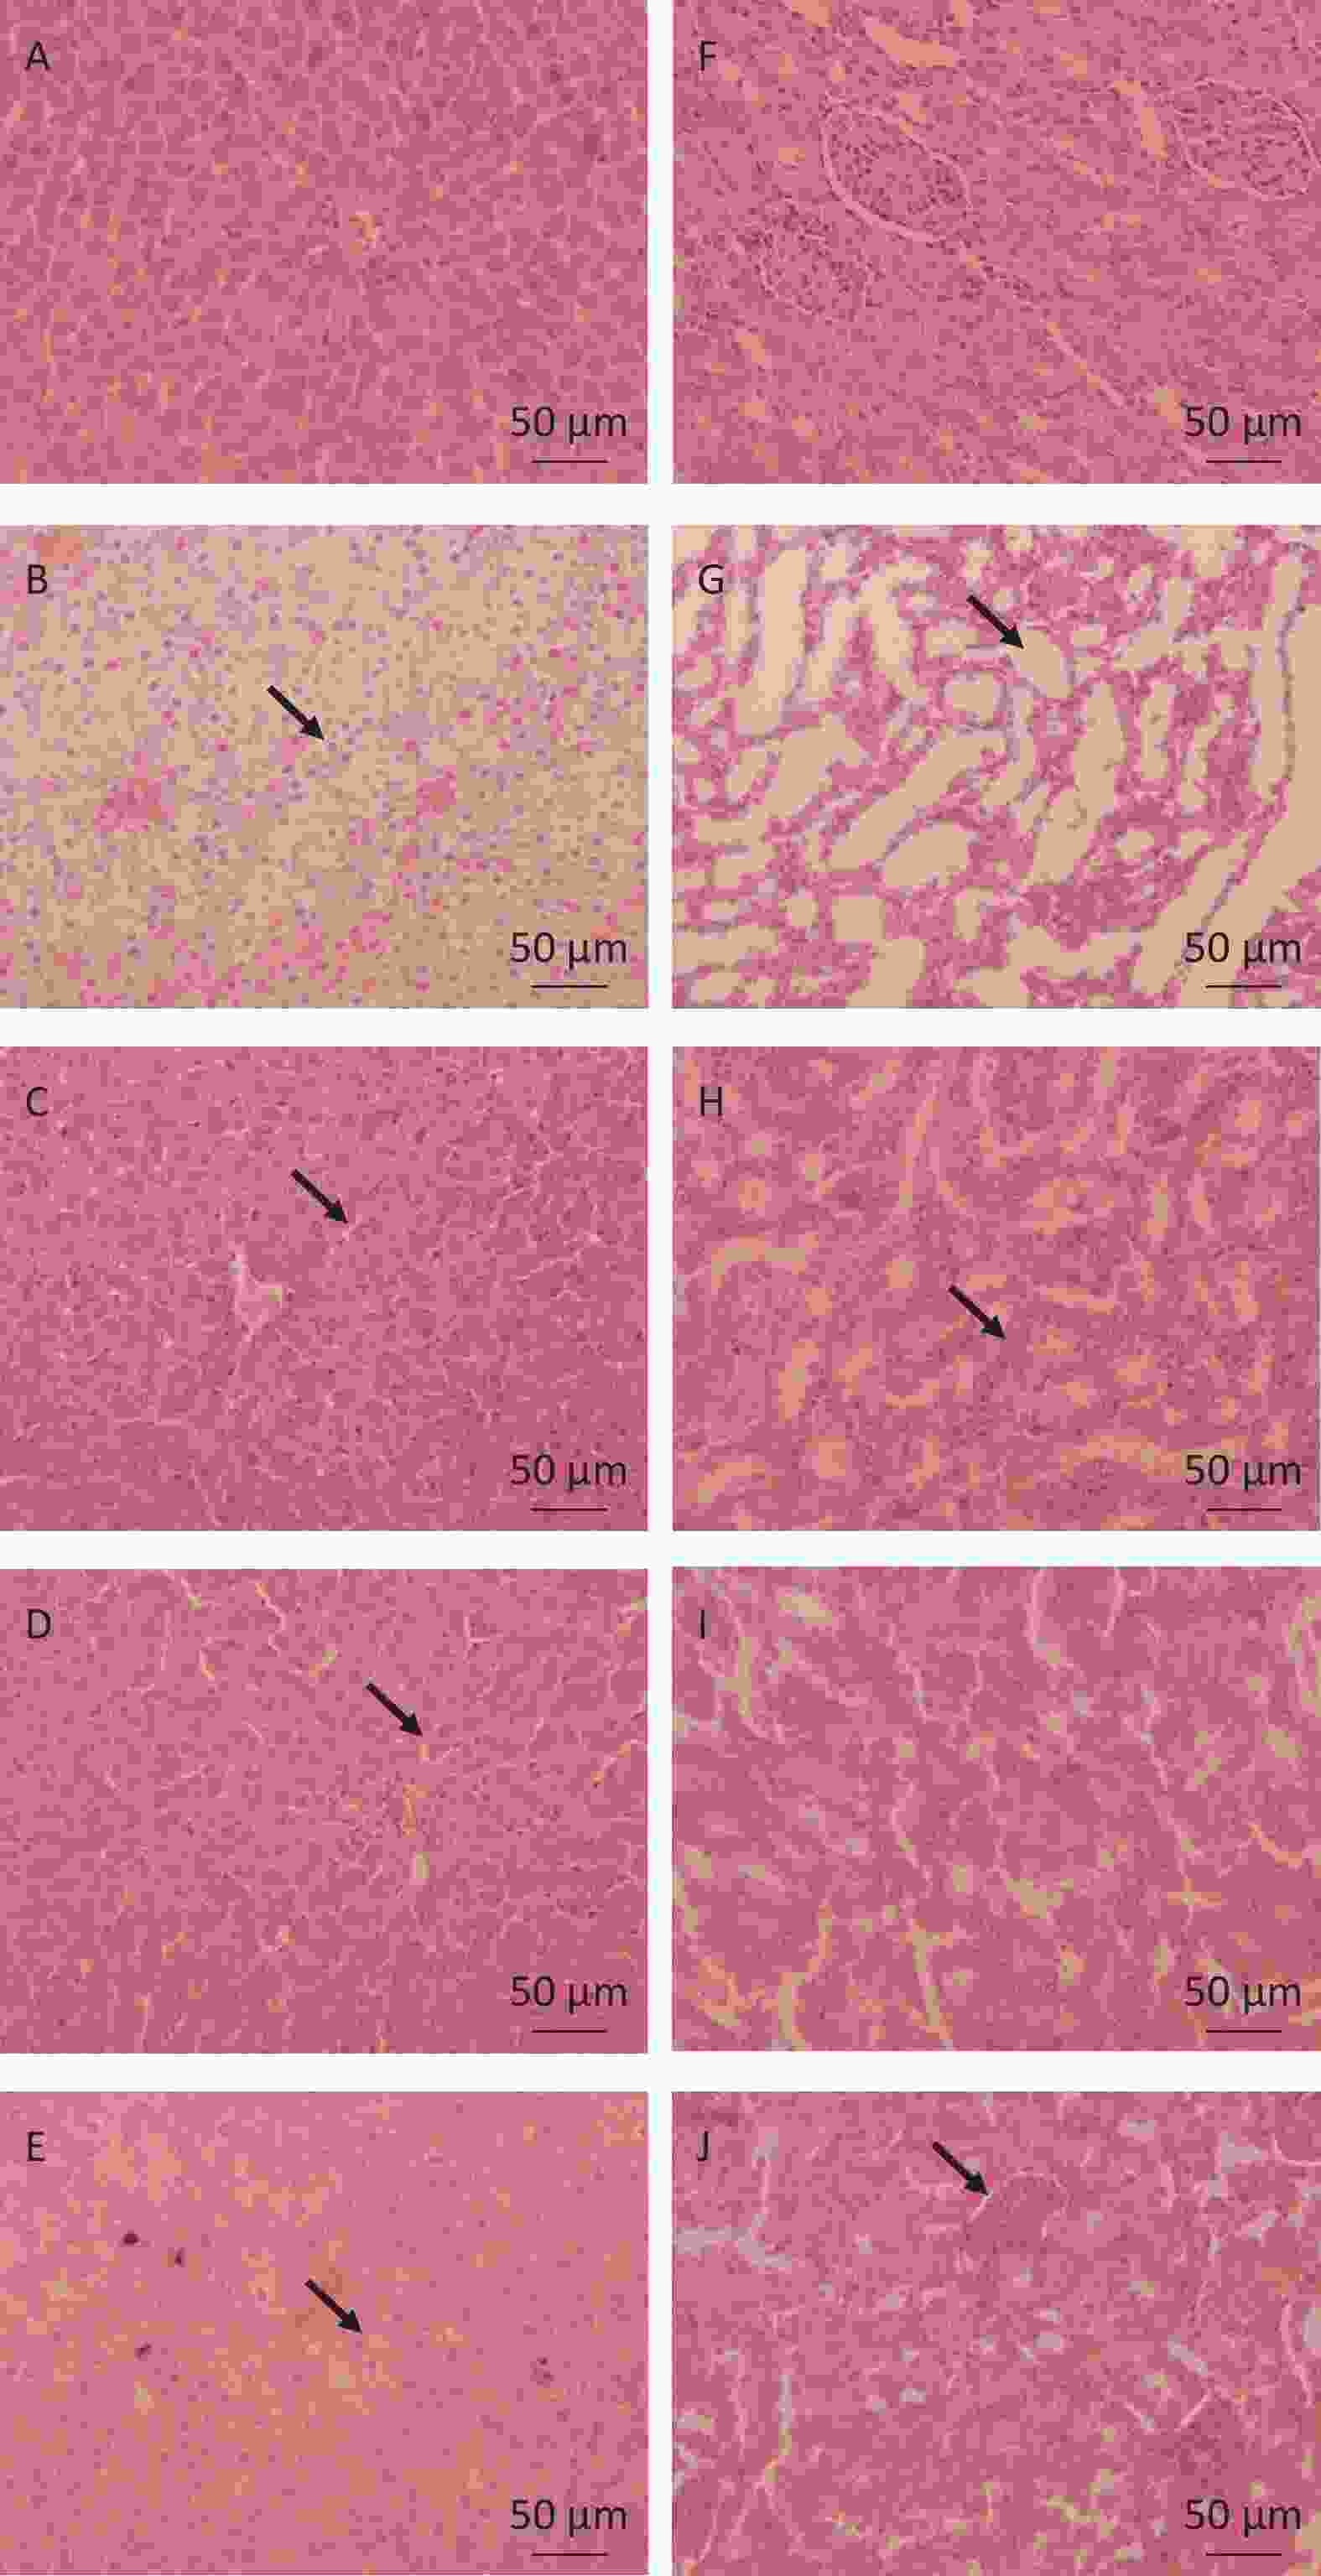
Figure 2. Representative photomicrographs of liver tissue sections stained with H&E.
Metabolomics approaches provide a global overview of the integrated response of an organism to stimuli. The application of 1H-NMR based on metabolomic technologies for the study of Pb poisoning will increase our understanding of the pathophysiological processes involved, and can help identify potential biomarkers to develop new therapeutic strategies. Our study highlights the importance of the power of metabolomics to elucidate the metabolic characteristics of LAE and predict the effects of RPBL at the global metabolomic level. Six and 15 potential biomarkers were identified in plasma and urine, respectively, that are involved in detoxification mechanisms. Notably, the results showed that RPBL administration could provide a satisfactory effect on LAE by restoring biomarkers to their normal state. These results expand our understanding of disease pathophysiology, which could lead to the discovery of new targets and the identification of biomarkers in clinical settings[8-10].
In summary, our findings provide important evidence that metabolomic technologies can be used to identify LAE biomarkers, which is a crucial step towards improving the current diagnosis, developing new pre-symptomatic treatments, and assessing drug efficacy.
HTML
 23169+Supplementary Materials.pdf
|

|

 Quick Links
 DownLoad: