

-
China has a high prevalence of chronic hepatitis B (CHB). There are 20–30 million patients with CHB, 1 million patients with cirrhosis, and 300 thousand patients with hepatocellular carcinoma (HCC)[1,2]. Patients with liver cirrhosis and liver cancer, which are caused by HBV infection, account for 60% and 80% of CHB cases, respectively[3]. Clearly, CHB remains one of the most prevalent infectious diseases in China. CHB occurs as a result of viral stimulation of the host’s immune system. To reduce the incidence of cirrhosis and hepatocellular carcinoma in CHB patients, antiviral therapy must be used to achieve sustained immune control of HBV, which is manifested by the serological conversion of hepatitis B e antigen (HBeAg) on the basis of HBV deoxyribonucleic acid (DNA) conversion, disappearance of hepatitis B surface antigen (HBsAg), and a sustained virological response. Interferon (IFN) and nucleoside (nucleotide) analogs (NA) are two kinds of effective antiviral drugs for chronic hepatitis B (CHB). Interferon is advantageous over NA in achieving seroconversion of the immune control target of HBeAg or HBsAg disappearance. Recovery from HBV infection is dependent on the immune response, which is mediated by a variety of cells, including dendritic cells (DC), natural killer cells (NK), CD4+T lymphocytes (CD4+T), and CD8+T lymphocytes (CD8+T), as well as the cytokines secreted by them. The helper T lymphocytes (TH), DC and cytokines of cellular immunity in CHB patients are abnormal in many respects, which are closely related to the pathogenesis, chronicity, and antiviral efficacy of hepatitis B[4-8].
The purpose of this study is to explore changes in the cytokine profiles of patients with chronic hepatitis B treated with different antiviral drugs. The outcomes of this research will aid clinicians in choosing an effective antiviral therapy for hepatitis B.
-
This was a prospective cohort study. Patients with HBeAg-positive CHB were selected from November 2017 to November 2018 in the Second Department of Hepatology, Beijing Ditan Hospital. PEG-IFN and entecavir (ETV) were administered for 48 weeks. Patients were divided into a PEG-IFNα-2a treatment group and an oral ETV treatment group according to their clinical data, drug contraindications, and wishes. In the PEG-IFNα-2a group, the patients received a weekly subcutaneous injection of PEG-IFNα-2a 180 μg/wk. In the ETV group, the patients received ETV 0.5 mg/d. Virologic and serologic markers, biochemistry, and AFP were measured every 3 months during the treatment period. Liver imaging was performed every 6 months. Cytokines were measured at baseline, 3 months, and 6 months (fms-like tyrosine kinase 3 ligand (Flt3-L), IFN-α2, IFN-γ, IL-10, IL-17A, IL-6, TGF-β1, TGF-β2, TGF-β3, and TNF-α). To analyze the changing trend of cytokines in antiviral therapy.
-
The subjects of this study were HBeAg-positive CHB patients. The inclusion criteria for HBeAg-positive CHB patients were 1) persistent HBsAg positivity (HBsAg ≥ 0.05 IU/mL) > 6 months; 2) HBeAg-positivity, HBeAg ≥ 1.0 S/CO; 3) HBV DNA-positivity (104 IU/mL); 4) abnormal ALT (≥ 80 IU/L) lasting for more than 3 months or marked liver inflammation (above G2) in histological examination; 5) Age 18–65 years; 6) clinical condition meeting with the diagnostic criteria of China’s Guidelines for the Prevention and Treatment of Chronic Hepatitis B (2015)[1]; 7) male or female gender.
The exclusion criteria were 1) co-infection with another hepatitis virus (HCV, HDV); 2) presence of an autoimmune liver disease; 3) infection with another virus, such as ebolavirus, cytomegalovirus, or human immunodeficiency virus; 4) chronic alcohol abuse and/or use of other drugs that damage that liver; 5) mental illness; 6) evidence of liver tumor (clinical diagnosis of liver cancer or AFP > 100 ng/mL); 7) presence of hepatic fibrosis or cirrhosis, as evidenced by Fibroscan[9]; 8) serious diseases of the heart, brain, lung, kidney, or other systems that preclude participation in long-term follow-up; 9) use of hormones and/or immunosuppressants or other hepatoprotective agents; 10) presence of other liver diseases (fatty liver and metabolic liver disease).
-
Considering that the antiviral mechanism of interferon is mainly immune regulation, the direct antiviral effect is limited. Patients in the PEG-IFNα-2a treatment group were treated with PEG-IFNα-2a 180 μg/w alone for 12 weeks, and those with an HBV DNA load above 103 IU/mL were treated with PEG-IFNα-2a combined with ETV until the end of week 48, according to response-guided therapy (RGT). Patients in the PEG-IFNα-2a treatment group were treated with PEG-IFNα-2a alone for 12 weeks and, if their HBV DNA load was less than 103 IU/mL but more than 20 IU/mL at week 24, PEG-IFNα-2a combined with ETV until the end of week 48.
The main outcome of this study was the response of the two groups over the course of 48 weeks of treatment. After the 48-week treatment period, PEG-IFNα-2a treatment was discontinued or changed to nucleotide (side) treatment according to the patients’ wishes and the situation at that time; in the ETV treatment group, if the response was favorable, ETV treatment was continued. If the response was unfavorable, other nucleosides (tides) or interferon alone/in combination were used according to the patient’s wishes and responses.
-
A Hitachi automatic biochemistry analyzer was used to assess liver (Wako Pure Chemical Industries, Ltd., Japan) and renal function (Sekisui Medical Co., Ltd., Japan). Routine blood testing (Sysmex Corp., Japan), alpha-fetoprotein (Abbott Ireland Diagnostics Division, Finisklin Business Park, Sligo, Ireland), and serum HBV DNA load were detected with Roche (Cobas AmpliPrep/Cobas TaqMan 96) automatic real-time fluorescence quantitative polymerase chain reaction detection reagent (detection limit < 20 IU/mL). An HBV DNA level of < 20 IU/mL was defined as a complete virological response. The HBsAg/anti-HBs and HBeAg/anti-HBe were detected with Abbott Architect i2000 chemiluminescence reagent. The detection range of the HBsAg level was 0.05–250 IU/mL, samples with an HBsAg level higher than 250 IU/mL were automatically diluted 500 times, and the actual HBsAg level was calculated by multiplying the detected value by 500. HBsAg 0.05 IU/mL was defined as the disappearance of HBsAg. There was no upper limit of HBeAg detection. The lower limit of HBeAg detection was 1.0 S/CO. An HBeAg level < 1.0 S/CO was defined as the disappearance of HBeAg.
-
Cytokine levels were measured by the Luminex technique and analyzed with a FLEXmap 3D analyzer.
-
Descriptive analysis and percent expression were used for enumeration data, and Fisher’s exact test or the chi-square test was used for comparisons between groups. Mean ± SD was used to describe normally distributed measurement data, ANOVA and independent-sample t-tests were used to compare the two groups. For non-normally distributed data, median with interquartile range (Q1, Q3) and the Mann–Whitney U test were used for comparisons between groups. Analysis of covariance was used for comparisons of measurement data with significant baseline differences between the two groups. Spearman’s rank correlation test was used to analyze correlations between variables. All data were analyzed with SPSS Statistics, Version 21.0 (Armonk, NY: IBM Corp.) and GraphPad Prism 5 software. Spearman or Pearson correlation analysis was used to test for correlations between cytokines and dynamic changes in HBsAg. All statistical tests were two-sided. If P < 0.05, the result was considered statistically significant. Note: *P < 0.05, **P < 0.01, ***P < 0.001.
-
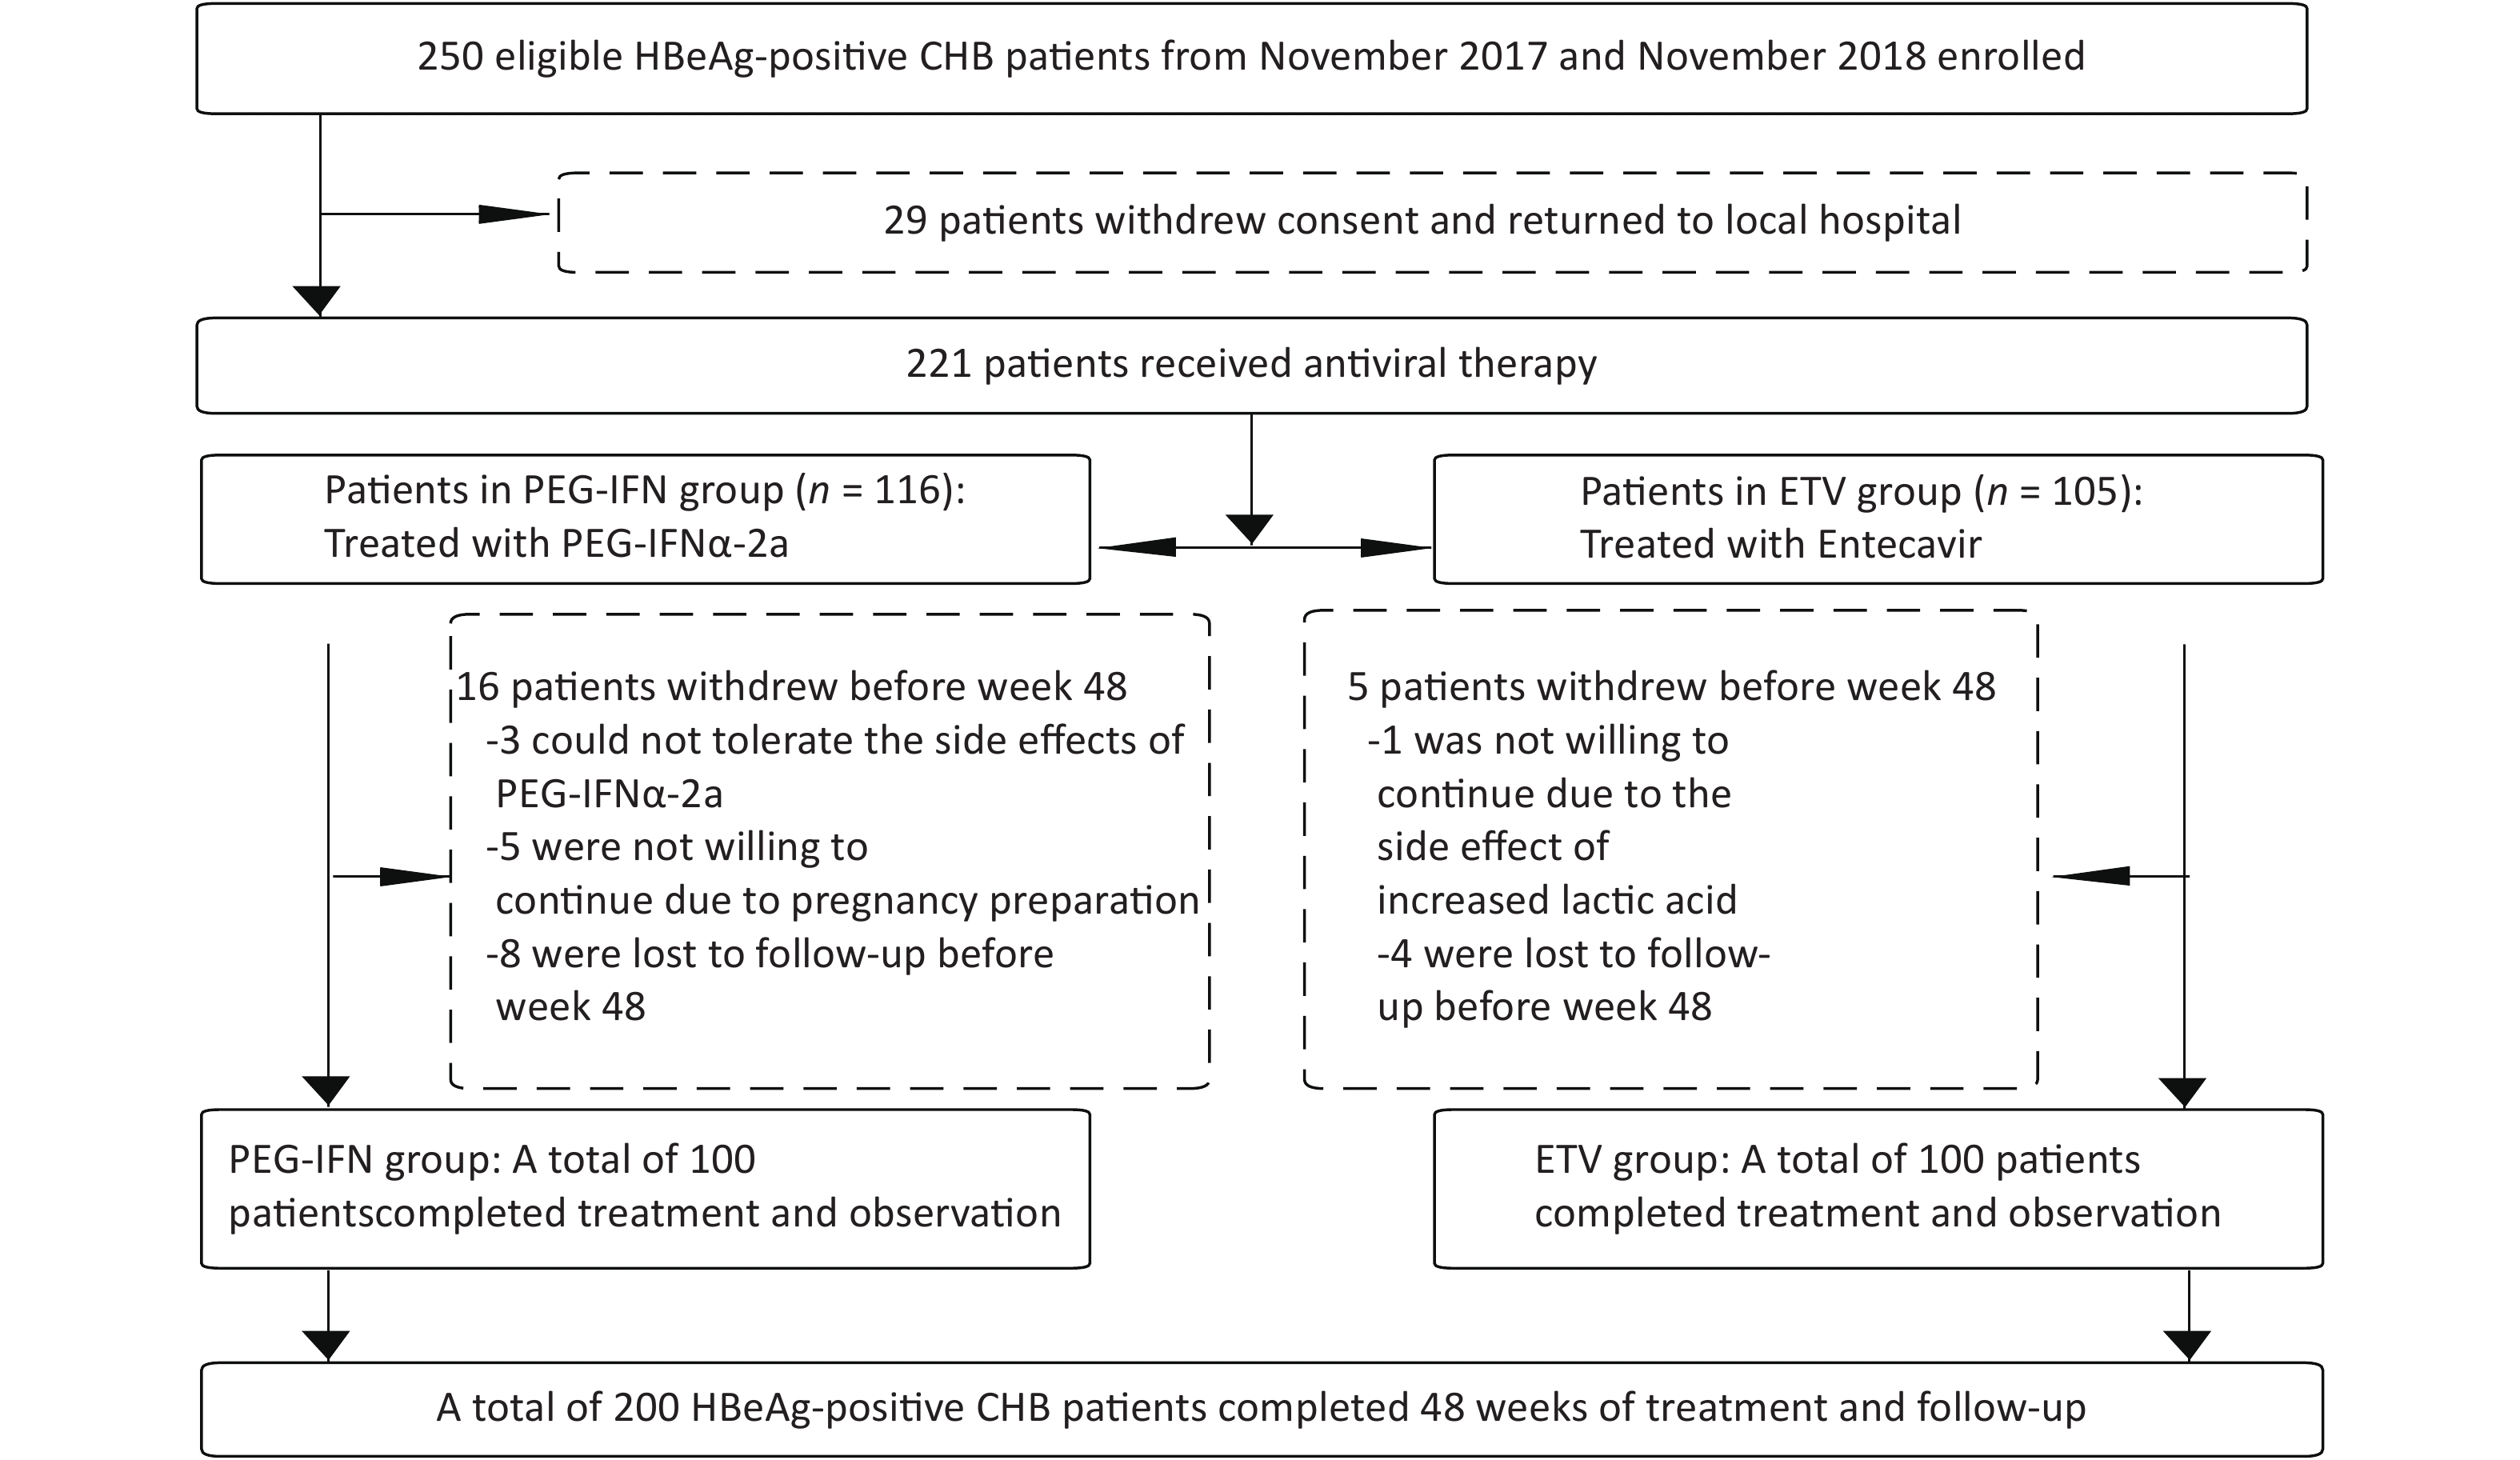
From November 2017 to November 2018, 221 of 250 HBeAg-positive chronic hepatitis B patients in the Second Department of Hepatology, Beijing Ditan Hospital Affiliated with Capital Medical University gave written informed consent to enter our study group, and 29 patients could not be followed up continuously at home. Of these 221 patients with CHB, 116 were treated with PEG-IFN-2a, and 105 cases were allocated to the oral ETV treatment group. Three patients in the PEG-IFNα-2a group withdrew from the study because they could not tolerate the side effects of PEG-IFNα-2a, five patients withdrew from the study because they were ready to conceive, and eight patients did not complete the 48-week follow-up. One patient in the ETV group withdrew because of the side effect of elevated lactate, and four patients did not complete the 48-week follow-up. Finally, a total of 200 CHB patients completed the 48-week follow-up, including 100 patients in the PEG-IFN-2a treatment group and 100 patients in the ETV treatment group, as shown in Figure 1. The age of the patients ranged from 28 to 38 years, comprising 121 males and 79 females. In the PEG-IFN-2a group, 55 patients were treated with ETV after 12 weeks of PEG-IFN-2a treatment, and 10 patients were treated with ETV after 24 weeks. Age, white blood cell counts, HGB, PLT, biochemical indicators (ALT, AST, TBil, ALB), and virological indicators (HBV DNA load, HBsAg level, HBeAg level) of the two groups are shown in Table 1. There were no significant differences in age, WBC, HGB, PLT, ALT, AST, TBil, ALB, HBV DNA load, HBsAg level, and HBeAg level between the two groups. The baseline cytokine characteristics between the two groups were analyzed, and the results are shown in Table 1 and Figure 2. There was a statistically significant difference in TNF-α between the PEG-IFN and ETV groups (17.93 vs. 8.79 PG/mL, Z = −4.589, P < 0.001). Other cytokines were not significantly different.
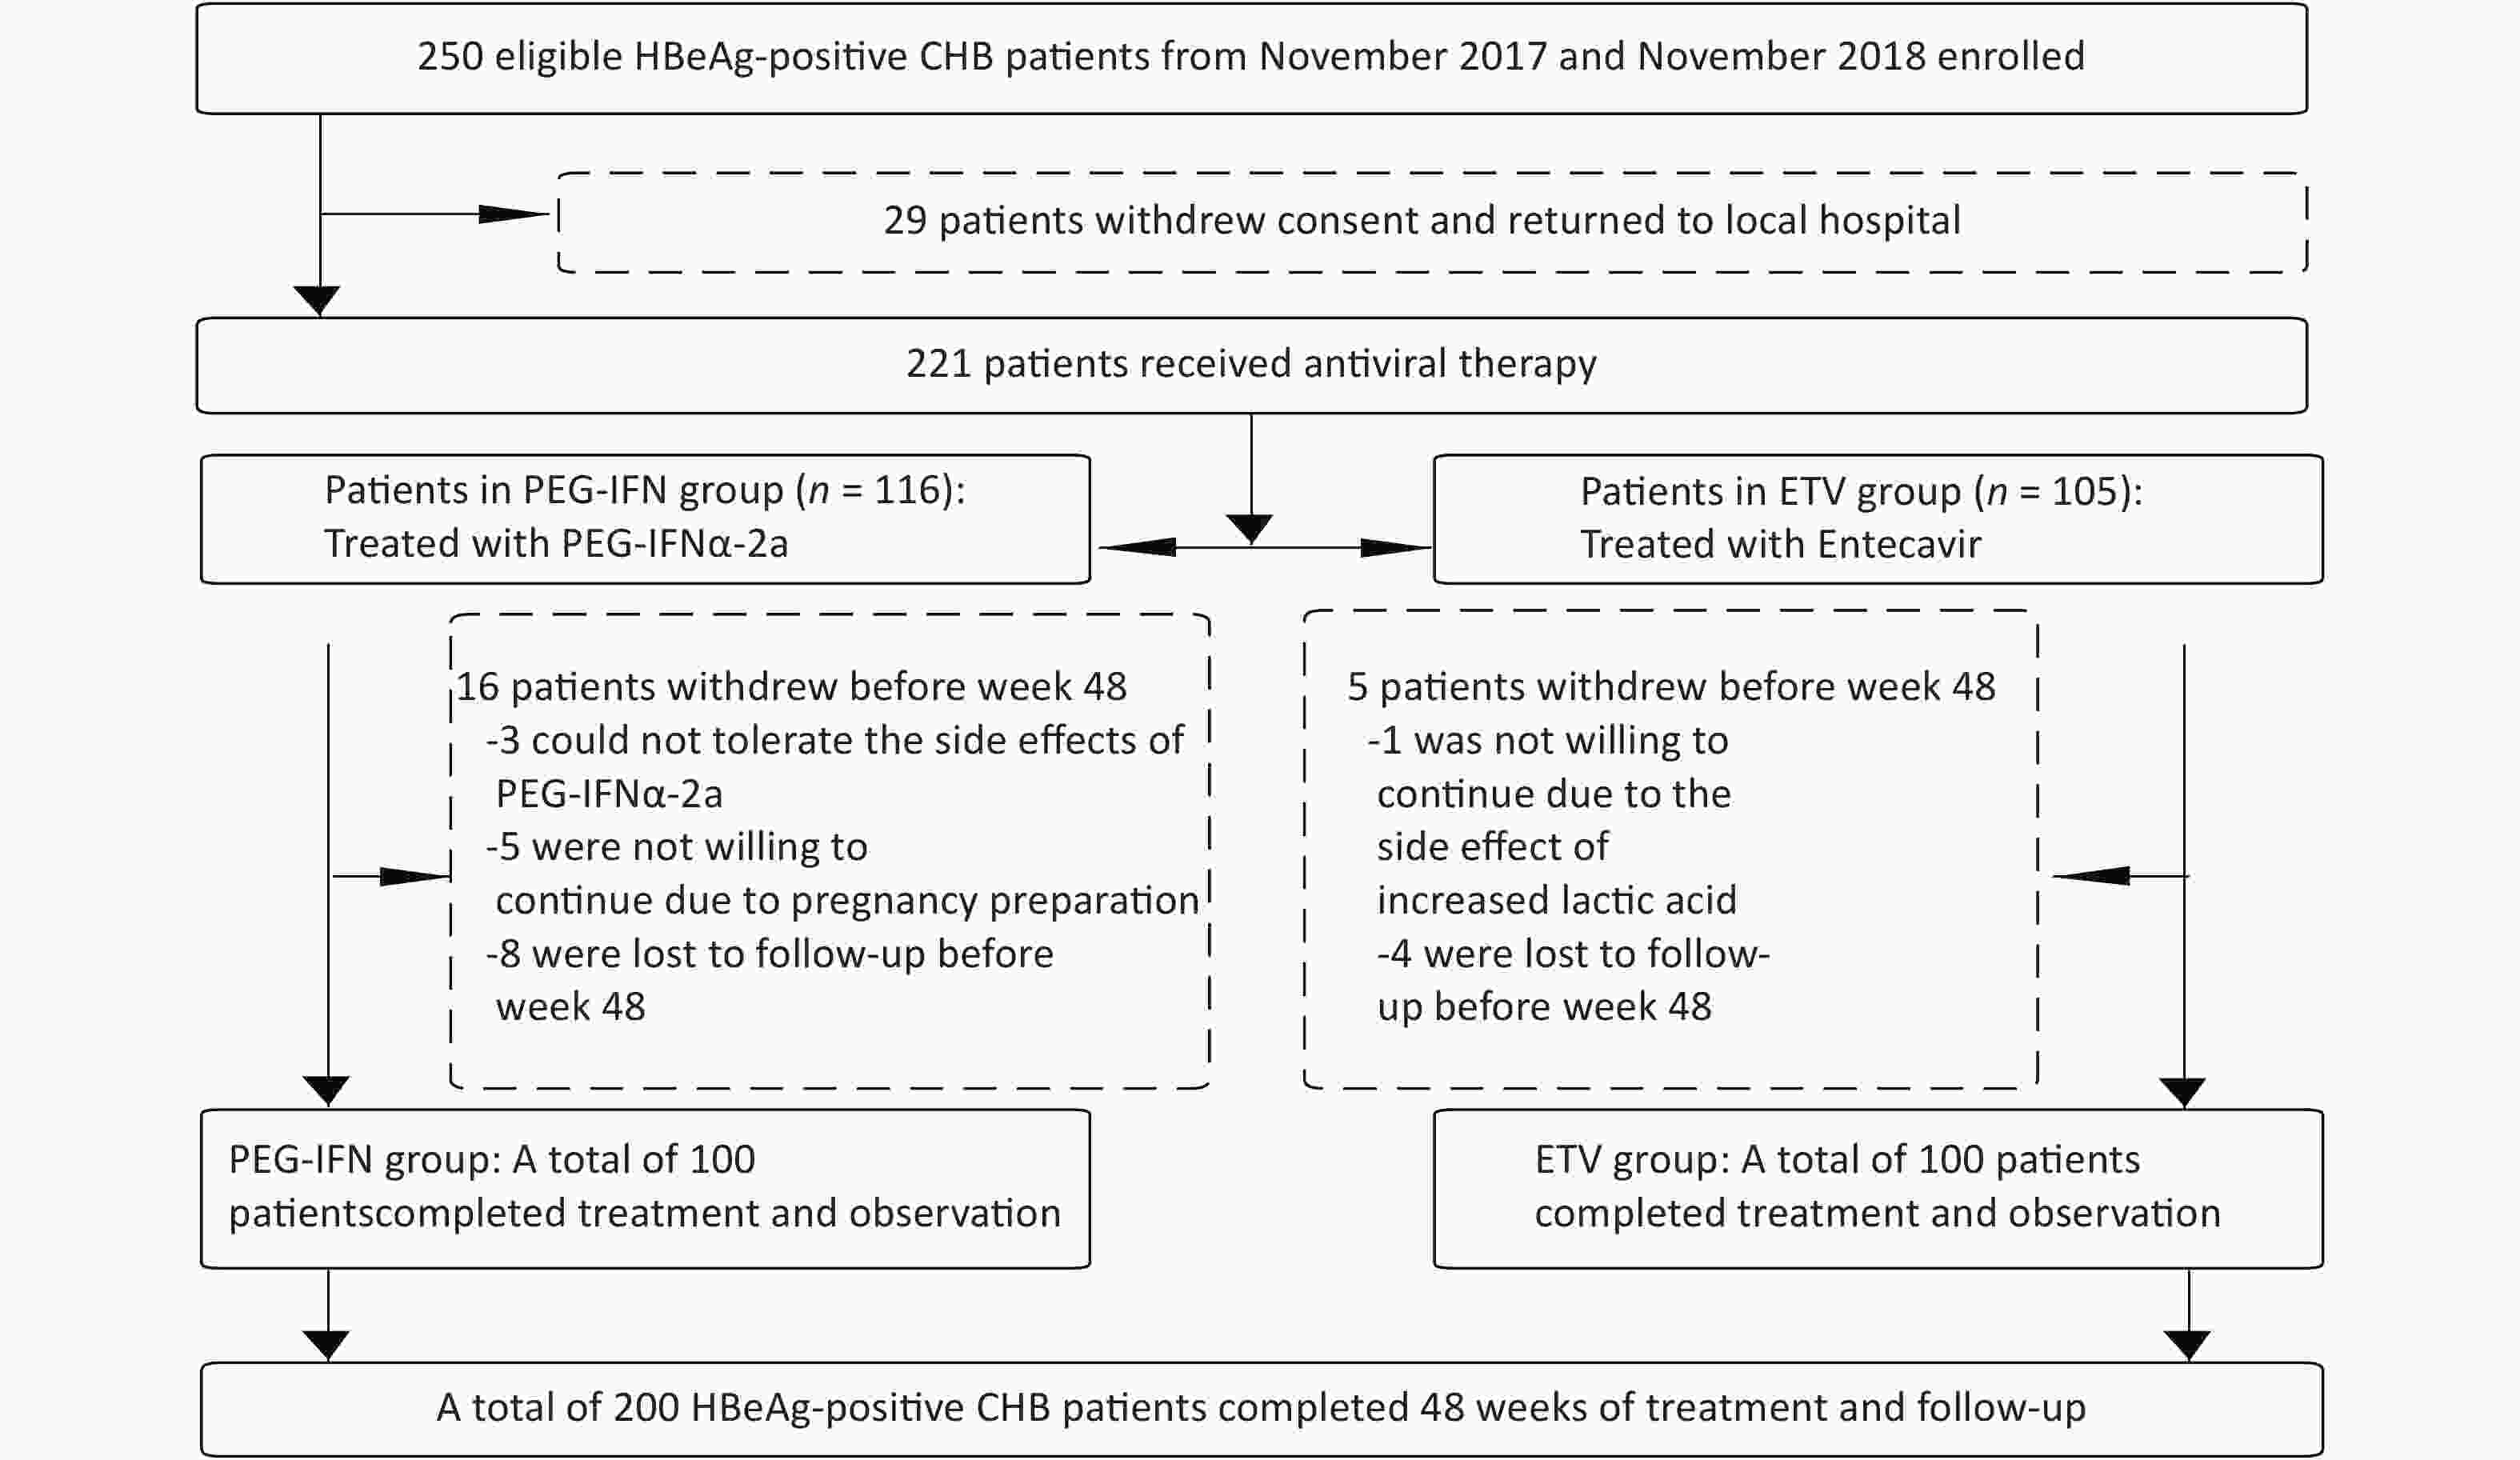
Figure 1. Patient enrolment and deposition.
Clinical characteristics Total patients (n = 200) PEG-IFN (n = 100) ETV (n = 100) Z/χ2 P Male (%) 121 (60.5%) 60 (60%) 61 (61%) χ2 = 0.021 0.885 Age (y) (median, range) 32 (28–38) 31 (28–36) 32 (28–38) Z = 0.718 0.473 ALT (U/L) (median, range) 232.95 (126.45–353.70) 240.70 (129.30–359.25) 227.70 (123.03–345.20) Z = −0.204 0.838 AST (U/L) (median, range) 108.70 (61.95–173.98) 121.50 (65.60–172.35) 103.35 (61.10–181.60) Z = −0.739 0.460 TBil (µmol/L) (median, range) 14.30 (11.60–20.40) 13.25 (11.80–18.23) 15.70 (11.60–21.58) Z = −1.679 0.093 ALB (g/L) (median, range) 45.50 (42.60–47.40) 45.25 (42.70–47.10) 45.70 (42.30–47.90) Z = −0.400 0.689 HBsAg (log10 IU/mL) (median, range) 3.88 (3.63–4.10) 3.88 (3.63–4.10) 3.88 (3.63–4.10) Z = −0.051 0.959 HBeAg (S/CO) (median, range) 852.62 (472.32–1188.79) 859.25 (488.81–1193.45) 811.69 (452.44–1173.23) Z = −0.071 0.944 HBV DNA (log10 IU/mL) (median, range) 6.66 (6.34–7.31) 6.66 (6.26–7.31) 6.65 (6.40–7.37) Z = −0.088 0.930 WBC (109/L) (median, range) 5.07 (4.56–5.82) 5.02 (4.48–6.24) 5.07 (4.74–5.65) Z = −0.522 0.602 HGB (g/L) (median, range) 151.50 (140.00–163.00) 150.00 (142.25–161.00) 153.00 (136.75–165.85) Z = −0.535 0.592 PLT (109/L) (median, range) 178.50 (154.00–220.50) 180.00 (147.50–222.00) 175.10 (159.00–219.00) Z = −0.270 0.787 Flt3-L (pg/mL) (median, range) 16.49 (0.53–82.42) 16.49 (0.56–83.56) 0.14 (0.02–30.77) Z = −1.607 0.108 IFN-α2 (pg/mL) (median, range) 42.66 (21.12–76.52) 41.60 (19.75–86.86) 42.66 (26.46–74.17) Z = −0.622 0.534 IFN-γ (pg/mL) (median, range) 21.27 (6.46–61.48) 22.47 (8.39–62.15) 20.16 (3.92–58.41) Z = −1.365 0.172 IL−10 (pg/mL) (median, range) 9.07 (3.94–18.61) 9.04 (3.32–19.26) 9.07 (4.94–18.31) Z = −0.04 0.968 IL-17A (pg/mL) (median, range) 5.60 (2.75–36.75) 7.16 (3.21–37.39) 5.20 (2.74–36.75) Z = −0.903 0.367 IL-6 (pg/mL) (median, range) 2.27 (0.90–7.58) 2.15 (1.01–8.27) 2.46 (0.84–6.33) Z = −0.986 0.324 TNF-α (pg/mL) (median, range) 9.72 (7.42–16.62) 17.93 (14.76–43.36) 8.79 (6.61–14.73) Z = −4.589 < 0.001 TGF-β1 (pg/mL) (median, range) 4079.00
(2584.00–7503.75)4794.50
(2911.00–8057.25)5167.00
(2553.00–7885.00)Z = −0.797 0.426 TGF-β2 (pg/mL) (median, range) 425.81 (351.88–698.40) 435.48 (355.05–716.21) 412.21 (224.29–537.31) Z = −1.226 0.220 TGF-β3 (pg/mL) (median, range) 160.09 (133.50–207.50) 156.35 (131.69–200.38) 173.92 (160.74–209.12) Z = −1.506 0.132 Table 1. Clinical characteristics of the PEG-IFN and ETV groups
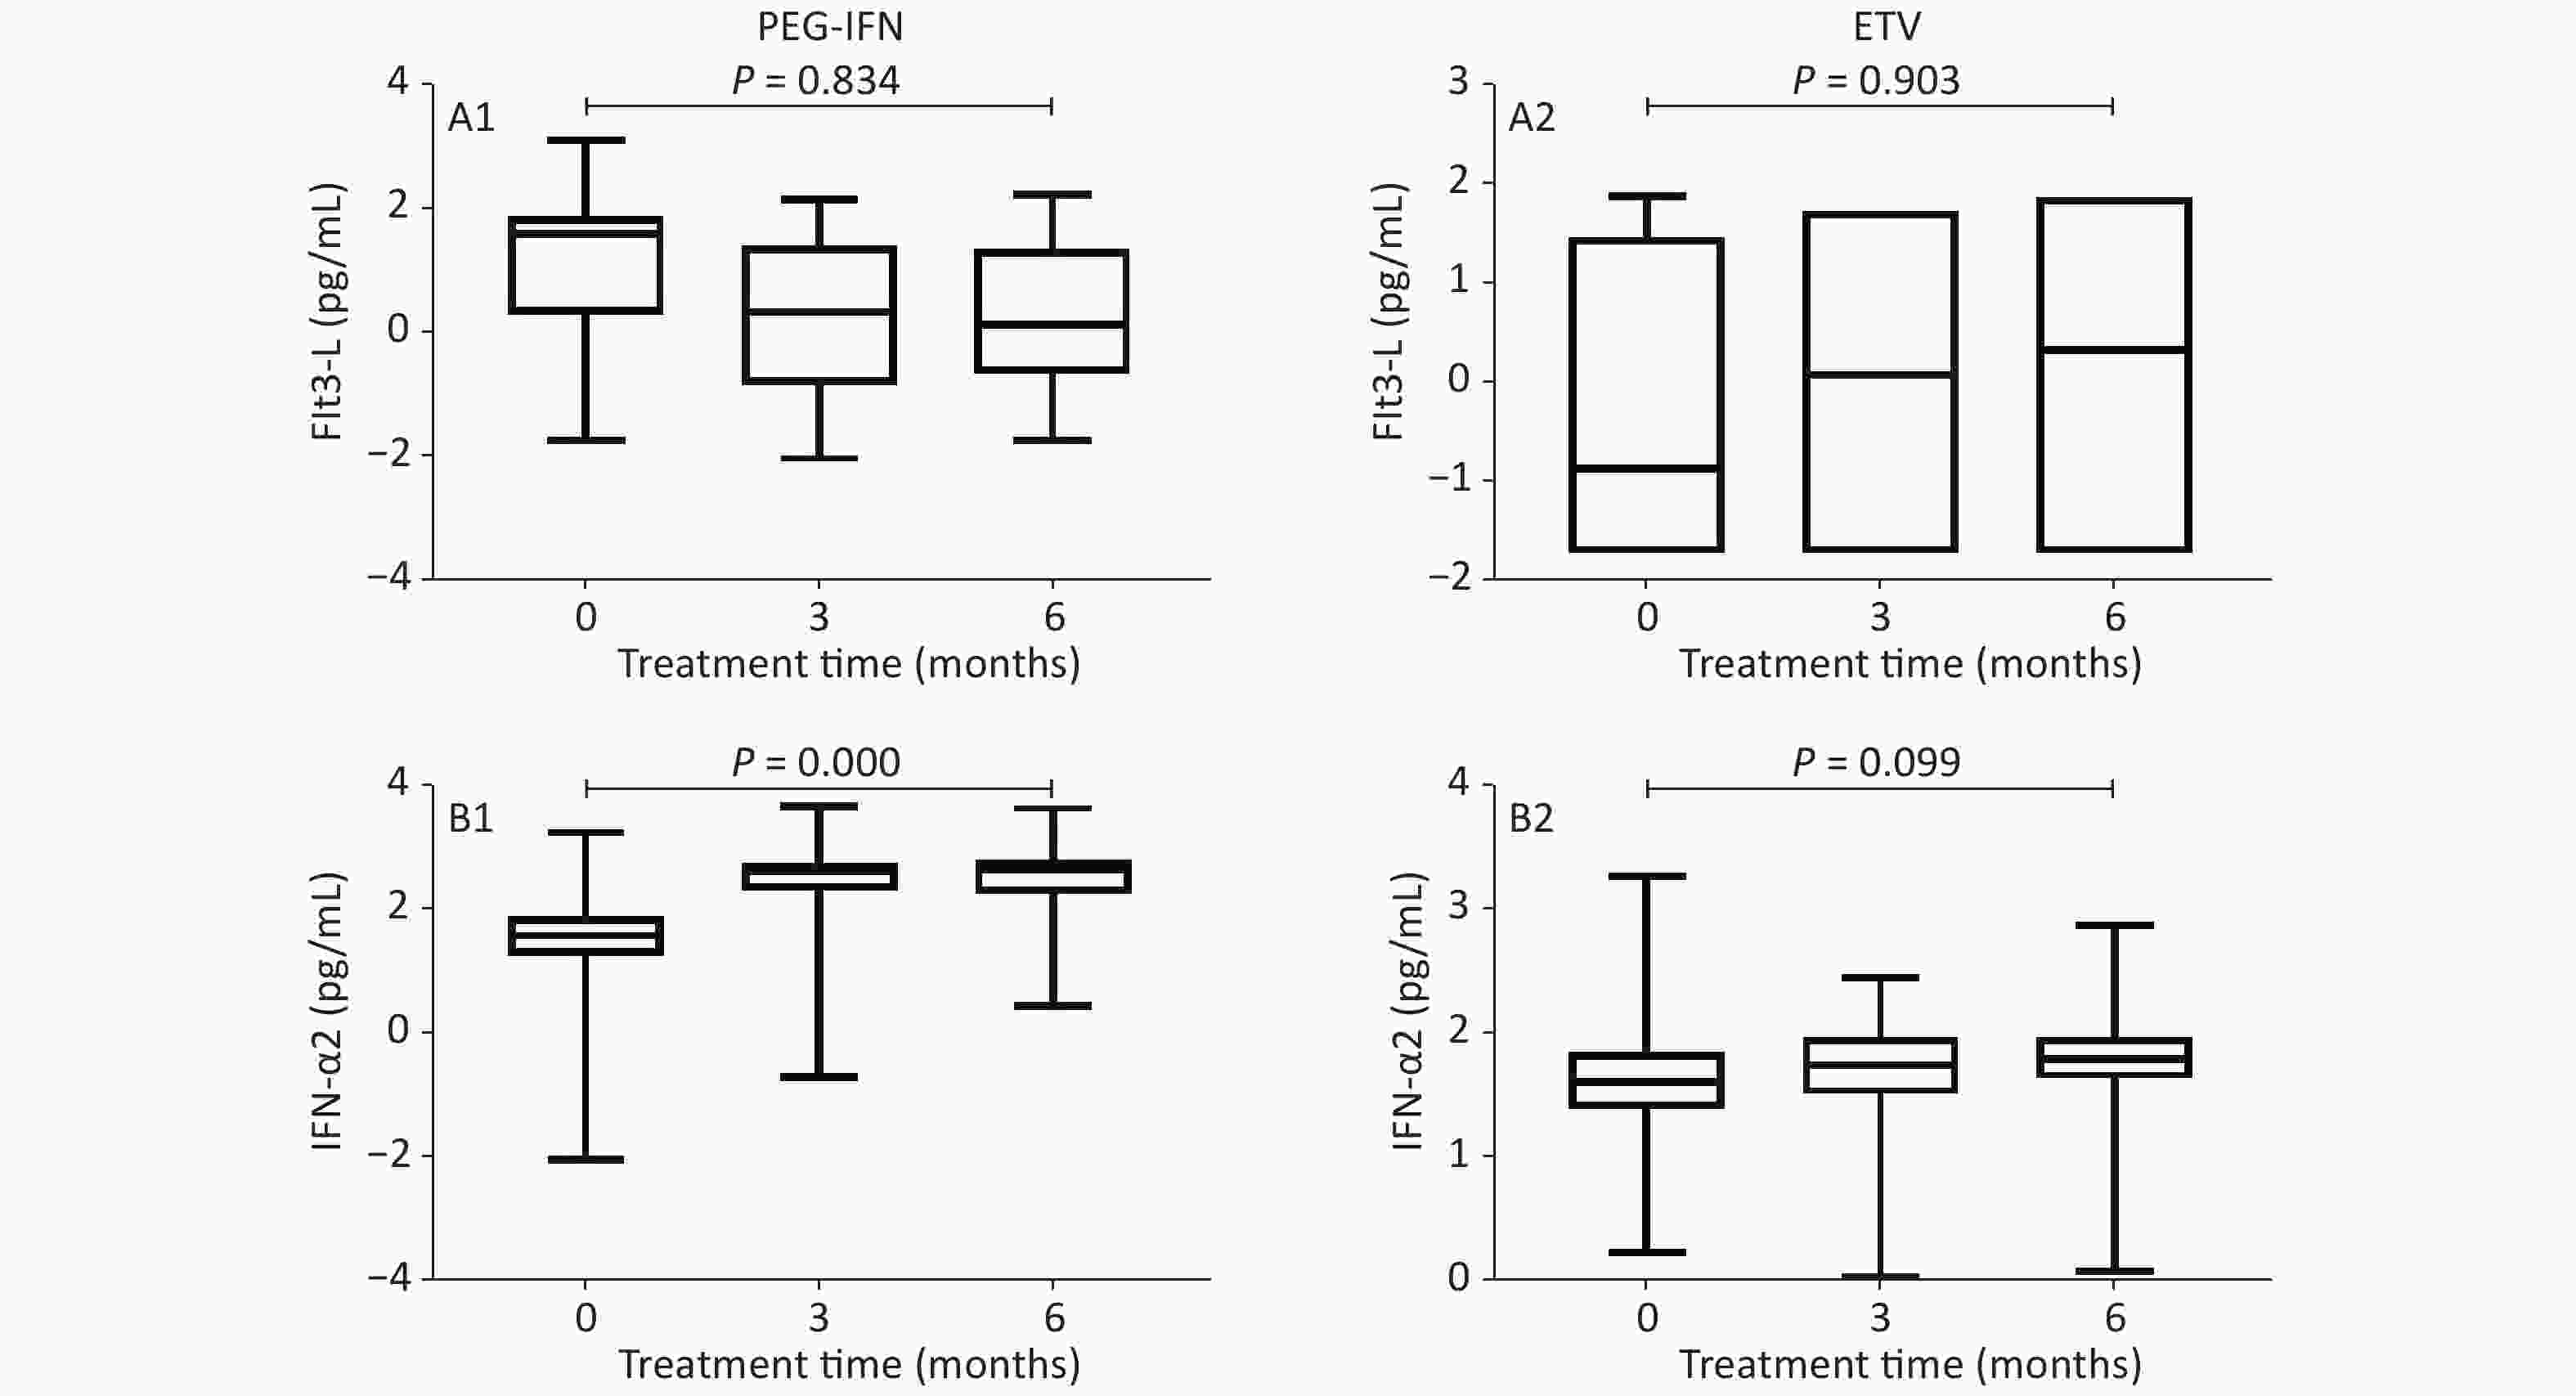
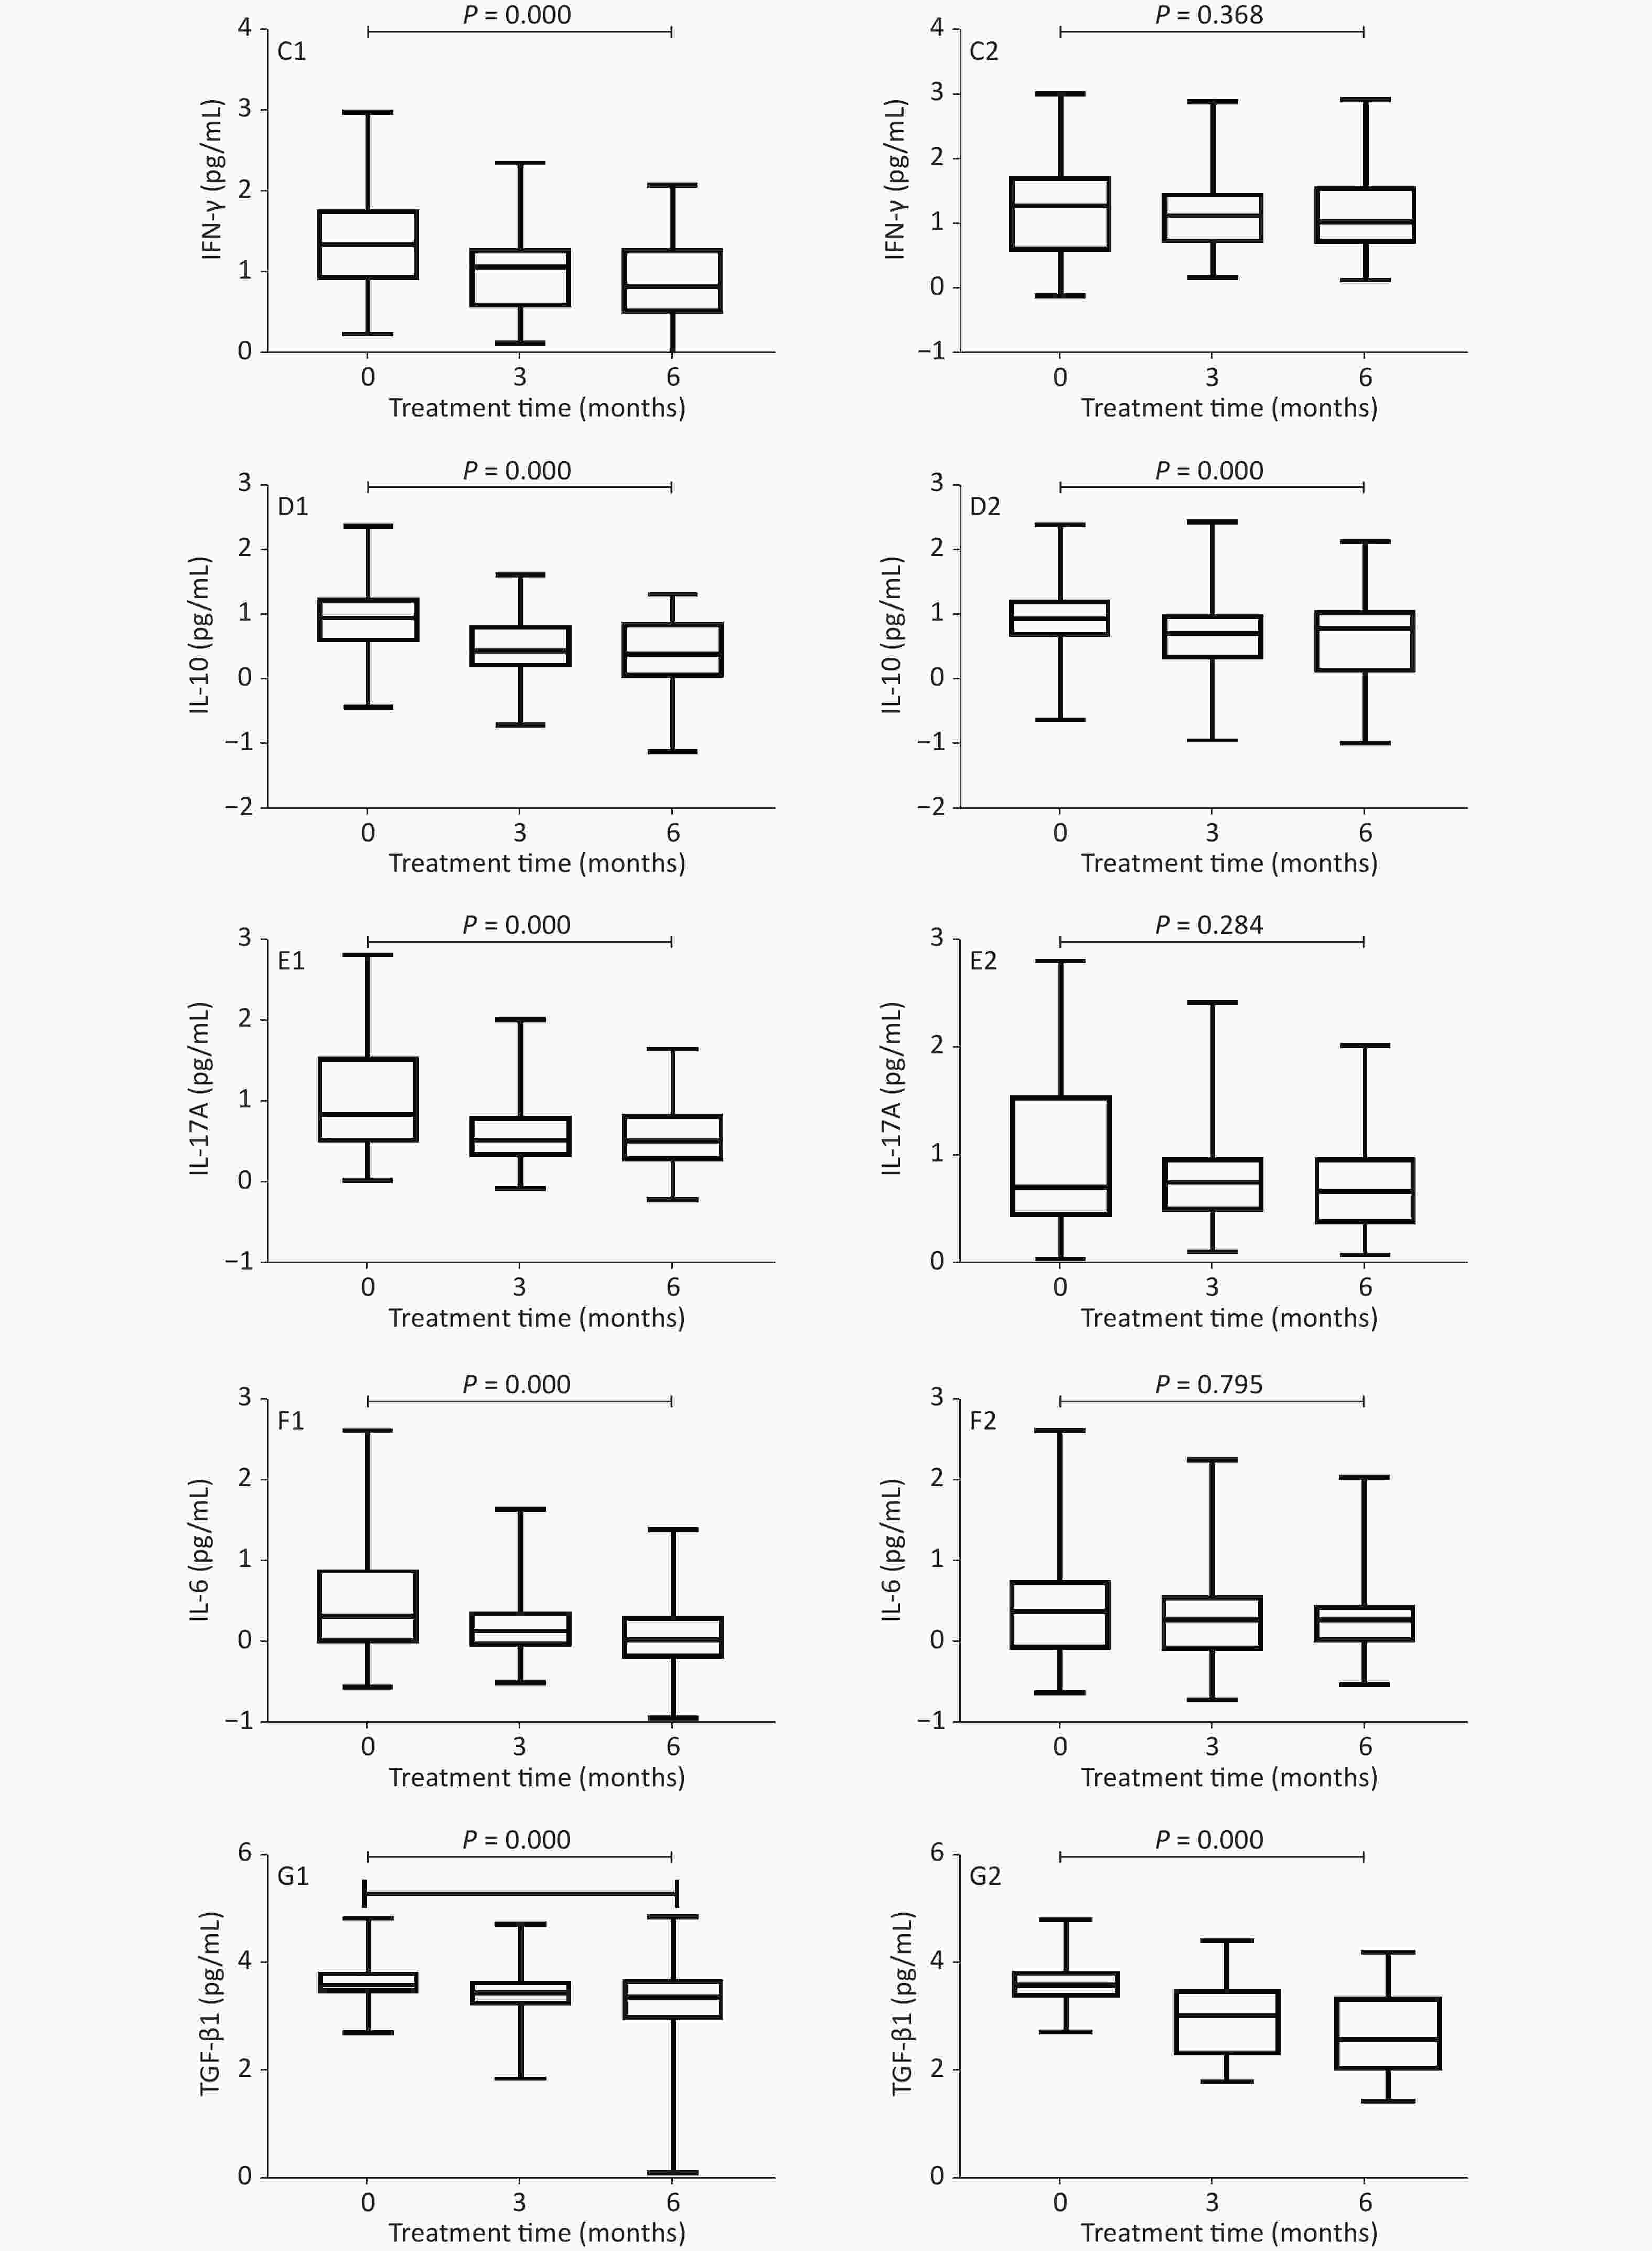
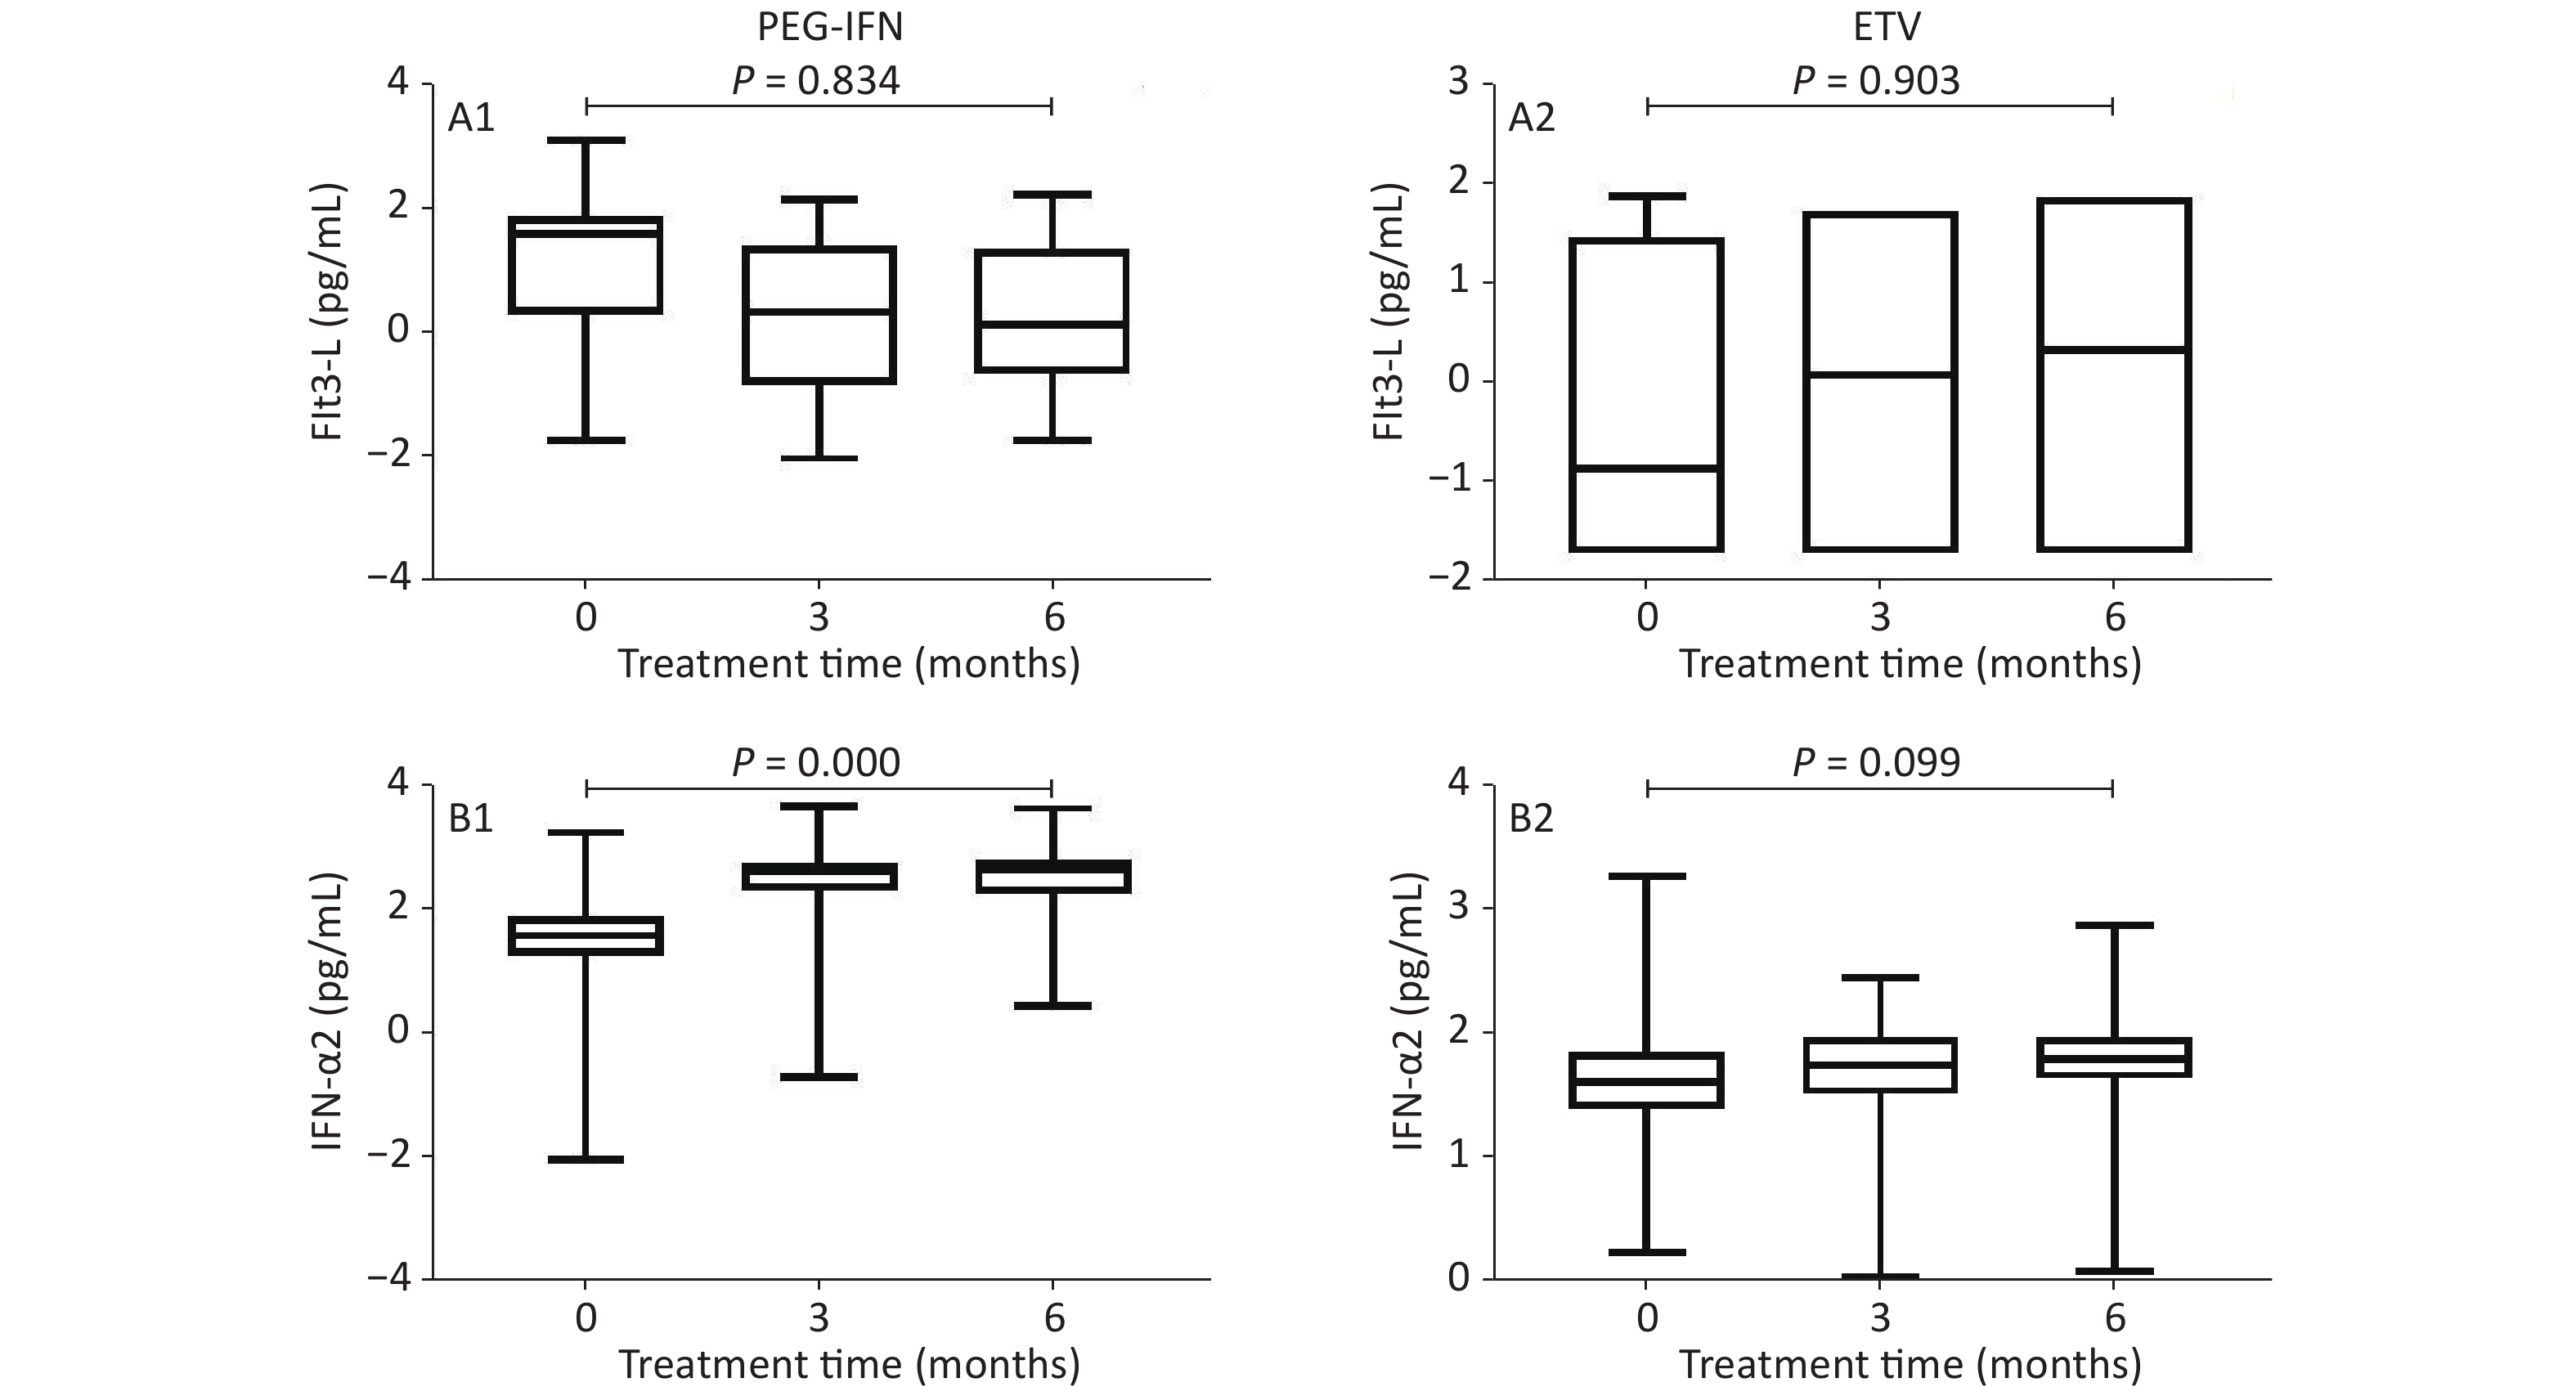
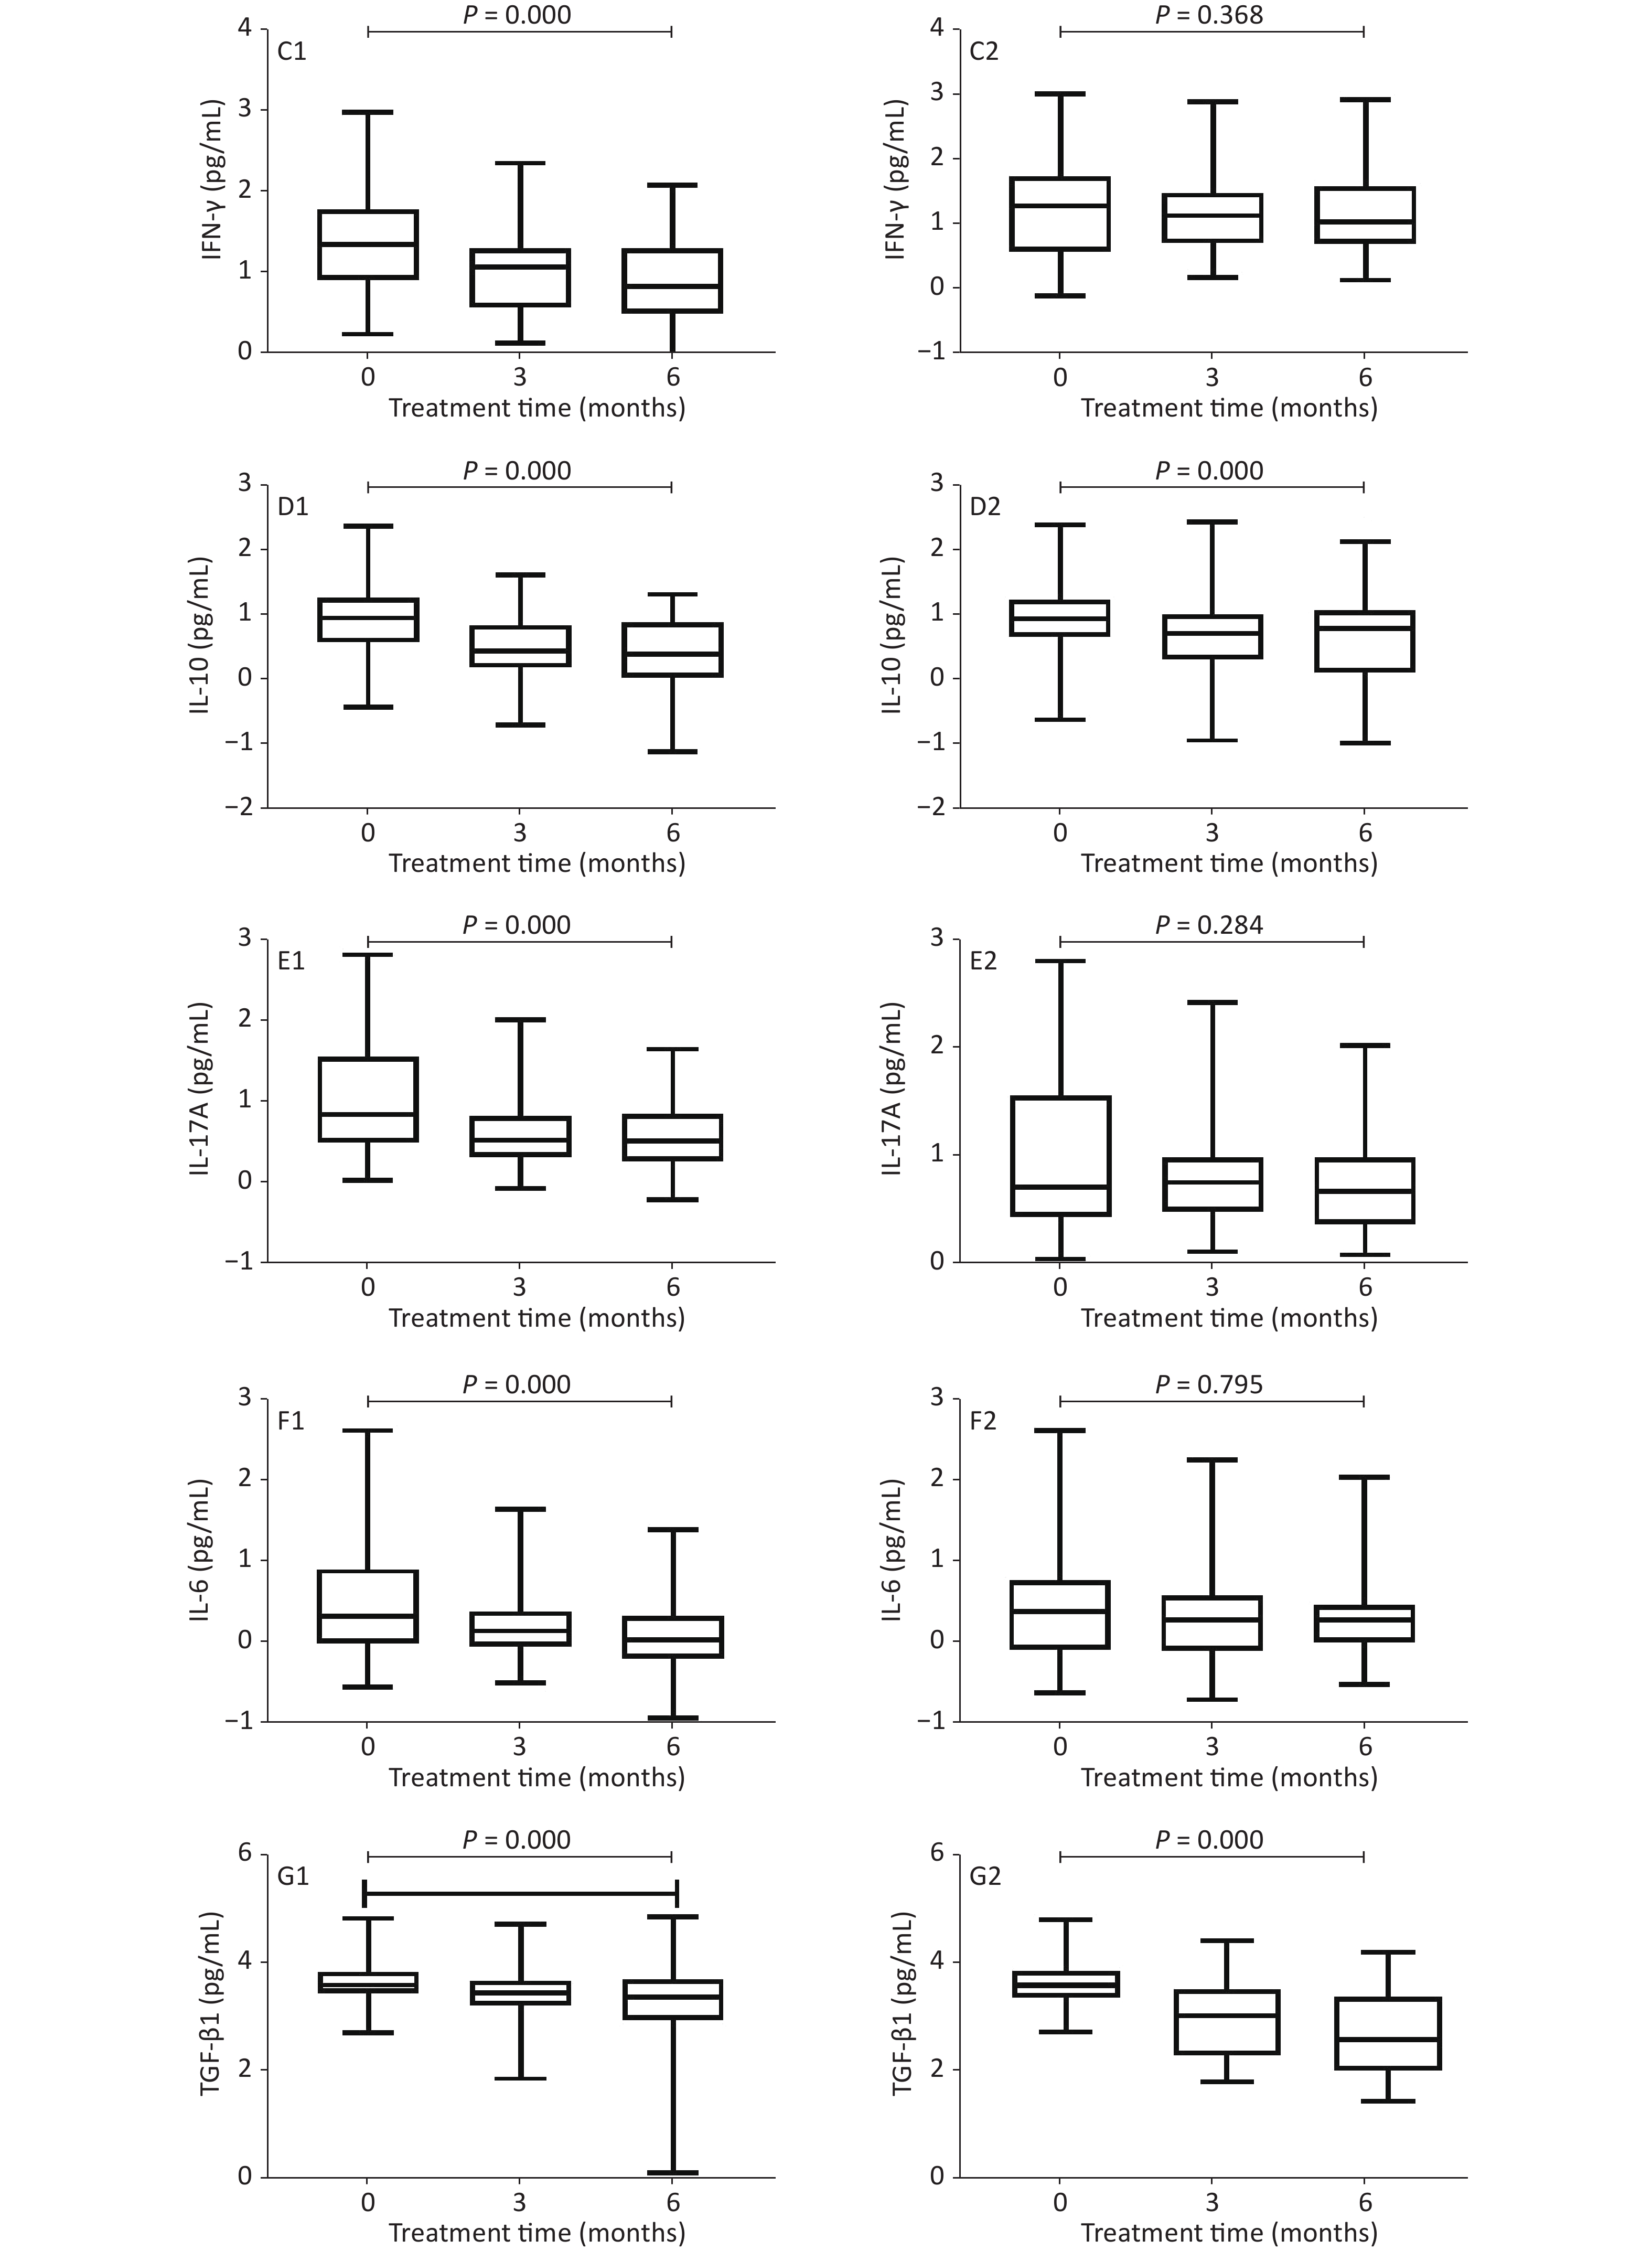
Figure 2. Comparison of cytokine levels during treatment between the PEG-IFN and ETV groups.
-
Figure 2 shows that, in the PEG-IFN group, the level of Flt3-L decreased, and the levels of IFN-γ, IL-10, IL-17A, IL-6, and TGF-β1 decreased significantly after 3 and 6 months of treatment, as compared with baseline (IFN-γ: 1.355 vs. 1.08 and 0.84 PG/mL, P < 0.001; IL-10: 0.97 vs. 0.465 and 0.41 pg/mL, respectively, P < 0.001; IL-17A: 0.855 vs. 0.54 and 0.52 PG/mL, P < 0.001; IL-6: 0.33 vs. 0.15 and 0.04 PG/mL, P < 0.001; TGF-β1: 13.61 vs. 3.47 and 3.395 PG/mL, P < 0.001); IFN‐α2 levels were significantly higher (1.62 vs. 2.66 and 2.69 PG/mL, P < 0.001). In the ETV treatment group, the levels of Flt3-L, IL-17A, and IFN‐α2 increased, while those of IFN-γ and IL-6 decreased, but there was no statistical difference (P = 0.903, 0.284, 0.099, 0.368, 0.795, respectively); IL-10 levels decreased significantly (0.96 vs. 0.82 and 0.74 pg/mL, P < 0.001); and TGF-β1 levels decreased significantly (3.61 vs. 3.05 and 2.605 PG/mL, P < 0.001).
-
We analyzed the clinical characteristics of the PEG-IFN and ETV groups during treatment (Table 2). At baseline, there was a statistically significant difference in TNF-α between the PEG-IFN and ETV groups, but there were no statistically significant differences in biochemical indexes (ALT, AST, TBil, ALB), virological indexes (HBV DNA, HBsAg, HBeAg), or other cytokine levels. After 3 months of treatment, the biochemical and virological indexes were statistically significantly different between the PEG-IFN and ETV groups. The levels of IFN‐α2, IL-10, IL-17A, IL-6, TNF-α, TGF-β1, and TGF-β3 differed significantly between the PEG-IFN and ETV groups. After 6 months of treatment, there were statistically significant differences between the PEG-IFN and ETV groups in biochemical indexes, virological indexes, and cytokines, except ALB and Flt3-L. After 9 months of treatment, the biochemical and virological indexes between the PEG-IFN group and the ETV group were significantly different. After 12 months of treatment, there was no significant difference in ALB between the PEG-IFN and ETV groups, while other biochemical and virological indexes were significantly different.
Indicators 12 weeks 24 weeks 36 weeks 48 weeks PEG-IFN ETV Z/P PEG-IFN ETV Z/P PEG-IFN ETV Z/P PEG-IFN ETV Z/P ALT (U/L)
(median, range)68.10
(48.25–86.80)33.30
(22.40–53.25)−5.796/
< 0.00143.90
(26.90–60.80)22.80
(17.75–35.95)−5.869/
< 0.00134.90
(28.05–52.93)23.00
(16.90–28.90)−6.312/
< 0.00129.80
(17.70–46.30)21.10
(15.30–28.78)−3.335/
0.001AST (U/L)
(median, range)44.00
(32.05–55.20)28.10
(19.90–35.50)−6.544/
< 0.00136.80
(26.00–55.80)22.50
(17.90–28.05)−7.036/
< 0.00131.70
(24.40–41.65)21.00
(16.60–25.40)−7.412/
< 0.00126.70
(19.78–35.60)20.80
(16.80–24.55)−3.785/
< 0.001TBil (µmol/L)
(median, range)11.80
(9.50–13.80)12.70
(9.30–18.50)−1.973/
0.0489.70
(7.90–11.90)12.30
(9.30–15.85)−4.234/
< 0.00110.25
(7.60–12.50)12.90
(9.85–15.85)−4.643/
< 0.00110.40
(8.10–12.80)12.35
(9.90–15.28)−3.779/
< 0.001ALB (g/L)
(median, range)46.30
(44.10–48.60)47.70
(44.50–49.15)−2.201/
0.02846.50
(43.90–49.00)47.65
(45.60–49.10)−1.714/
0.08747.10
(43.65–49.20)48.50
(46.18–49.90)−2.900/
0.00447.10
(45.40–50.30)48.50
(46.50–49.80)−1.271/
0.204HBsAg (log10 IU/mL)
(median, range)3.42
(2.90–3.82)3.68
(3.44–4.04)−4.220/
< 0.0013.14
(2.55–3.72)3.82
(3.34–4.02)−5.670/
< 0.0013.06
(2.49–3.77)3.76
(3.35–3.99)−5.229/
< 0.0013.33
(2.56–3.78)3.68
(3.27–3.95)−3.812/
< 0.001HBeAg (S/CO)
(median, range)48.87
(9.60–245.70)77.77
(14.80–689.49)−2.037/
0.04213.72
(2.81–64.64)63.58
(6.34–398.52)−3.926/
< 0.0017.45
(0.65–40.28)48.36
(3.90–217.58)−4.252/
< 0.0016.64
(0.56–23.95)17.24
(3.52–107.30)−4.351/
< 0.001Flt3-L (pg/mL)
(median, range)2.34
(0.16–27.82)1.25
(0.02–55.67)−0.276/
0.7971.49
(0.24–24.53)2.24
(0.02–78.56)−0.078/ 0.949 / / / / / / IFN-α2 (pg/mL) 442.33
(283.34–704.36)32.35
(25.16–72.34)−8.617/
< 0.001554.67
(267.50–661.44)97.83
(82.04–110.93)−9.051/
< 0.001/ / / / / / IFN-γ (pg/mL)
(median, range)16.20
(9.06–27.82)3.29
(1.54–139.11)−1.935/
0.05311.90
(5.48–26.40)5.07
(3.39–95.40)−2.601/
0.009/ / / / / / IL−10 (pg/mL)
(median, range)2.83
(1.23–4.82)3.62
(2.49–288.46)−2.301/
0.0213.08
(1.42–8.64)8.90
(2.01–142.65)−2.384/
0.017/ / / / / / IL-17A (pg/mL)
(median, range)4.70
(2.31–10.92)3.50
(1.61–46.01)−3.181/
0.0014.27
(2.05–10.92)9.44
(3.62–16.41)−2.648/
0.008/ / / / / / IL-6 (pg/mL)
(median, range)1.75
(0.92–2.69)1.89
(1.72–7.05)−4.066/
< 0.0011.37
(0.71–2.42)2.45
(1.44–6.66)−5.796/
< 0.001/ / / / / / TNF-α (pg/mL)
(median, range)18.14
(14.05–20.85)1.90
(0.81–3.86)−6.562/
< 0.00114.66
(11.99–18.14)1.92
(1.02–2.92)−6.715/
< 0.001/ / / / / / TGF-β1 (pg/mL)
(median, range)2959.00
(1686.75–4895.00)8.85
(6.36–14.05)−12.143/
< 0.0012487.50
(913.49–5182.25)9.58
(7.49–13.08)−11.895/
< 0.001/ / / / / / TGF-β2 (pg/mL)
(median, range)430.51
(319.85–600.46)NA NA 342.62
(270.20–463.54)NA NA / / / / / / TGF-β3 (pg/mL)
(median, range)126.86
(115.35–158.56)1125.89
(195.75–3511.06)−6.442/0.001 138.80
(115.80–160.74)406.75
(104.97–2477.75)−3.395/
0.001/ / / / / / Table 2. Comparison of clinical indicators between the PEG-IFN and ETV groups during treatment
The difference in baseline TNF-α levels was statistically significant between the PEG-IFN and ETV groups (Table 1), so we used analysis of covariance. Taking the baseline TNF-α level as a covariate to eliminate the bias of the baseline effect on the results, univariate analysis of covariance for TNF-α showed no significant difference between the two groups at 3 and 6 months after adjustment (F = 1.449, P = 0.231; F = 0.003, P = 0.956, respectively).
Supplementary Table S1 (available in www.besjournal.com) shows an analysis of the correlation between cytokines and dynamic changes in HBsAg in the PEG-IFN and ETV groups. In the PEG-IFN group, the kinetic changes in IFN-α2 and IL-10 at 3 and 6 months were significantly correlated with those of HBsAg (IFN-α2: r = −0.227, P = 0.025; r = −0.262, P = 0.009; IL-10: r = 0.366, P < 0.0012; r = 0.277, P = 0.005); in the ETV group, the kinetic changes in TNF-α at 3 and 6 months were significantly correlated with those of HBsAg (r = 0.226, P = 0.024).
Group Interaction IFN ETV 3 months 6 months 3 months 6 months r P r P r P r P Fit3L*HBsAg 0.159 0.182 −0.017 0.887 0.149 0.542 0.003 0.990 IFNα2*HBsAg −0.227 0.025 −0.262 0.009 0.007 0.945 0.075 0.461 IFNγ*HBsAg 0.084 0.408 0.101 0.319 0.137 0.175 0.035 0.734 IL10*HBsAg 0.366 < 0.0012 0.277 0.005 0.183 0.068 −0.027 0.793 IL17A*HBsAg 0.181 0.075 0.104 0.303 0.143 0.157 −0.046 0.654 IL2*HBsAg −0.117 0.606 −0.065 0.774 0.097 0.338 −0.015 0.882 IL6*HBsAg 0.173 0.089 0.140 0.167 0.097 0.337 −0.082 0.421 TNFα*HBsAg 0.226 0.338 −0.055 0.808 0.226 0.024 −0.073 0.475 TNFβ1*HBsAg −0.015 0.884 0.113 0.263 −0.105 0.300 −0.135 0.183 TNFβ3*HBsAg −0.089 0.459 −0.022 0.858 − − − − TNFβ2*HBsAg −0.110 0.359 0.023 0.850 − − − − Table S1. Correlation between cytokines and HBsAg dynamic changes in the PEG-IFN and ETV groups
Table 3 shows an analysis of the clinical characteristics of the PEG-IFN and ETV groups after 48 weeks of treatment. In the PEG-IFN group after 48 weeks of treatment, HBeAg serological disappearance occurred in 38 cases, and HBeAg seroconversion occurred in 25 cases; In the ETV group, HBeAg serological disappearance was found in 13 cases and HBeAg serological conversion in three cases. The serological disappearance rate and conversion rate between the two groups were statistically significantly different. (χ2 = 16.450; P < 0.001; χ2 = 12.324; P = 0.002). In the PEG-IFN group, HBsAg decreased ≥ 1 log10 in 23 cases, in which HBsAg disappeared in nine cases and HBs-Ab appeared in eight cases. In the ETV group, the decrease in HBsAg ≥ 1 log10 was found in seven cases, but no HBsAg disappeared. The decrease in HBsAg ≥ 1 log10 was statistically significantly different between the two groups (χ2 = 13.324; P < 0.001). There were 72 cases of complete virological response in the PEG-IFN group and 87 cases in the ETV group; this was not statistically significant between the two groups (χ2 = 12.430, P = 0.670). ALT normalization was achieved in 64 patients in the PEG-IFN group and in 90 patients in the ETV group; this was statistically significant between the two groups (χ2 = 17.850; P = 0.042).
Group PEG-IFN ETV χ2/P HBeAg disappearance (n, %) 38 (38%) 13 (13%) 16.450/< 0.001 HBsAg decline ≥ 1 log10 IU/mL (n, %) 23 (26.74%) 7 (7%) 13.324/< 0.001 Complete virological response (n, %) 72 (72%) 87 (87%) 12.430/0.670 ALT turn to normal (n, %) 64 (64%) 90 (90%) 17.850/0.042 Table 3. Comparison of clinical indicators between the PEG-IFN and ETV groups after 48 weeks of treatment
In conclusion, the levels of IFN-α2, IL-17A, and TNF-α in the PEG-IFN group were significantly higher than those in the ETV group after 3 months of antiviral therapy (P < 0.01); IL-10, IL-6, and TGF-β3 were significantly lower than those in the ETV group (P < 0.01). After 6 months of treatment, the levels of IFN-α2, IFN-γ and TNF-α in the PEG-IFN group were significantly higher than those in the ETV group (P < 0.01), while the levels of IL-6, IL-10, and TGF-β3 were significantly lower than those in the ETV group (P < 0.01). Compared with ETV treatment, the PEG-IFN group had a higher HBeAg disappearance rate, HBsAg response rate, and HBsAg disappearance rate.
-
In China, the hepatitis B virus remains a major burden on the health system[10]. Prevention of mother-to-child transmission and antiviral management of CHB patients should be the focus of hepatitis B prevention in the future[11]. Control of HBV replication and improvement of immune function are important means of alleviating liver inflammation and preventing disease progression. NA and interferons have become first-line antiviral drugs in the treatment of CHB[12,13].
The application of NA can effectively inhibit viral replication and delay the progression of liver disease, but it often recurs after discontinuation and requires long-term maintenance therapy[12,13]. The advantage of interferon therapy over NA is that a limited course of treatment allows a higher proportion of patients to achieve HBeAg seroconversion or even HBsAg disappearance[14-16]. In other studies of changes in cytokine levels during antiviral therapy, the conclusion has been consistent: cytokine levels during PEG-IFN treatment may be a potential biomarker for the selection of CHB patients who respond to PEG-IFN[17], and the changes in immune cells may be related to the response to PEG-IFN-α treatment[18]. ETV treatment significantly reduced the HBV DNA load in CHB patients, while the percentage of immune cells was not significantly different from that in untreated CHB patients[19,20]. In our study, IFN-γ, IFN‐α2, and TNF-α were significantly higher in the interferon treatment group, compared with the ETV group, and IL-6, IL-10, and TGF-β3 were significantly lower in the interferon treatment group, compared with the ETV group, at 3 and 6 months of treatment. This suggests that interferon therapy may further enhance the levels of immunostimulatory effector cytokines and reduce the levels of immunosuppressive effector cytokines; moreover, interferon therapy has the effects of improving immunity, anti-inflammation, and anti-fibrosis in the antiviral treatment of chronic hepatitis B[21]. Immune control and clinical cure are mainly achieved with interferon therapy. In our study, liver inflammation and the immunosuppressive cytokines IL-6, IL-10, and TGF-β3 were downregulated by interferon-based treatment, whereas factors IFN-α and TNF-α, which have stimulatory effects on immune cell function, were upregulated[22], and factor IFN-γ, which has a viral clearance effect, was upregulated[7]. Through the clearance of virus-infected hepatocytes, HBeAg and HBsAg decreased or even disappeared, and seroconversion occurred[21].
In our study, the level of IL-17A in the PEG-IFN group was significantly higher than that in the ETV group at 3 months and significantly lower than that in the ETV group at 6 months. IL-17A, a factor with a virus-clearing effect, first increased and then decreased in the PEG-IFN group, which may be related to the timing of immune clearance: after 6 months, the immune clearance ability of interferon decreased[5,23]. TGF-β1 was significantly higher in the PEG-IFN group than in the ETV group at 3 and 6 months during treatment. TGF-β1 is an immunosuppressive cytokine[5,24]. In fact, this abnormal phenomenon may be related to the small number of cases detected and the large dispersion of cytokines. Although the level of TGF-β1 in the PEG-IFN group was significantly higher than that in the ETV group at 3 months and 6 months, the level of TGF-β3 in the PEG-IFN group was significantly lower than that in the ETV group at 3 months and 6 months, which may suggest that interferon therapy has different effects on the function of different cell subsets. Because ETV was added to 65 patients with a poor early virological response in the PEG-IFN group, there were 72 patients with a complete virological response in the PEG-IFN group and 87 patients in the ETV group, and there was no statistically significant difference between the two groups. The ALT normalization rate of 90% in the ETV group was significantly higher than that of 64% in the PEG-IFN group after 48 weeks of treatment, which was related to the increase of immune function after PEG-IFN treatment and the elevation of ALT caused by the activity of NK cells[25].
In our study, the antiviral efficacy of PEG-IFN was significantly better than that of ETV. In the PEG-IFN group, HBeAg serological disappearance occurred in 38 cases (38%), and HBeAg seroconversion occurred in 25 cases (25%). In the ETV group, HBeAg serological disappearance was found in 13 cases (13%) and HBeAg seroconversion in three cases (3%). The serological disappearance rate and serological conversion rate of HBeAg in the PEG-IFN group were significantly higher than those in the ETV group. In the PEG-IFN group, 23 cases (23%) had a decrease of HBsAg ≥ 1 log10, in which nine cases (9%) HBsAg disappeared and eight cases (8%) HBsAb appeared. Seven patients (7%) in the ETV group experienced a decrease of HBsAg ≥ 1 log10, but there was no disappearance of HBsAg. The rate of decrease of HBsAg ≥ 1 log10 in the PEG-IFN group was significantly higher than that in the ETV group. There were no significant differences in baseline biochemical indexes, virological indexes, and cytokine levels between the two groups. However, the levels of HBsAg and HBeAg in the PEG-IFN group were significantly lower than those in the ETV group, and the levels of ALT were significantly higher in the PEG-IFN group than those in the ETV group at 3, 6, 9, and 12 months of treatment. Interferon can not only play a direct role in viral replication but also stimulate immune cell function and eliminate virus-infected liver cells. NA mainly inhibits viral replication and has no immunostimulatory effect[12-13]. Therefore, patients treated with interferon have a higher HBeAg seroconversion rate than those treated with NA and even achieve clinical cure, and patients who achieve treatment goals through interferon treatment can bring about long-term good clinical outcomes[16,21,22,26].
In the PEG-IFN group, the kinetic changes in IFN‐α2 and IL-10 at 3 and 6 months were significantly correlated with that of HBsAg. Our study has shown that during PEG-IFN therapy, the HBsAg level decreased with the increase of the IFN-α2 level, which stimulated immune cell function[7,8]. With the decrease of the IL-10 level in immunosuppressive cells, the level of HBsAg decreased. In clinical practice, interferon can effectively inhibit virus replication and reduce HBsAg and HBeAg to eliminate the inhibitory action of the virus on immune cell function and directly stimulate the maturation of immune cells and the secretion of cytokines. In the ETV treatment group, the NA had no immunomodulatory effect but only inhibited viral replication, so the changes in cytokines were not so significantly correlated with the changes in HBsAg. Therefore, immune control and functional cure can be achieved mainly through interferon therapy[14-16]. Pegylated interferon will probably play a key role in future combination therapy for a functional “CURE” For CHB.
In conclusion, our study showed changes in cytokine levels during antiviral therapy. PEG-IFN treatment was significantly better than ETV in terms of immune control and functional cure.
-
The research group thanks all study patients and the staff in the study area.
-
The manuscript was written by the authors without other writing assistance. All authors have no financial interests or conflicts of interest.
LI Ming Hui, DONG Jian Ping, YI Wei, and XIE Yao contributed to the study design. LI Ming Hui, CHEN Qi Qi, and XIE Yao contributed to the data analysis. LI Ming Hui, LU Hui Hui, YI Wei, and XIE Yao contributed to the recruitment, enrolment, and assessment of participants, as well as data collection. LIN Yan Jie, ZENG Zhan, LU Hui Hui, LU Yao, and ZHANG Lu contributed to following up with the patients. LIN Yan Jie, ZENG Zhan and LU Hui Hui managed all aspects of laboratory support. LI Ming Hui wrote the first draft of the manuscript. XIE Yao revised the manuscript and is the guarantor of the article. All authors approved the final version of the manuscript.
Changes in the Cytokine Profiles of Patients with Chronic Hepatitis B during Antiviral Therapy
doi: 10.3967/bes2021.061
Funds:
This study was funded in part by the Beijing Hospitals Authority Clinical medicine Development of special funding support [No. XMLX 201706 and XMLX 202127]; Beijing Municipal Science & Technology Commission [No.Z151100004015122]; National Science and Technology Major Project of China [No.2017ZX10203202-003, 2017ZX10201201-001-006, and 2017ZX10201201-002-006]; Beijing Science and Technology Commission [No.D161100002716002]; and Digestive Medical Coordinated Development Center of Beijing Municipal Administration of Hospitals [No.XXZ0302 and XXT28]
- Received Date: 2020-10-13
- Accepted Date: 2021-02-23
-
Key words:
- Chronic hepatitis B /
- Cytokine /
- Interferon /
- Nucleoside (nucleotide) analog
Abstract:
| Citation: | LI Ming Hui, LU Hui Hui, CHEN Qi Qi, LIN Yan Jie, ZENG Zhan, LU Yao, ZHANG Lu, DONG Jian Ping, YI Wei, XIE Yao. Changes in the Cytokine Profiles of Patients with Chronic Hepatitis B during Antiviral Therapy[J]. Biomedical and Environmental Sciences, 2021, 34(6): 443-453. doi: 10.3967/bes2021.061

|

 Quick Links
 DownLoad: