

 下载:
下载:

-
Tuberculosis (TB) is an infectious disease caused by Mycobacterium tuberculosis (Mycob. T). It remains one of the leading causes of death in developing countries, and its recent resurgence in both developed and developing countries warrants global attention. As per the WHO report, estimated TB cases increased from 9-10.4 million worldwide in the recent three years[1].
Currently, conventional smear microscopy is still the globally recommended screening tool for diagnosis of pulmonary tuberculosis in clinical practice; it is rapid, relatively simple, and inexpensive[2]. This method is particularly recommended in low- or middle-income regions and countries. It is used widely for its simple procedures and cheap equipment. However, conventional microscopy (CM) screening after ziehl-neelsen (ZN) staining of acid-fast bacilli (AFB) is labor intensive[3], and has many shortcomings. For example, assay sensitivity varies greatly from laboratory to laboratory. A skilled laboratory technician is expected to spend at least 5 min to observe 100 microscopic fields, which limits the number of slides that can be screened in a day[4]. It is clearly stated in the guidelines that a single technician cannot read more than 25 ZN slides per day in order to ensure assay quality[5]. In addition, 300 microscope fields are required to be read per negative slide and 100 fields are required to be read per positive slide. This places heavy workloads on the laboratory, and can lead to headaches and dizziness for the staff, which contribute to significant variability in results[6, 7]. In addition, laboratories often fail to detect TB cases due to the lack of trained technicians, as turnover rate for many countries, including China, is high.
Automation in staining and microscopy for AFB screening aims to speed up the screening process, improve its sensitivity, and reduce its reliance on technicians. In the past, scientists tried to develop automatic staining and scanning systems in order to overcome the shortcomings of conventional microscopy[8, 9]. Unfortunately, these systems failed due to bad test performance. An automated sputum smear microscopy system was developed for tuberculosis diagnosis in 2012. The system showed higher sensitivity as compared with that of conventional microscopy (75.8% vs. 52.8%); however, specificity was markedly low (43.5% vs. 98.6%)[10]. The new commercial Mycob. T Stainer and Scanner (HOWSOME, China), which is composed of an automated staining machine, an automated microscope, and a computer system, was designed for automatic AFB detection. To validate the performance of the Mycob. T Stainer and Scanner (MTSS), we conducted this project in two prefectural hospitals in China.
-
In the beginning of the study, we organized a two-day training course on solid culture and the MTSS method for the staff members of Anhui Provincial Chest Hospital and Linyi People's Hospital. A one-week pilot study was conducted before case recruitment. During the study, we also administered a user-acceptability questionnaire to establish feasibility of the MTSS method.
-
All TB suspects were enrolled at outpatient clinics in these two hospitals from April to August 2016. For laboratory tests, three sputum specimens were collected from each subject. Each sputum specimen was placed on two slides by the direct smear method. The leftover specimens were stored at 4 ℃.
-
One slide was stained by the ZN method and was manually read by CM under immersion oil field. At least 300 microscope fields per negative slide and 100 fields per positive slide were observed. Grading of AFB density on the slide was as follows: negative (0 AFB/300 fields), scanty (1-8 AFB/300 fields), 1+ (3-9 AFB/100 fields), 2+ (1-9 AFB/10 field), 3+ (1-9 AFB/ field), 4+ (≥ 10 AFB/ field)[11].
-
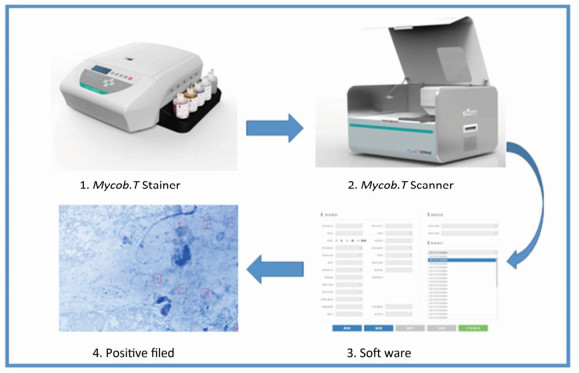
The second slide was automatically stained by steamed ZN liquid in the Mycob. T Stainer. The slide was the transferred onto the Mycob. T Scanner platform for automatic screening (Figure 1). Immersion oil was first dropped onto the slide; this allowed the scanner to automatically find the field, and to look for AFBs based on image comparisons with the image data bank. Microscopic field of the scanner was moved by a motor that was operated by a computer. Three hundred fields were observed in each slide. Every field containing bacilli was imaged and saved for manual rechecking. The computer then produced either a positive or a negative report based on image analysis. All the positive pictures were saved for rechecking.

Figure 1. Work flow of Mycob. T stainer and scanner.
-
Samples (2 mL) from each sputum specimen were decontaminated with 4% NaOH for 15 min. Specimens (0.1 mL) were inoculated into Lowenstein-Jensen (L-J) tubes, which were then incubated for eight weeks in a 37 ℃ incubator[12].
-
For quality assurance, provincial TB reference laboratory conducted external quality assessment on solid culture and smear microscopy every two months. In addition, all staff attended a laboratory training course in the beginning of the project.
-
At the end of the evaluation stage, 50 smear positive and 50 smear negative slides in each hospital were randomly selected to be scanned again for reproducibility tests.
-
All data were entered into an Excel database, and statistical analysis was performed using the SPSS 22.0 software. A Chi-square test was used to compare detection rates of different methods. P < 0.05 was considered significant.
-
All the specimens we used were useless samples obtained from clinic laboratory after routine examination. The study was approved by the Ethical Committees of the Chinese Anti-TB Association.
-
A total of 1, 515 TB suspects were enrolled in this study; 52% of the suspects (n = 788) provided three sputum specimens; 47.9% (n = 725) provided two sputum specimens; 0.1% (n = 2) provided only one sputum specimen. As a result, 3, 816 sputum specimens were collected.
-
ATB detection analysis was carried out via MTSS and CM in the 3, 816 specimens. The overall positive rate of MTSS was 27.96%, which was higher as compared with that of CM, which yielded an average positive rate of 26.83%. However, these differences were insignificant in both hospitals (P = 0.228 and P = 0.611) (Table 1).
Table 1. Comparison of AFB Detection Rate by MTSS and CM
Hospital MTSS (%) CM (%) χ2 P-Value Anhui Provincial Chest Hospital 20.95 (328/1, 566) 19.22 (301/1, 566) 1.45 0.228 Linyi People's Hospital 32.84 (739/2, 250) 32.13 (723/2, 250) 0.26 0.611 Total 27.96 (1, 067/3, 816) 26.83 (1, 024/3, 816) 1.218 0.27 -
The overall concordance rate between MTSS and CM was 95.9% (3, 661/3, 816). MTSS detected more scanty slides and 2+ slides while CM reported more 1+ and 3+ slides. A total of 155 specimens had discrepant results between MTSS and CM. Among them, 99 slides were MTSS positive but CM negative, while 56 slides that were MTSS negative were reported as positive by CM (Table 2). Approximately 92% (23/25) of the MTSS negative, but CM positive specimens, in Linyi Hospital were found to be culture positive, and 45% (14/31) of MTSS negative, but CM positive specimens, in Anhui Hospital were culture positive (Table 3).
Table 2. Comparison of Microscopy Results between MTSS and CM
Hospital MTSS Scanty CM 1+ 2+ 3+ 4+ Negative Subtotal Anhui Provincial Chest Hospital Scanty 17 30 8 7 1 33 96 1+ 6 21 13 3 5 11 59 2+ 3 44 29 11 15 12 121 3+ 5 10 8 3 6 1 34 4+ 3 1 2 1 6 1 18 Negative 16 12 1 1 1 1, 207 1, 238 Subtotal 35 118 61 26 34 1, 265 1, 566 Linyi People's Hospital Scanty 12 48 12 4 0 26 102 1+ 8 66 39 16 9 7 145 2+ 2 77 83 94 38 8 302 3+ 0 7 26 47 18 0 98 4+ 0 3 12 31 46 0 92 Negative 8 15 1 1 0 1, 486 1, 511 Subtotal 30 216 173 193 111 1, 527 2, 250 Total Scanty 29 78 20 11 1 59 198 1+ 14 87 52 19 14 18 204 2+ 5 121 112 105 53 20 423 3+ 5 17 34 50 24 1 132 4+ 3 4 14 32 52 1 110 Negative 24 27 2 2 1 2, 693 2, 749 Total 65 334 234 219 145 2, 792 3, 816 Table 3. Analysis of Discrepant Results between MTSS and CM
Hospital Solid Culture Positive Negative Subtotal Anhui Provincial Chest Hospital MTSS positive, CM negative 25 33 58 MTSS negative, CM positive 14 17 31 Subtotal 39 50 89 Linyi People's Hospital MTSS positive, CM negative 29 12 41 MTSS negative, CM positive 23 2 25 Subtotal 52 14 66 Total MTSS positive, CM negative 54 45 99 MTSS negative, CM positive 37 19 56 Total 91 64 155 -
Fifteen specimens were excluded from analysis due to culture contamination. In total, data from 3, 801 specimens were used for performance analysis. Compared to culture, the general sensitivity and specificity of MTSS was 78.9% and 93.9%, respectively. CM showed lower sensitivity (77.4%) but higher specificity (95.0%) as compared with those of MTSS. Although CM demonstrated higher positive predictive value of 86.9%, MTSS showed a better negative predictive value of 91.2% (Table 4).
Table 4. Diagnostic Performance of MTSS and CM for Detection of TB Compared to Culture Methods
Sites Sensitivity (%) Specificity (%) PPV (%) NPV (%) Anhui Provincial Chest Hospital Correct No./Total No. (%) 222/349 (63.6) 1, 105/1, 211 (91.2) 222/328 (67.7) 1, 105/1, 232 (89.7) 95% CI 58.6-68.7 89.7-92.8 62.6-72.7 88.0-91.4 Linyi People's Hospital MTSS Correct No./Total No. (%) 681/795 (85.7) 1, 391/1, 446 (96.2) 681/736 (92.5) 1, 391/1, 505 (92.4) 95% CI 83.2-88.1 95.2-97.2 90.6-94.4 91.1-93.8 Total Correct No./Total No. (%) 903/1, 144 (78.9) 2, 496/2, 657 (93.9) 903/1, 064 (84.9) 2, 496/2, 737 (91.2) 95% CI 76.6-81.3 93.0-94.8 82.7-87.0 90.1-92.3 Anhui Provincial Chest Hospital Correct No./Total No. (%) 211/349 (60.5) 1, 121/1, 211 (92.6) 211/301 (70.1) 1, 121/1, 259 (89.0) 95% CI 55.3-65.6 91.1-94.0 64.9-75.3 87.3-90.8 Linyi People's Hospital CM Correct No./Total No. (%) 675/795 (84.9) 1, 401/1, 446 (96.9) 675/720 (93.8) 1, 401/1, 521 (92.1) 95% CI 82.4-87.4 96.0-97.8 92.0-95.5 90.8-93.5 Total Correct No./Total No. (%) 886/1, 144 (77.4) 2, 523/2, 657 (95.0) 886/1, 020 (86.9) 2, 523/2, 781 (90.7) 95% CI 75.0-79.9 94.1-95.8 84.8-88.9 89.6-91.8 Note. PPV, positive predictive value; NPV, negative predictive value. -
From a total of 200 slides, 195 received same results as the original diagnosis, resulting in an accordance rate of 97.5%. All of five discrepant slides were minor grade differences. No false positive or false negative result was observed.
-
Six laboratory staffs completed questionnaires on the acceptability of the MTSS method. According to the survey, all staffs believed that the MTSS procedure was easier to perform, five (83%) individuals noted that the price of the MTSS test was expensive, and six (100%) individuals expressed that they would like to use MTSS instead of CM.
-
Our study showed that MTSS has better performance for TB screening as compared with that of conventional microscopy. It is the very first automatic staining and scanning system that has been evaluated on a large scale in China.
Recently, many novel molecular assays have been developed for diagnosis of tuberculosis; a number of these methods showed good performance in clinical validation for TB diagnosis[13, 14]. Some tests are very popular due to simple operation and high sensitivity[15, 16]. However, effective changes to conventional microscopy are still limited[17].
MTSS is the first local automatic product that may replace conventional microscopy. Our results indicated that the detection rate of MTSS is higher as compared with that of conventional microscopy. While differences in detection rate between the two methods are insignificant, MTSS functions automatically; this lessens the workload on staffs in sputum smear microscopy. At the same time, it takes only two minutes for each slide to be scanned by MTSS. In addition, the automatic staining and scanning process leads to low bias by omitting human error. Lastly, MTSS also improved test quality.
MTSS offers many advantages in screening smear slides. Our data indicated that MTSS can detect more low-signal positive slides as compared with conventional microscopy. Among the 198 specimens reported as scanty positive by MTSS, conventional microscopy missed 59 specimens. Another 40 high-positive MTSS specimens were also missed by conventional microscopy. Results indicated that 54 specimens were culture positive. These results also showed that conventional microscopy may miss some positive TB cases.
While MTSS demonstrated higher sensitivity than conventional microscopy, it showed lower positive predictive value as compared with CM. The specificity of conventional microscopy was 95.0%, which was a little higher than MTSS. However, the negative predictive value of CM was lower as compared with that of MTSS. The major challenge in a screening test is missing cases; once the doctor excludes the suspect, they usually will not conduct further accuracy diagnosis. In this study, although MTSS showed higher NPV, nearly 66% (37/56) of MTSS negative but CM positive specimens were culture positive. These results indicated that a few culture positive specimens were still missed by MTSS tests. Further improvements on MTSS can be carried out.
It was reported that sensitivity of conventional microscopy varied greatly between 20% to > 80%[18-20]. In the current study, although the sensitivity of conventional microscopy in both hospitals was relatively higher, there was big difference in TB detection rate. This may be because the patients at the outpatient clinics were different; patients at the Anhui Provincial Chest Hospital were from the entire province, while patients at Linyi People's hospital were only from the local city.
The reproducibility of MTSS was excellent, with a concordance rate of 97.5%. All five discrepant results belonged to the grades scanty positive and 1+ positive. The result indicated that the MTSS method produces well-stained slides with high homogeneity, and scanning is conduced automatically without bias. All key operational steps were conducted automatically, which avoided human-induced variations. Further studies are currently conducted to explore the clinical value of MTSS.
-
MTSS demonstrated high positive rate, good performance, and simple operation with low variability among different laboratories. It can play an important role in improving TB screening in peripheral laboratories. However, MTSS still needs to be validated in more laboratories and under field conditions.
-
The authors want to thank the staff in the clinical laboratories of Anhui Provincial Chest Hospital and Linyi People's Hospital for their hard work.
-
The authors declare that they have no competing interests.
doi: 10.3967/bes2018.078
Evaluation of the New Automatic Mycob.T Stainer and Scanner for Detecting Acid-fast Bacilli in China
-
Abstract:
Objective To validate the performance of Mycob. T Stainer and Scanner (MTSS) for detecting acid-fast bacilli (AFB). Methods A total of 3, 816 sputum samples from 1, 515 tuberculosis (TB) suspects were tested at the Anhui Provincial Chest Hospital and the Linyi People's Hospital from April-August, 2016. Each specimen was placed on two smear slides. One slide was stained by the ziehl-neelsen (ZN) method to be read by conventional microscopy (CM). The other slide was stained and scanned by MTSS. All specimens were decontaminated with 4% NaOH, and then inoculated into solid culture. The performance of MTSS was assessed. Results MTSS produced higher average positivity rate (27.96%) as compared with the CM (26.83%). The overall sensitivity and specificity of MTSS were 78.9% and 93.9%, respectively. The sensitivity and specificity of CM was 77.4% and 95.0%, respectively. Conclusion MTSS exhibited a favorable performance in the detection of AFB. It may be an alternative to CM for screening TB. -
Key words:
- Tuberculosis /
- Automatic /
- Stainer /
- Scanner
-
Table 1. Comparison of AFB Detection Rate by MTSS and CM
Hospital MTSS (%) CM (%) χ2 P-Value Anhui Provincial Chest Hospital 20.95 (328/1, 566) 19.22 (301/1, 566) 1.45 0.228 Linyi People's Hospital 32.84 (739/2, 250) 32.13 (723/2, 250) 0.26 0.611 Total 27.96 (1, 067/3, 816) 26.83 (1, 024/3, 816) 1.218 0.27  下载: 导出CSV
Table 2. Comparison of Microscopy Results between MTSS and CM
Hospital MTSS Scanty CM 1+ 2+ 3+ 4+ Negative Subtotal Anhui Provincial Chest Hospital Scanty 17 30 8 7 1 33 96 1+ 6 21 13 3 5 11 59 2+ 3 44 29 11 15 12 121 3+ 5 10 8 3 6 1 34 4+ 3 1 2 1 6 1 18 Negative 16 12 1 1 1 1, 207 1, 238 Subtotal 35 118 61 26 34 1, 265 1, 566 Linyi People's Hospital Scanty 12 48 12 4 0 26 102 1+ 8 66 39 16 9 7 145 2+ 2 77 83 94 38 8 302 3+ 0 7 26 47 18 0 98 4+ 0 3 12 31 46 0 92 Negative 8 15 1 1 0 1, 486 1, 511 Subtotal 30 216 173 193 111 1, 527 2, 250 Total Scanty 29 78 20 11 1 59 198 1+ 14 87 52 19 14 18 204 2+ 5 121 112 105 53 20 423 3+ 5 17 34 50 24 1 132 4+ 3 4 14 32 52 1 110 Negative 24 27 2 2 1 2, 693 2, 749 Total 65 334 234 219 145 2, 792 3, 816
下载: 导出CSV
Table 3. Analysis of Discrepant Results between MTSS and CM
Hospital Solid Culture Positive Negative Subtotal Anhui Provincial Chest Hospital MTSS positive, CM negative 25 33 58 MTSS negative, CM positive 14 17 31 Subtotal 39 50 89 Linyi People's Hospital MTSS positive, CM negative 29 12 41 MTSS negative, CM positive 23 2 25 Subtotal 52 14 66 Total MTSS positive, CM negative 54 45 99 MTSS negative, CM positive 37 19 56 Total 91 64 155
下载: 导出CSV
Table 4. Diagnostic Performance of MTSS and CM for Detection of TB Compared to Culture Methods
Sites Sensitivity (%) Specificity (%) PPV (%) NPV (%) Anhui Provincial Chest Hospital Correct No./Total No. (%) 222/349 (63.6) 1, 105/1, 211 (91.2) 222/328 (67.7) 1, 105/1, 232 (89.7) 95% CI 58.6-68.7 89.7-92.8 62.6-72.7 88.0-91.4 Linyi People's Hospital MTSS Correct No./Total No. (%) 681/795 (85.7) 1, 391/1, 446 (96.2) 681/736 (92.5) 1, 391/1, 505 (92.4) 95% CI 83.2-88.1 95.2-97.2 90.6-94.4 91.1-93.8 Total Correct No./Total No. (%) 903/1, 144 (78.9) 2, 496/2, 657 (93.9) 903/1, 064 (84.9) 2, 496/2, 737 (91.2) 95% CI 76.6-81.3 93.0-94.8 82.7-87.0 90.1-92.3 Anhui Provincial Chest Hospital Correct No./Total No. (%) 211/349 (60.5) 1, 121/1, 211 (92.6) 211/301 (70.1) 1, 121/1, 259 (89.0) 95% CI 55.3-65.6 91.1-94.0 64.9-75.3 87.3-90.8 Linyi People's Hospital CM Correct No./Total No. (%) 675/795 (84.9) 1, 401/1, 446 (96.9) 675/720 (93.8) 1, 401/1, 521 (92.1) 95% CI 82.4-87.4 96.0-97.8 92.0-95.5 90.8-93.5 Total Correct No./Total No. (%) 886/1, 144 (77.4) 2, 523/2, 657 (95.0) 886/1, 020 (86.9) 2, 523/2, 781 (90.7) 95% CI 75.0-79.9 94.1-95.8 84.8-88.9 89.6-91.8 Note. PPV, positive predictive value; NPV, negative predictive value.
下载: 导出CSV
-
[1] World Health Organization. Global tuberculosis report 2016. Geneva, Switzerland: WHO; 2016. [2] Stop TB Department. Global tuberculosis control: WHO report 2011. Geneva, Switzerland: WHO; 2011. [3] Steingart KR, Henry M, Ng V, et al. Fluorescence versus conventional sputum smear microscopy for tuberculosis:a systematic review. Lancet Infect Dis, 2006; 6, 570-81. doi: 10.1016/S1473-3099(06)70578-3 [4] Sadaphal P, Rao J, Comstock GW, et al. Image processing techniques for identifying Mycobacterium tuberculosis in Ziehl-Neelsen stains. Int J Tuberc Lung Dis, 2008; 12, 579-82. http://www.ncbi.nlm.nih.gov/pubmed/18419897 [5] Rieder HL, Van Deun A, Kam KM, et al. Priorities for tuberculosis bacteriology services in low-income countries. Paris, France: International Union against Tuberculosis and Lung Disease, 2007. [6] Van Deun A, Salim AH, Cooreman E, et al. Optimal tuberculosis case detection by direct sputum smear microscopy:how much better is more? Int J Tuberc Lung Dis, 2002; 6, 222-30. http://d.old.wanfangdata.com.cn/NSTLQK/NSTL_QKJJ021743524/ [7] Nguyen TN, Wells CD, Binkin NJ, et al. The importance of quality control of sputum smear microscopy:the effect of reading errors on treatment decisions and outcomes. Int J Tuberc Lung Dis, 1999; 3, 483-7. http://www.ncbi.nlm.nih.gov/pubmed/10383060 [8] Khutlang R, Krishnan S, Whitelaw A, et al. Automated detection of tuberculosis in Ziehl-Neelsen-stained sputum smears using two one-class classifiers. J Microsc, 2010; 237, 96-102. doi: 10.1111/(ISSN)1365-2818 [9] Veropoulos K, Learmonth G, Campbell C, et al. Automated identification of tubercle bacilli in sputum. A preliminary investigation. Anal Quant Cytol Histol, 1999; 21, 277-82. http://www.ncbi.nlm.nih.gov/pubmed/10560504 [10] James JL, Violet NC, Minty M, et al. "Proof-Of-Concept" Evaluation of an Automated Sputum Smear Microscopy System for Tuberculosis Diagnosis. PLoS One, 2012; 7, e50173. doi: 10.1371/journal.pone.0050173 [11] Zhao YL. China tuberculosis prevention and control program 112 The International Journal of Tuberculosis and Lung Disease standardized operating and quality assurance for sputum smear microscopy manual. Beijing, China: China Centers for Disease Control, 2009. [12] Kent PT, Kubica GP. Public health mycobacteriology: a guide for the level Ⅲ laboratory. Atlanta, GA: Centers for Disease Control, 1985. [13] Li Q, Dong HY, Pang Y, et al. Multicenter evaluation of the molecular line probe assay for multidrug resistant mycobacterium tuberculosis detection in China. Biomed Environ Sci, 2015; 28, 464-7. http://www.wanfangdata.com.cn/details/detail.do?_type=perio&id=bes201506010 [14] Li Q, Bao XD, Liu Y, et al. Comparison of two molecular assays for detecting smear negative pulmonary tuberculosis. Biomed Environ Sci, 2016; 29, 248-53. http://www.wanfangdata.com.cn/details/detail.do?_type=perio&id=bes201604002 [15] Ou XC, Xia H, Li Q, et al. A feasibility study of the Xpert MTB/RIF test at the peripheral level laboratory in China. Int J Infect Dis, 2015; 31, 41-6. doi: 10.1016/j.ijid.2014.09.011 [16] Ou XC, Song YY, Zhao B, et al. A multicenter study of Cross-priming Amplification for tuberculosis diagnosis at peripheral level in China. Tuberculosis, 2014; 94, 428-33. doi: 10.1016/j.tube.2014.04.006 [17] Panicker RO, Soman B, saini G, et al. A Review of Automatic Methods Based on Image Processing Techniques for Tuberculosis Detection from Microscopic Sputum Smear Images. J Med Syst, 2016; 40, 17. doi: 10.1007/s10916-015-0388-y [18] Behr MA, Warren SA, Salamon H, et al. Transmission of mycobacterium tuberculosis from patients smear-negative for acid fast bacilli. Lancet, 1999; 353, 444-9. doi: 10.1016/S0140-6736(98)03406-0 [19] Aber VR, Allen BW, Mitchison DA, et al. Quality control in tuberculosis bacteriology. 1. Laboratory studies on isolated positive cultures and the efficiency of direct smear examination. Tubercle, 1980; 61, 123-33. doi: 10.1016/0041-3879(80)90001-X [20] Urbanczik R. Present position of microscopy and of culture in diagnostic mycobacteriology. Zentralbl Bakteriol Mikrobiol Hyg, 1985; 260, 81-7. http://europepmc.org/abstract/MED/3933212 -

 点击查看大图
图(1) / 表ll (4)
计量
- 文章访问数: 1863
- HTML全文浏览量: 366
- PDF下载量: 48
- 被引次数: 0

 Quick Links