

 下载:
下载:

-
Physical activity (PA) offers a number of health benefits for children, including improved physical fitness (aerobic fitness, muscle strength, and endurance), which promotes bone health, maintains a healthy weight, and improves blood pressure and cholesterol levels[1-3]. Furthermore, PA habits developed during childhood and their associated health benefits may be carried forward into adulthood[4]. However, data from the 2016 World Health Organization (WHO) survey suggest that globally, 81% of adolescents aged 11–17 years did not meet the recommended PA level[5]. Furthermore, the report from the Active Healthy Kids Global Alliance, which conducted the most comprehensive assessments of global variation in PA levels among children, concluded that children showed a persistent global trend toward low PA and high sedentary behaviors on the basis of the data gathered from 49 countries[6]. Recently, the WHO launched a global action plan to reduce physical inactivity by 10% and 15% among adolescents by 2025 and 2030, respectively. This is also documented as one of the nine global noncommunicable disease targets[7]. A global consensus has been reached that actively advocates healthy lifestyles, including increases in PA and reduction in sedentary behaviors, to mitigate the obesity trend in children and adolescents, which in turn helps to prevent obesity-related chronic diseases in adulthood[8-10].
With the rapid advancement of science and technology and increased social productivity, substantial changes have occurred in agricultural production, lifestyle behaviors, and living environments in the Chinese population. Children’s PA levels have been affected by these changes. Meanwhile, a global call has been made to monitor the PA levels of children, especially those in developing countries[11]. In a recent commentary published in Lancet Global Health, Ding highlighted that research on PA trends plays a fundamental role in the development, implementation, and evaluation of PA-enhancing interventions at the global, national, and regional levels[12]. To date, a paucity of evidence supports the long-term PA trend among children in China, as a comprehensive surveillance system was only established in the early 2000s. Data from the China Health and Nutrition Survey (CHNS) revealed that children spent more time in sedentary behaviors from 1997 to 2006 [13], and indicated that the PA and sedentary behaviors of children showed only little changes between 2004 and 2011[14]. The recent changes in the PA and sedentary behaviors of Chinese children are still unclear. Therefore, an investigation of these issues is a pressing need. As China is considered a representative developing country, investigating the trends of the PA and sedentary behaviors of children could provide valuable data for comparisons across other countries.
In 2016, a paper published in Lancet reviewed and analyzed global policies and action plans to increase PA levels. The authors proposed that an effective policy should be aligned with the local culture, religious values, geographical location, and economic development[15]. As China is undergoing rapid urbanization, identification of the factors influencing PA and sedentary behaviors in children aged 6–17 years is urgently needed. Therefore, this study was conducted with the following aims: 1) to examine the trends of the PA and sedentary behaviors of Chinese children aged 6–17 years over an 11-year period (2004–2015) and 2) to identify the correlates of the PA volume and time spent in sedentary behaviors.
-
In this study, we used data from the CHNS[16], which is an ongoing cohort study jointly conducted by the Chinese Center for Disease Control and Prevention (China CDC) and the Carolina Population Center of the University of North Carolina. The project started in 1989, and a multistage, random cluster process was used to draw samples from 9 provinces, including Heilongjiang, Liaoning, Jiangsu, Shandong, Henan, Hubei, Hunan, Guangxi, and Guizhou. Two cities and four counties per province were randomly selected, followed by two urban and two suburban communities per city, one community in the capital city, and three villages per county. The hierarchical data structure of the CHNS provided variability in geography, economic development, and public resources, which may be generally representative of China. Thereafter, nine rounds of follow-up surveys were conducted in 1991, 1993, 1997, 2000, 2004, 2006, 2009, 2011, and 2015. Since 2011, samples from three megacities (Beijing, Shanghai, and Chongqing) have been added. The recruitment efforts and sampling strategies were described previously[14]. To facilitate a comprehensive assessment of PA, questions related to sedentary behaviors have been added since 2004. For this reason, we only included children aged 6–17 years who participated in at least one round of follow-up surveys from 2004 to 2015. Records with illogical or missing data were excluded. A total of 298 primary sampling units, commonly known as “communities”, were included. This study was approved by the Medical Ethics Committee of the National Institute for Nutrition and Health, China CDC, and the University of North Carolina.
-
Data on PA, sedentary behaviors, and sociodemographic characteristics were collected using structured questionnaires, and the survey contents were similar between 2004 and 2015. The PA questionnaire was developed on the basis of the US Health Interview Surveys by Professor Barry Popkin of the University of North Carolina and Professor Barbara Ainsworth of Arizona State University[17].
The PA Outcome Measures included the PA level, average daily time spent in PA (min/day), and average weekly volume of PA [metabolic equivalent of task (MET)-hr/week]. To estimate the average weekly PA volume, the average weekly time spent in various PAs was multiplied by the corresponding MET values based on the Youth Compendium of Physical Activities developed by the US Center for Chronic Disease Prevention and Health Promotion in 2017[18]. In the compendium, MET values of 196 activities are presented for four age groups as follows: 6–9, 10–12, 13–15, and 16–18 years. With reference to the Physical Activity Guidelines for Chinese Children[19], moderate- and vigorous-intensity PAs (MVPAs) were identified, and the average time spent in MVPA per day (min/d) was estimated. By using as a cutoff point the 60-min accumulated MVPA per day proposed by the WHO, we defined < 60 min accumulated MVPA per day as physical inactivity. PA was categorized into three levels according to the average time spent in MVPA per day as follows: < 60, 60–120, and > 120 min for low, medium, and high PA levels, respectively. PA was classified into four domains as follows: active leisure, in-school PA, active travel, and domestic PA. Active leisure and in-school PA included strolling, gymnastics, track and field, martial arts, and ball games; active travel included walking and cycling; and domestic PA included cleaning the house, doing laundry, cooking, and buying food.
Sedentary behaviors were measured as the average weekly time (hr/week) spent in sedentary behaviors before school, after school, and during weekends. Sedentary activities were grouped into four categories as follows: education, screen-based entertainment, transportation, and arts & play. Activities in the education category included extracurricular reading, writing, and painting; activities in the screen-based entertainment category included TV viewing (watching TV programs, videos, and video discs), playing games (playing computer or smartphone games and game consoles), and Internet surfing (chatting online and watching programs online or on smartphones); activities in the transportation category included traveling as a passenger by bicycle, bus, subway, car, taxi, and motorcycle; and activities in the arts and play category included playing chess and with toy cars and puppets.
Sociodemographic Characteristics included age, sex, ethnicity, annual family income, parental educational levels, and geographical factors. As the mean age of 12 years is the beginning of the development of puberty and the secondary study, age was stratified into 6- to 11-year and 12- to 17- year age groups. Annual family income was stratified into low (≤ 50,000 yuan) and high (> 50,000 yuan) income groups in reference to the Chinese family income bracket. Parental education was stratified into low (primary or below), middle (secondary completed), and high (college or higher) education levels. Geographical factors included residential areas (urban/rural), region (north/south), and urbanization level of the community. The urbanization level of the community was assessed using an urbanization index developed by Jones and Barry Popkin. The index was produced from a comprehensive evaluation of 12 dimensions such as population density, education, and transportation infrastructure[20]. In this study, the urbanization index was compiled in ascending order of each survey year, which was ranked as the top one-third, one- to two-thirds, and the last one-third, stratified into low, medium, and high levels of urbanization, respectively.
-
All data analyses were performed using the SAS 9.4 software, and P values < 0.05 were considered statistically significant. Categorical data are presented as frequency (percentage). The Cochran-Armitage trend test was used to analyze the trends in the proportions of sex, residential areas, and regions over time. The Fisher exact test was used for ethnicity, as the expected count of cells in this group was < 5. As paternal and maternal educational levels are ordinal multilevel variables, the Mantel-Haenszel chi-square test was used. As age, annual family income, and urbanization index of the community are continuous variables, these are presented as mean ± standard deviation, and the multiple linear model was used to test the trends after adjusting for other sociodemographic characteristics.
A random-effects ordinal regression model was used to examine the trends of the PA levels across the survey years. The Newton-Raphson Ridge optimization method was used to optimize the parameter estimation, controlling for the random effect of communities and adjusting for sociodemographic factors, including sex, age, ethnicity, paternal and maternal educational levels, annual family income, urbanization index of the community, residential area, and region. The trends were further analyzed after stratification by sex.
Repeated-measures mixed-effects models were conducted using PA volume and time spent in sedentary behaviors as dependent variables and survey year as an independent variable, controlling for all sociodemographic characteristics. Community was included as a random effect in the models. The adjusted means of the PA volumes and times spent in sedentary behaviors were reported. The trends of both outcomes were examined, and the differences across the survey years were compared using the Bonferroni method. The repeated-measures mixed-effects model considers the internal connection of the observations in different survey years, and the aggregation of the observations at the community level. The hypothesis test showed that the changes of the −2log-likelihood value of the random intercept and slope models were statistically significant (P < 0.001), indicating that the fitting of the random slope model was better than the random intercept model, so the random slope model was adopted.
Quantile regression models were used to examine trends and the differential effects of the correlates at different quantiles of PA volumes and times spent in sedentary behaviors. Quantile regression uses conditional quantile modeling of the dependent variable to estimate the regression parameters by minimizing the weighted sum of the absolute values of the residuals. As the distribution of the dependent variable or the homogeneity of variance has no special requirement, it is not affected by outliers. This is a robust method that can reflect the influence of independent variables on dependent variables at different levels[21].
-
A total of 6,936 observations of children aged 6–17 years from 12 provinces and cities, comprising of 4,341 subjects and 298 communities, were examined in this study. The mean age was 11.0 ± 3.3 years, and the sex composition was consistent across all the survey years. The proportions of the children who participated in the survey once, twice, three times, four times, and five times were 59.0%, 26.1%, 11.2%, 3.5%, and 0.2%, respectively. Over the 11 years, a decrease of 1.7 years in the mean age of the children, an increase of 50 thousand yuan in annual family income, and an increase of 13.5 of the urbanization index of the community (P < 0.001) were observed. Furthermore, a significant increase in the proportion of children residing in the south was observed (P = 0.030; Table 1).
Table 1. Demographic characteristic of the participants
Variables CHNS year Statistics
(P value)2004 2006 2009 2011 2015 N 1,593 1,267 1,141 1,544 1,391 Sex (%)a Boys 854 (53.6) 677 (53.4) 644 (56.4) 791 (51.2) 728 (52.3) Z = −0.304
(Unilateral P = 0.381)Girls 739 (46.4) 590 (46.6) 497 (43.6) 753 (48.8) 663 (47.7) Age (years), mean ± SDd 11.9 ± 3.3 11.3 ± 3.4 11.0 ± 3.2 10.8 ± 3.3 10.2 ± 3.1 F = 64.5 (P < 0.001) Ethnicity (%)b Han 1,374 (86.3) 1,065 (84.1) 957 (83.9) 1,353 (87.6) 1,212 (87.1) Z = −0.458
(Unilateral P = 0.323)Minority 219 (13.7) 202 (15.9) 182 (16.0) 189 (12.3) 169 (12.2) Unknown 0 0 2 (0.1) 2 (0.1) 10 (0.7) Annual family income (thousands), mean ± SDd 0.4 ± 0.9 0.7 ± 1.2 1.2 ± 3.0 2.1 ± 3.9 5.4 ± 20.8 F = 44.0 (P < 0.001) Paternal educational level (%)c Low (primary or below) 204 (12.8) 198 (15.6) 153 (13.4) 225 (14.6) 195 (14.0) Χ2 = 0.000 (P = 0.995) Middle (secondary completed) 1,203 (75.5) 938 (74.0) 871 (76.3) 1,122 (72.6) 1,041 (74.8) High (college or higher) 186 (11.7) 131 (10.4) 117 (10.3) 197 (12.8) 155 (11.2) Maternal educational level (%)c Low (primary or below) 307 (19.3) 271 (21.4) 225 (19.7) 315 (20.4) 283 (20.4) Χ2 = 0.002 (P = 0.966) Middle (secondary completed) 1,102 (69.2) 870 (68.6) 805 (70.6) 1,040 (67.4) 960 (69.0) High (college or higher) 184 (11.6) 126 (9.9) 111 (9.7) 189 (12.2) 148 (10.6) Urbanization index (SD)d 58.6 (19.9) 61.7 (20.1) 64.6 (18.9) 70.5(19.6) 72.1 (17.3) F = 110.8 (P < 0.001) Residential areas (%)a Urban 444 (27.9) 370 (29.2) 308 (27.0) 583 (37.8) 486 (34.9) Z = 1.540
(Unilateral P = 0.062)Rural 1,149 (72.1) 897 (70.8) 833 (73.0) 961 (62.2) 905 (65.1) Region (%)a North 679 (42.6) 500 (39.5) 402 (35.2) 494 (32.0) 446 (32.1) Z = −1.88
(Unilateral P = 0.03)South 914 (57.4) 767 (60.5) 739 (64.8) 1,050 (68.0) 945 (67.9) Note. aUsing the Cochran-Armitage trend test. bUsing the Fisher exact test. cUsing the Mantel-Haenszel chi-square test. dUsing the multiple linear model to test the trends after adjusting for other sociodemographic characteristics. CHNS: China Health and Nutrition Survey. -
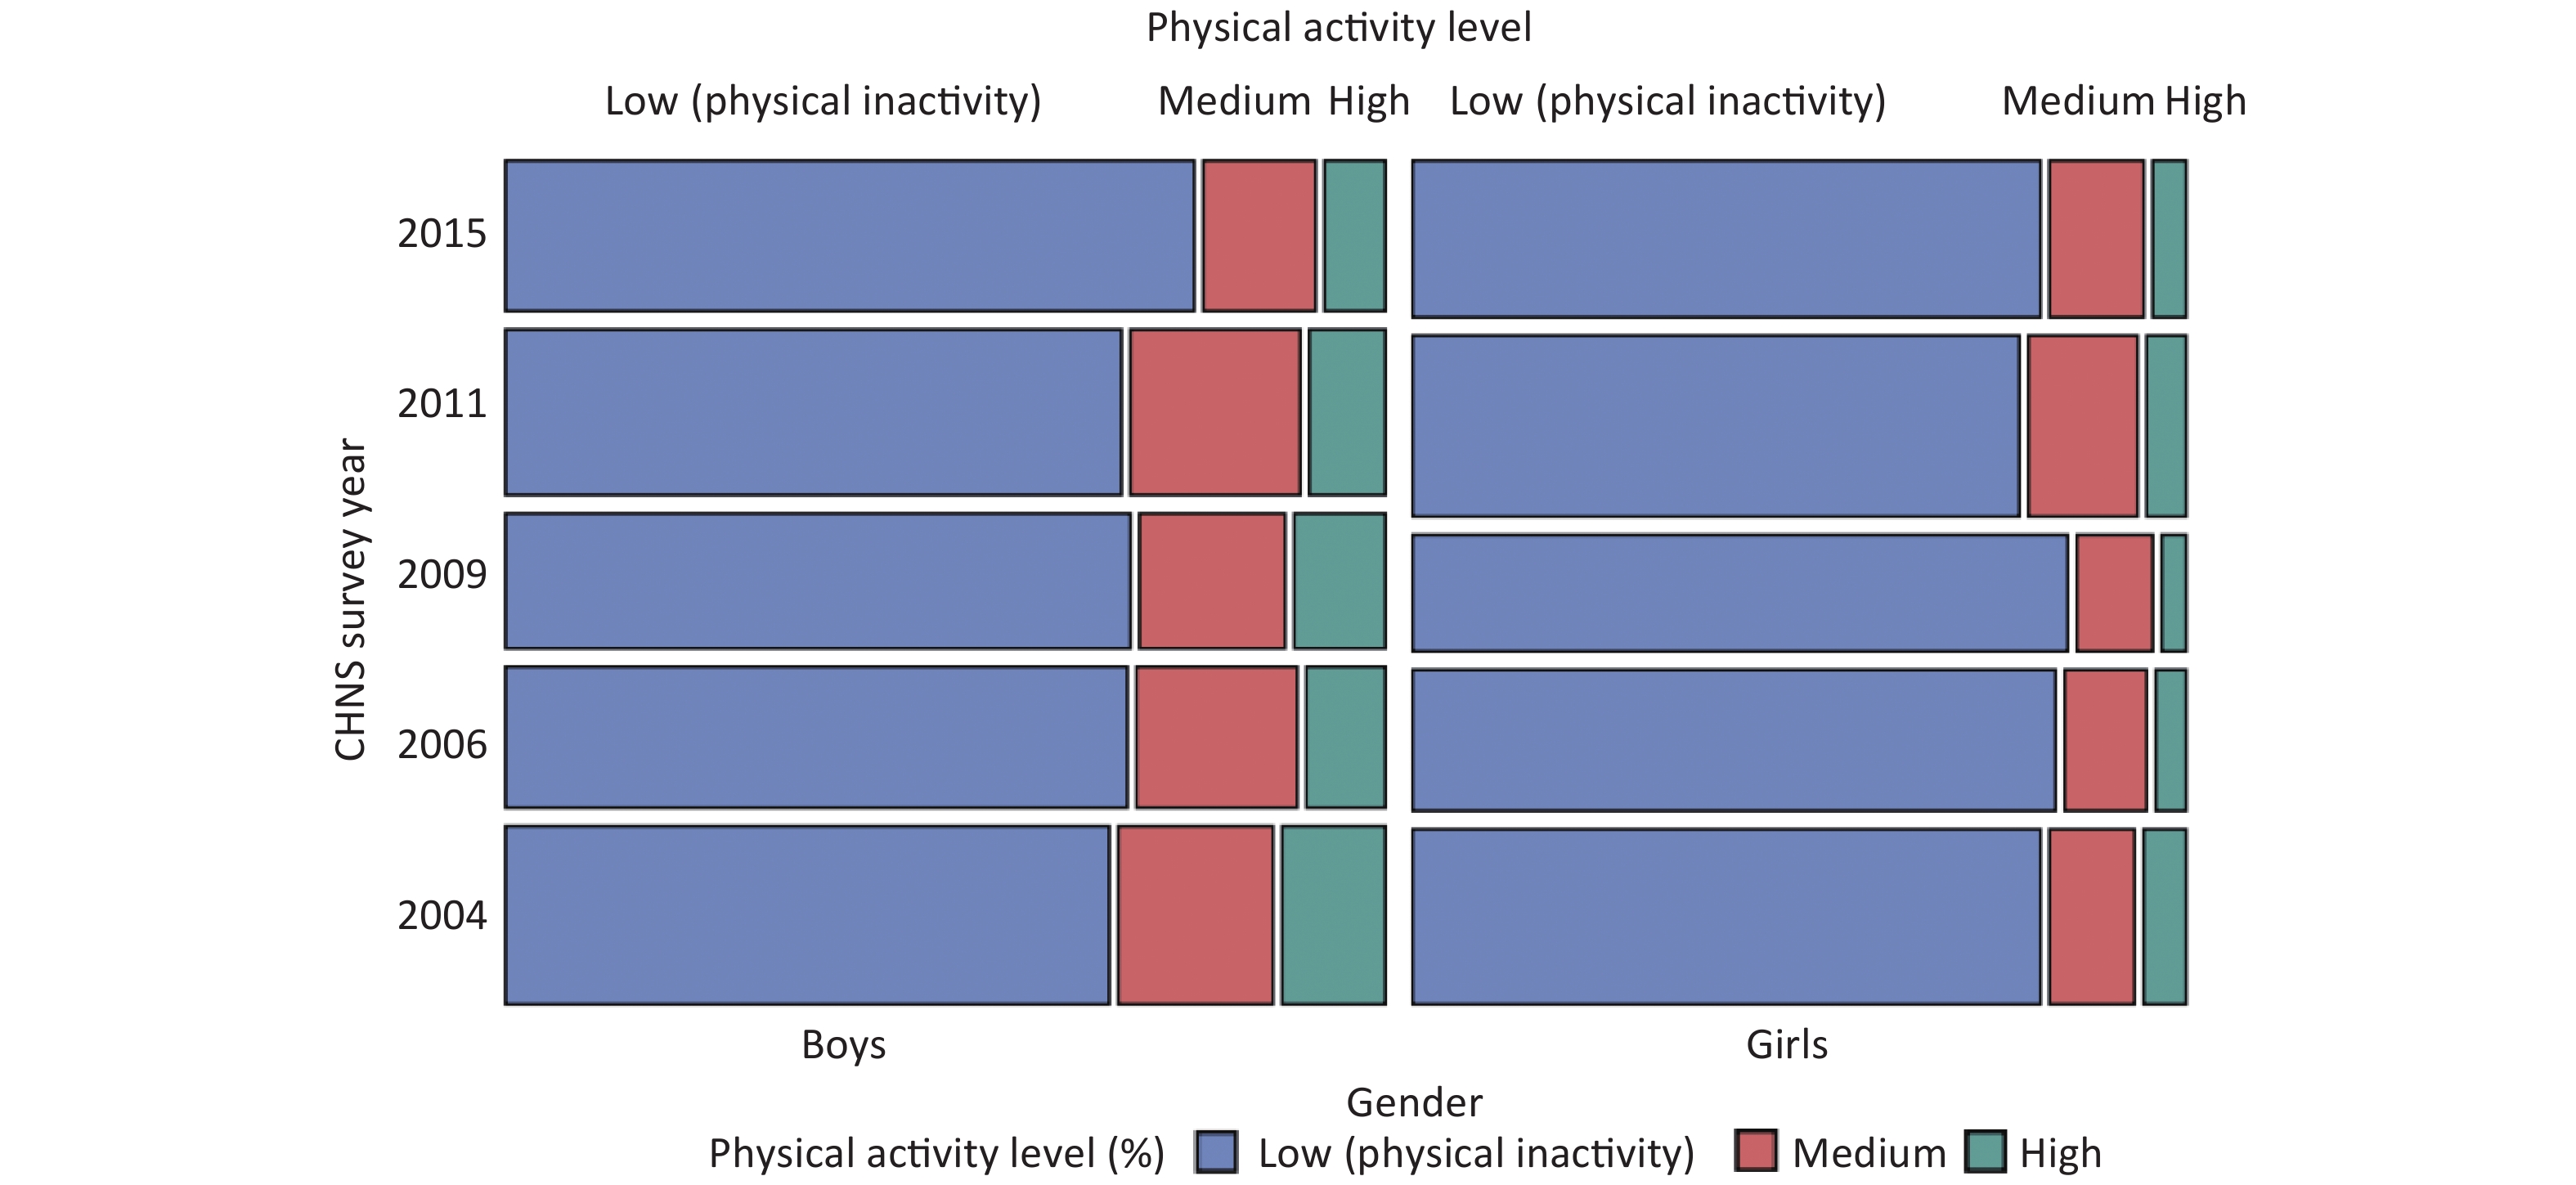
The proportion of children with low PA levels (i.e., physical inactivity) increased from 76.0% in 2004 to 81.5% in 2015 (OR, 1.51; 95% CI, 1.19–1.90; P < 0.001), whereas that of children with high PA levels decreased from 9.0% in 2004 to 5.8% in 2015 (OR, 0.66; 95% CI, 0.53–0.84; P < 0.001). The random-effects ordinal regression model showed a significant difference in PA level among the communities (P = 0.042), but no significant difference was observed in the trends of the PA levels among the communities over time. The sex stratification analysis revealed that the prevalence of physical inactivity among boys increased from 70.0% to 80.0% (OR, 1.75; 95% CI, 1.30–2.34; P < 0.001), whereas that of boys with high PA levels decreased from 12.0% to 7.0% (OR, 0.57; 95% CI, 0.43–0.77; P < 0.001) from 2004 to 2015. No significant differences were observed among girls. In 2015, the prevalence of physical inactivity among girls was 83.3%, and the proportion of girls with high PA levels was 4.3% (Figure 1).
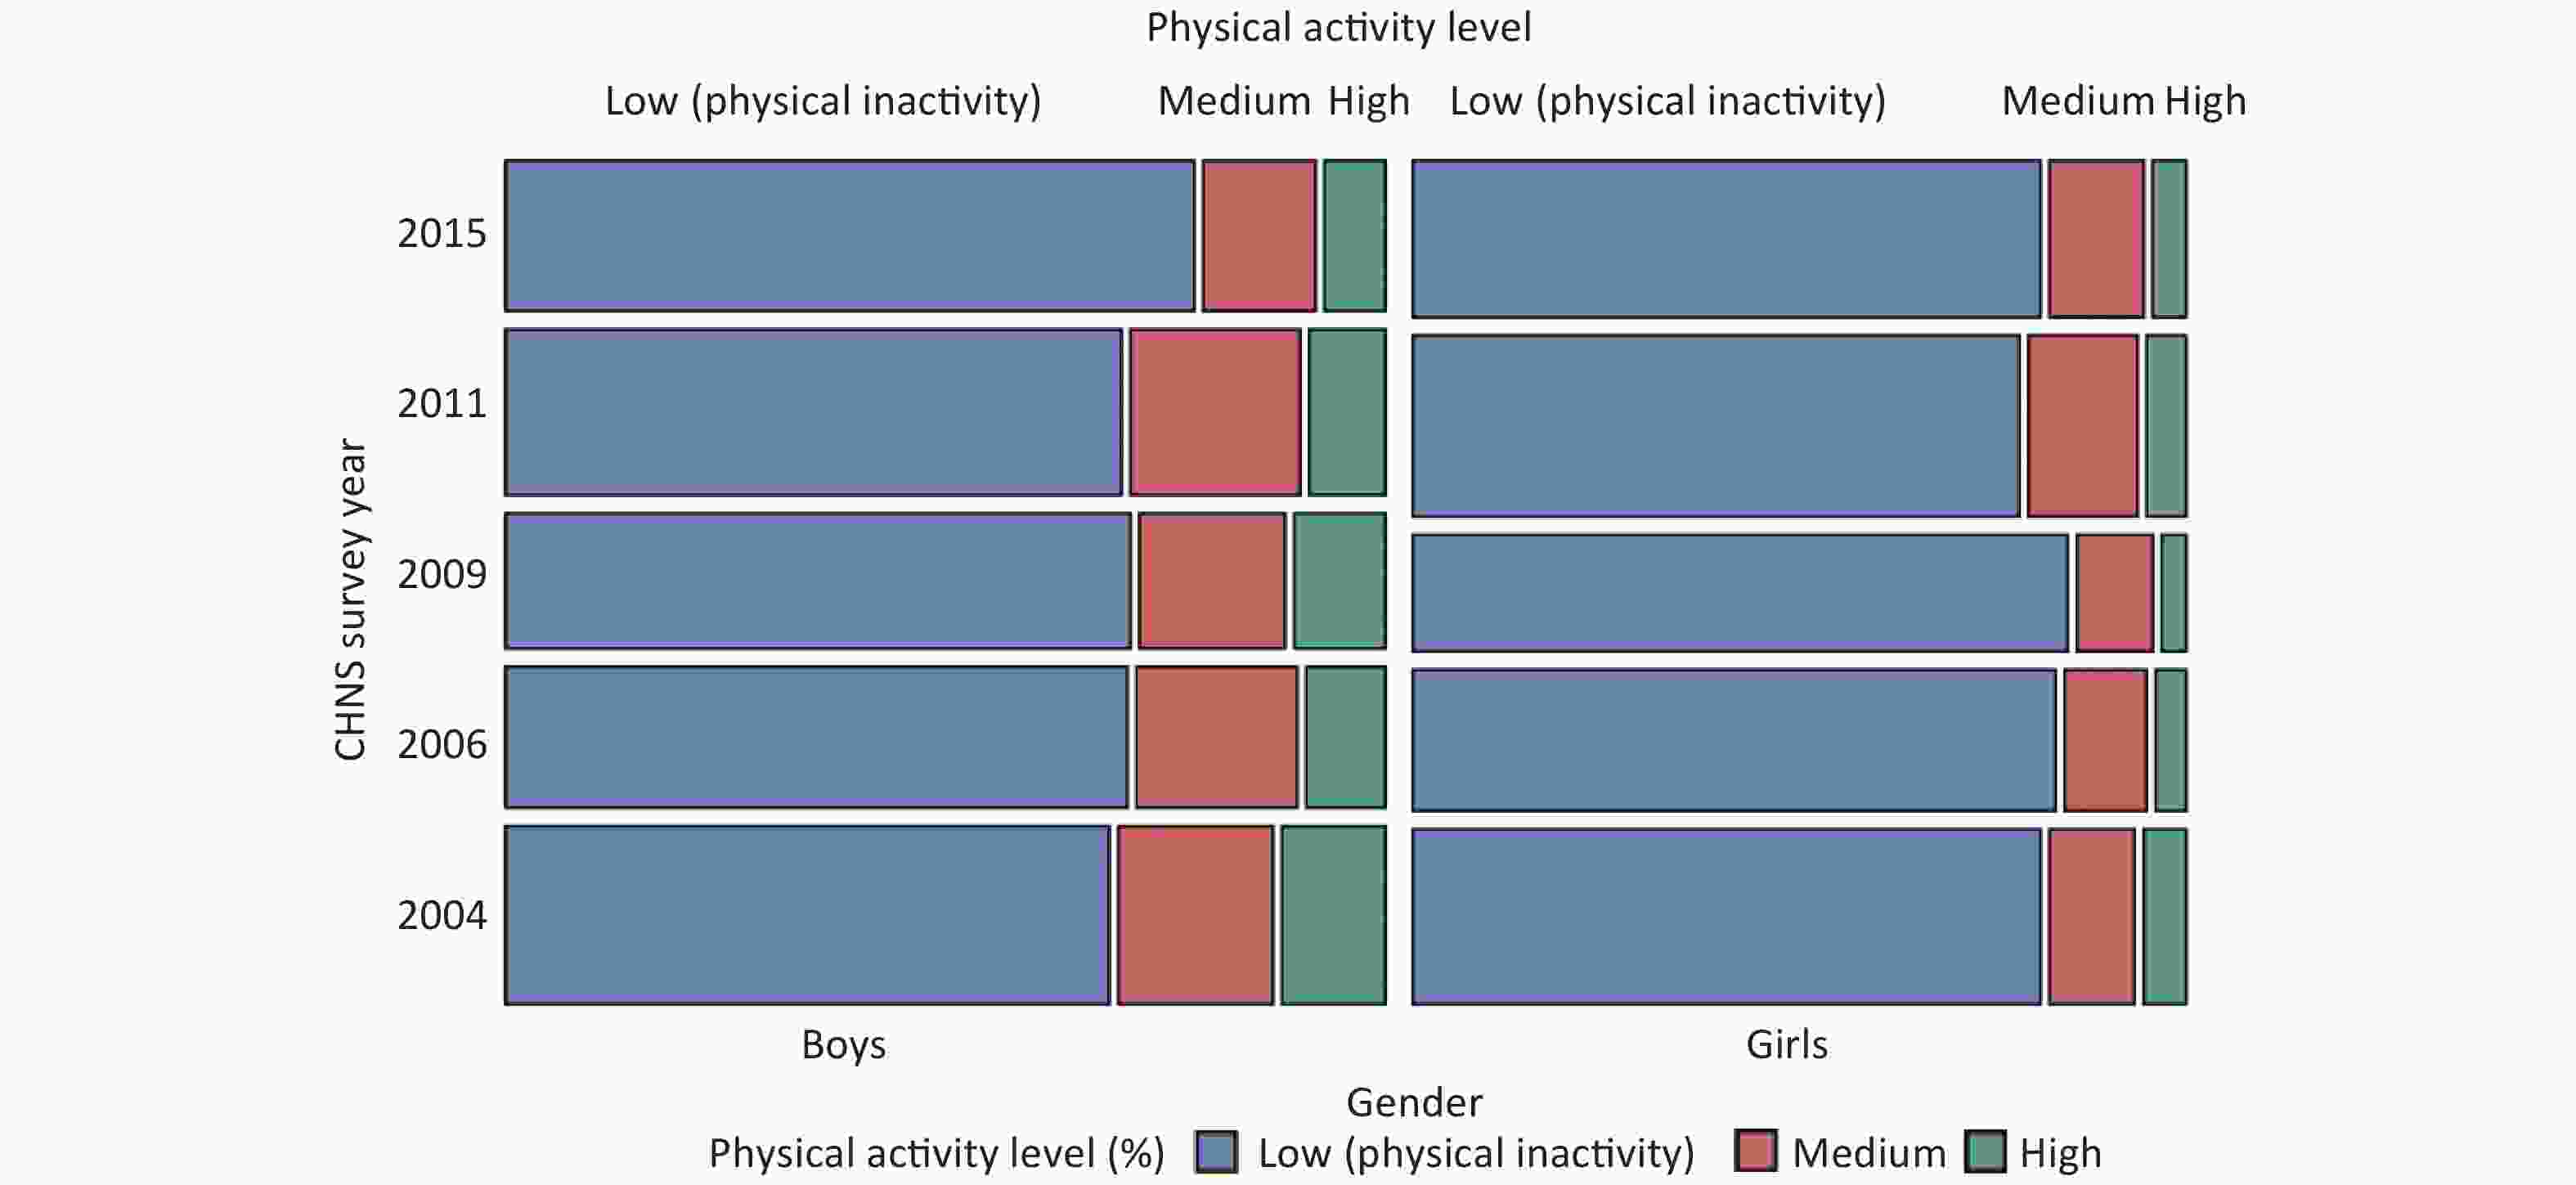
Figure 1. Trends of physical activity levels among Chinese children from 2004 to 2015. The random-effects ordinal regression model was conducted to examine the trends in PA levels across CHNS survey years, controlling for the random effect of communities and adjusting for socio-demographic factors including gender, age, ethnicity, paternal education level, maternal education level, annual family income, urbanization index of community, residential area and region. CHNS: China Health and Nutrition Survey.
-
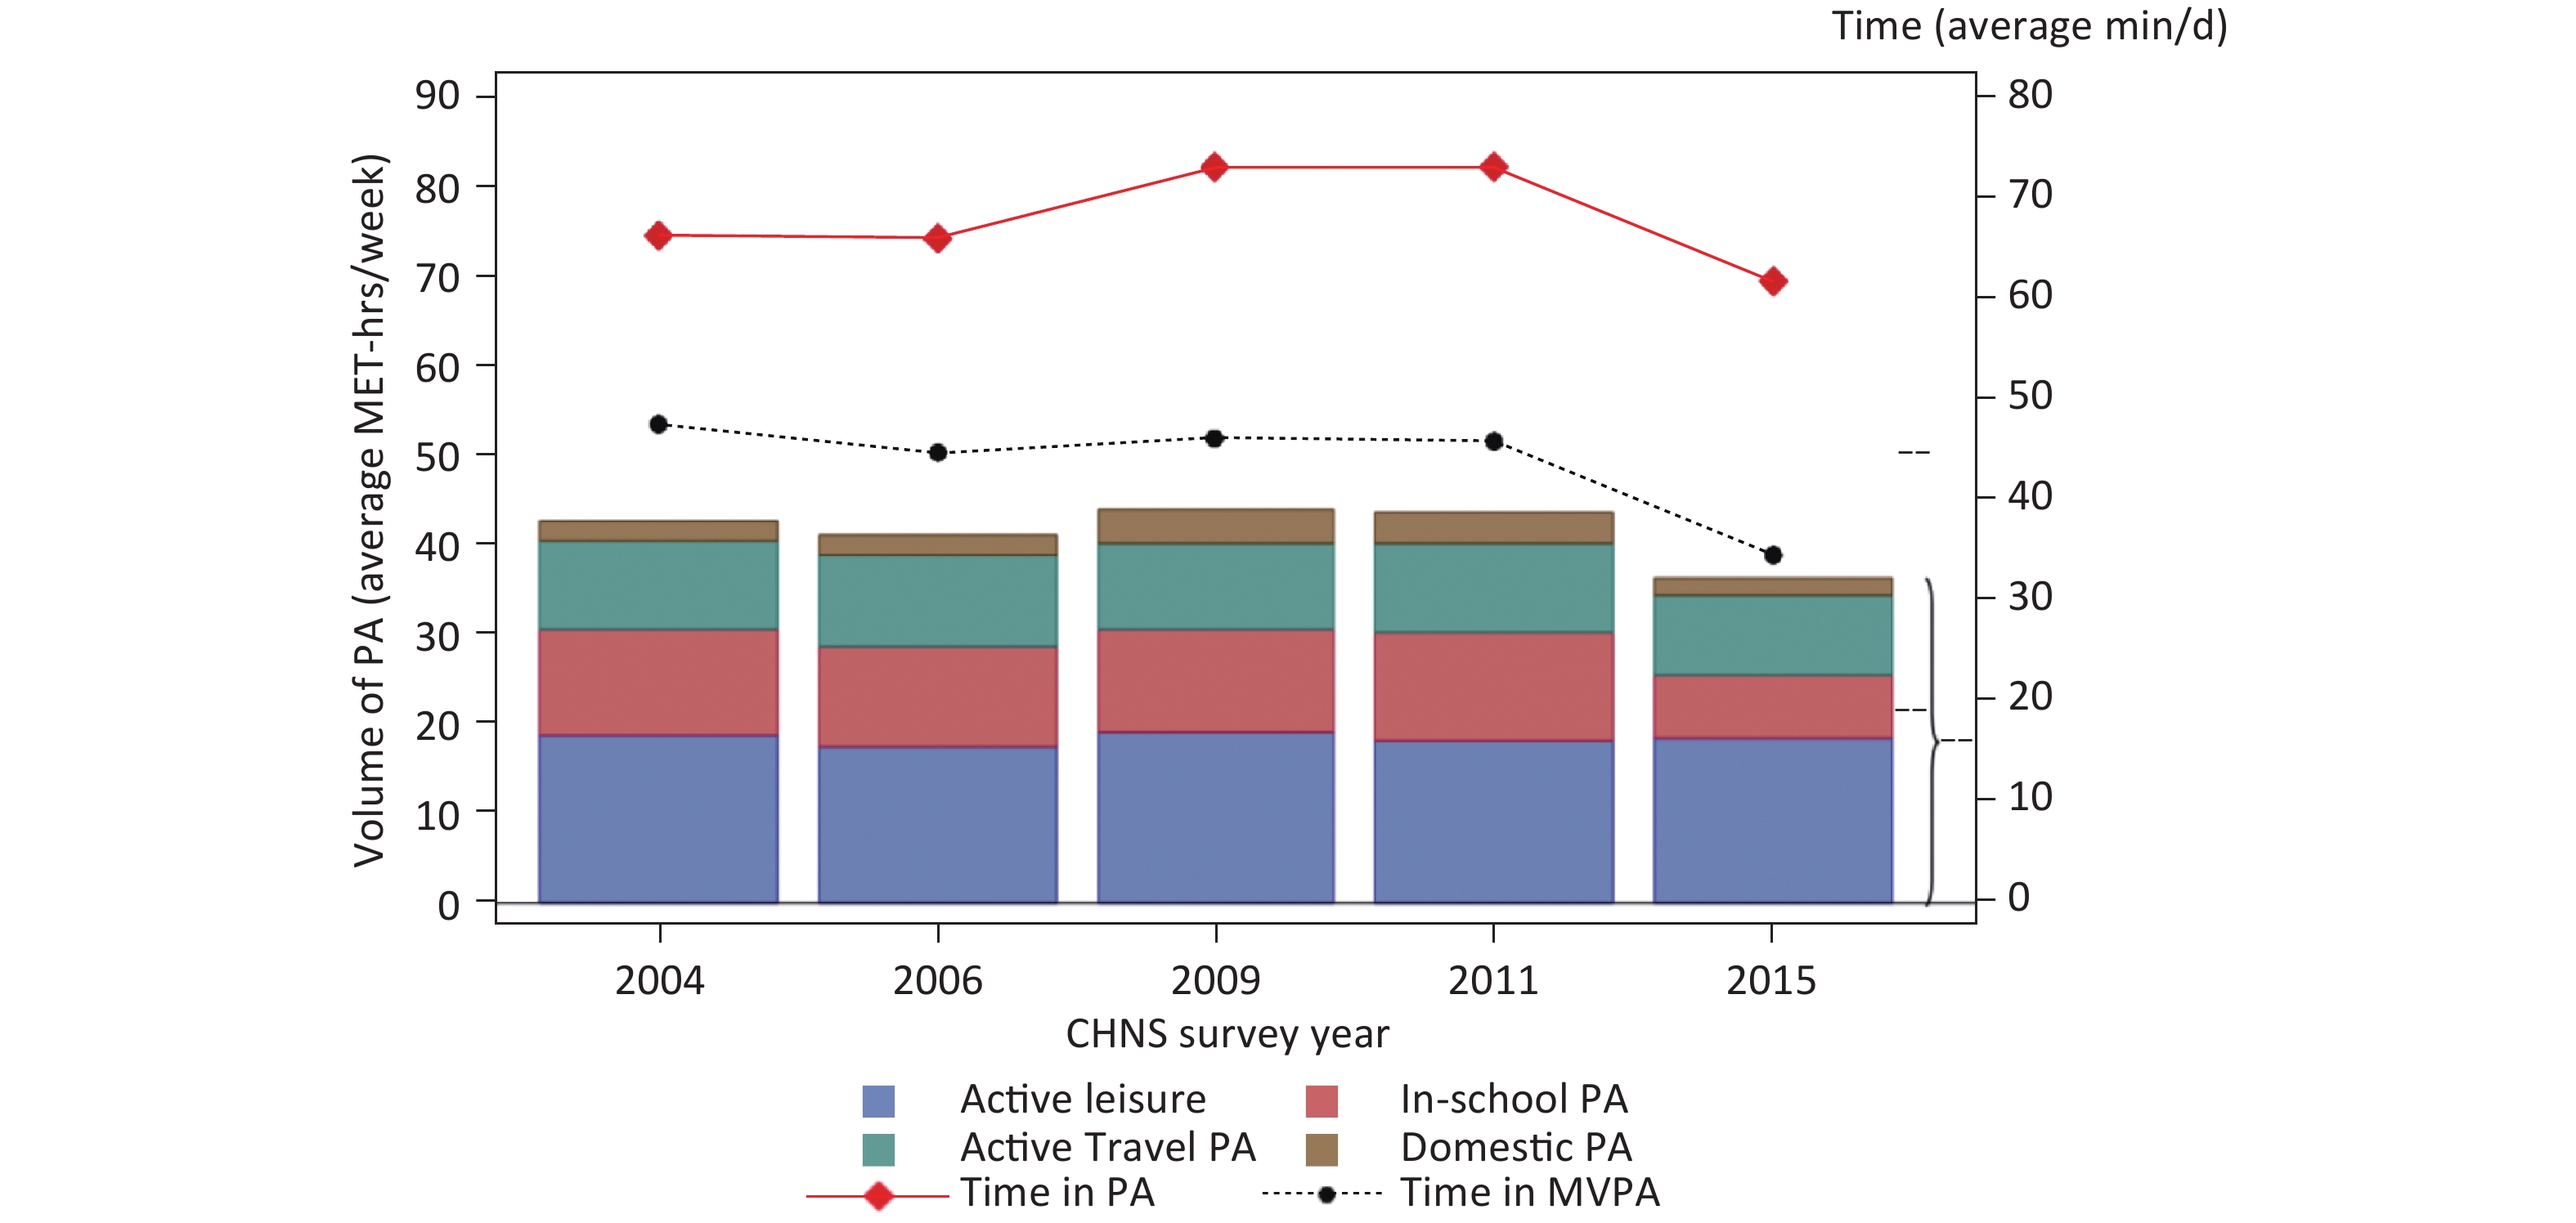
From 2004 to 2015, we found no evidence of a change in the mean time spent in PA per day, but the average time spent in MVPA per day declined by 26.9%, from 47.2 ± 2.3 min/d to 34.5 ± 2.1 min/d (F = 9.29, P < 0.001). Over the 11-year period, the mean weekly PA volume declined by 13.9%, from 41.7 ± 1.6 MET-hr/week to 35.9 ± 1.7 MET-hr/week (F = 5.16, P < 0.001). Of the four types of PA, active leisure contributed the largest proportion of the PA volume. In-school PA declined by 39.7%, from 11.6 ± 0.6 MET-hr/week in 2004 to 7.0 ± 0.5 MET-hr/week in 2015 (F = 25.04, P < 0.001). More profound decreases in PA were observed between 2011 and 2015, with the time spent in PA decreased by 15.3% (P = 0.004), MVPA decreased by 24.8% (P < 0.001), and PA volume decreased by 17.5% (P = 0.002). In addition, the volumes of in-school PA, active travel PA, and domestic PA decreased by 42.1%, 10.3%, and 44.4% (P < 0.001), respectively (Figure 2).

Figure 2. Trends of physical activity among Chinese children from 2004 to 2015. Repeated measures mixed effect models were conducted to examine the trends of PA across CHNS survey years, controlling for the random effect of communities and adjusting for socio-demographic factors including gender, age, ethnicity, paternal education level, maternal education level, annual family income, urbanization index of community, residential area and region. “−−” indicates a significant decrease in the overall trend (P < 0.001). PA: Physical Activity; MVPA: Moderate- to Vigorous-intensity Physical Activity; CHNS: China Health and Nutrition Survey.
-
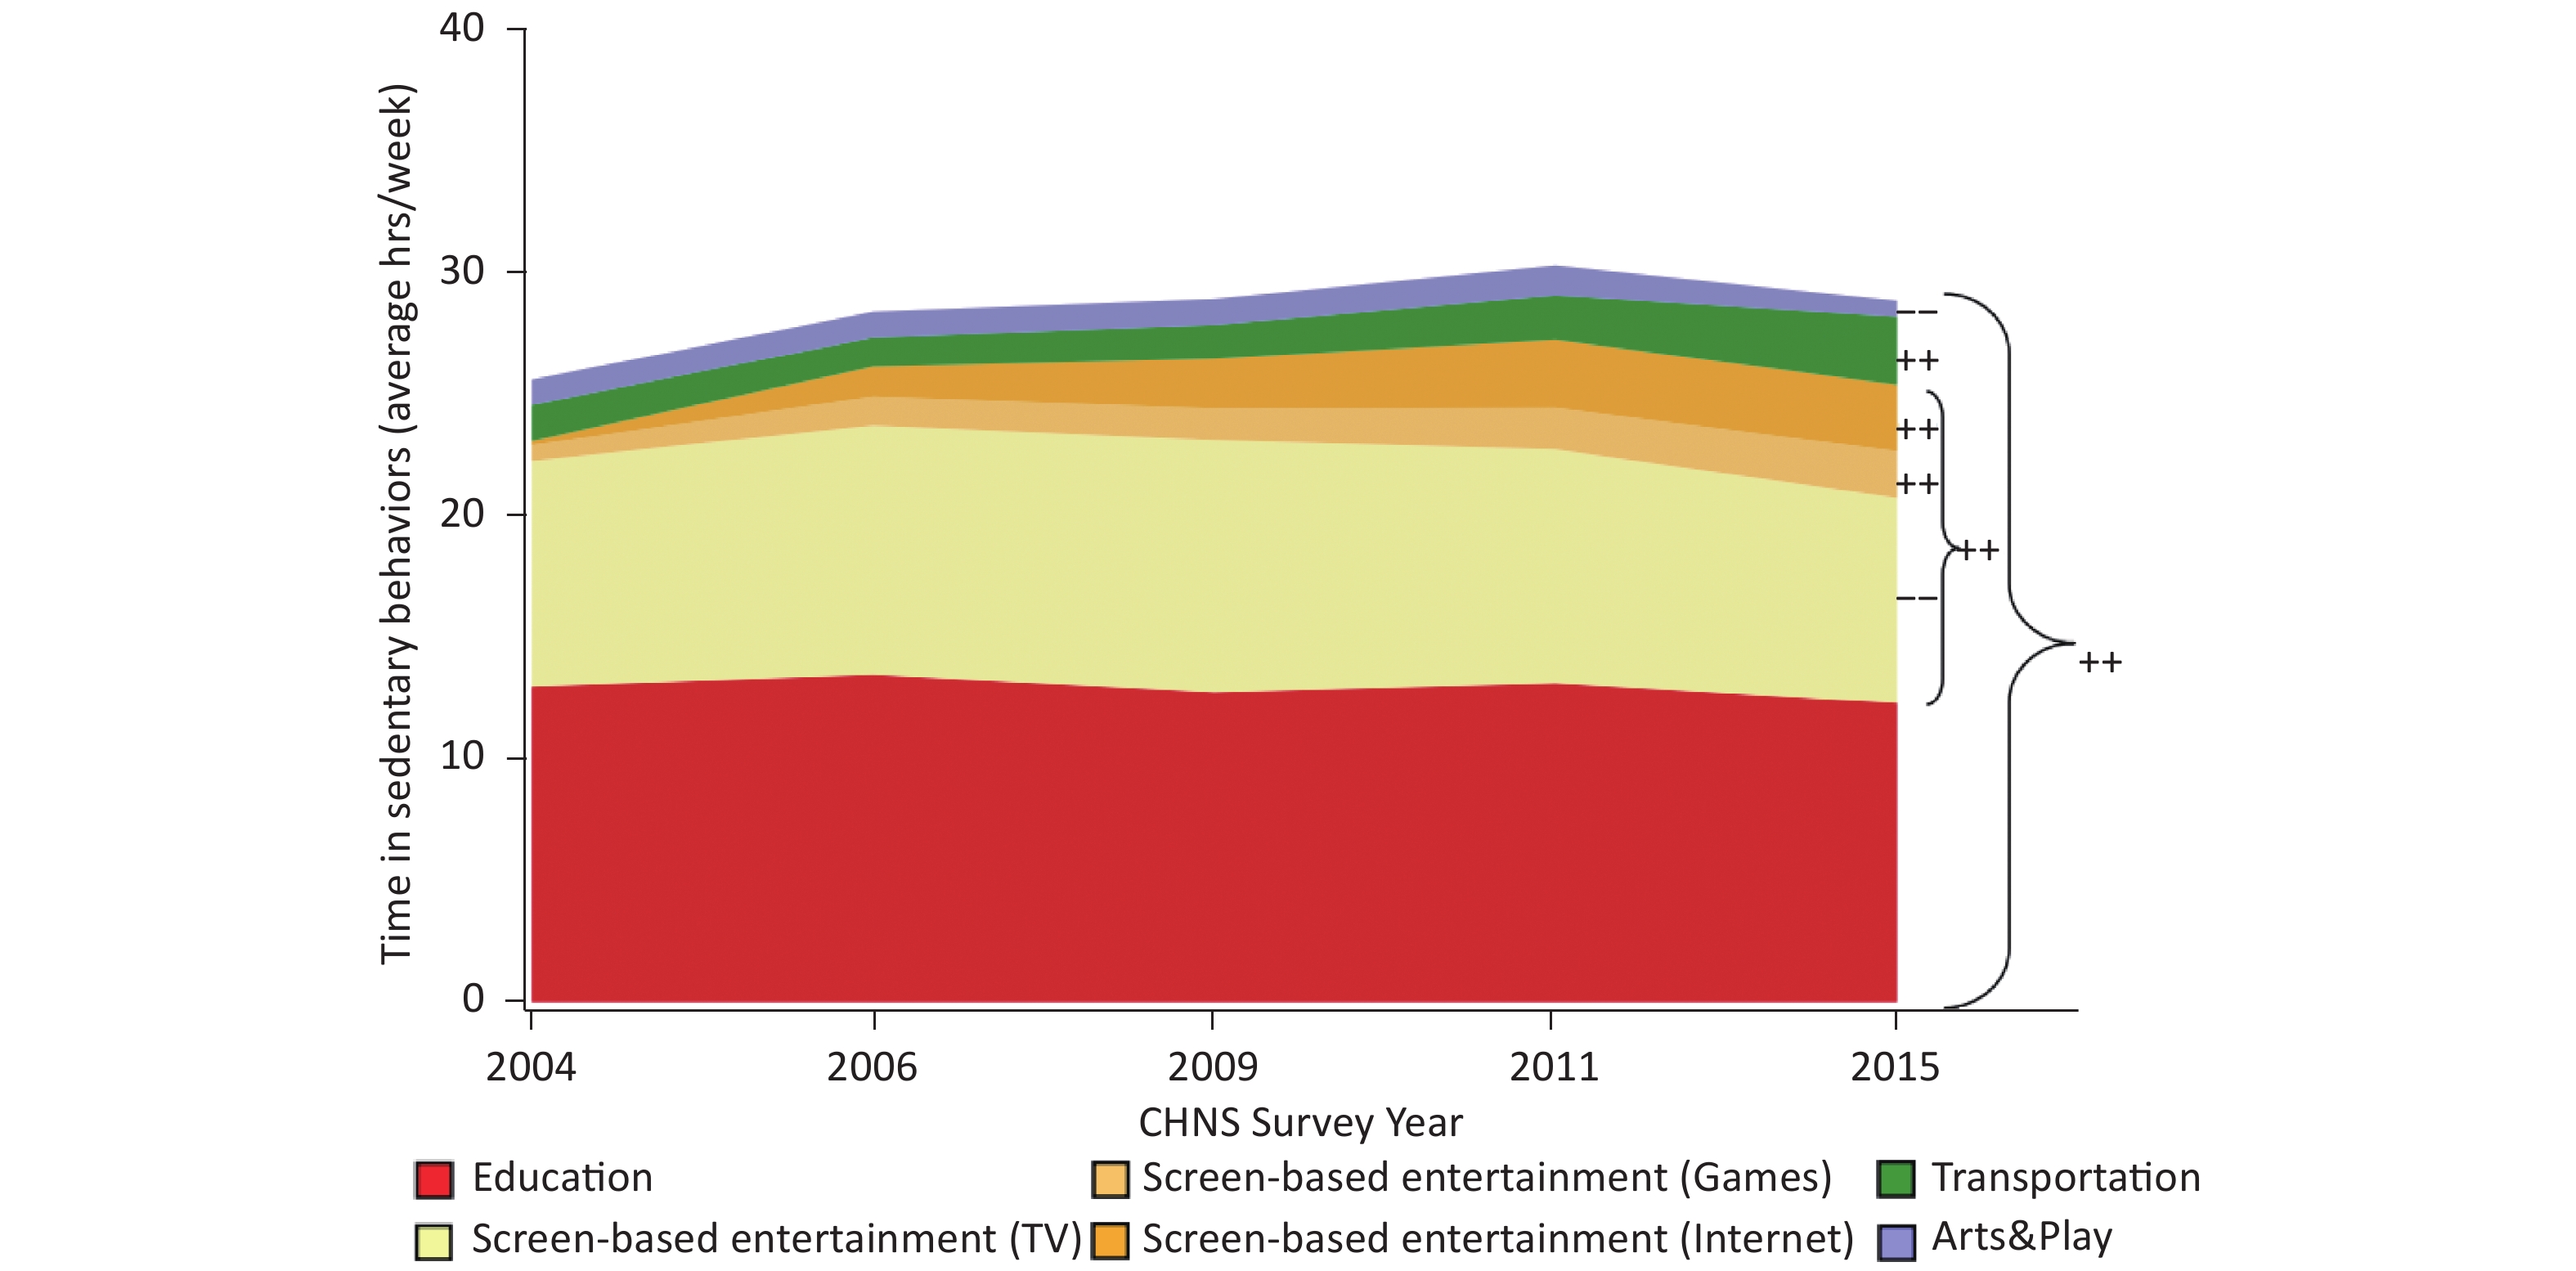
The time spent in sedentary behaviors among the children increased by 7.5%, from 23.9 ± 0.6 hr/week in 2004 to 25.7 ± 0.6 hr/week in 2015 (F = 15.17, P < 0.001). The education and screen-based entertainment categories were the predominant contributors to sedentary behaviors. Over the 11 years, the time spent in activities under the screen-based entertainment and transportation categories increased by 2.9 h/week (F = 20.37, P < 0.001) and 1.3 h/week (F = 5.45, P < 0.001), respectively, while the time spent in recreational activities decreased by 0.4 hr/week (F = 8.83, P = 0.024) and educational sedentary behaviors remained stable. Among the activities under the screen-based entertainment category, the Internet and games subcategories showed more profound increases in the times spent in these activities, with increases of 2.5 h/week (F = 50.69, P < 0.001) and 1.3 hr/week (F = 25.37, P < 0.001), respectively, from 2004 to 2015. By contrast, the time spent in activities under the TV subcategory decreased by 0.8 hr/week (F = 8.23, P < 0.001) over the 11-year period (Figure 3).
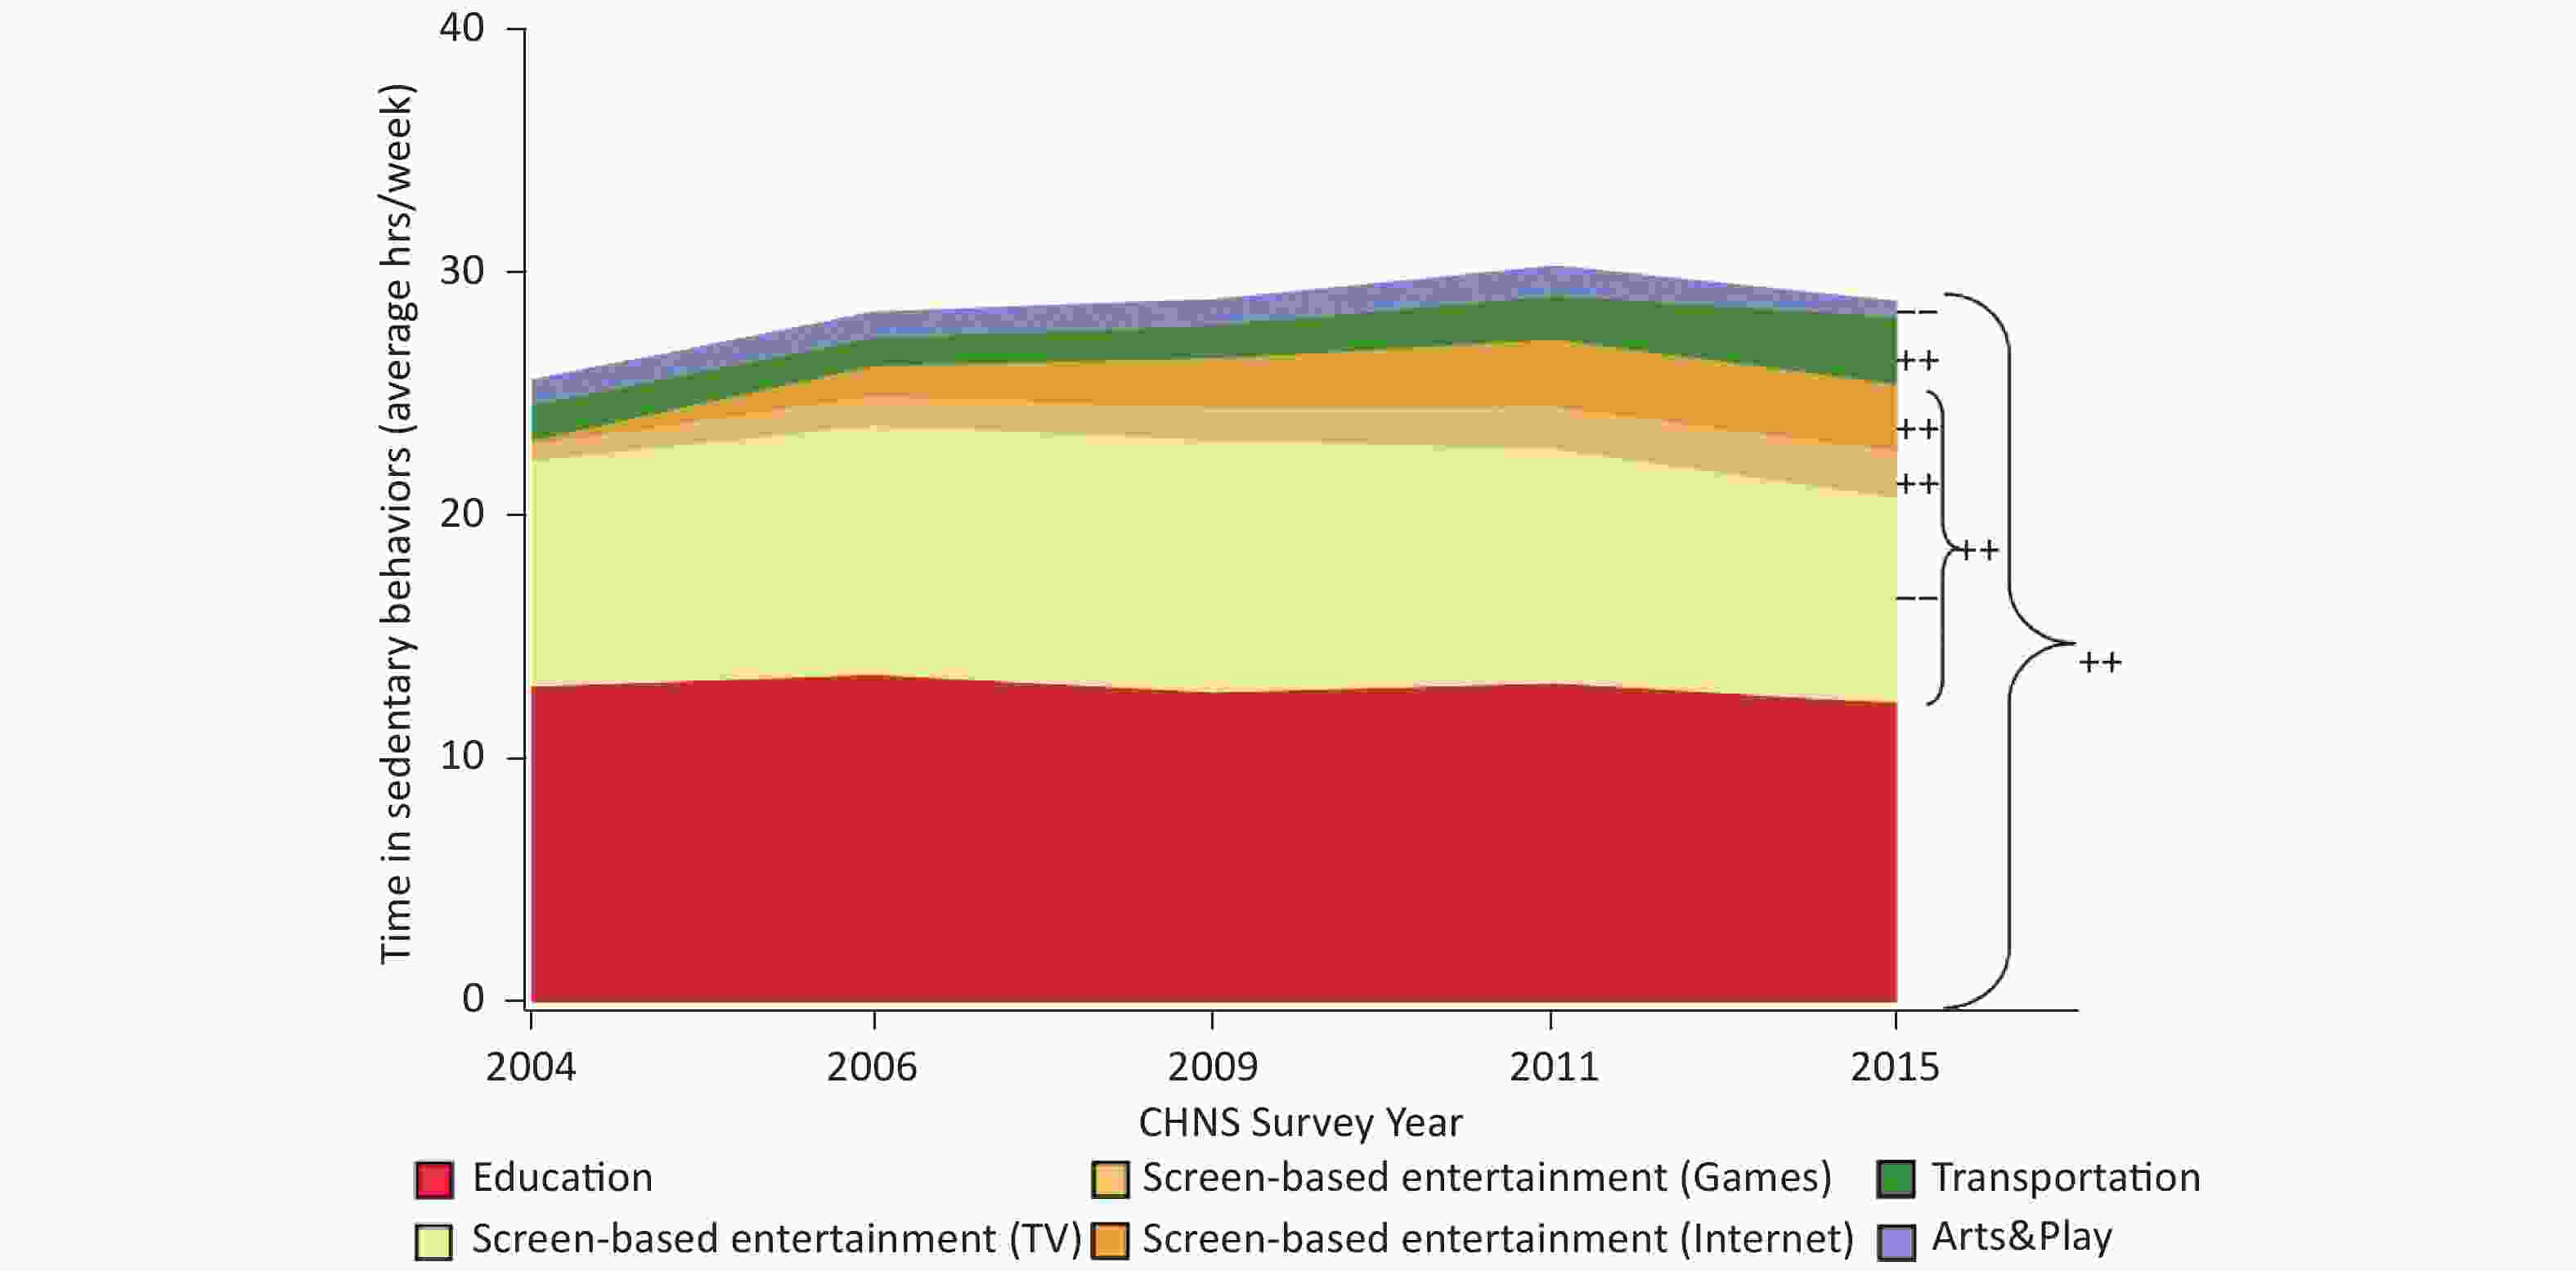
Figure 3. Trends of sedentary behaviors among Chinese children from 2004 to 2015. Repeated measures mixed effect models were conducted to examine the trends of sedentary behaviors across CHNS survey years, controlling for the random effect of communities and adjusting for socio-demographic factors including gender, age, ethnicity, paternal education level, maternal education level, annual family income, urbanization index of community, residential area and region. “++” indicates a significant increase in the overall trend (P < 0.001); “+” indicates an increase in the overall trend (P < 0.05); “−−” indicates a significant decrease in the overall trend (P < 0.001). CHNS: China Health and Nutrition Survey.
-
As shown in Table 2, the repeated-measures mixed-effects model analysis revealed that the variations among communities and observations accounted for 2.6% and 97.4% of the total variation in PA volume among children, respectively. In each survey year, the PA volume differed among the communities (P < 0.001). Likewise, the changes in PA volume over time differed among the communities (P < 0.001). The PA volume was 5.7 MET-hr/week lower in 2015 than in 2004 (P = 0.003), but no significant differences in PA volume were observed between 2004 and the other survey years. Regarding the results of the quantile regression analyses, the PA volume in 2006 was 1.3 MET-hr/week lower than that in 2004 at the 25th quartile (P = 0.048); the PA volumes in 2011 were 3.6 MET-hr/week (P = 0.001) and 4.3 MET-hr/week (P = 0.029) higher than those in 2004 at the 50th and 75th quartiles; and the PA volume of PA in 2015 was 5.4 to 6.5 MET-hr/week higher than that in 2004 at all quartiles (P ≤ 0.018).
Table 2. Results of the repeated-measures mixed-effects model and quantile regression model analyses of the factors associated with the volume of physical activity among Chinese children from 2004 to 2015
Variables Repeated-measures
mixed-effects modelsQuantile regression models 25th quantile 50th quantile 75th quantile Trend tests
(P value)β value (SE) P value β value
(95% CI)P value β value
(95% CI)P value β value
(95% CI)P value CHNS year 2015 −5.7 (1.9) 0.003 −5.4
(−6.6, −4.2)< 0.001 −6.5
(−8.6, −4.4)< 0.001 −5.8
(−10.6, −1)0.018 < 0.001 2011 2.1 (1.8) 0.245 0.4
(−0.9, 1.8)0.531 3.6
(1.4, 5.8)0.001 4.3
(0.4, 8.2)0.029 2009 1.4 (1.9) 0.467 0.1
(−1.4, 1.7)0.869 1.2
(−0.9, 3.2)0.279 1.2
(−2.7, 5.1)0.547 2006 −1.2 (1.8) 0.514 −1.3
(−2.6, 0)0.048 −0.8
(−2.9, 1.3)0.476 −2.4
(−6.4, 1.6)0.233 2004 0 0 0 0 Sex Boys 9.1 (1) < 0.001 0.1
(−0.8, 1)0.777 4.0
(2.6, 5.5)< 0.001 12.8
(10.1, 15.6)< 0.001 < 0.001 Girls 0 0 0 0 Age (years) 6–11 −16.9 (1) < 0.001 −5.9
(−7.2, −4.5)< 0.001 −14.2
(−16.2, −12.3)< 0.001 −22.3
(−25.3, −19.3)< 0.001 < 0.001 12–17 0 0 0 0 Ethnicity Han −6.9 (1.9) < 0.001 −2.4
(−3.6, −1.1)< 0.001 −3.6
(−5.9, −1.2)0.003 −11.3
(−15.9, −6.8)< 0.001 < 0.001 Minority 0 0 0 0 Family income level (yuan) Low
(≤ 50,000)−5.6 (1.8) 0.002 −1.1
(−3, 0.8)0.256 −1.9
(−4.8, 0.9)0.181 −11.0
(−18.3, −3.7)0.003 0.014 High
(> 50,000)0 0 0 0 Paternal educational level Low
(primary or
below)4.1 (7.8) 0.599 −0.6
(−3, 1.7)0.598 1.1
(−10.3, 12.5)0.848 −4.7
(−12.5, 3.1)0.239 0.702 Middle
(secondary
completed)6.1 (7.5) 0.415 −0.4
(−1.9, 1.1)0.642 2.6
(−8.4, 13.6)0.647 −0.3
(−4.7, 4.1)0.906 High (college or higher) 0 0 0 0 Maternal educational level Low (primary or below) −4.7 (7.9) 0.548 0.1
(−2.2, 2.3)0.957 −1.9
(−13.3, 9.6)0.747 3.3
(−4.7, 11.4)0.421 0.611 Middle (secondary completed) −5.4 (7.6) 0.478 0.2
(−1.6, 1.9)0.845 −2.3
(−13.5, 8.9)0.689 −0.6
(−6.6, 5.4)0.848 High (college or higher) 0 0 0 0 Urbanization level of the community Low −2.7 (1.9) 0.145 −1.8
(−3.1, −0.5)0.006 −2.4
(−4.3, −0.5)0.013 −3.2
(−6.8, 0.5)0.092 0.413 Middle −0.8 (1.7) 0.633 −0.8
(−1.9, 0.4)0.203 −2.1
(−3.9, −0.3)0.023 −2
(−5.5, 1.6)0.275 High 0 0 0 0 Residential area Urban 6.1 (1.7) < 0.001 0.4
(−0.7, 1.5)0.434 3.6
(1.6, 5.5)< 0.001 11
(7.4, 14.6)< 0.001 < 0.001 Rural 0 0 0 0 Region North −4.5 (1.4) 0.002 −4.0
(−4.8, −3.1)< 0.001 −6.7
(−8.0, −5.3)< 0.001 −7.4
(−10.2, −4.7)< 0.001 < 0.001 South 0 0 0 0 Random effects* σ2μ0 (intercept) 39.0 (12.9) 0.001 σ2μ01 (covariance) 102.4 (18.1) < 0.001 σ2μ1 1469.5 (27.0) < 0.001 Note. *These were the random effects of the communities in the repeated-measures mixed-effects models on the volume of physical activity. Interclass variance: 39.0/(39.0 + 1469.5) × 100% = 2.6%. Intraclass variance: 100.0% – 2.6% = 97.4%. CHNS: China Health and Nutrition Survey; CI: Confidence interval. The results of the repeated-measures mixed-effects model and quantile regression models indicated that age, ethnicity, and region affected the PA volume (P ≤ 0.003), and differences were observed across the quartiles (P < 0.001). The PA volumes of the children aged 6–11 years were 5.9 to 22.3 MET-hr/week lower than those of the children aged 12–17 years (P < 0.001); the PA volumes of the Han Chinese children were 2.4 to 11.3 MET-hr/week lower than those of the children from ethnic minorities (P < 0.001); the PA volumes of those from the north region were 4.0 to 7.4 MET-hr/week lower than those from the south region (P < 0.001). As the quartile increased, the differences became larger. The repeated-measures mixed-effects model further showed that the PA volumes of the male and urban children were 9.1 and 6.1 MET-hr/week higher than those of the female and rural children, respectively (P < 0.001). The effects of sex and region were significant at the 50th and 75th quartiles of PA volumes, with greater differences observed at the 75th quartile (P < 0.001), but no statistical significance was found in the 25th quartile. With regard to family income, the children in low-income families had 5.6 MET-hr/week lower PA volume than those in high-income families (P < 0.001). The quantile regression analyses revealed that the effect of income was only significant at the 75th quartile (P = 0.003). No significant effects were observed for either parental or maternal educational levels. Considering the aggregation effect of community, the impact of the urbanization level of the community on PA volume was not statistically significant. However, the quantile regression analyses revealed that the effect of the urbanization level of the community was significant at the 25th and 50th quartiles of PA volumes, in which children residing in areas with low urbanization level had 1.8 MET-hr/week (P = 0.006) and 2.4 MET-hr/week (P = 0.013) lower PA volumes than those residing in areas with high urbanization levels.
-
As shown in Table 3, the repeated-measures mixed-effects model analysis revealed that the variation among the communities and observations accounted for 3.6% and 96.4% of the total variation in sedentary time among the children, respectively. In each survey year, the sedentary time significantly differed among the communities (P < 0.001). Likewise, the changes in sedentary time over time differed significantly among the communities (P < 0.001). Compared with that in 2004, the sedentary times of the children in the other survey years were significantly higher (P < 0.001). The results of the quantile regression analyses suggest that in each survey year, the increase in sedentary time was greater in the higher quartiles than in the lower quartiles. At each quartile level, the sedentary time increased significantly between 2004 and the other survey years (P < 0.001), except in 2015, which was only observed in the 75th quartile (P < 0.001).
Table 3. Results of the repeated-measures mixed-effects model and quantile regression model analyses of factors associated with the time spent in sedentary behaviors among Chinese children from 2004 to 2015
Variables Repeated-measures
mixed-effect modelsQuantile regression models 25th quantile 50th quantile 75th quantile Trend tests
(P value)β value (SE) P value β value
(95% CI)P value β value
(95% CI)P value β value
(95% CI)P value CHNS year 2015 1.9 (0.6) 0.003 −0.4
(−1.5, 0.6)0.432 1.1 (−0.2, 2.4) 0.088 4 (2.4, 5.6) < 0.001 < 0.001 2011 4.1 (0.6) < 0.001 3.8 (3, 4.7) < 0.001 4.2 (3.1, 5.3) < 0.001 4.6 (3.4, 5.8) < 0.001 2009 3.2 (0.6) < 0.001 2.9 (1.9, 3.9) < 0.001 3.5 (2.5, 4.6) < 0.001 3.5 (2.3, 4.6) < 0.001 2006 3 (0.6) < 0.001 2.5 (1.6, 3.4) < 0.001 2.9 (1.9, 4) < 0.001 3.1 (2.1, 4.2) < 0.001 2004 0 0 0 0 Sex Boys 0.5 (0.3) 0.098 −0.2
(−0.8, 0.4)0.592 −0.3 (−1,0.4) 0.413 0.5
(−0.2, 1.3)0.170 0.060 Girls 0 0 0 0 Age (years) 6–11 −1.2 (0.3) < 0.001 −0.1
(−0.8, 0.6)0.812 −1.1
(−1.9, −0.3)0.007 −2.6
(−3.5, −1.8)< 0.001 < 0.001 12–17 0 0 0 0 Ethnicity Han −0.9 (0.6) 0.157 −0.6
(−1.4, 0.2)0.153 −1.2
(−2.4, 0)0.041 −2.3
(−3.4, −1.3)< 0.001 0.007 Minority 0 0 0 0 Family income level (yuan) Low
(≤ 50,000)−1.7 (0.6) 0.004 −1.3
(−2.8, 0.3)0.119 −2.9
(−4.4, −1.4)< 0.001 −3.7
(−5.7, −1.7)< 0.001 0.040 High
(> 50,000)0 0 0 0 Paternal educational level Low (primary or below) −0.9 (2.5) 0.737 −4.9
(−9.7, −0.1)0.045 −0.9
(−4.3, 2.5)0.590 0.5
(−1.6, 2.6)0.643 0.285 Middle (secondary
completed)0.2 (2.4) 0.920 −3.9
(−8.4, 0.6)0.092 −0.4
(−3.3, 2.6)0.797 1.0 (0, 2.0) 0.043 High (college or higher) 0 0 0 Maternal educational level Low (primary or below) −0.5 (2.6) 0.854 3.6
(−1.2, 8.4)0.137 −1.4
(−4.8, 2)0.425 −2
(−4.1, 0.1)0.058 0.049 Middle (secondary
completed)−1 (2.5) 0.682 2.7
(−1.9, 7.3)0.245 −0.8
(−3.9, 2.3)0.607 −1.8
(−3.2, −0.3)0.016 High (college or higher) 0 0 0 0 Urbanization level of the community Low −1.3 (0.6) 0.050 −2.6
(−3.4, −1.8)< 0.001 −1.4
(−2.4, −0.4)0.005 −1.5
(−2.5, −0.5)0.003 0.038 Middle −0.3 (0.6) 0.628 −1.1
(−1.9, −0.2)0.013 0.1 (−0.9, 1) 0.914 −0.2
(−1.2, 0.8)0.674 High 0 0 0 0 Residential area Urban 3.2 (0.6) < 0.001 2.6 (1.8, 3.3) < 0.001 3.3 (2.5, 4.2) < 0.001 3.6 (2.6, 4.6) < 0.001 0.100 Rural 0 0 0 0 Region North −0.3 (0.5) 0.538 −0.8
(−1.4, −0.1)0.031 −0.4
(−1.1, 0.4)0.346 0.4
(−0.5, 1.3)0.403 0.058 South 0 0 0 0 Random effects* σ2μ0 (intercept) 5.7 (1.4) 0.001 σ2μ01 (covariance) 13.1 (2.0) < 0.001 σ2μ1 153.3 (2.8) < 0.001 Note. *These were the random effects of the communities in the repeated-measures mixed-effects models on the time spent in sedentary behaviors. Interclass variance: 5.7/(5.7 + 153.3) × 100% = 3.6%. Intraclass variance: 100.0% – 3.6% = 96.4%. CHNS: China Health and Nutrition Survey; CI: Confidence interval. The results of the repeated-measures mixed-effects model and quantile regression models indicate that the sedentary times of the urban children were 2.6 to 3.6 hr/week higher than those of the rural children (P < 0.001), and those residing in areas with high urbanization levels reported 1.3 to 2.6 hr/week higher sedentary times than those residing in areas with low urbanization levels (P ≤ 0.050). As the quartile increased, the effect of residential area increased. The repeated-measures mixed-effects model analysis revealed that the effects of ethnicity, parental educational level, and region on sedentary time were not statistically significant. However, significant effects were observed in the quantile regression analyses. At the 75th quartile, the sedentary time of the children from ethnic minorities was 2.3 hr/week higher than that of the Han Chinese children (P < 0.001). Children with fathers educated up to a middle educational level reported 1.0 hr/week higher sedentary time than those with fathers educated up to a high educational level (P = 0.043). The children with mothers educated up to a middle educational level reported 1.8 hr/week lower sedentary time than those with mothers educated up to a high educational level (P = 0.016). In the 25th quartile, the sedentary time of the children residing in the south was 0.8 hr/week higher than that of the children residing in the north (P = 0.031). The children with fathers educated up to a high educational level reported 4.9 hr/week higher sedentary time than those with fathers educated up to a low educational level (P = 0.045). Sex was not a significant factor in any of the models.
-
In this study, we examined the trends and correlates of PA and sedentary behaviors in children aged 6–17 years in China from 2004 to 2015. Overall, a gradual decline in PA and a steady increase in sedentary behaviors were observed in the Chinese children over the 11-year period, and sociodemographic factors were associated with PA and sedentary behaviors.
From 2004 to 2015, the prevalence of physical inactivity among the Chinese children aged 6–17 years increased from 70.0% to 81.5%. This figure is similar to the global estimate of 81.0% among adolescents with physical inactivity in 2016[5]. While the global trend in physical inactivity among adolescents started to decline, the momentum in China is still increasing. If effective strategies are not implemented to ameliorate these trends, achieving the WHO target of 10% reduction in physical inactivity among children in China by 2025 may be impossible.
In this study, we found a downward trend for in-school PA among Chinese children aged 6–17 years, which was the major contributor to the decrease in PA volume. This finding is consistent with a systematic review of global PA trends that indicated a decline in youth PA over the 20 years before and after the early 21st century, particularly in the domain of in-school PA[22]. The review also identified a gap between studies in that studies on PA trends in children were fewer than those on PA trends in adults, and studies on PA trends in children were mainly conducted in Western countries such as the United States, Canada, and Switzerland. Our study adds to the existing literature by providing data on the PA trends in Chinese children. In view of the prominent decreasing trend in in-school PA, urgent actions should be taken to increase the volume of in-school PA to promote PA among Chinese children aged 6–17 years.
In this study, the time spent in screen-based entertainment increased significantly from 2004 to 2015, which was mainly contributed by activities under the Internet and game subcategories. By contrast, the time spent in activities under the TV subcategory decreased gradually. A study that compared the international trends in children’s screen-time behaviors among 30 countries found that TV viewing decreased slightly from 2002 to 2010, which was offset by a sharp increase in the time spent on Internet and video games. This trend was consistently observed in all surveying countries[23]. These changes illustrate that new technologies have replaced old technologies in children’s daily lives and result in more time spent in sedentary behaviors. The profound increase in time spent in transport-related sedentary behaviors from 2011 to 2015 may reflect the impact of the increasing popularity of modern and convenient means of transportation during the rapid urbanization process. In 2015, the time spent in screen-based entertainment among Chinese children was as high as 1.8 hr/day, which is far higher than the target screen time of < 1 hr/day documented in the Healthy China Action Plan (2019–2030). Taken together, an urgent need has emerged for effective interventions and policies to curb the increasing trend of time spent in screen-based entertainment to decrease sedentary time among children in China.
PA volume and sedentary time differed by sociodemographic factors. After controlling for other factors, girls had lower PA volumes than boys. The sex-related difference was more prominent at the 50th and 75th quartiles. A global survey of 1.6 million adolescents showed that the age-standardized prevalence of physical inactivity among boys has decreased from 80% to 78%, while that among girls has been roughly 85% over 15 years since 2001[5]. Our findings suggest a similar trend among Chinese girls, but the prevalence of physical inactivity among Chinese boys increased from 76.0% in 2004 to 80.0% in 2015. In this regard, sex-specific interventions or policies are warranted to eliminate barriers to PA and promote PA among children in China. Interventions targeting girls should focus on increasing their PA volume, while those targeting boys should focus on reducing physical inactivity.
This study shows that age was positively associated with PA volume and sedentary time. A review of systematic studies conducted by the Lancet Physical Activity Series Working Group reported an inverse relationship between age and PA in children and adolescents; however, the included studies were mostly conducted in middle- and high-income countries[24]. In 2012, a study that collected accelerometer data from 2,163 grade 4–11 students in 11 cities in China found that older students had higher levels of sedentary behaviors and lower levels of MVPA than younger students[25]. The findings of a recent systematic review of Chinese studies showed that the effect of age on PA among children aged 3–18 years was inconsistent[26]. In this study, the positive correlates of PA volume with age may be due to the higher basic metabolic rate and relatively larger METs for the same PA in older children. The mixed findings suggest a need to further monitor and track the PAs of Chinese children at different age stages to enhance the sensitivity of PA interventions.
Differences among communities were observed for both PA volume and sedentary time across all survey years and over time. This finding supports the development of interventions targeted at the community level to promote PA and reduce sedentary behaviors among children in China. Children residing in areas with high urbanization levels reported significantly higher PA volumes and sedentary times than those residing in areas with low urbanization levels, indicating that urbanization promoted both PA and sedentary behaviors among Chinese children. Similarly, PA volume and sedentary time in urban children were both higher than those in rural children. A possible explanation is that the rapid economic growth and urbanization in China has brought tremendous changes in transportation mode, communication systems, cultural practices, and infrastructure, which in turn influenced the lifestyle behaviors of children. Our findings on residential areas corroborate the findings of the CHNS from 2010 to 2012, which indicate that the sedentary times of Chinese primary and secondary school students residing in big cities and urban areas were higher than those of children residing in medium-to-small-sized cities and rural areas, respectively[27]. Regarding the region, children from the north reported a significantly lower PA volume than those from the south. Other region-related factors such as topography, climate, and cultural differences may also influence PA.
This study has several strengths. First, this study covered the longest time span and widest survey coverage among studies of similar topics. Second, the analyses of PA trends were controlled for the random effect of communities and adjusted for sociodemographic differences across survey years by using the repeated-measures mixed-effects models. Third, in this study, the random-effects ordinal regression models were applied to show the trends of low, medium, and high levels of PA in Chinese children, which have rarely been studied before. Lastly, quantile regression models, which are a robust method, were used to test the different effects of the influencing factors at different quantiles of PA and sedentary behaviors.
Several limitations of this study must be acknowledged. First, the samples drawn from the CHNS were not nationally representative; however, these may be considered representative of the socioeconomic characteristics of most parts of China, and previous findings were consistent with the findings obtained from the CNHS project. Second, the data from all survey years were treated as cross-sectional data. The significant relationships reported in this study can only be interpreted as correlational relationships, not causal relationships. Third, this study included only sociodemographic factors, and the influences of other factors such as other family and environmental factors must be further examined. Fourth, PA and sedentary behavior outcomes were based on self-reports, which may be subject to recall bias. Finally, the metabolic equivalent coding system for PA used in this study was developed based on Western countries, which may not be applicable to Chinese children.
-
This study highlights that physical inactivity among children is a public health problem in China and warrants urgent actions to increase PA and curb the increasing trend of sedentary behaviors. More concerted and focused efforts are needed to develop effective strategies to increase in-school PA and reduce screen-based sedentary behaviors among children. Age, family income, urbanization level of the community, and residential area were common correlates of PA and sedentary behaviors. Sex, ethnicity, and regional differences were also observed in the PA volume of the Chinese children aged 6–17 years. Urbanization development are ‘double-edged swords’ that could promote PA and sedentary behaviors. As China is undergoing rapid urbanization and economic development, monitoring the trend and correlates of PA and sedentary behaviors has the potential to promote PA interventions and strategies among children, ultimately improving children’s health in the future.
-
All authors were involved in the conceptualization of the review and revision of the manuscript. Dr. YANG Xi contributed to the conceptualization and design of the study, analysis and interpretation of data, and drafting of the manuscript. Dr. LEUNG Wai Yi designed the study and drafted the manuscript. Prof. JAGO Russell contributed intellectual input into the main ideas of this paper and assisted with the writing of the manuscript. Prof. YU Shi Chen contributed to the study analyses. Dr. ZHAO Wen Hua directed all aspects of the study, including the design of the study, administration of the analyses, and interpretation of the results. All authors have read and approved the final manuscript.
-
We thank all the project staff, participants and their parents, teachers, and institutions from the China Health and Nutrition Survey project. We thank the National Institute for Nutrition and Health, China Center for Disease Control and Prevention. We are also grateful for the funding from the NIH to the Carolina Population Center of the University of North Carolina at Chapel Hill (P2C HD050924, T32 HD007168) and research grants from the NIH (R01 HD30880, P30DK056350, and R01 HD38700) and NIH Fogarty (D43 TW009077) that financially supported the collection of CHNS data and relative files from 2004 to 2015.
-
The authors declare that they have no competing interests.
doi: 10.3967/bes2021.059
Physical Activity and Sedentary Behaviors among Chinese Children: Recent Trends and Correlates
-
Abstract:
Objective This study was aimed at examining the trends and correlates of physical activity (PA) and sedentary behaviors among Chinese children. Methods A total of 4,341 subjects (6,936 observations) aged 6–17 years who participated in the China Health and Nutrition Survey (2004–2015) were included. Of the subjects, 41% participated in the survey twice or more. Random-effects ordinal regression models and repeated-measures mixed-effects models were used to examine the PA trends. Quantile regression models were applied to examine the factors influencing PA and sedentary behaviors. Results From 2004 to 2015, the prevalence of physical inactivity among Chinese children aged 6–17 years increased by 5.5% [odds ratio (OR), 1.51; 95% confidence interval (CI), 1.19–1.90; P < 0.001]. The PA volume declined by 5.8 metabolic equivalent of task-hr/week (P < 0.001), and the time spent in sedentary behaviors increased by 1.8 hr/week (P < 0.001). Age, ethnicity, and region showed significant effects on the PA volume across the quartiles (P < 0.001). Across the quartiles, sedentary time was significantly higher in the children residing in urban areas (P < 0.001) or areas with high urbanization levels (P ≤ 0.005) than in their counterparts. Conclusions A declining PA trend among Chinese children aged 6–17 years was observed from 2004 to 2015, and certain subgroups and geographical areas are at higher risk of physical inactivity. -
Key words:
- Physical activity /
- Sedentary behaviors /
- Trends /
- Correlates /
- China /
- Children
-
Figure 1. Trends of physical activity levels among Chinese children from 2004 to 2015. The random-effects ordinal regression model was conducted to examine the trends in PA levels across CHNS survey years, controlling for the random effect of communities and adjusting for socio-demographic factors including gender, age, ethnicity, paternal education level, maternal education level, annual family income, urbanization index of community, residential area and region. CHNS: China Health and Nutrition Survey.
Figure 2. Trends of physical activity among Chinese children from 2004 to 2015. Repeated measures mixed effect models were conducted to examine the trends of PA across CHNS survey years, controlling for the random effect of communities and adjusting for socio-demographic factors including gender, age, ethnicity, paternal education level, maternal education level, annual family income, urbanization index of community, residential area and region. “−−” indicates a significant decrease in the overall trend (P < 0.001). PA: Physical Activity; MVPA: Moderate- to Vigorous-intensity Physical Activity; CHNS: China Health and Nutrition Survey.
Figure 3. Trends of sedentary behaviors among Chinese children from 2004 to 2015. Repeated measures mixed effect models were conducted to examine the trends of sedentary behaviors across CHNS survey years, controlling for the random effect of communities and adjusting for socio-demographic factors including gender, age, ethnicity, paternal education level, maternal education level, annual family income, urbanization index of community, residential area and region. “++” indicates a significant increase in the overall trend (P < 0.001); “+” indicates an increase in the overall trend (P < 0.05); “−−” indicates a significant decrease in the overall trend (P < 0.001). CHNS: China Health and Nutrition Survey.
Table 1. Demographic characteristic of the participants
Variables CHNS year Statistics
(P value)2004 2006 2009 2011 2015 N 1,593 1,267 1,141 1,544 1,391 Sex (%)a Boys 854 (53.6) 677 (53.4) 644 (56.4) 791 (51.2) 728 (52.3) Z = −0.304
(Unilateral P = 0.381)Girls 739 (46.4) 590 (46.6) 497 (43.6) 753 (48.8) 663 (47.7) Age (years), mean ± SDd 11.9 ± 3.3 11.3 ± 3.4 11.0 ± 3.2 10.8 ± 3.3 10.2 ± 3.1 F = 64.5 (P < 0.001) Ethnicity (%)b Han 1,374 (86.3) 1,065 (84.1) 957 (83.9) 1,353 (87.6) 1,212 (87.1) Z = −0.458
(Unilateral P = 0.323)Minority 219 (13.7) 202 (15.9) 182 (16.0) 189 (12.3) 169 (12.2) Unknown 0 0 2 (0.1) 2 (0.1) 10 (0.7) Annual family income (thousands), mean ± SDd 0.4 ± 0.9 0.7 ± 1.2 1.2 ± 3.0 2.1 ± 3.9 5.4 ± 20.8 F = 44.0 (P < 0.001) Paternal educational level (%)c Low (primary or below) 204 (12.8) 198 (15.6) 153 (13.4) 225 (14.6) 195 (14.0) Χ2 = 0.000 (P = 0.995) Middle (secondary completed) 1,203 (75.5) 938 (74.0) 871 (76.3) 1,122 (72.6) 1,041 (74.8) High (college or higher) 186 (11.7) 131 (10.4) 117 (10.3) 197 (12.8) 155 (11.2) Maternal educational level (%)c Low (primary or below) 307 (19.3) 271 (21.4) 225 (19.7) 315 (20.4) 283 (20.4) Χ2 = 0.002 (P = 0.966) Middle (secondary completed) 1,102 (69.2) 870 (68.6) 805 (70.6) 1,040 (67.4) 960 (69.0) High (college or higher) 184 (11.6) 126 (9.9) 111 (9.7) 189 (12.2) 148 (10.6) Urbanization index (SD)d 58.6 (19.9) 61.7 (20.1) 64.6 (18.9) 70.5(19.6) 72.1 (17.3) F = 110.8 (P < 0.001) Residential areas (%)a Urban 444 (27.9) 370 (29.2) 308 (27.0) 583 (37.8) 486 (34.9) Z = 1.540
(Unilateral P = 0.062)Rural 1,149 (72.1) 897 (70.8) 833 (73.0) 961 (62.2) 905 (65.1) Region (%)a North 679 (42.6) 500 (39.5) 402 (35.2) 494 (32.0) 446 (32.1) Z = −1.88
(Unilateral P = 0.03)South 914 (57.4) 767 (60.5) 739 (64.8) 1,050 (68.0) 945 (67.9) Note. aUsing the Cochran-Armitage trend test. bUsing the Fisher exact test. cUsing the Mantel-Haenszel chi-square test. dUsing the multiple linear model to test the trends after adjusting for other sociodemographic characteristics. CHNS: China Health and Nutrition Survey.  下载: 导出CSV
Table 2. Results of the repeated-measures mixed-effects model and quantile regression model analyses of the factors associated with the volume of physical activity among Chinese children from 2004 to 2015
Variables Repeated-measures
mixed-effects modelsQuantile regression models 25th quantile 50th quantile 75th quantile Trend tests
(P value)β value (SE) P value β value
(95% CI)P value β value
(95% CI)P value β value
(95% CI)P value CHNS year 2015 −5.7 (1.9) 0.003 −5.4
(−6.6, −4.2)< 0.001 −6.5
(−8.6, −4.4)< 0.001 −5.8
(−10.6, −1)0.018 < 0.001 2011 2.1 (1.8) 0.245 0.4
(−0.9, 1.8)0.531 3.6
(1.4, 5.8)0.001 4.3
(0.4, 8.2)0.029 2009 1.4 (1.9) 0.467 0.1
(−1.4, 1.7)0.869 1.2
(−0.9, 3.2)0.279 1.2
(−2.7, 5.1)0.547 2006 −1.2 (1.8) 0.514 −1.3
(−2.6, 0)0.048 −0.8
(−2.9, 1.3)0.476 −2.4
(−6.4, 1.6)0.233 2004 0 0 0 0 Sex Boys 9.1 (1) < 0.001 0.1
(−0.8, 1)0.777 4.0
(2.6, 5.5)< 0.001 12.8
(10.1, 15.6)< 0.001 < 0.001 Girls 0 0 0 0 Age (years) 6–11 −16.9 (1) < 0.001 −5.9
(−7.2, −4.5)< 0.001 −14.2
(−16.2, −12.3)< 0.001 −22.3
(−25.3, −19.3)< 0.001 < 0.001 12–17 0 0 0 0 Ethnicity Han −6.9 (1.9) < 0.001 −2.4
(−3.6, −1.1)< 0.001 −3.6
(−5.9, −1.2)0.003 −11.3
(−15.9, −6.8)< 0.001 < 0.001 Minority 0 0 0 0 Family income level (yuan) Low
(≤ 50,000)−5.6 (1.8) 0.002 −1.1
(−3, 0.8)0.256 −1.9
(−4.8, 0.9)0.181 −11.0
(−18.3, −3.7)0.003 0.014 High
(> 50,000)0 0 0 0 Paternal educational level Low
(primary or
below)4.1 (7.8) 0.599 −0.6
(−3, 1.7)0.598 1.1
(−10.3, 12.5)0.848 −4.7
(−12.5, 3.1)0.239 0.702 Middle
(secondary
completed)6.1 (7.5) 0.415 −0.4
(−1.9, 1.1)0.642 2.6
(−8.4, 13.6)0.647 −0.3
(−4.7, 4.1)0.906 High (college or higher) 0 0 0 0 Maternal educational level Low (primary or below) −4.7 (7.9) 0.548 0.1
(−2.2, 2.3)0.957 −1.9
(−13.3, 9.6)0.747 3.3
(−4.7, 11.4)0.421 0.611 Middle (secondary completed) −5.4 (7.6) 0.478 0.2
(−1.6, 1.9)0.845 −2.3
(−13.5, 8.9)0.689 −0.6
(−6.6, 5.4)0.848 High (college or higher) 0 0 0 0 Urbanization level of the community Low −2.7 (1.9) 0.145 −1.8
(−3.1, −0.5)0.006 −2.4
(−4.3, −0.5)0.013 −3.2
(−6.8, 0.5)0.092 0.413 Middle −0.8 (1.7) 0.633 −0.8
(−1.9, 0.4)0.203 −2.1
(−3.9, −0.3)0.023 −2
(−5.5, 1.6)0.275 High 0 0 0 0 Residential area Urban 6.1 (1.7) < 0.001 0.4
(−0.7, 1.5)0.434 3.6
(1.6, 5.5)< 0.001 11
(7.4, 14.6)< 0.001 < 0.001 Rural 0 0 0 0 Region North −4.5 (1.4) 0.002 −4.0
(−4.8, −3.1)< 0.001 −6.7
(−8.0, −5.3)< 0.001 −7.4
(−10.2, −4.7)< 0.001 < 0.001 South 0 0 0 0 Random effects* σ2μ0 (intercept) 39.0 (12.9) 0.001 σ2μ01 (covariance) 102.4 (18.1) < 0.001 σ2μ1 1469.5 (27.0) < 0.001 Note. *These were the random effects of the communities in the repeated-measures mixed-effects models on the volume of physical activity. Interclass variance: 39.0/(39.0 + 1469.5) × 100% = 2.6%. Intraclass variance: 100.0% – 2.6% = 97.4%. CHNS: China Health and Nutrition Survey; CI: Confidence interval.
下载: 导出CSV
Table 3. Results of the repeated-measures mixed-effects model and quantile regression model analyses of factors associated with the time spent in sedentary behaviors among Chinese children from 2004 to 2015
Variables Repeated-measures
mixed-effect modelsQuantile regression models 25th quantile 50th quantile 75th quantile Trend tests
(P value)β value (SE) P value β value
(95% CI)P value β value
(95% CI)P value β value
(95% CI)P value CHNS year 2015 1.9 (0.6) 0.003 −0.4
(−1.5, 0.6)0.432 1.1 (−0.2, 2.4) 0.088 4 (2.4, 5.6) < 0.001 < 0.001 2011 4.1 (0.6) < 0.001 3.8 (3, 4.7) < 0.001 4.2 (3.1, 5.3) < 0.001 4.6 (3.4, 5.8) < 0.001 2009 3.2 (0.6) < 0.001 2.9 (1.9, 3.9) < 0.001 3.5 (2.5, 4.6) < 0.001 3.5 (2.3, 4.6) < 0.001 2006 3 (0.6) < 0.001 2.5 (1.6, 3.4) < 0.001 2.9 (1.9, 4) < 0.001 3.1 (2.1, 4.2) < 0.001 2004 0 0 0 0 Sex Boys 0.5 (0.3) 0.098 −0.2
(−0.8, 0.4)0.592 −0.3 (−1,0.4) 0.413 0.5
(−0.2, 1.3)0.170 0.060 Girls 0 0 0 0 Age (years) 6–11 −1.2 (0.3) < 0.001 −0.1
(−0.8, 0.6)0.812 −1.1
(−1.9, −0.3)0.007 −2.6
(−3.5, −1.8)< 0.001 < 0.001 12–17 0 0 0 0 Ethnicity Han −0.9 (0.6) 0.157 −0.6
(−1.4, 0.2)0.153 −1.2
(−2.4, 0)0.041 −2.3
(−3.4, −1.3)< 0.001 0.007 Minority 0 0 0 0 Family income level (yuan) Low
(≤ 50,000)−1.7 (0.6) 0.004 −1.3
(−2.8, 0.3)0.119 −2.9
(−4.4, −1.4)< 0.001 −3.7
(−5.7, −1.7)< 0.001 0.040 High
(> 50,000)0 0 0 0 Paternal educational level Low (primary or below) −0.9 (2.5) 0.737 −4.9
(−9.7, −0.1)0.045 −0.9
(−4.3, 2.5)0.590 0.5
(−1.6, 2.6)0.643 0.285 Middle (secondary
completed)0.2 (2.4) 0.920 −3.9
(−8.4, 0.6)0.092 −0.4
(−3.3, 2.6)0.797 1.0 (0, 2.0) 0.043 High (college or higher) 0 0 0 Maternal educational level Low (primary or below) −0.5 (2.6) 0.854 3.6
(−1.2, 8.4)0.137 −1.4
(−4.8, 2)0.425 −2
(−4.1, 0.1)0.058 0.049 Middle (secondary
completed)−1 (2.5) 0.682 2.7
(−1.9, 7.3)0.245 −0.8
(−3.9, 2.3)0.607 −1.8
(−3.2, −0.3)0.016 High (college or higher) 0 0 0 0 Urbanization level of the community Low −1.3 (0.6) 0.050 −2.6
(−3.4, −1.8)< 0.001 −1.4
(−2.4, −0.4)0.005 −1.5
(−2.5, −0.5)0.003 0.038 Middle −0.3 (0.6) 0.628 −1.1
(−1.9, −0.2)0.013 0.1 (−0.9, 1) 0.914 −0.2
(−1.2, 0.8)0.674 High 0 0 0 0 Residential area Urban 3.2 (0.6) < 0.001 2.6 (1.8, 3.3) < 0.001 3.3 (2.5, 4.2) < 0.001 3.6 (2.6, 4.6) < 0.001 0.100 Rural 0 0 0 0 Region North −0.3 (0.5) 0.538 −0.8
(−1.4, −0.1)0.031 −0.4
(−1.1, 0.4)0.346 0.4
(−0.5, 1.3)0.403 0.058 South 0 0 0 0 Random effects* σ2μ0 (intercept) 5.7 (1.4) 0.001 σ2μ01 (covariance) 13.1 (2.0) < 0.001 σ2μ1 153.3 (2.8) < 0.001 Note. *These were the random effects of the communities in the repeated-measures mixed-effects models on the time spent in sedentary behaviors. Interclass variance: 5.7/(5.7 + 153.3) × 100% = 3.6%. Intraclass variance: 100.0% – 3.6% = 96.4%. CHNS: China Health and Nutrition Survey; CI: Confidence interval.
下载: 导出CSV
-
[1] Poitras VJ, Gray CE, Borghese MM, et al. Systematic review of the relationships between objectively measured physical activity and health indicators in school-aged children and youth. Appl Physiol Nutr Metab, 2016; 41, S197−239. doi: 10.1139/apnm-2015-0663 [2] Gómez-Bruton A, Matute-Llorente Á, González-Agüero A, et al. Plyometric exercise and bone health in children and adolescents: a systematic review. World J Pediatr, 2017; 13, 112−21. doi: 10.1007/s12519-016-0076-0 [3] Li FZ, Mao LJ, Chen PJ. Physical activity and prevention of chronic disease in Chinese youth: a public health approach. J Sport Health Sci, 2019; 8, 512−5. doi: 10.1016/j.jshs.2019.06.008 [4] Dimitri P, Joshi K, Jones N. Moving more: physical activity and its positive effects on long term conditions in children and young people. Arch Dis Child, 2020; 105, 1035−40. doi: 10.1136/archdischild-2019-318017 [5] Guthold R, Stevens GA, Riley LM, et al. Global trends in insufficient physical activity among adolescents: a pooled analysis of 298 population-based surveys with 1•6 million participants. Lancet Child Adolesc Health, 2020; 4, 23−35. doi: 10.1016/S2352-4642(19)30323-2 [6] Aubert S, Barnes JD, Abdeta C, et al. Global matrix 3.0 physical activity report card grades for children and youth: results and analysis from 49 countries. J Phys Act Health, 2018; 15, S251−73. doi: 10.1123/jpah.2018-0472 [7] World Health Organization. Global action plan on physical activity 2018-2030: more active people for a healthier world. Geneva: World Health Organization, 2018. [8] Hallal PC, Martins RC, Ramírez A. The Lancet physical activity observatory: promoting physical activity worldwide. Lancet, 2014; 384, 471−2. doi: 10.1016/S0140-6736(14)61321-0 [9] Kohl III HW, Craig CL, Lambert EV, et al. The pandemic of physical inactivity: global action for public health. Lancet, 2012; 380, 294−305. doi: 10.1016/S0140-6736(12)60898-8 [10] The Lancet. Ready, set, go for physical activity. Lancet, 2013; 381, 1960. [11] Okely AD, Tremblay MS, Reilly JJ, et al. Physical activity, sedentary behaviour, and sleep: movement behaviours in early life. Lancet Child Adolesc Health, 2018; 2, 233−5. doi: 10.1016/S2352-4642(18)30070-1 [12] Ding D. Surveillance of global physical activity: progress, evidence, and future directions. Lancet Glob Health, 2018; 6, E1046−7. doi: 10.1016/S2214-109X(18)30381-4 [13] Cui ZH, Hardy LL, Dibley MJ, et al. Temporal trends and recent correlates in sedentary behaviours in Chinese children. Int J Behav Nutr Phys Act, 2011; 8, 93. doi: 10.1186/1479-5868-8-93 [14] Dearth-Wesley T, Howard AG, Wang HJ, et al. Trends in domain-specific physical activity and sedentary behaviors among Chinese school children, 2004-2011. Int J Behav Nutr Phys Act, 2017; 14, 141. doi: 10.1186/s12966-017-0598-4 [15] Das P, Horton R. Physical activity—time to take it seriously and regularly. Lancet, 2016; 388, 1254−5. doi: 10.1016/S0140-6736(16)31070-4 [16] Zhang B, Zhai FY, Du SF, et al. The China health and nutrition survey, 1989-2011. Obes Rev, 2014; 15, 2−7. [17] China Health and Nutrition Survey. A UNC carolina population center project. https://www.cpc.unc.edu/projects/china. [2020-02-10]. [18] Butte N, Watson K, Ridley K, et al. A youth compendium of physical activities: activity codes and metabolic intensities. Med Sci Sports Exerc, 2018; 50, 246−56. [19] Zhang YT, Ma SX, Chen C, et al. Physical activity guidelines for Chinese children. Chin J Evid Based Pediatr, 2017; 12, 401−9. [20] Jones-Smith JC, Popkin BM. Understanding community context and adult health changes in China: development of an urbanicity scale. Soc Sci Med, 2010; 71, 1436−46. doi: 10.1016/j.socscimed.2010.07.027 [21] Koenker R, Bassett Jr G. Regression quantiles. Econometrica, 1978; 46, 33−50. doi: 10.2307/1913643 [22] Knuth AG, Hallal PC. Temporal trends in physical activity: a systematic review. J Phys Act Health, 2009; 6, 548−59. doi: 10.1123/jpah.6.5.548 [23] Bucksch J, Sigmundova D, Hamrik Z, et al. International trends in adolescent screen-time behaviors from 2002 to 2010. J Adolesc Health, 2016; 58, 417−25. doi: 10.1016/j.jadohealth.2015.11.014 [24] Bauman AE, Reis RS, Sallis JF, et al. Correlates of physical activity: why are some people physically active and others not? Lancet, 2012; 380, 258−71. doi: 10.1016/S0140-6736(12)60735-1 [25] Wang C, Chen PJ, Zhuang J. A national survey of physical activity and sedentary behavior of Chinese city children and youth using accelerometers. Res Q Exerc Sport, 2013; 84, S12−28. doi: 10.1080/02701367.2013.850993 [26] Lu CC, Stolk RP, Sauer PJJ, et al. Factors of physical activity among Chinese children and adolescents: a systematic review. Int J Behav Nutr Phys Act, 2017; 14, 36. doi: 10.1186/s12966-017-0486-y [27] Song C, Gong WY, Ding CC, et al. Physical activity and sedentary behavior among Chinese children aged 6-17 years: a cross-sectional analysis of 2010-2012 China National Nutrition and health survey. BMC Public Health, 2019; 19, 936. doi: 10.1186/s12889-019-7259-2 -

 点击查看大图
计量
- 文章访问数: 2268
- HTML全文浏览量: 1005
- PDF下载量: 153
- 被引次数: 0

 Quick Links