

 下载:
下载:


-
Coronavirus disease 2019 (COVID-19), which is caused by the severe acute respiratory syndrome coronavirus 2 (SARS-CoV-2), has become a global pandemic[1]. Primary prevention, which is aimed at delaying disease onset by modulating modifiable risk factors, has been proposed to address the global challenge posed by COVID-19.
Vitamin D plays a critical role in the immune system, and vitamin D deficiency is a risk factor for several adverse health outcomes, such as cancer, cardiovascular diseases, metabolic disorders, infectious diseases, and autoimmune diseases. Some studies have shown that low 25 hydroxyvitamin D (25OHD) concentrations are associated with a high risk of COVID-19[2], but other studies have found no association[3]. Therefore, the association between 25OHD concentrations and the risk of COVID-19 has not been established. The above studies were observational, and traditional epidemiological studies are vulnerable to reverse causality and residual confounding.
A promising approach, known as Mendelian randomization (MR), which uses inherited genetic variants as variables, can provide better evidence for the causal effect of exposure on diseases and largely overcome the traditional limitations related to confounding and reverse causality[4]. The two-sample MR method is an excellent strategy for evaluating causality using summary statistics from genome-wide association study (GWAS) data. The summary statistics from the GWAS data released by the UK biobank and Severe COVID-19 GWAS Group is based on the European population. The data were obtained from the largest sample, as of now, and they were aimed for using in the exploration of the genetic variants of the outcomes related to COVID-19 susceptibility and severity[5]. In the present study, we conducted an MR analysis to investigate a causal relationship between 25OHD concentration and COVID-19.
The summary data were obtained from the most recent version of the results of the GWAS analyses for the COVID-19 host genetics initiative involving UKB individuals, which was released on July 1, 2020 (
https://www.covid19hg.org/results/ ). Two phenotypes, including COVID-19 and severe respiratory infection confirmed as COVID-19, were examined. Detailed information on the phenotypes is provided in Supplementary Table S1 (available in www.besjournal.com). The summary data on COVID-19 and severe respiratory infection confirmed as COVID-19 were based on three comparisons: patients with COVID-19 (n = 6,696) and the general population without the phenotype (n = 1,073,072)—the population hereafter was named UKB-COVID-19; patients with COVID-19 (n = 3,523) and those without COVID-19 (n = 36,634)—the population hereafter was named UKB-COVID-19-negative; patients with severe respiratory infection confirmed as COVID-19 (n = 536) and the general population without the phenotype (n = 329,391)—the population hereafter was named severe UKB-COVID-19. In addition, we used summary data for severe respiratory confirmed COVID-19 reported by the Severe COVID-19 GWAS Group (https://ikmb.shinyapps.io/COVID-19_GWAS_Browser/ ). The study included 1,160 patients with severe respiratory infection confirmed as COVID-19 and 2,205 control participants from the general population without COVID-19 (hereafter severe COVID-19). The definitions of severe respiratory infection confirmed as COVID-19 by the Severe COVID-19 GWAS Group and the COVID-19 host genetics initiative were different (Supplementary Table S1).Table S1. Basic information of the GWAS data*
Phenotype Cases Control n Definition n Definition UKB-COVID-19 6,696 Individuals with laboratory confirmation of SARS-CoV-2 infection (RNA and/or serology based) OR EHR/ICD coding/Physician Confirmed COVID-19 OR self-reported COVID-19 positive (e.g. by questionnaire) 1,073,072 Everybody who is not a case, e.g. population UKB-COVID-19 negative& 3,523 Individuals with laboratory confirmation of SARS-CoV-2 infection (RNA and/or serology based) OR EHR/ICD coding/Physician Confirmed COVID-19 OR self-reported COVID-19 positive (e.g. by questionnaire) 36,634 [Laboratory tested for SARS-CoV-2 infection (RNA and/or serology based) AND all tests (if multiple tests) negative*] OR self-reported tested negative for SARS-CoV-2 infection (e.g. by questionnaire) Severe UKB-COVID-19 536 Hospitalized laboratory confirmed SARS-CoV-2 infection (RNA and/or serology based), AND (death OR respiratory support (intubation, CPAP, BiPAP, CNP (continue external negative pressure), Optiflow/very high flow Positive End Expiratory Pressure Oxygen* - AND hospitalization with COVID19 as primary reason for admission 329,391 Everybody who is not a case, e.g. population Severe COVID-19# 1,610 Hospitalization with respiratory failure and a confirmed SARS-CoV-2 viral RNA polymerase-chain-reaction (PCR) test from nasopharyngeal swabs or other relevant biologic fluids 2,205 Everybody who is not a case, e.g. population Note. *Summarized data were provided by the COVID-19 host genetics initiative (https://www.covid19hg.org/results/) unless otherwise noted. #The GWAS summarized data were provided by the Severe Covid-19 GWAS Group (https://ikmb.shinyapps.io/COVID-19_GWAS_Browser/). &The control is the non-predicted COVID-19 and non-self-reported COVID-19. COVID-19, corona virus disease 2019; UKB, UK Biobank. One hundred and forty-three single-nucleotide polymorphisms (SNPs) were selected as instrumental variables (IVs) for the 25OHD concentration based on a recent large-scale GWAS involving 417,580 Europeans[6], which explains the 10.5% variance of the serum 25OHD concentrations. In addition, we retained independent variants (linkage disequilibrium [LD], r2 < 0.001) for sensitivity analysis. The SNP with the lowest P
-value was selected when we encountered genetic variants with LD. The LD proxies were defined using 1,000 European genomes. For the analyses, only the genetic variants with available SNP-exposure and SNP-outcome association data were retained. The inverse-variance weighted (IVW) method was used to estimate the overall association between 25OHD concentrations and COVID-19 susceptibility and severity, and the weighted median, penalized weighted median, and MR-Egger regression were used to detect potential violations of the valid instrumental variable assumptions. The MR-Egger analysis was performed to evaluate pleiotropy based on the intercept. The heterogeneity tests were performed using IVW Q-test. Sensitivity analyses were performed to examine the stability of the causal estimate. Firstly, we performed a “leave one out” analysis to further investigate the possibility that the association was driven by a single SNP. We retained independent variants (LD, r2 < 0.001) for further sensitivity analysis. The results are presented as odds ratios (OR) with 95% confidence interval (CI) and beta with standard error (SE) of outcomes per genetically predicted increase in each exposure factor.
Regarding the various estimates for different measures, we chose the result of the main MR method according to the following rules:
(1) If there was no directional pleiotropy in the MR estimates (Q statistic: P-value > 0.05, MR-Egger intercept: P-value > 0.05), the results of the IVW method were reported.
(2) If directional pleiotropy was detected (MR-Egger intercept: P-value < 0.05) and a P-value of > 0.05 was observed for the Q-test, the results of the MR-Egger method were reported.
(3) If directional pleiotropy was detected (MR-Egger intercept: P-value < 0.05) and a P-value of < 0.05 was observed for the Q-test, the results of the weighted median method were reported.
All data analyses were performed using the “TwoSampleMR” package for R version 4.0.0 (
https://www.r-project.org/ ).As shown in Table 1, the MR analysis showed no significant association between the genetically modified 25OHD concentration and COVID-19 in the population of UKB-COVID-19 and UKB-COVID-19 patients (OR = 1.136, 95% CI: 0.988−1.306, P = 0.074; OR = 1.168, 95% CI: 0.956−1.427, P = 0.128). The association between 25OHD concentrations and COVID-19 was robust based on the outcomes of the weighted median and penalized weighted median methods, except for the MR-Egger regression (OR = 1.258, 95% CI: 1.053−1.502, P = 0.013; OR = 1.302, 95% CI: 1.011−1.676, P = 0.044). Pleiotropy bias and heterogeneity were not observed. We report the results of the IVW method based on various estimates for different measures. In addition, the “leave one out” results showed that no individual genetic variants seemed to have any significant effect on the overall results by omitting the included 89 SNPs one at a time (Supplementary Figures S1−S2 available in www.besjournal.com). In addition, the non-causal association between 25OHD concentrations and COVID-19 remained robust based on assessment with the SNP instrument (LD, r2 < 0.001) (Table 1, Supplementary Figures S3−S4 available in www.besjournal.com).
Table 1. Associations between 25OHD concentrations and COVID-19#
Method SNP (n) OR (95% CI) Beta (SE) P SNP (n) OR (95% CI) Beta (SE) P In the population of UKB-COVID-19 IVW 89 1.136 (0.988−1.306) 0.128 (0.071) 0.074 56 1.048 (0.882−1.245) 0.047 (0.088) 0.596 Weighted median 89 1.155 (0.936−1.425) 0.144 (0.107) 0.179 56 1.142 (0.915−1.426) 0.133 (0.113) 0.239 Penalised weighted median 89 1.155 (0.939−1.420) 0.144 (0.106) 0.173 56 1.142 (0.913−1.429) 0.133 (0.114) 0.244 MR_Egger 89 1.258 (1.053−1.502) 0.229 (0.090) 0.013 56 1.149 (0.918−1.439) 0.139 (0.115) 0.230 β (intercept) 89 − −0.007 (0.004) 0.071 56 − −0.006 (0.005) 0.214 Q statistic 89 − − 0.759 56 − − 0.794 In the population of UKB-COVID-19 negative IVW 89 1.168 (0.956−1.427) 0.156 (0.102) 0.128 57 1.192 (0.945−1.504) 0.176 (0.118) 0.138 Weighted median 89 1.017 (0.750−1.379) 0.017 (0.156) 0.912 57 1.134 (0.810−1.588) 0.126 (0.172) 0.464 Penalised weighted median 89 0.990 (0.737−1.328) −0.010 (0.150) 0.945 57 1.134 (0.814−1.579) 0.126 (0.169) 0.457 MR_Egger 89 1.302 (1.011−1.676) 0.260 (0.130) 0.044 57 1.265 (0.951−1.682) 0.235 (0.145) 0.112 β (intercept) 89 − −0.007 (0.005) 0.174 57 − −0.004 (0.006) 0.485 Q statistic 89 − − 0.656 57 − − 0.925 Note. #Summary data were reported by the COVID-19 host genetics initiative. Beta is the estimated effect size. 25OHD, 25 hydroxyvitamin D; CI, confidence interval; COVID-19, coronavirus disease 2019; IVs, instrumental variables; IVW, inverse-variance weighted; MR, Mendelian randomization; OR, odds ratio; SE, standard error; SNP, single-nucleotide polymorphism. The MR analysis showed no significant association between the genetically modified 25OHD concentrations and severe COVID-19 in the population with severe UKB-COVID-19 and severe COVID-19 (OR = 0.889, 95% CI: 0.549−1.439, P = 0.246; OR = 0.894, 95% CI: 0.587−1.363, P = 0.603) (Table 2). This emphasized that the weighted median, penalized weighted median, and MR-Egger regression methods were robust. There was limited evidence of heterogeneity and horizontal pleiotropy based on the Q-test and MR-Egger intercept test. Sensitivity analyses using different instruments yielded similar findings, suggesting the robustness of the observed insignificant association (Table 2, Supplementary Figures S5−S8 available in www.besjournal.com).
Table 2. Association between 25OHD concentrations and severe COVID-19#
Method SNP (n) OR (95% CI) Beta (SE) P SNP (n) OR (95% CI) Beta (SE) P In the population of severe UKB-COVID-19 IVW 82 0.889 (0.549−1.439) −0.118 (0.246) 0.632 55 0.936 (0.532−1.647) −0.067 (0.288) 0.818 Weighted median 82 1.242 (0.618−2.498) 0.217 (0.356) 0.543 55 1.294 (0.605−2.767) 0.257 (0.388) 0.507 Penalised weighted median 82 1.241 (0.620−2.482) 0.216 (0.354) 0.542 55 1.293 (0.585−2.857) 0.257 (0.405) 0.526 MR_Egger 82 0.944 (0.509−1.749) −0.058 (0.315) 0.855 55 0.998 (0.477) −0.002 (0.376) 0.996 β (intercept) 82 − −0.004 (0.012) 0.760 55 − −0.004 (0.015) 0.790 Q statistic 82 − − 0.793 55 − − 0.650 In the population of severe COVID-19* IVW 82 0.894 (0.587−1.363) −0.112 (0.215) 0.603 53 0.780 (0.467−1.300) −0.249 (0.261) 0.340 Weighted median 82 0.638 (0.335−1.215) −0.450 (0.329) 0.171 53 0.633 (0.322−1.244) −0.458 (0.345) 0.185 Penalised weighted median 82 0.636 (0.339−1.195) −0.452 (0.321) 0.160 53 0.633 (0.318−1.261) −0.457 (0.352) 0.193 MR_Egger 82 0.894 (0.523−1.527) −0.112 (0.273) 0.682 53 0.711 (0.365−1.387) −0.341 (0.341) 0.322 β (intercept) 82 − 0.00003 (0.011) 0.997 53 − 0.006 (0.014) 0.678 Q statistic 82 − − 0.789 53 − − 0.555 Note. #Summary data were reported by the COVID-19 host genetics initiative. *Summary data are reported by the Severe Covid-19 GWAS Group. Beta is the estimated effect size. 25OHD, 25 hydroxyvitamin D; CI, confidence interval; COVID-19, coronavirus disease 2019; IVs, instrumental variables; IVW, inverse-variance weighted; MR, Mendelian randomization; OR, odds ratio; SE, standard error; SNP, single-nucleotide polymorphism. The present two-sample MR analysis demonstrated that 25OHD concentrations did not appear to be associated with the risk of COVID-19 susceptibility and severity. Four previous similar MR analyses were performed to explore the association between 25OHD concentrations and the risk of COVID-19[7-10]. Of these, four used the summary GWAS data for vitamin D from the SUNLIGHT Consortium, three also used the summary GWAS data for vitamin D from UKB[7, 9, 10], and two used individual data[7, 10]. Compared with the four previous studies, our study used the GWAS summary data for the 25OHD concentrations with the largest explained variance (10.5%) from the UKB and found a non-causal association between 25OHD and these verity of COVID-19 based on the summary data from the Severe Covid-19 GWAS Group. Our findings were consistent with those of three of the above studies[8-10]; they used individual data [10] and performed MR analysis using summary GWAS data for vitamin D from the SUNLIGHT Consortium.
There are some possible explanations for these negative findings. First, only a few of the genetic variants that affect 25OHD concentrations are included, and the findings may have been biased due to weak IVs. Second, these null findings suggest that the association between 25OHD concentrations and COVID-19 susceptibility and severity may be attributed to reverse causation bias and confounder bias. Vitamin D from the environment, through sunlight or diet, is metabolized in the liver to 25OHD, which is used to determine the vitamin D status of a patient[6, 11]. Vitamin D deficiency is common in patients with severe COVID-19[2], which may be a consequence of quarantine and reduced outdoor behavior or acute infection in COVID-19 patients. The above findings suggest that COVID-19 susceptibility and severity are expected to decrease the prevalence of vitamin D deficiency, which needs to be proven by more bidirectional MR studies. Third, it is also important to note that the MR study considers the lifelong effect of the genetic modification of COVID-19. However, the association between vitamin D concentrations and the risk of COVID-19 may vary with time. The cross-sectional observational nature of all the current MR studies limits the evaluation. Future MR studies incorporating follow-up data should consider the effect of vitamin D concentrations on COVID-19 and how changes in the genetic variant effects with time may impact the interpretability and validity of their results.
This study has some limitations. The MR analyses were based on numerous assumptions. First, the genetic variants were associated with 25OHD concentrations. We selected genetic variants as IVs, based on a recent large-scale GWAS[6], which showed strong associations with 25OHD concentrations; therefore, the bias associated with weak instruments may be less likely. Second, the genetic variants were not associated with measured and unmeasured confounders that influenced both vitamin D and COVID-19. However, the unmeasured confounders (i.e., actual vitamin D intake and UVB exposure) or alternative causal pathways (i.e., the expression of vitamin D binding protein) may still have affected our results because of the limitation of the method. Third, the horizontal pleiotropy may distort the MR results. In our study, there was limited evidence of heterogeneity and horizontal pleiotropy. Fourth, all associations are linear. However, it is difficult to validate this assumption. The violation of this assumption is not essential when the aim is to test the null hypothesis of no effect of vitamin D concentration on COVID-19, but it can cause problems when the aim is to assess the size of the effect. In addition, the GWAS of severe COVID-19 cases involved a small sample, which may have had an effect on the MR estimate and limited the IVs for COVID-19 for reverse MR analysis. There is an overlap between the UK Biobank and the COVID-19 Host Genetics Institute GWAS samples. However, our study adopted a two-sample MR analysis, which may have resulted in a bias. The two samples were selected from the European population and a mixed population, which may also have resulted in bias. In addition, the limitations of relationship between the changes in vitamin D concentrations over time and COVID-19 risk should be considered. Therefore, future studies with larger samples and individual data in one sample are needed to verify and explore the observed associations.
In conclusion, we performed a two-sample MR analysis to explore the associations between vitamin D and the risk of COVID-19 to address the limitations of confounding and reverse causality in observational studies. Our findings showed that 25OHD concentrations did not appear to be associated with the risk of COVID-19 susceptibility and severity. In the future, bi-directional MR should be performed to further validate these results. Future MR studies incorporating follow-up data should consider the effect of vitamin D concentrations on COVID-19 and how changes in genetic variants with time may impact the interpretability and validity of their results.

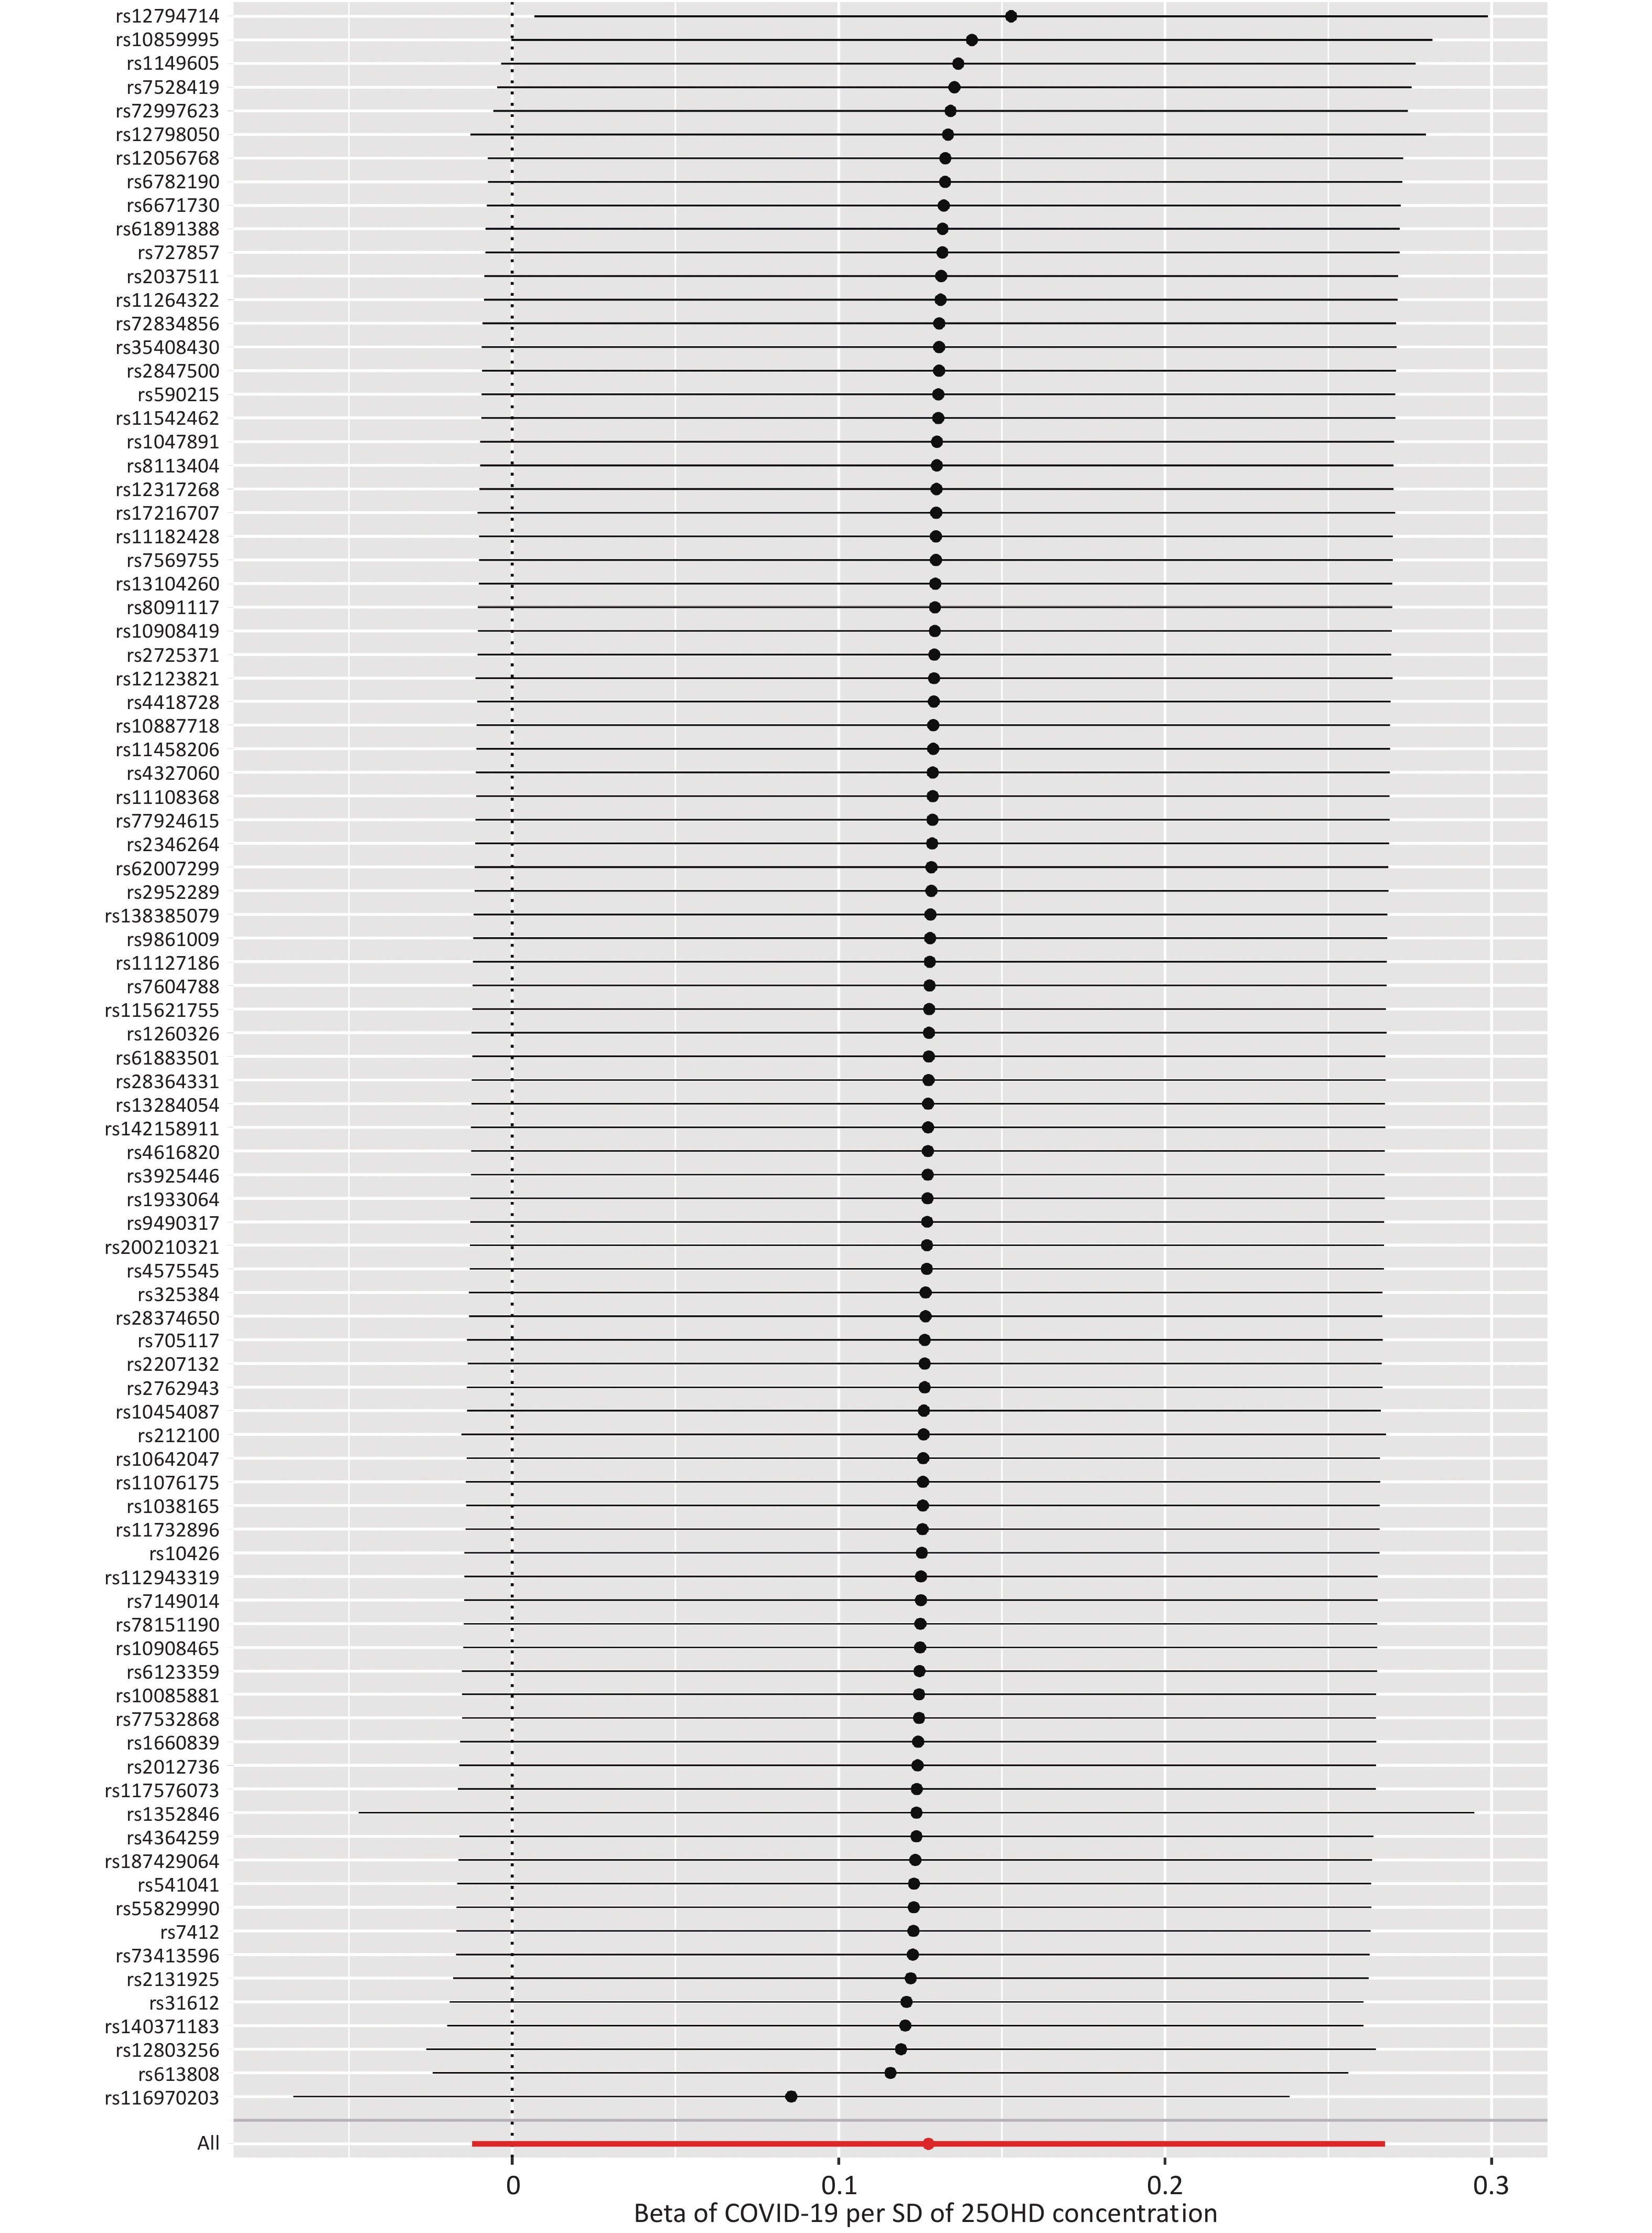
Figure S1. MR leave-one-out sensitivity analysis for ‘25OHD concentration’ on ‘COVID-19’ in the population of UKB-COVID-19 based on 89 SNPs. Leave-one-out analysis: each row represents a MR analysis of 25OHD concentration on COVID-19 using all instruments expect for the SNP listed on the y-axis. The point represents the beta with that SNP removed and the line represents 95% confidence interval. The summary data are reported by the COVID-19 host genetics initiative. COVID-19, coronavirus disease 2019; MR, mendelian randomization; SNP, single-nucleotide polymorphism; 25OHD, 25-hydroxyitamin D; SD, standard deviation; UKB, UK biobank

Figure S2. MR leave-one-out sensitivity analysis for ‘25OHD concentration’ on ‘COVID-19’ in the population of UKB-COVID-19 negative based on 89 SNPs. Leave-one-out analysis: each row represents a MR analysis of 25OHD concentration on COVID-19 using all instruments expect for the SNP listed on the y-axis. The point represents the beta with that SNP removed and the line represents 95% confidence interval. The summary data are reported by the COVID-19 host genetics initiative. COVID-19, coronavirus disease 2019; MR, mendelian randomization; SNP, single-nucleotide polymorphism; 25OHD, 25-hydroxyitamin D; SD, standard deviation; UKB, UK biobank.
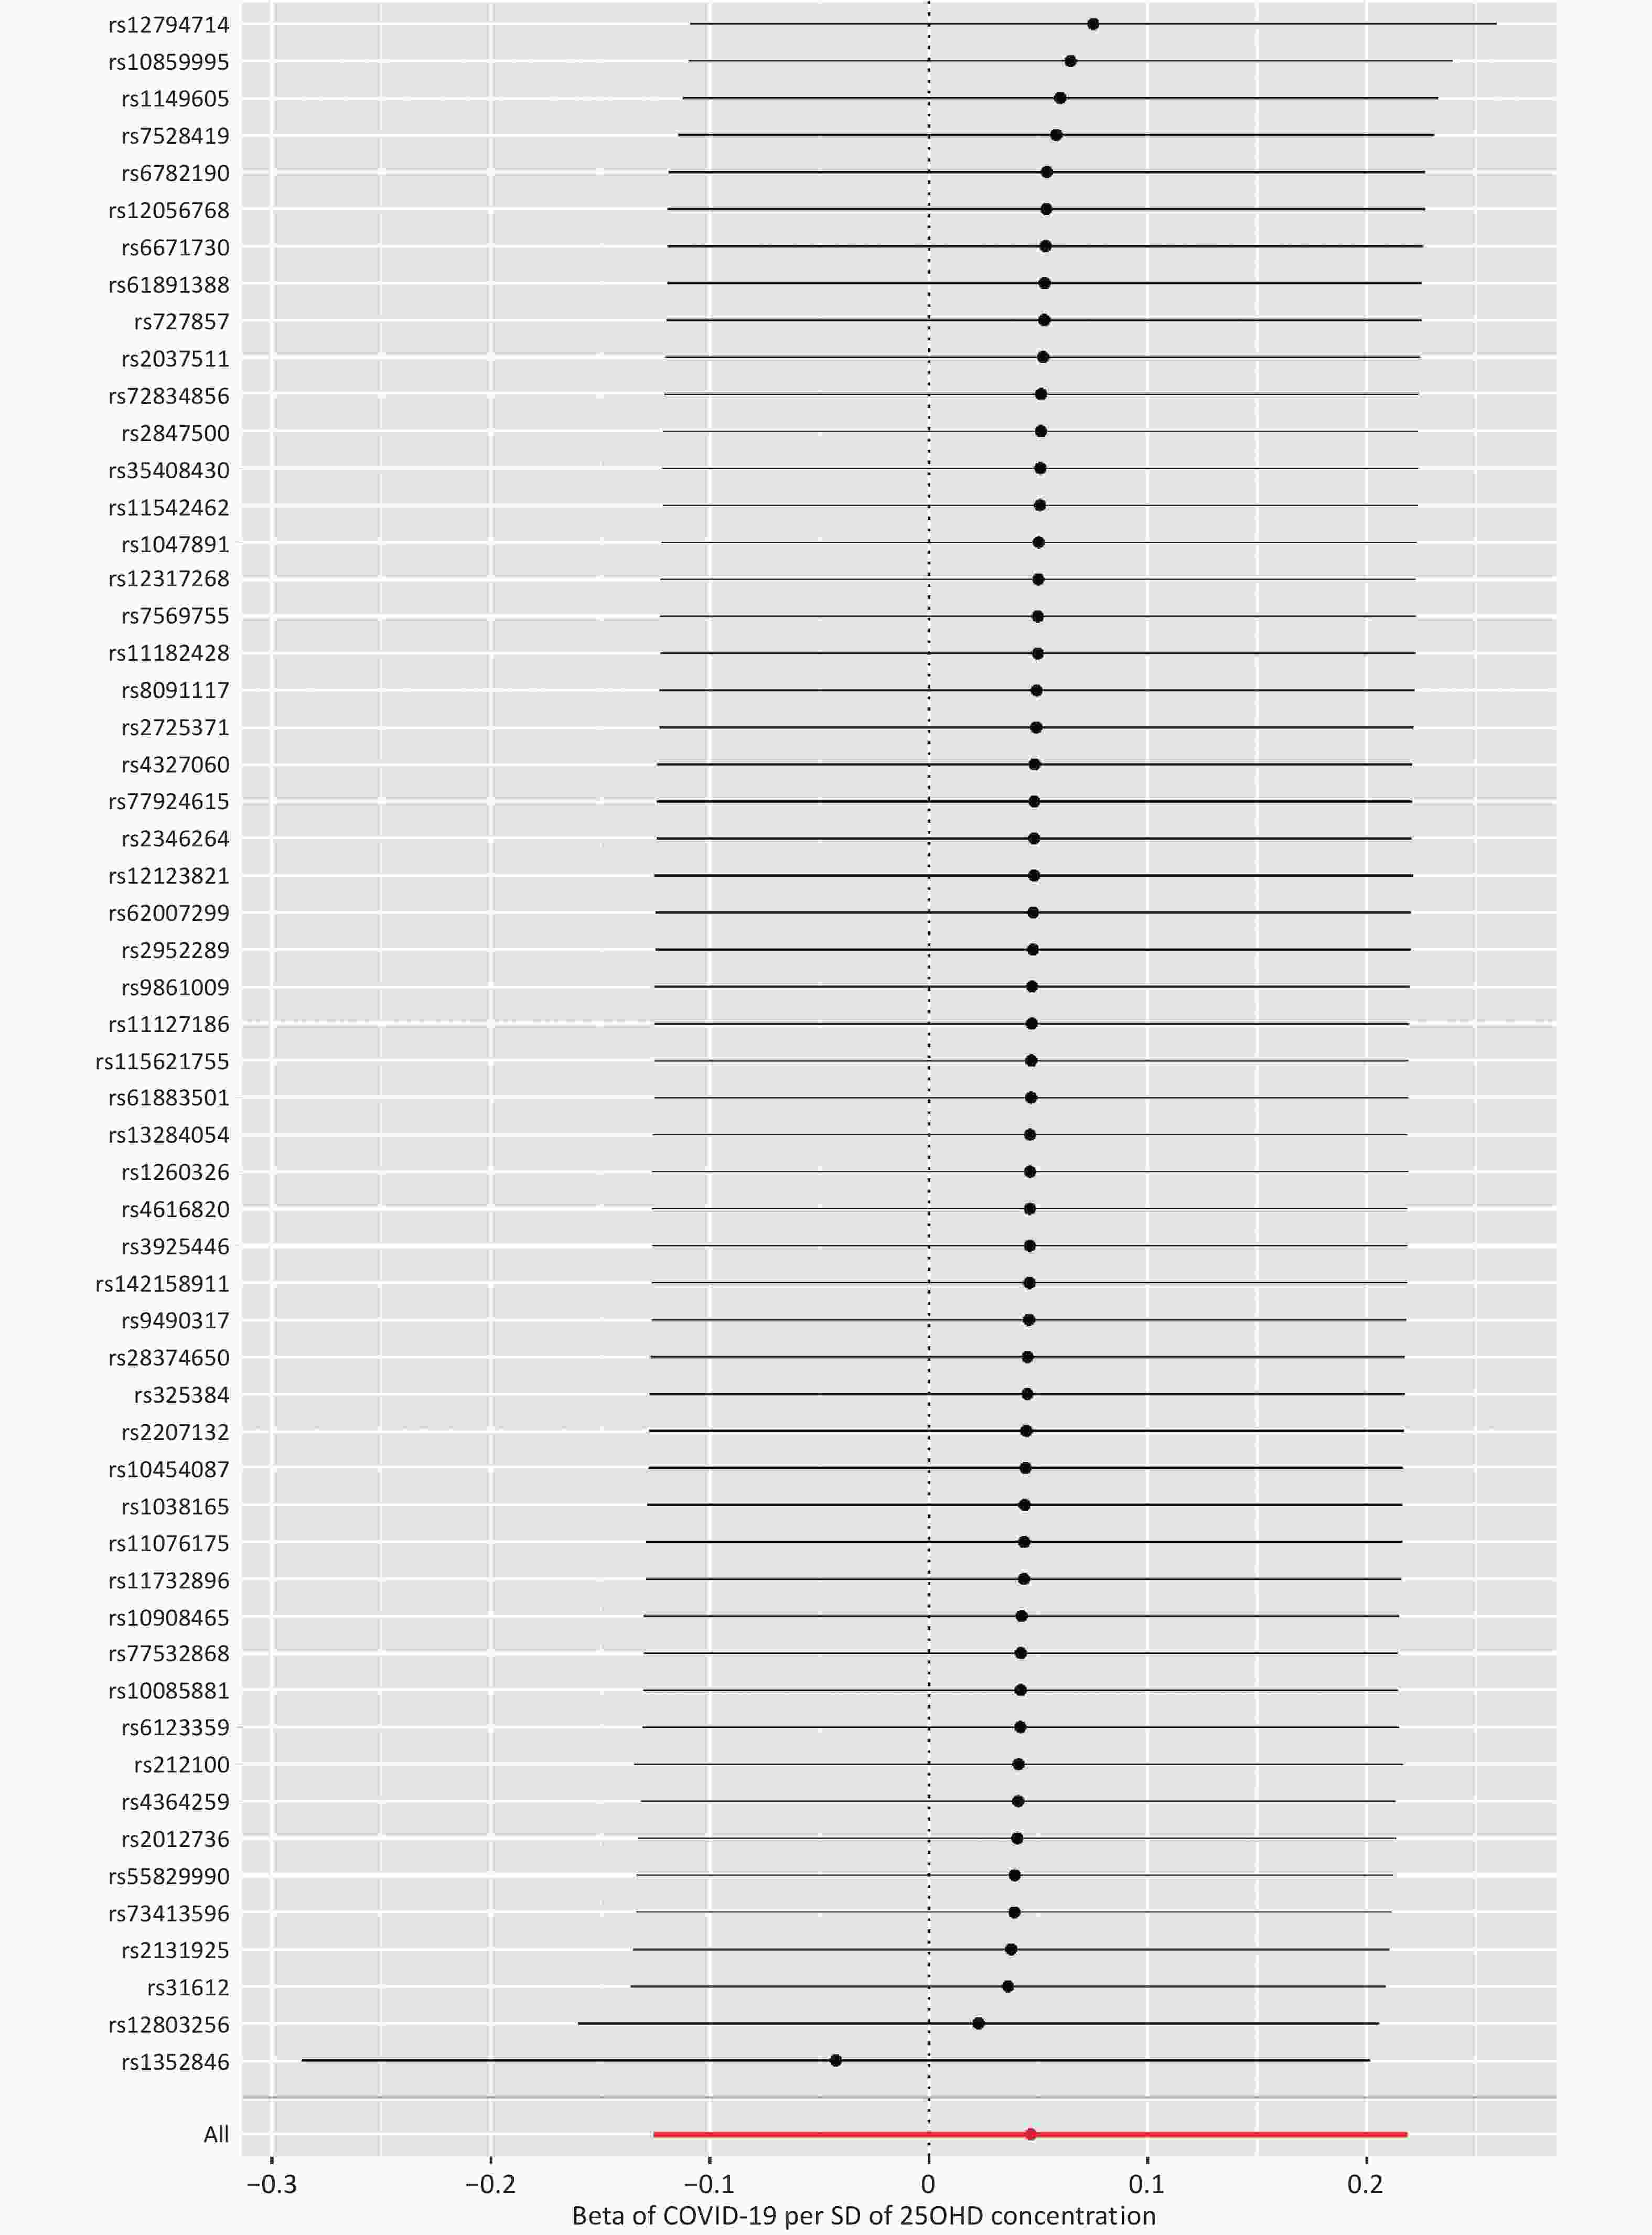
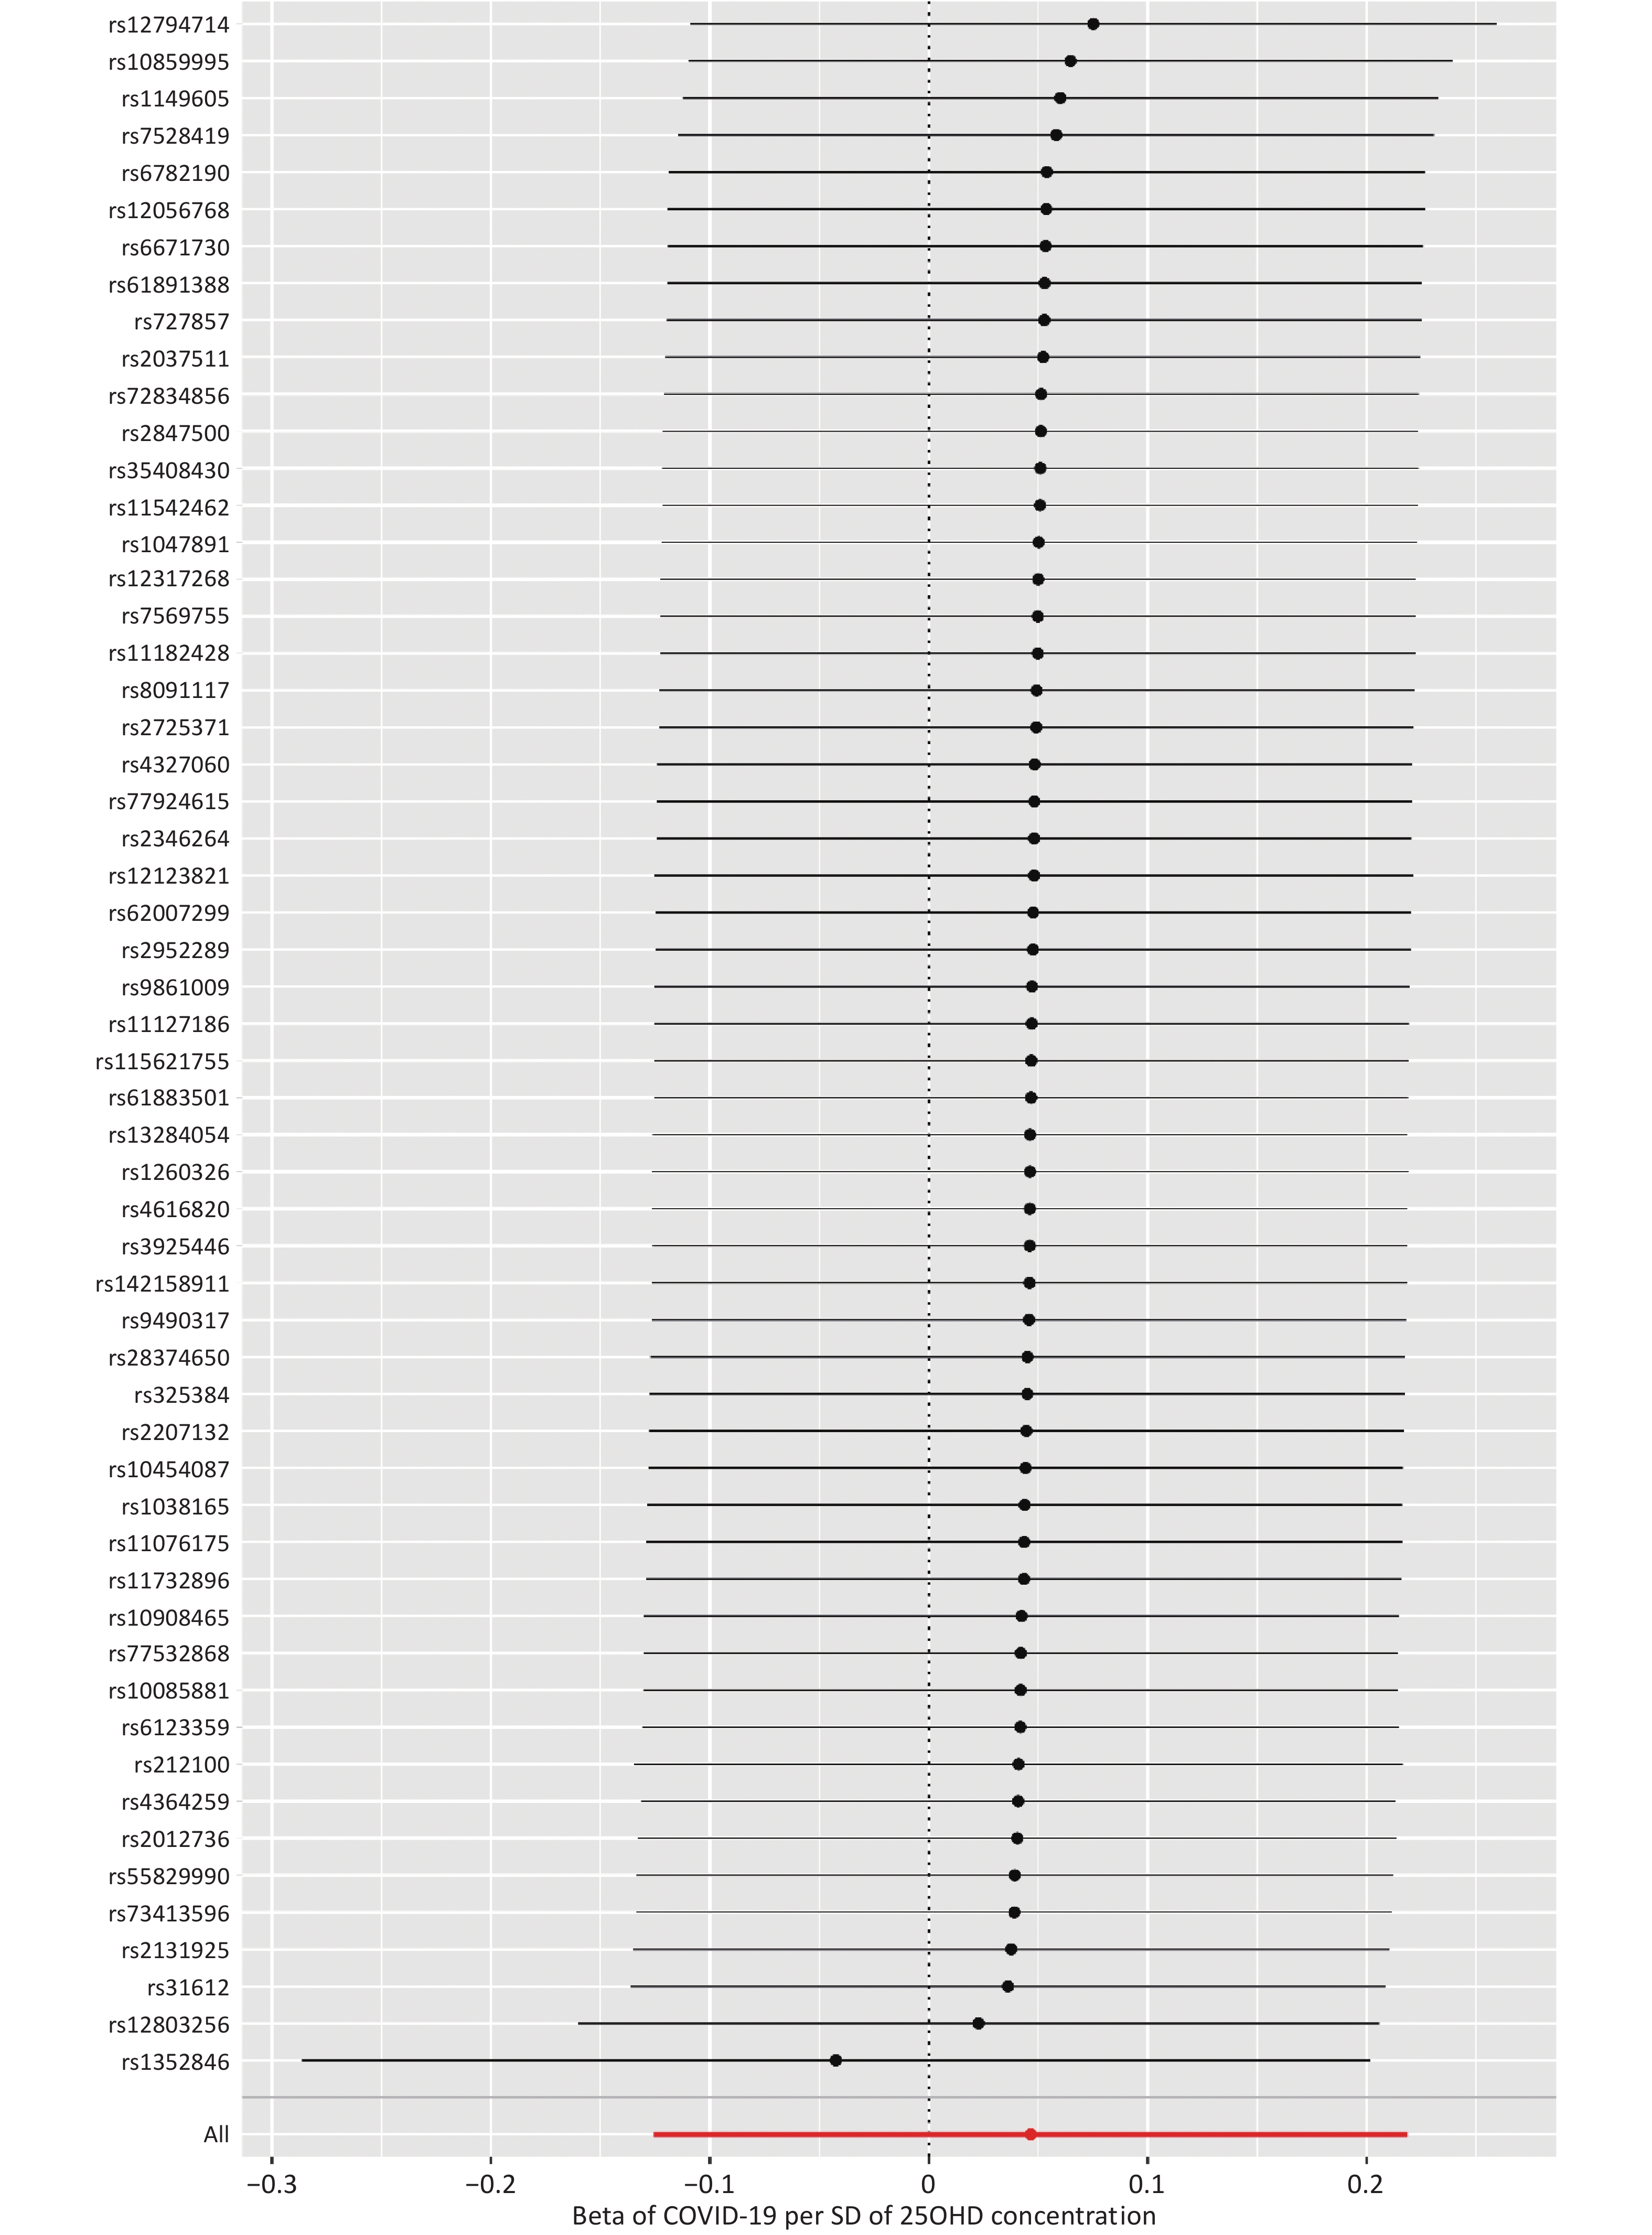
Figure S3. MR leave-one-out sensitivity analysis for ‘25OHD concentration’ on ‘COVID-19’ in the population of UKB-COVID-19 based on 56 SNPs. Leave-one-out analysis: each row represents a MR analysis of 25OHD concentration on COVID-19 using all instruments expect for the SNP listed on the y-axis. The point represents the beta with that SNP removed and the line represents 95% confidence interval. The summary data are reported by the COVID-19 host genetics initiative. COVID-19, coronavirus disease 2019; MR, mendelian randomization; SNP, single-nucleotide polymorphism; 25OHD, 25-hydroxyitamin D; SD, standard deviation; UKB, UK biobank
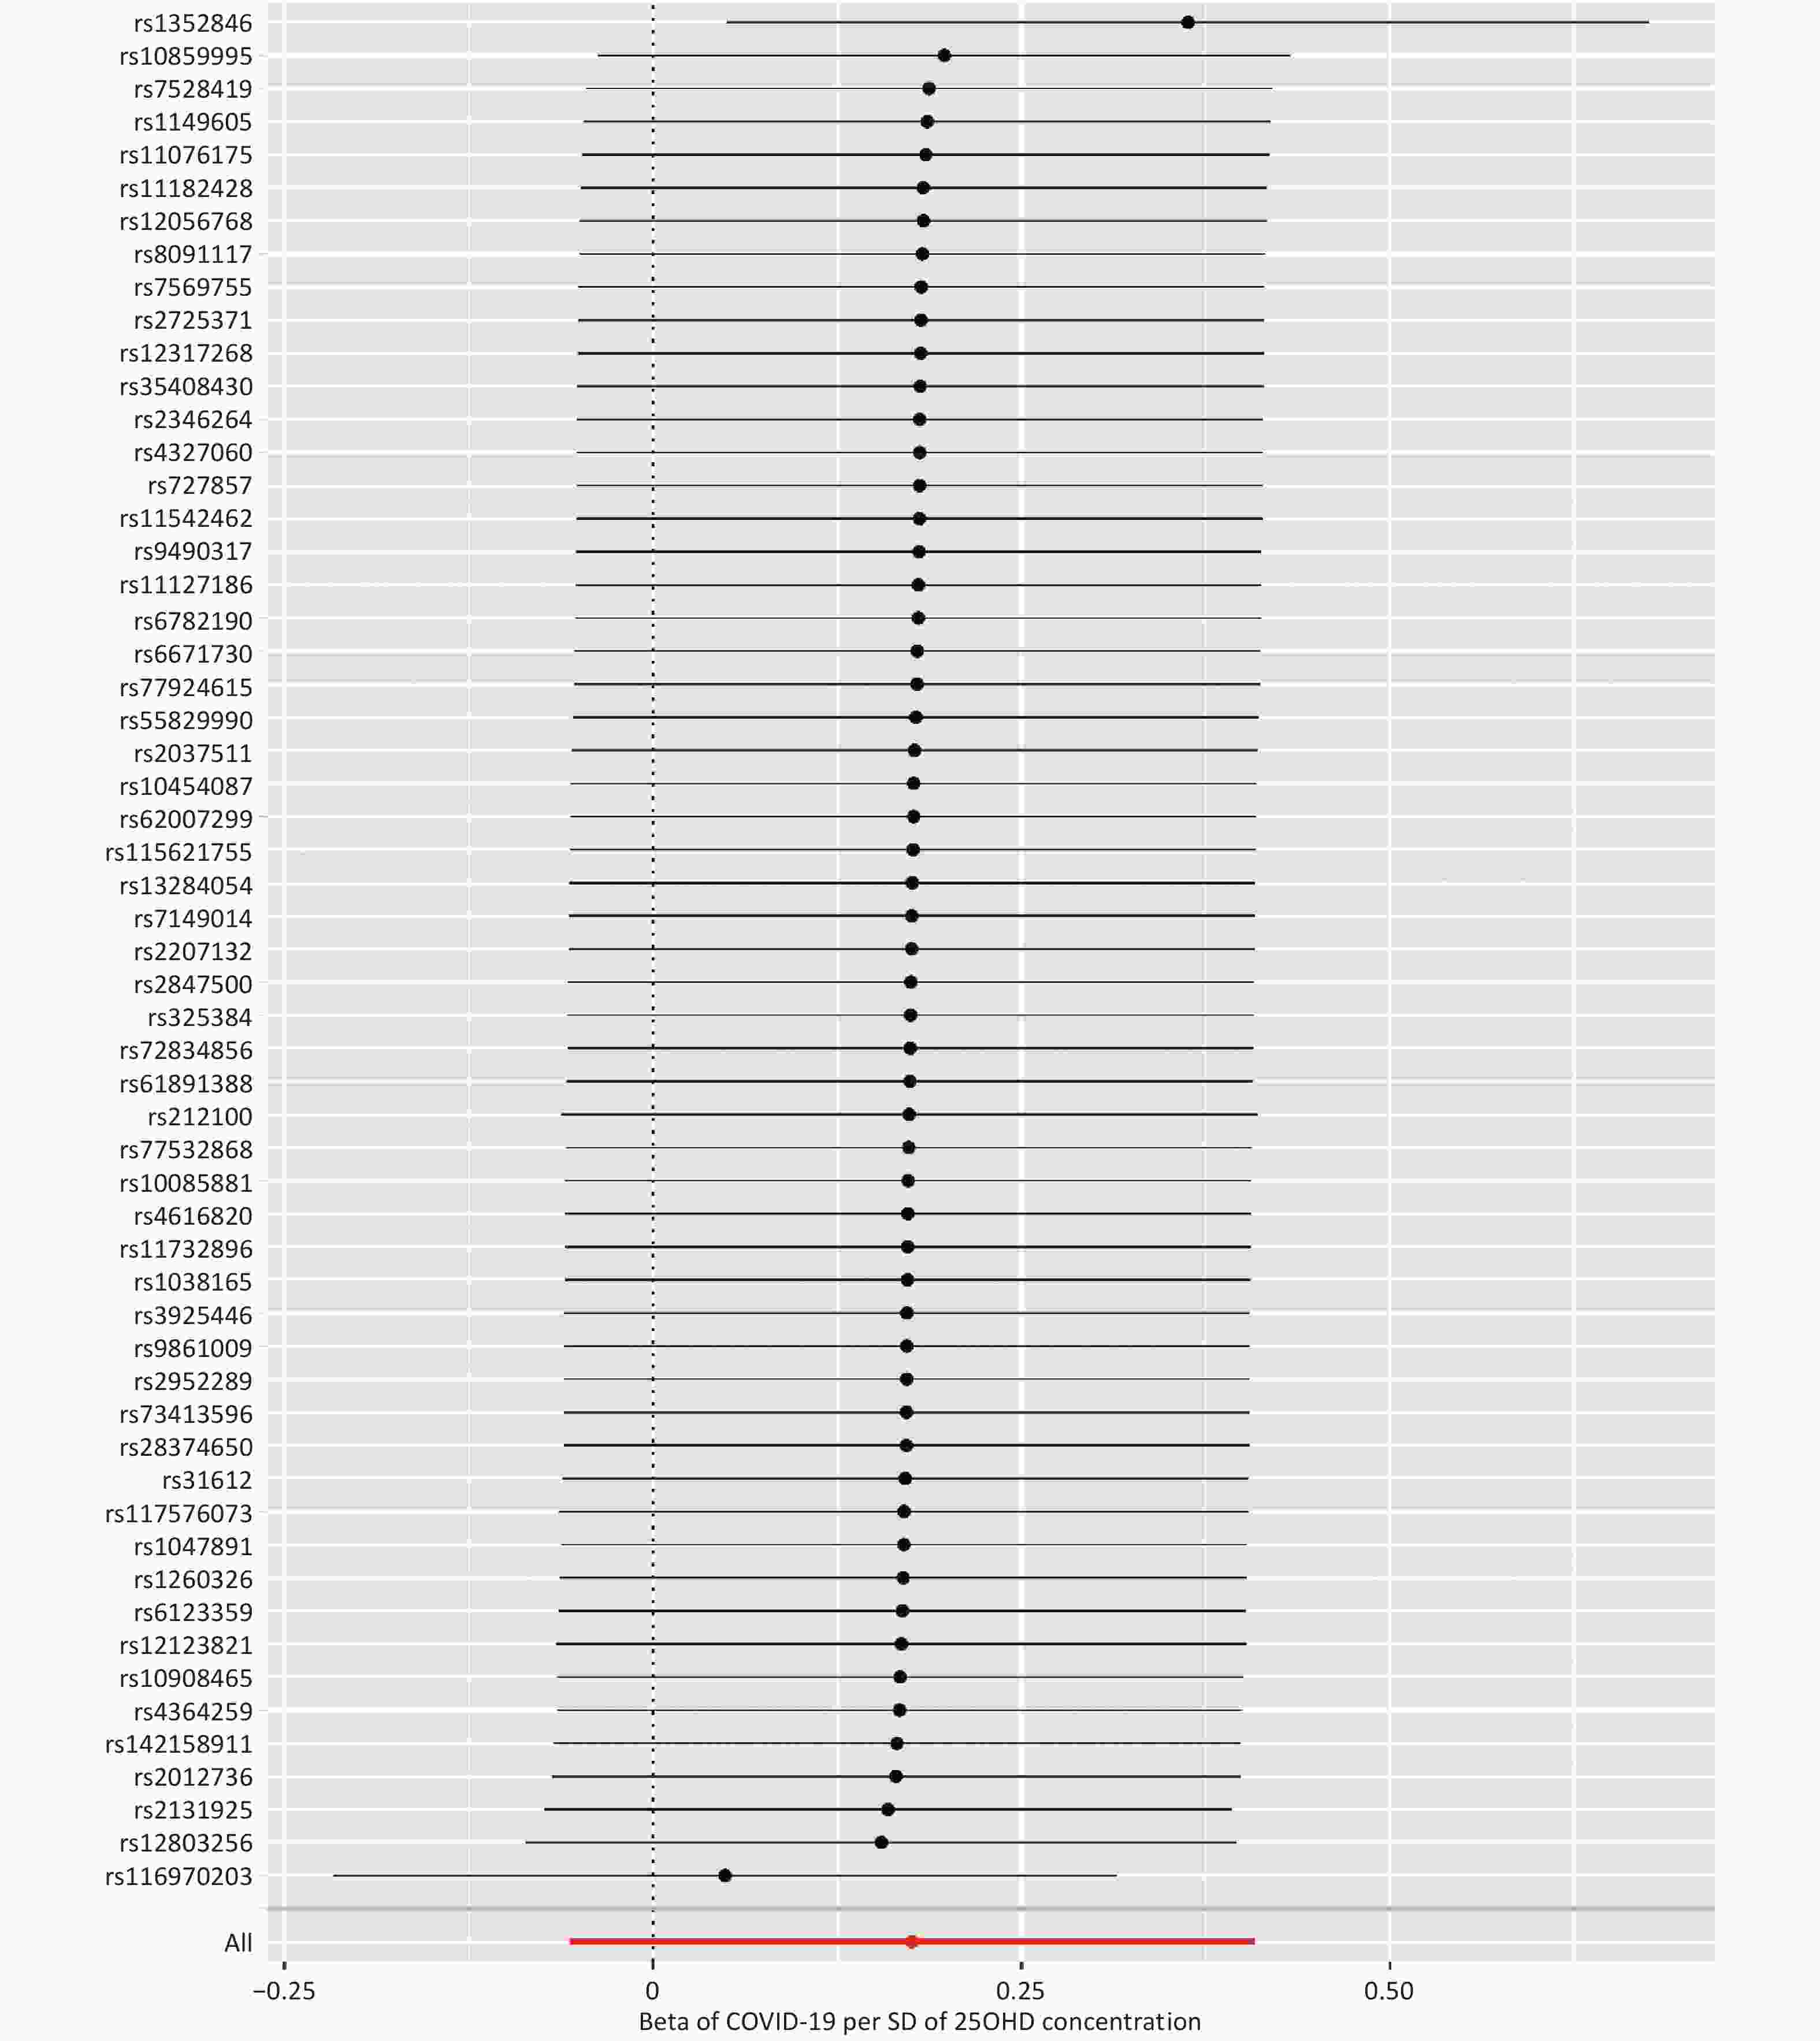
Figure S4. MR leave-one-out sensitivity analysis for ‘25OHD concentration’ on ‘COVID-19’ in the population of UKB-COVID-19 negative based on 57 SNPs. Leave-one-out analysis: each row represents a MR analysis of 25OHD concentration on COVID-19 using all instruments expect for the SNP listed on the y-axis. The point represents the beta with that SNP removed and the line represents 95% confidence interval. The summary data are reported by the COVID-19 host genetics initiative. COVID-19, coronavirus disease 2019; MR, mendelian randomization; SNP, single-nucleotide polymorphism; 25OHD, 25-hydroxyitamin D; SD, standard deviation; UKB, UK biobank
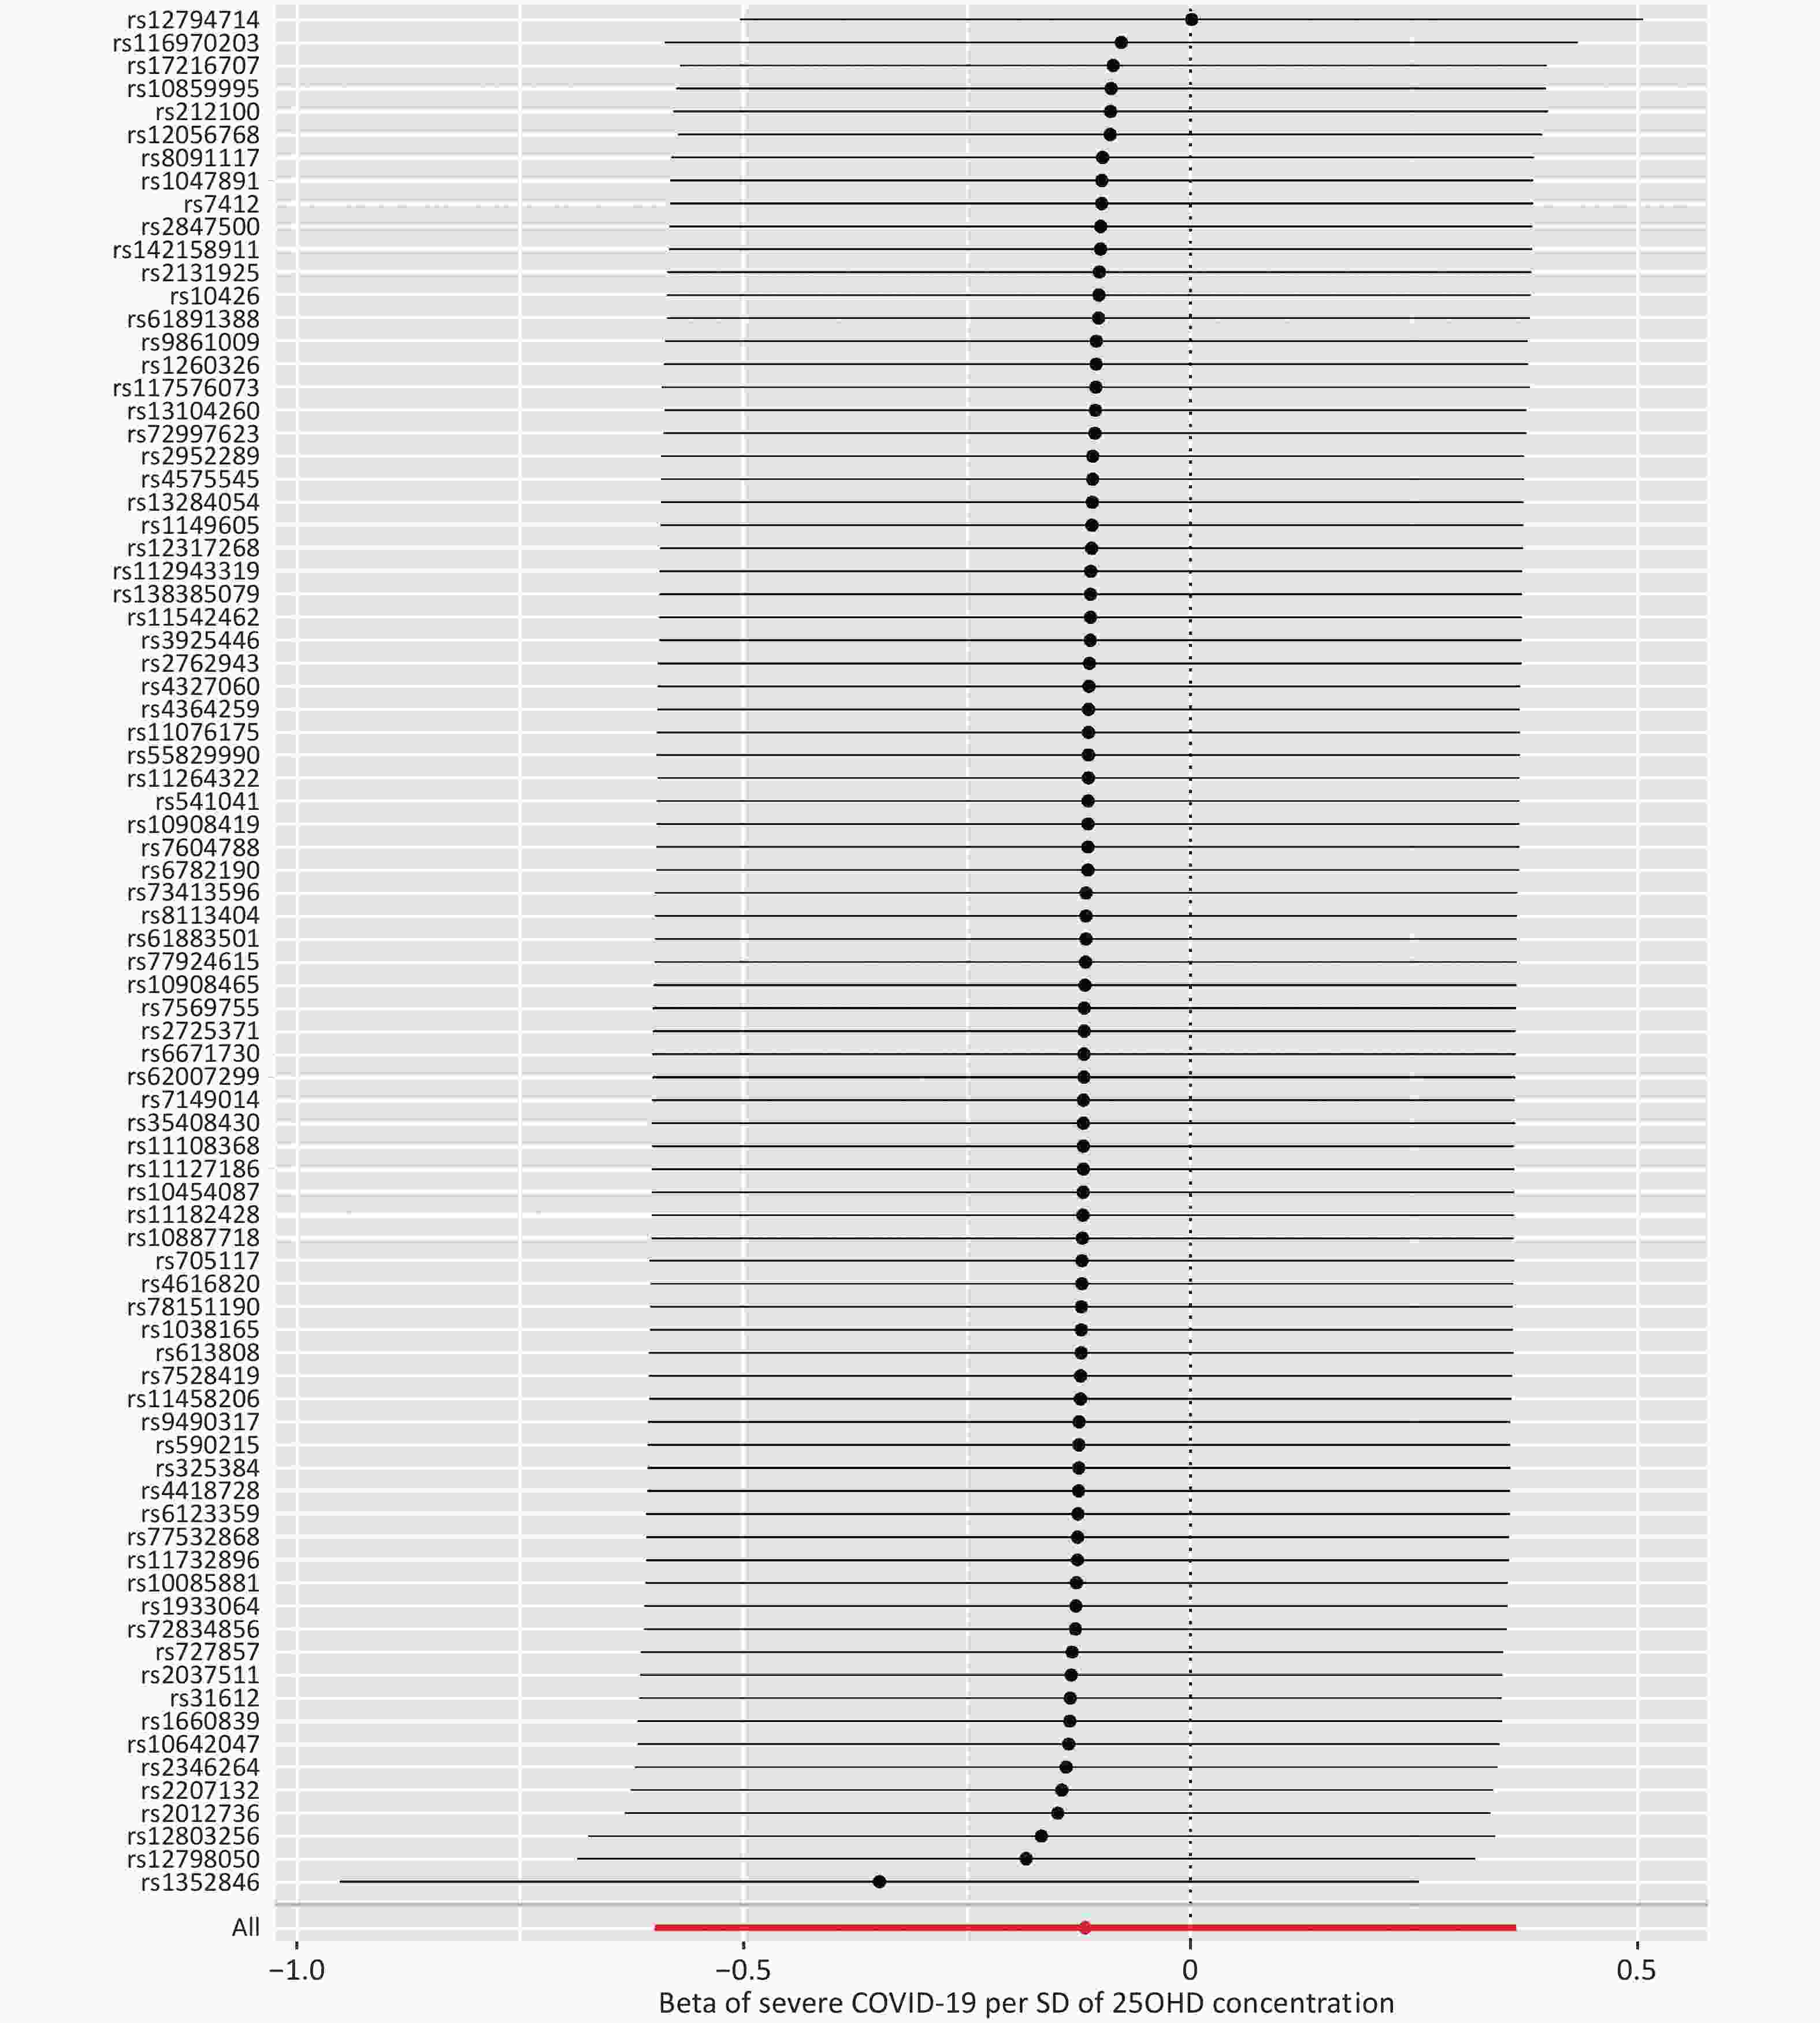
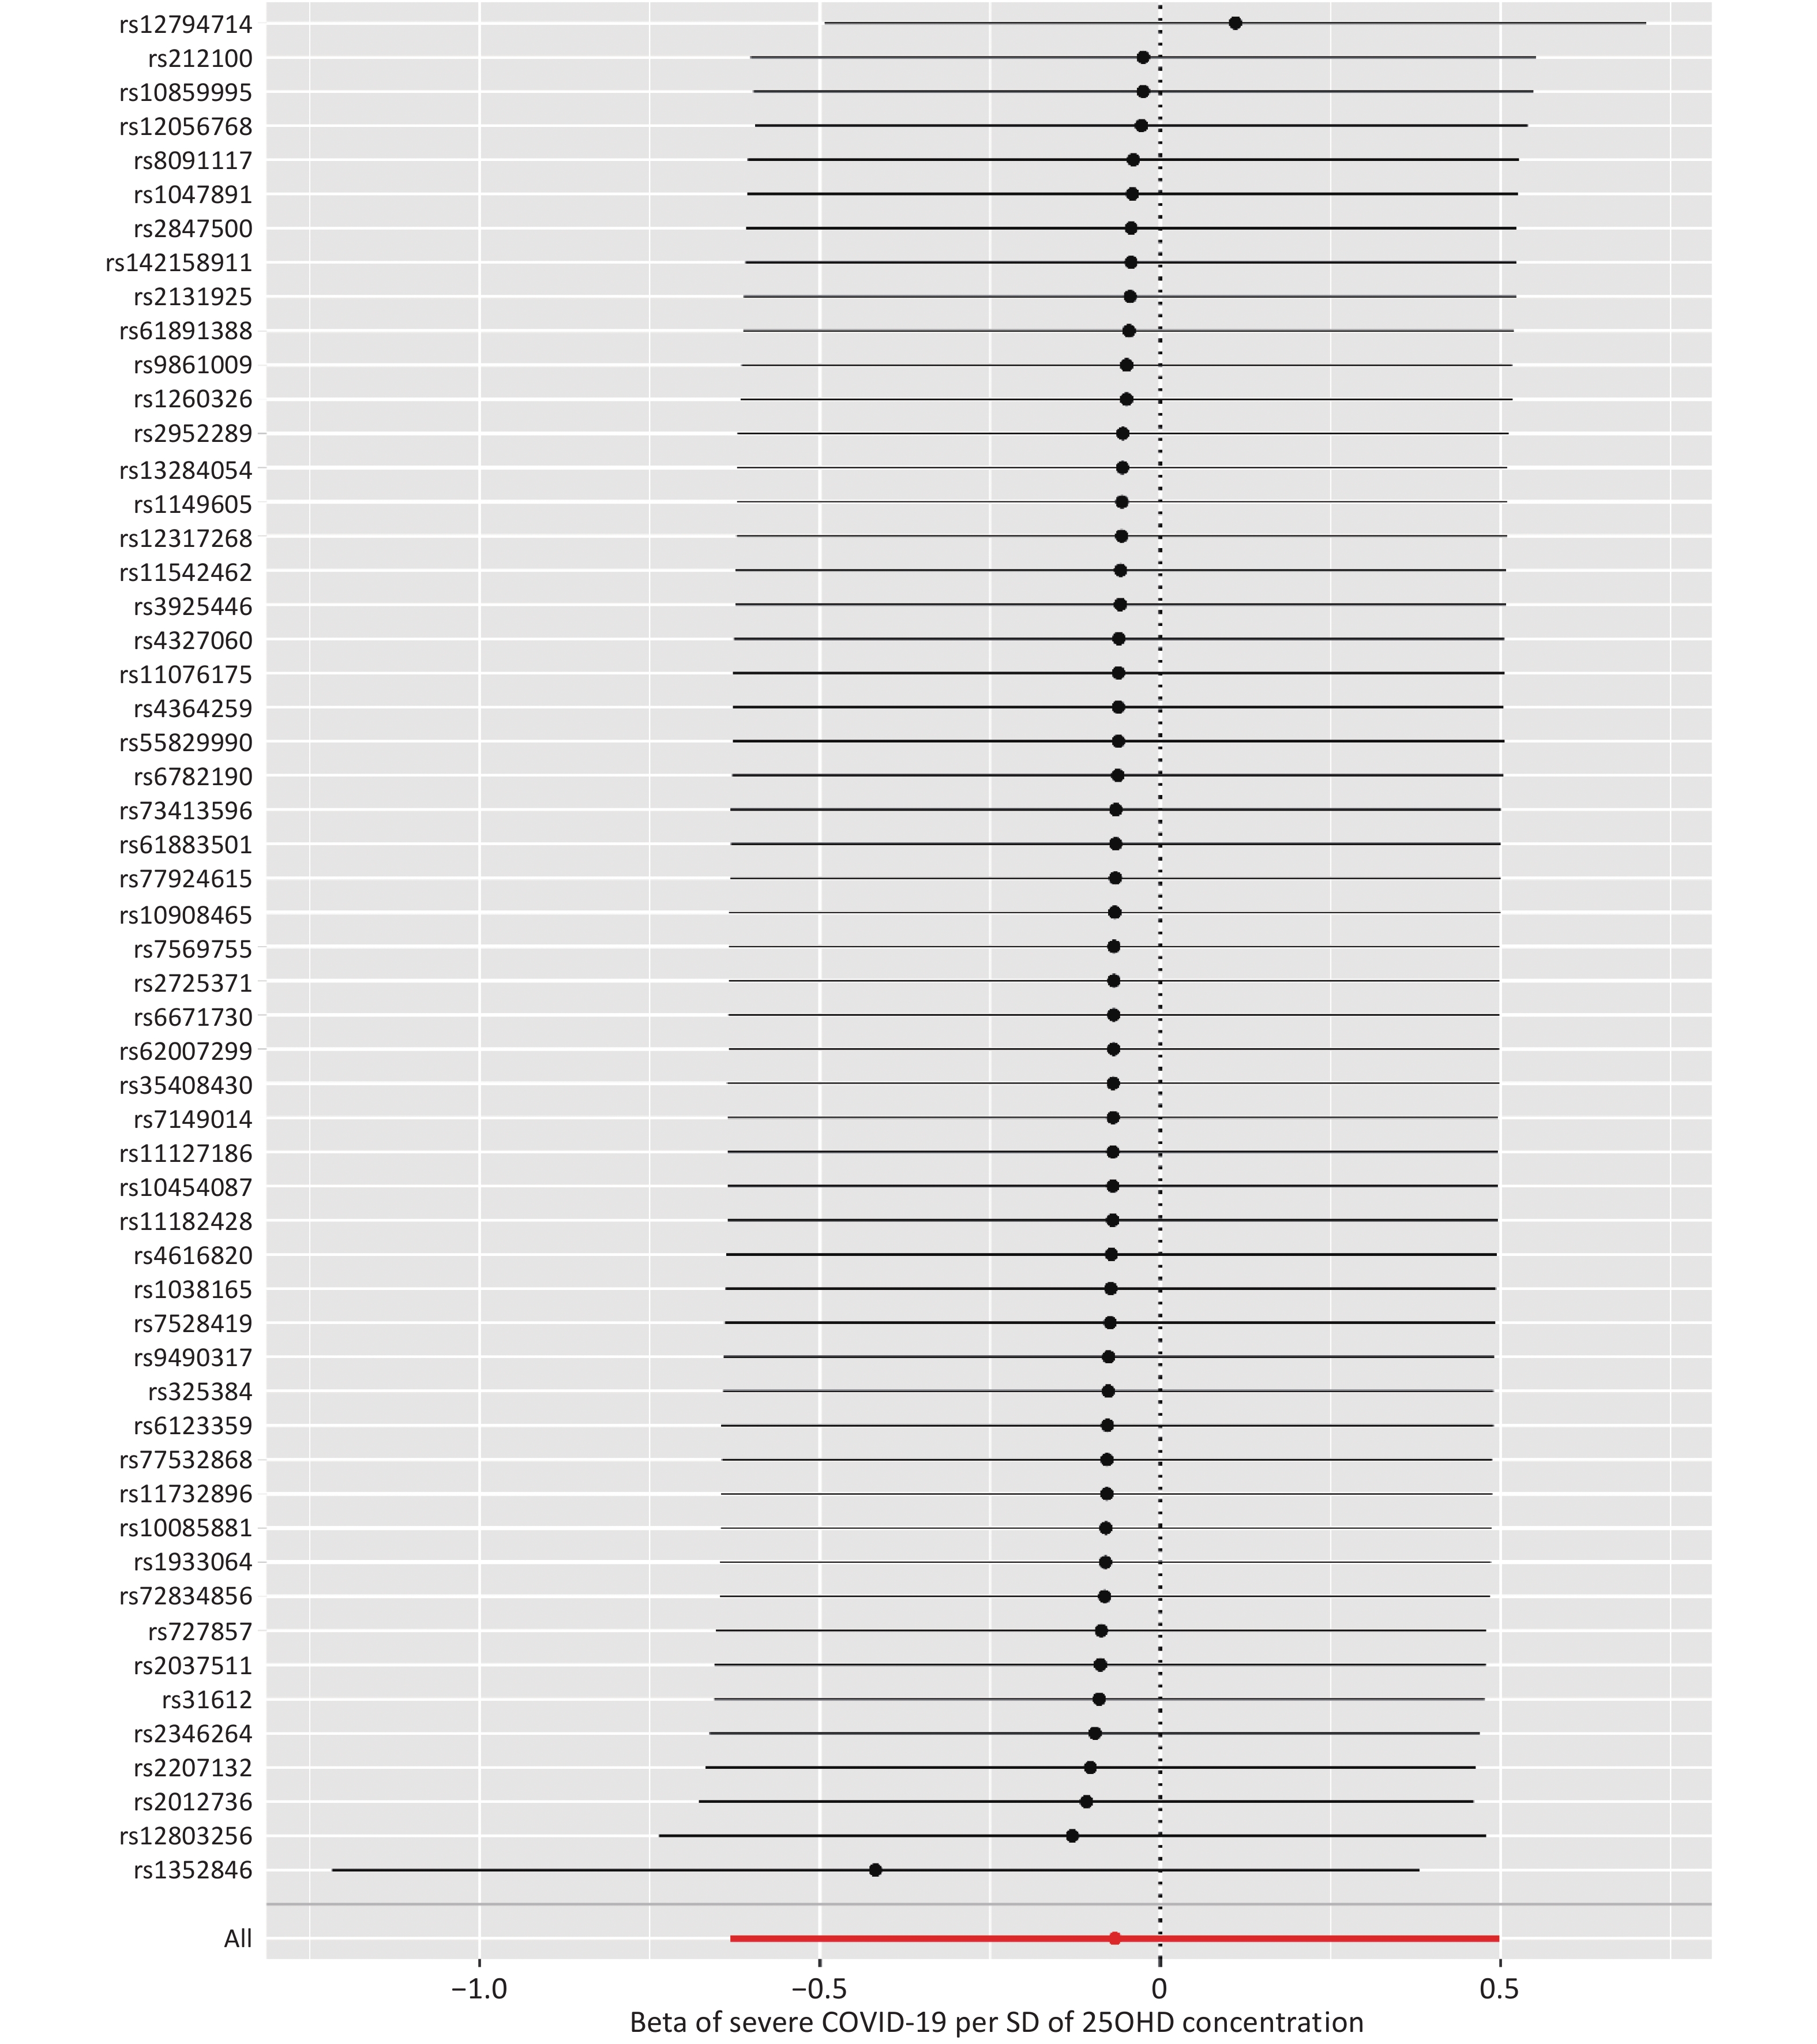
Figure S5. MR leave-one-out sensitivity analysis for ‘25OHD concentration’ on ‘severe COVID-19’ in the population of severe UKB-COVID-19 based on 82 SNPs. Leave-one-out analysis: each row represents a MR analysis of 25OHD concentration on severe COVID-19 using all instruments expect for the SNP listed on the y-axis. The point represents the beta with that SNP removed and the line represents 95% confidence interval. The summary data are reported by the COVID-19 host genetics initiative. COVID-19, coronavirus disease 2019; MR, mendelian randomization; SNP, single-nucleotide polymorphism; 25OHD, 25-hydroxyitamin D; SD, standard deviation; UKB, UK biobank
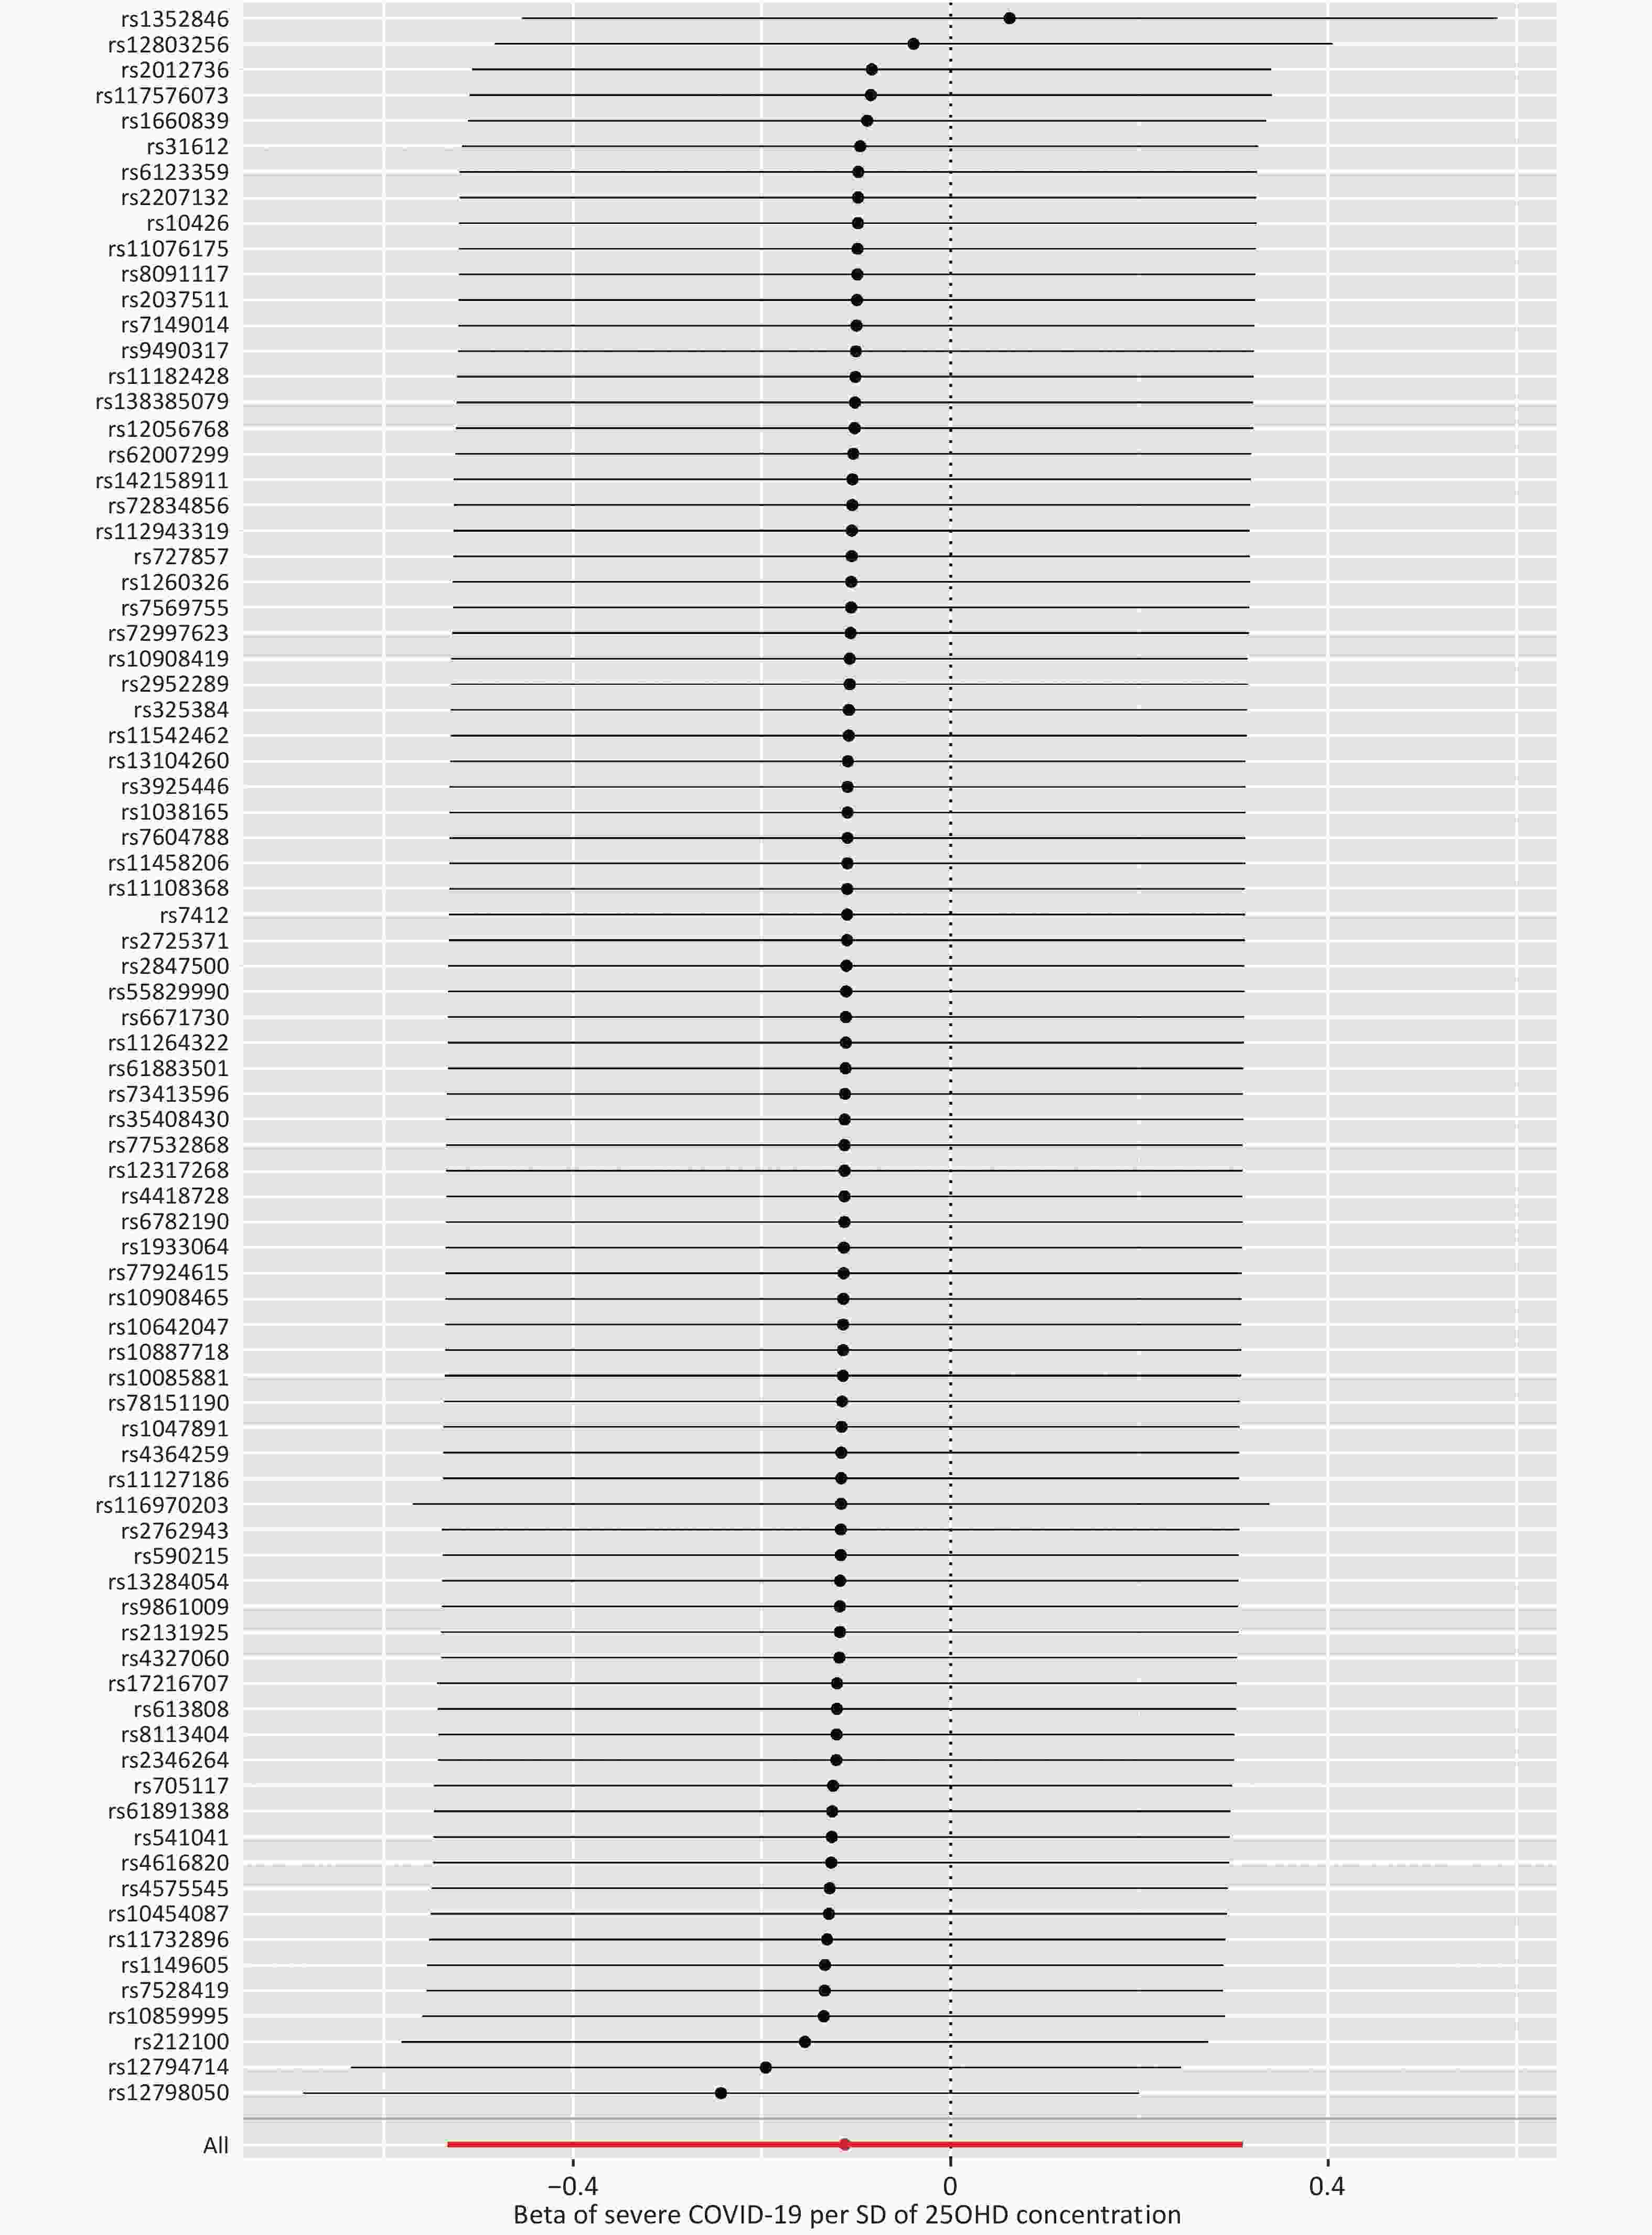
Figure S6. MR leave-one-out sensitivity analysis for ‘25OHD concentration’ on ‘severe COVID-19’ in the population of severe COVID-19 based on 82 SNPs. Leave-one-out analysis: each row represents a MR analysis of 25OHD concentration on severe COVID-19 using all instruments expect for the SNP listed on the y-axis. The point represents the beta with that SNP removed and the line represents 95% confidence interval. The summary data are reported by the severe COVID-19 GWAS Group. COVID-19, coronavirus disease 2019; MR, mendelian randomization; SNP, single-nucleotide polymorphism; 25OHD, 25-hydroxyitamin D; SD, standard deviation; GWAS, genome wide association study

Figure S7. MR leave-one-out sensitivity analysis for ‘25OHD concentration’ on ‘severe COVID-19’ in the population of severe UKB-COVID-19 based on 55 SNPs. Leave-one-out analysis: each row represents a MR analysis of 25OHD concentration on severe COVID-19 using all instruments expect for the SNP listed on the y-axis. The point represents the beta with that SNP removed and the line represents 95% confidence interval. The summary data are reported by the COVID-19 host genetics initiative. COVID-19, coronavirus disease 2019; MR, mendelian randomization; SNP, single-nucleotide polymorphism; 25OHD, 25-hydroxyitamin D; SD, standard deviation; UKB, UK biobank
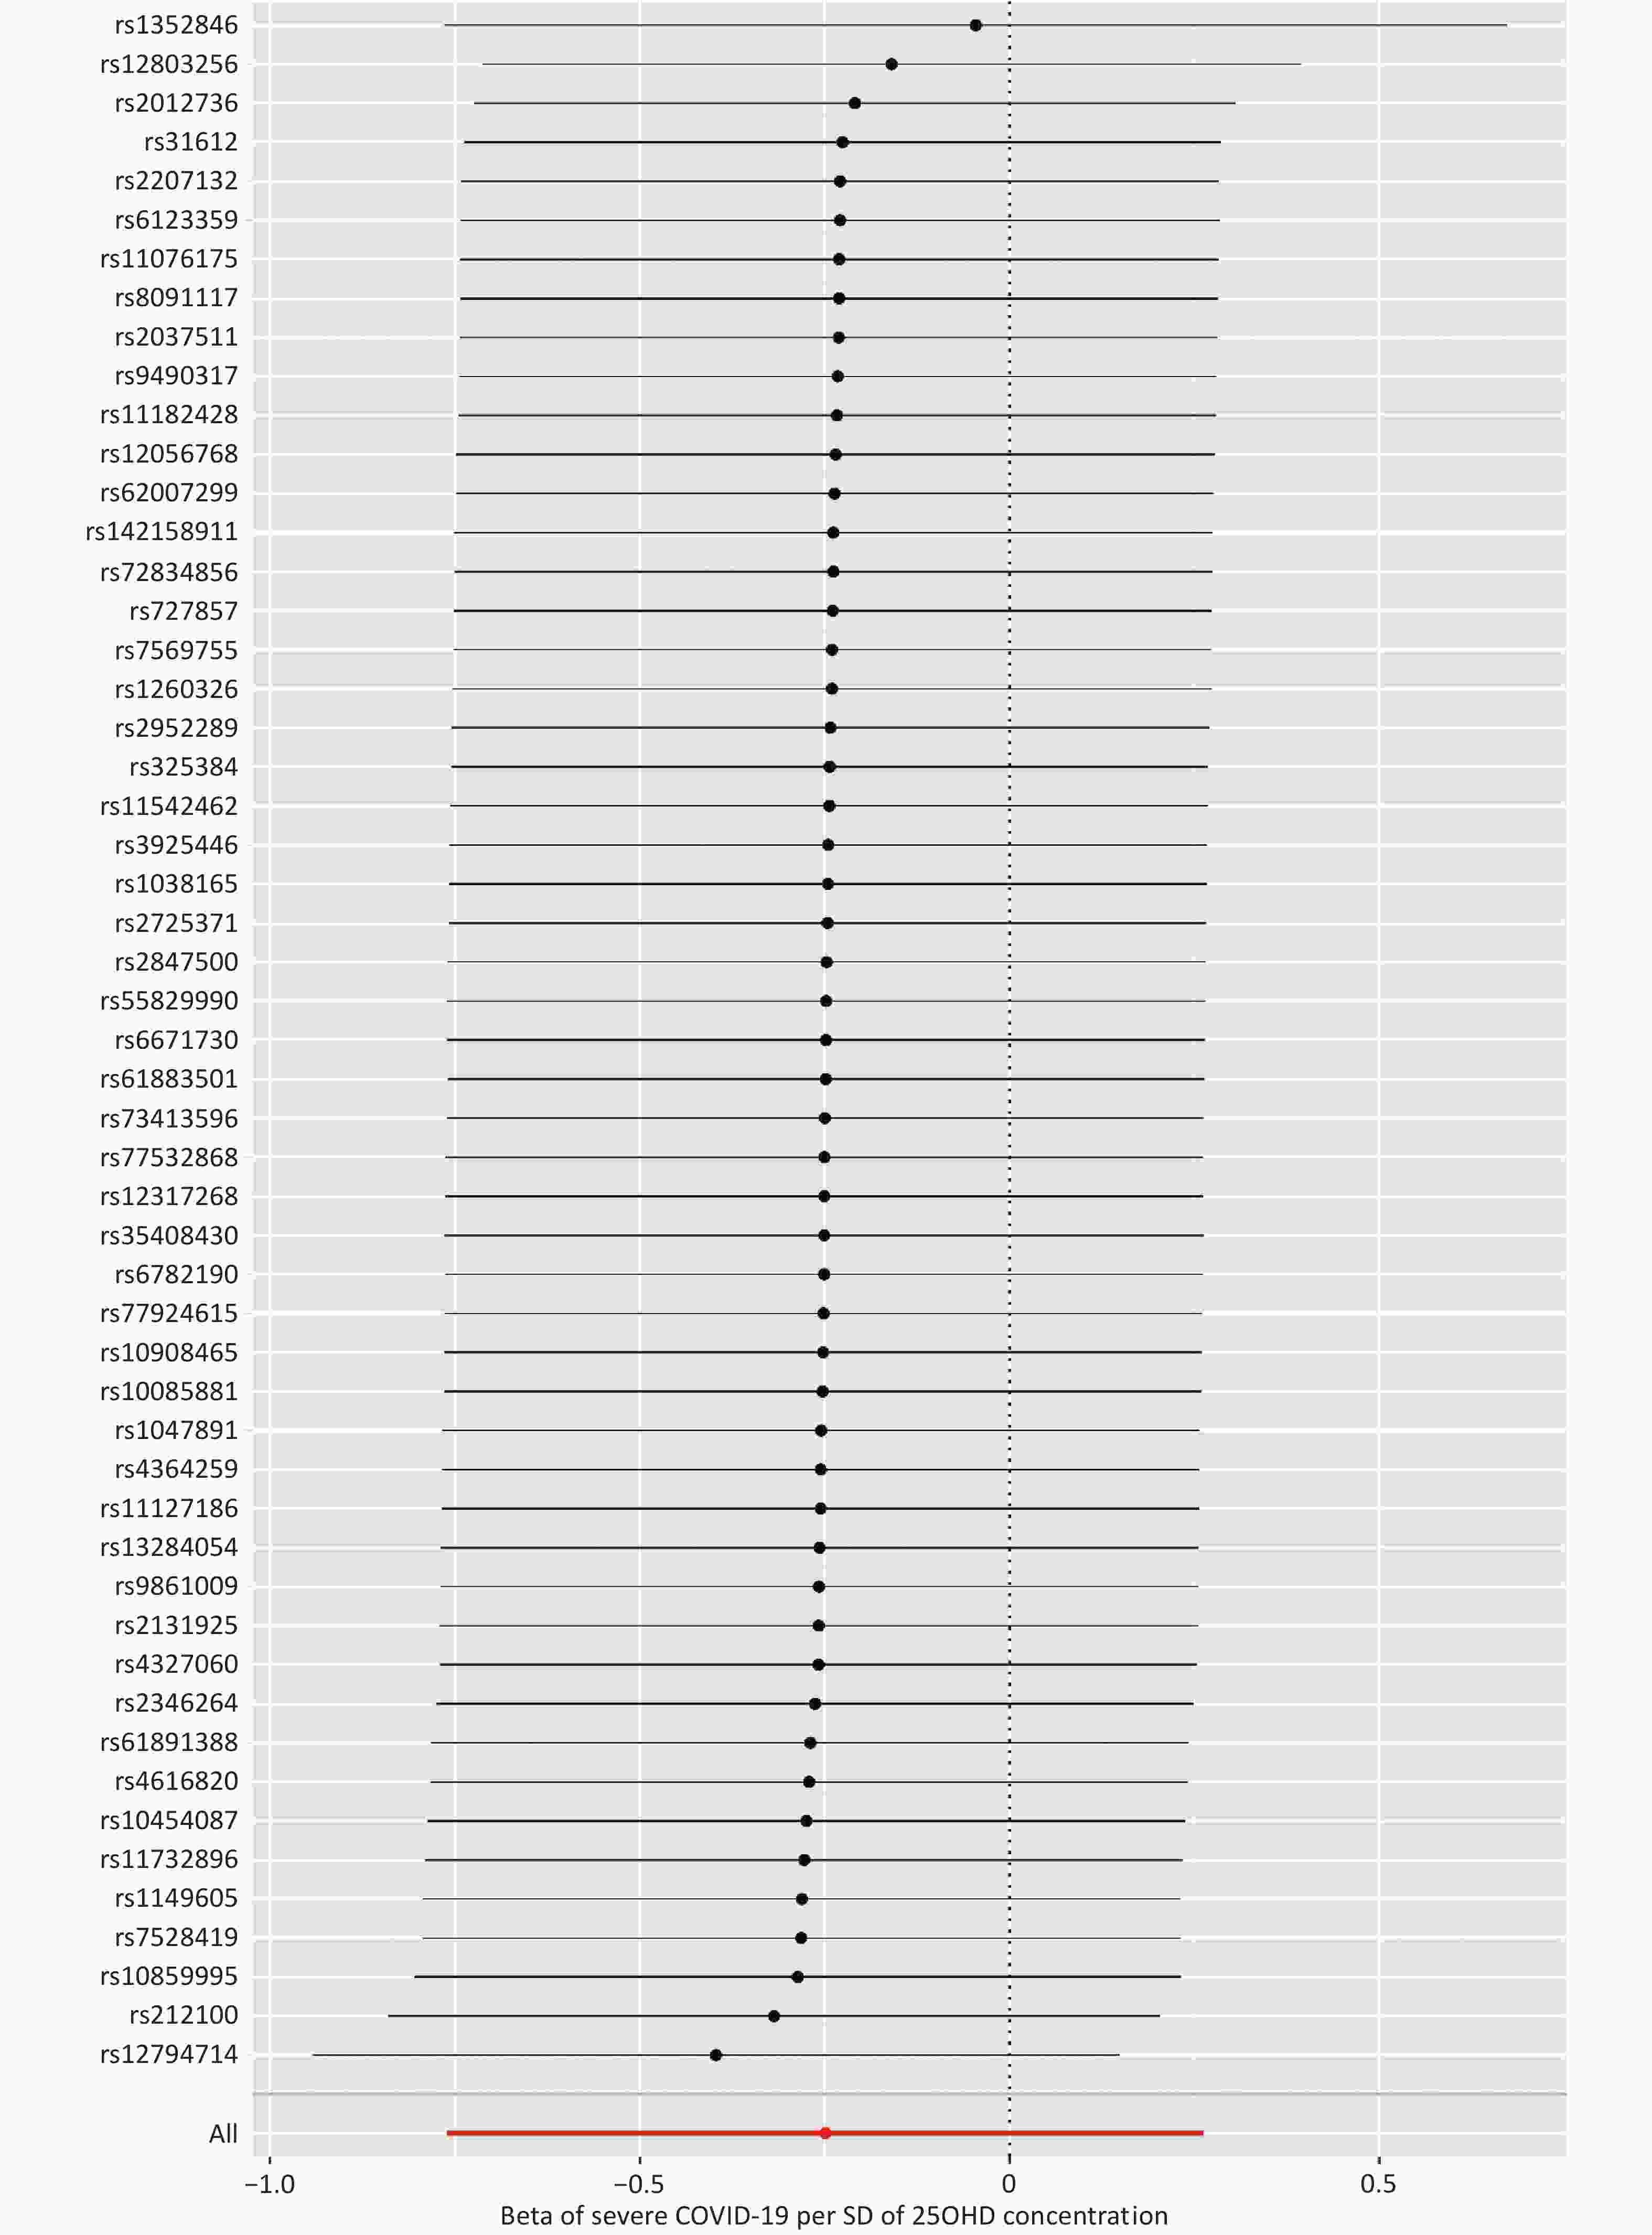
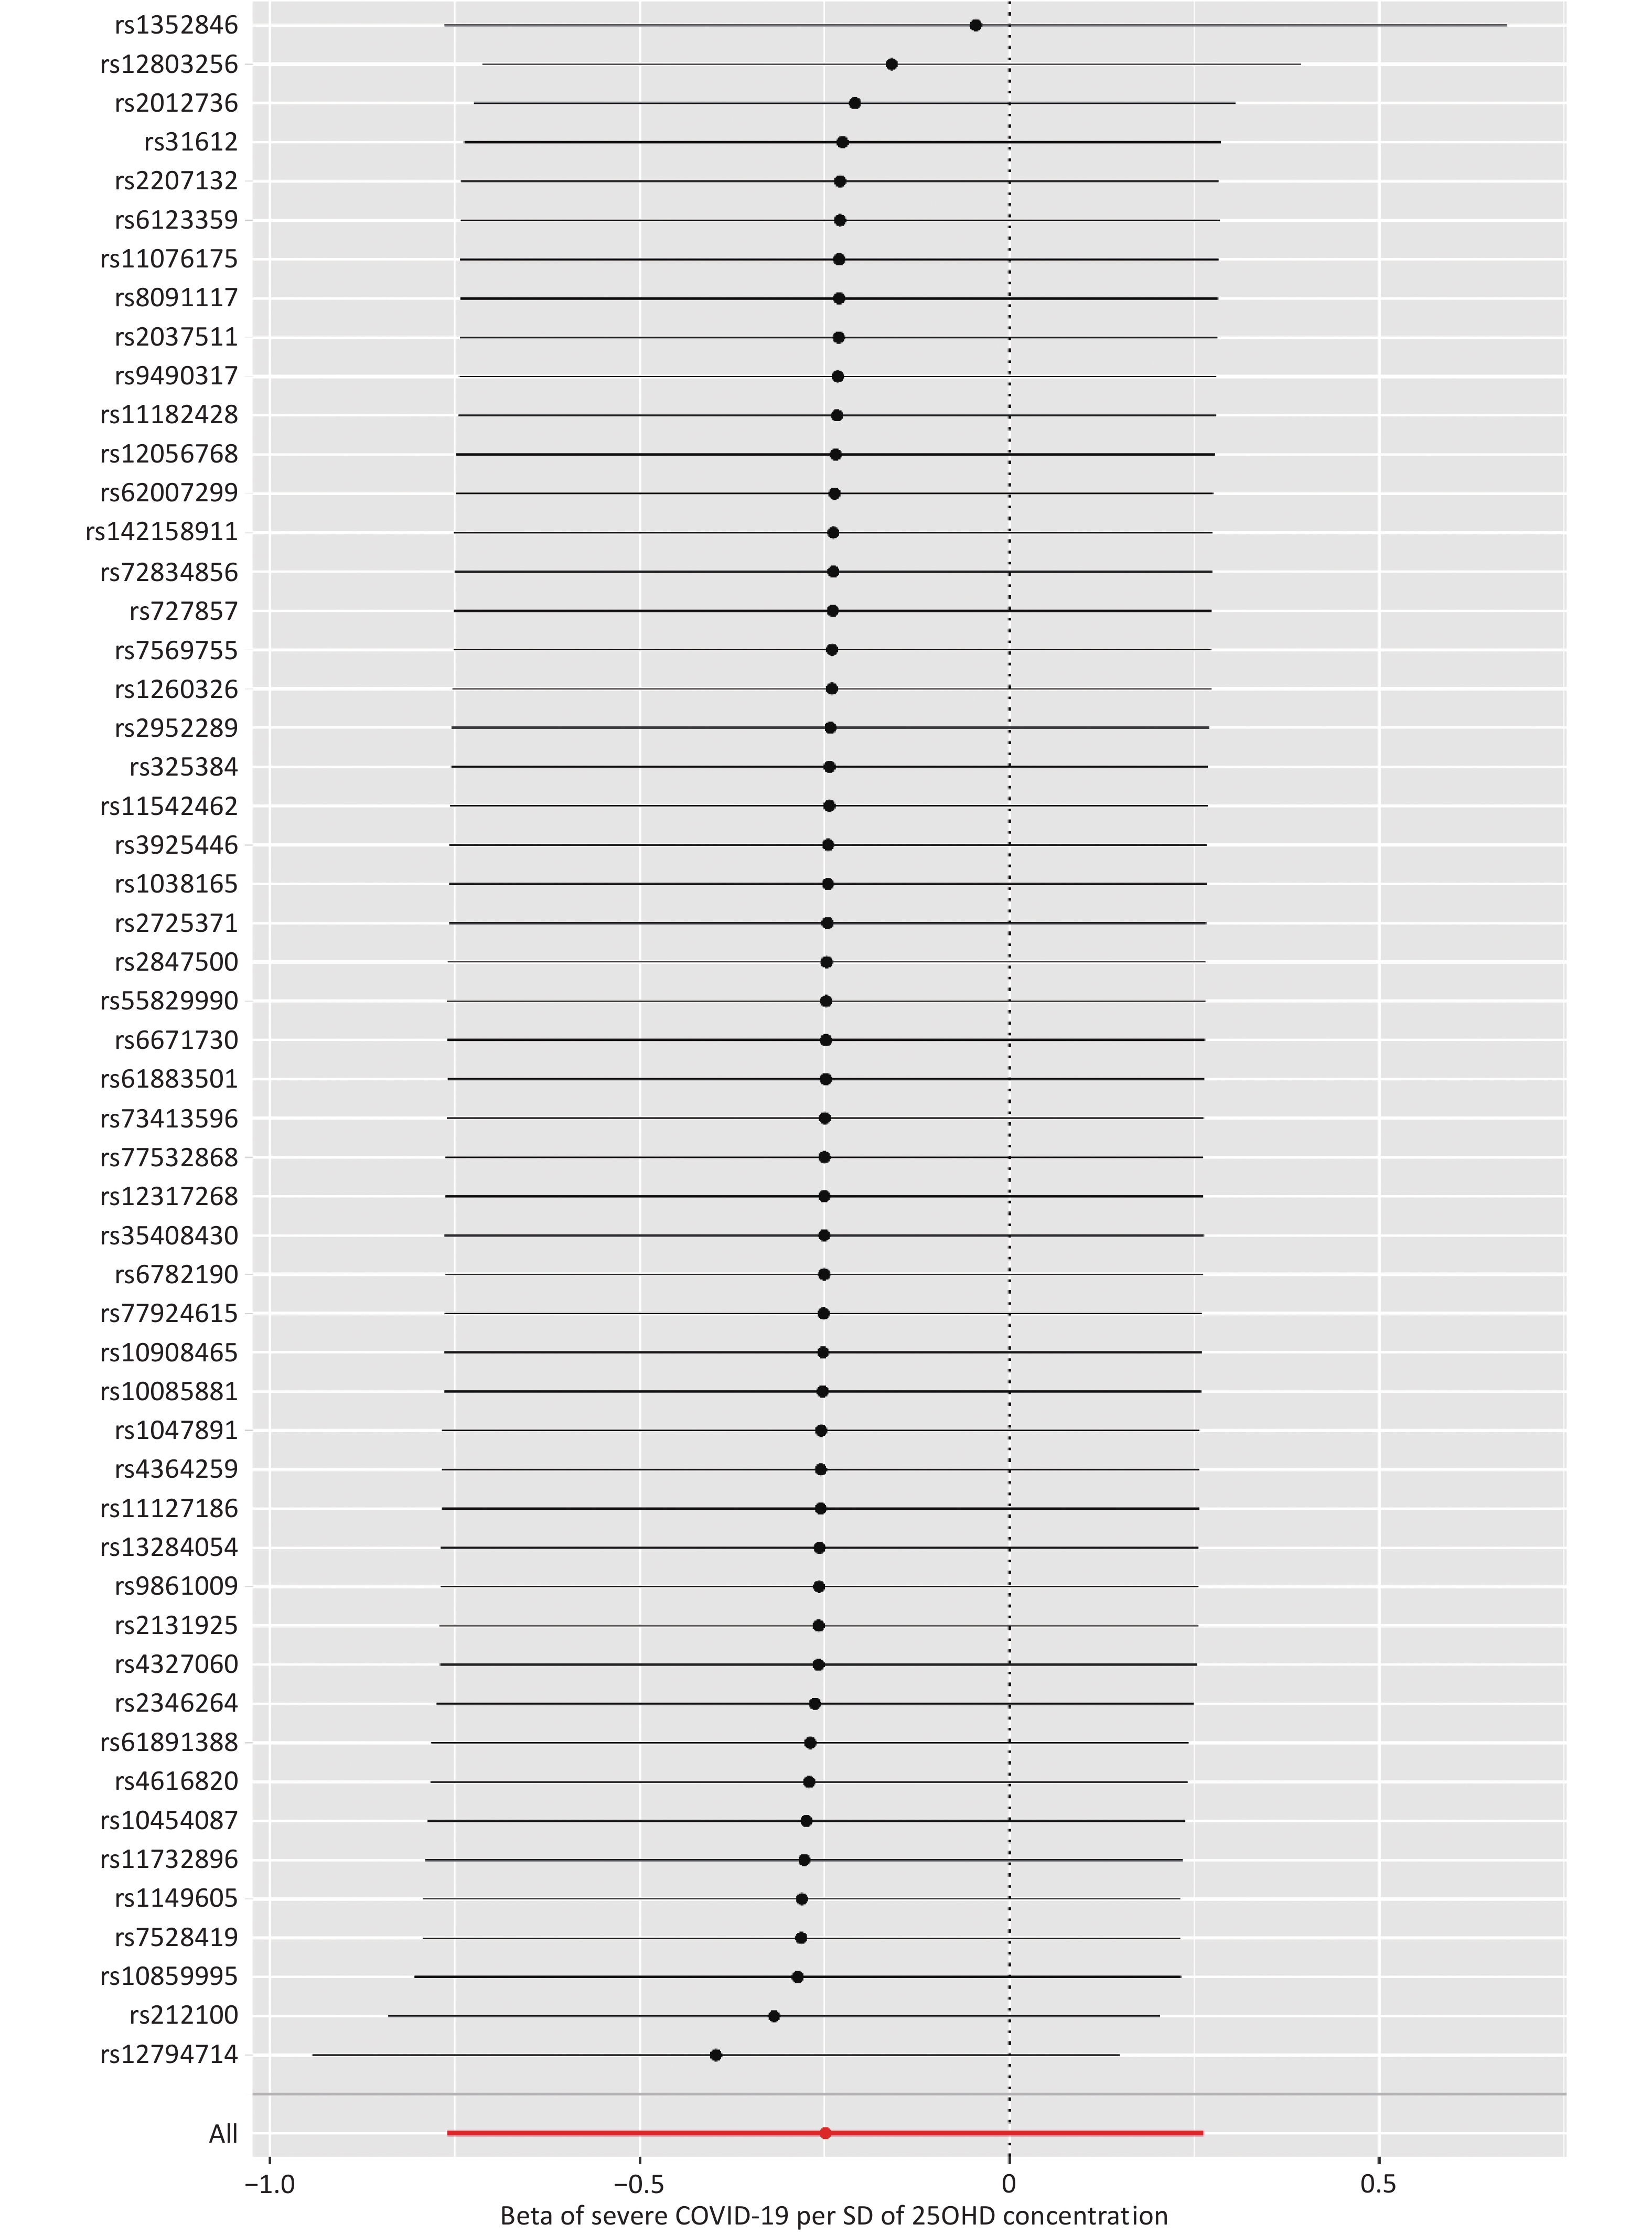
Figure S8. MR leave-one-out sensitivity analysis for ‘25OHD concentration’ on ‘severe COVID-19’ in the population of severe COVID-19 based on 53 SNPs. Leave-one-out analysis: each row represents a MR analysis of 25OHD concentration on severe COVID-19 using all instruments expect for the SNP listed on the y-axis. The point represents the beta with that SNP removed and the line represents 95% confidence interval. The summary data are reported by the severe COVID-19 GWAS Group. COVID-19, coronavirus disease 2019; MR, mendelian randomization; SNP, single-nucleotide polymorphism; 25OHD, 25-hydroxyitamin D; SD, standard deviation; GWAS, genome wide association study
全文HTML
 21052.pdf
|

|

 Quick Links