

 下载:
下载:


-
Iodine is an essential trace element required for synthesizing thyroid hormone, which plays an indispensable role in the development, growth, and metabolism throughout human life [1]. Urinary iodine excretion is a good marker of dietary intake of iodine over days and is an effective measure for assessing the iodine status in a population. The appropriate level of iodine nutrition for school-age children (SAC) is a median urinary iodine concentration (MUIC) in the range of 100–299 μg/L, and the Recommended Daily Allowance of iodine is 90 μg/d. The MUIC < 100 μg/L is defined as iodine deficiency. Iodine deficiency can affect humans at all life cycle stages and has a broad spectrum of adverse effects, including cretinism and goiter [2]. At the same time, iodine excess can cause damage to the body. Before 1990, only a few countries, e.g., Switzerland, Australia, the USA, and Canada, were completely iodine sufficient [1]. Given this phenomenon, WHO proposed the national salt iodization strategy, and so far, 88% of the global population uses iodized salt [3]. China used to be one of the countries where iodine deficiency disorders (IDD) were widely prevalent. Since 1995, China has implemented the Universal Salt Iodization (USI) policy, which has effectively controlled the serious epidemic trend of IDD. The 2019 National Iodine Deficiency Disorders Surveillance Report [4] showed that China was currently in an overall state of eliminating IDD according to the Iodine Deficiency Disorders Elimination Standard. Although the general urine iodine concentration (UIC) in children was appropriate, UICs of children in some counties were iodine deficient, while UICs exceeded the standard in others. Therefore, it is necessary to monitor iodine nutrition levels in children comprehensively and analyze the causes of such differences.
The diet is the primary way to achieve adequate iodine nutrition. Kelp, laver, fish, and dairy products are the most common iodine-rich foods [5]. Iodine intake varies by region. For example, in Japan, 1–3 mg/d of iodine is consumed from seaweed [6]. In the USA, dairy is a particularly good source of iodine intake for children aged 6–12 years [7]. This is probably due to the abundance of dairy products in the diet of children in this age range. Although the original USI policy required using iodized salt for processing food, current programs in many countries were limited to ensuring that only household salt is iodized.
However, in most parts of the world, diets are shifting toward industrial food (i.e., processed food) consumption. Food fortification has been widely used worldwide. For example, Australia introduced iodized bread in 2009 [8], and New Zealand introduced iron-fortified milk powder [9]. Similarly, the micronutrient status in Vietnam of preschool children has been improved due to the regular consumption of processed foods, including cookies fortified with vitamin A, iron, zinc, and iodine [10]. In developing countries, consumption of processed food and food prepared outside the home is rising. If salt were iodized in processed food, more iodine would be ingested. Therefore, increasing salt consumption through processed foods is another important potential source of dietary iodine. So, the Iodine Global Network recommended that the iodine content in processed foods should be tested [11]. Knowledge about all sources of dietary iodine, including foods, beverages, water, salt, and supplements, is essential for understanding patterns of iodine intake and planning interventions.
The eating habits of the population in the world have undergone great changes in the past few decades. More and more people choose to dine out [12-13]. A recent study in the United States showed that more than 50% of adults in the United States reported eating out three or more times a week, and more than 35% reported eating out at least twice a week [14]. In China, the proportion of residents dining out was 49.76% [15]. The dining location, which includes a range of potential places where eating behavior can occur (e.g., home, school, and community), is an essential determinant of children’s dietary behavior and may further influence children’s iodine intake. For example, non-iodized salt may be used at home while iodized salt was required in the student canteens; or while iodized salt was used at home, non-iodized salt might be used in small table venues where there is no effective surveillance. Furthermore, there was a significant difference in iodine nutrition between children with and without consuming iodine-rich processed food due to the high iodine content in some processed foods. Therefore, improvements in food habits could facilitate healthier eating behaviors [16-18].
Whether iodine-rich processed foods affect iodine status in the particularly vulnerable group of SAC in China has not been investigated to date. Therefore, the purpose of this study was to 1) investigate the dining places of children; 2) evaluate the iodine nutritional status of SAC, determine the contribution of different sources (including water, salt, iodine-rich processed foods, and cooked foods) to the total iodine intake of children, and analyze the influence of different sources on iodine nutritional status; and 3) analyze the influence of the water iodine concentration (WIC), salt iodine concentration (SIC), and cooked food iodine on thyroid disease (goiter and nodular).
-
In 2020, this cross-sectional investigation was conducted using multiple sampling techniques. Seven provinces were selected according to their location in China, including Xinjiang, Sichuan, Shanxi, Liaoning, Fujian, Anhui, and Hubei. Four counties were selected in each province using the county as a sampling unit. In total, 28 counties were investigated in China. Two inland counties (including one high and one low economic level) and two coastal counties (economic levels as above) were selected in coastal provinces; two mountainous counties (economic levels as above) and two plain counties (economic levels as above) were selected in inland provinces. Each investigated county was divided into five sample areas: east, west, south, north, and central. Then, a town in a rural area or a district in an urban area was randomly selected from each sampling area (including at least one district in each county). Forty children aged eight to ten years were selected from the local elementary school in each sampling area. (If less than 40 students were available, more students could be added from a nearby school. Each area required balanced age and gender. When the number of children aged 8–10 was insufficient, it could be expanded to 7–12 years old, while maintaining the ratio of boys to girls as close to 1:1 as possible). A total of 200 children would be recruited from each county. It was expected that 800 children would be selected for the study in each province, for a total of 5,600 children. According to Andersen et al. [19], the recommended survey population for the reliability of iodine nutrition surveys, the sample size of each group was determined by the variation of the urinary iodine concentration; the number of spot urine samples needed to estimate the iodine level in a population with 95% confidence within a precision range of ±5% that was about 489. In contrast, 800 individuals in each province were surveyed in our investigation, consistent with 95% confidence within a precision range of ±5% of the iodine nutrition survey.
-
The median WIC (MWIC) in the sampling area was obtained from the 2017 National Survey on Iodine Levels in Drinking Water [20]. The iodine intake from the water of each child was calculated with reference to the daily water intake of 700 mL [21]. Edible salt samples were collected from the sampled children’s households. The data on salt intake at each survey site were from the 2011 national survey results on salt intake by province with the three-day weighing method [22]. Salt iodine intake is calculated based on SIC and salt intake. The children’s dining places in the past week before the investigation day using the one-week dietary review method and their consumption of iodine-rich processed foods in the last year were collected. Dining places include home, canteen, take-out, restaurant, street food, small table (private places that have emerged in recent years around schools to provide meals, rest, and study for primary and secondary school students), and catering point. The Food Frequency Questionnaire (FFQ) method was adapted to record the varieties and average consumption of iodine-rich processed foods. Then the field questionnaire was completed. The amount of iodine consumed by children through iodine-rich processed foods was calculated based on the frequency and amount of iodine-rich processed foods consumed and the iodine content of iodine-rich processed foods. As shown in the supplementary material, a total of 16 iodine-rich processed foods were chosen from the book of China Food Composition Tables in 2018. It covers almost all foods that could be bought from the market and their iodine content. The consumption amounts of iodine-rich processed foods and their frequencies are categorized as follows based on processing methods and iodine content [23].
Food categories and consumption:
(a) Pickled vegetables, all kinds of sauces, salted duck eggs; one sachet is 50 g
(b) Seaweed, e.g., Poli seaweed; one piece is 1 g
(c) Fresh kelp, referring to soaked kelp; the amount shown in the supplementary material is about 80 g
(d) Laver, referring to dried laver; one piece is 10 g
(e) Instant noodles; one bag or barrel is about 100 g, as shown in the supplementary material
(f) Cooked meat, including sausage, ham sausage, roast chicken, roast duck, jerky, bacon, and luncheon meat; one roast chicken is about 500 g
(g) Salty dried nut, including salted melon seeds, fried peanuts, pine nuts, pumpkin seeds, strangely flavored beans, and five-spicy beans; one sachet is about 20 g
(h) Bean products, spicy strips; one bag of Wei Long spicy strips is 140 g
(i) Seafood, including fish, shrimp, crab, and shellfish; a meal is about 100 g
(j) Puffed food, including potato chips, rice crackers, onion rings, and popcorn; a small bag is about 60 g, a large bag is about 160 g, and a barrel is 160 g
(k) Canned fish and meat; one can is about 200 g
(l) Preserved fruit, including plum pulp, licorice apricot, sour tamarind, and apricot pulp; a small bag is 100 g, a large bag is about 200 g
(m) Candy, including lollipops and chocolates; one candy is about 5 g
(n) Drinks, including carbonated drinks, fruit drinks, functional drinks, tea drinks, and milky drinks; one small bottle of drinks is 350 mL
(o) Pastry; one bag is about 70 g
(p) Milk, milk powder, yogurt, and other dairy products; one carton of milk is about 250 mL
Frequency of consumption:
(A): 1–3 times a day
(B): 1–6 times a week
(C): 1–3 times a month
(D): 1–11 times a year
(E): No consumption
Children’s morning urine specimens were collected in 4–5 mL containers and transported to the laboratory for storage at −20 °C after collection in the field. Almost all iodine intakes were absorbed by the gastrointestinal tract and excreted in the urine. Since urinary iodine is a short-term indicator, it can be used to estimate the total iodine intake of the population in a short period. The parameters taken into account include UIC, 24-h urine volume, and metabolism of iodine in the body, where total iodine intake = UIC × 24-h urine volume/0.85 [24]. The sources of daily iodine intake were grouped into the following four categories: iodized salt, water, iodine-rich processed foods, and cooked food. Considering that the loss of salt iodine from cooking is about 20% [25], iodine intake from iodized salt = SIC × the amount of salt × 0.8. Iodine intake from drinking water is the amount of iodine consumed by the respondents through drinking water per day. In supplementary material, the dietary proportion of SAC was investigated, and 16 kinds of processed foods containing iodine were summarized. Based on food intake, the daily iodine intake of SAC from iodine-rich processed foods was calculated: iodine intake from iodine-rich processed food = consumption frequency × consumption amount. We classified the remaining iodine resources as cooked food iodine (iodine that comes from cooked food), which can be obtained by subtracting the iodine of other sources from the total iodine intake. Also, children were asked about their favorite snacks and their amount and consumption frequency as additional information to the questionnaire.
-
The UIC of children was tested by As3–-Ce4+ catalytic spectrophotometry. MUIC below 100 μg/L for children aged 8–10 was defined as deficient, 100–299 μg/L was defined as sufficient, and ≥ 300 μg/L was defined as excessive [26]. Edible salt samples were tested by the “General Test Method for Salt Industry — Determination of Iodine” (GB/T 13025.7-2012) [27], salt iodized by KIO3 was determined by the direct titration method, and salt iodized by KI and others were examined by oxidation-reduction titration. The SIC < 5 mg/kg was categorized as non-iodized salt. In China, each province could select iodized salt content from 20, 25, or 30 mg iodine/kg according to the situation of IDD in the province. The coverage rate of iodized salt (CRIS) is the proportion of salt samples with iodine content ≥ 5 mg/kg to the number of samples tested. The consumption rate of qualified iodized salt (CRQIS) is the proportion of salt samples that meet the latest national standard for iodine content to the number of samples tested. The children’s thyroid volume (TVOL) was detected by ultrasound (ultrasound probes frequency at 7.5 MHz and above), and goiter status in children was diagnosed based on the TVOL. A trained, qualified ultrasound operator observed the presence and size of nodules in the thyroid gland and recorded them. The TVOL [28] was calculated as follows: volume of each lobe = 0.479 × L × W × D/1,000, where L, W, and D represent the length, width, and thickness of the thyroid’s lateral lobe, respectively. The sum of the TVOL of the right and left lobes was the total TVOL. The standard for a goiter[28] was a TVOL above 4.5 mL, 5.0 mL, and 6.0 mL for children aged 8, 9, and 10, respectively. The nodule detection rate was calculated by the proportion of the SAC with thyroid nodules to the total number of people examined (the diameter > 5 mm was counted as nodules, and multiple nodules were diagnosed based on the largest one).
-
The database was established by Excel (version 2010, Microsoft) and the statistical software SPSS (version 22, Polar Engineering and Consulting) was used for statistical description and analysis. The normal distribution and the skewed distribution measurement data were statistically described separately by means (standard deviation) and the median (the upper and lower quartiles) (M[IQR]).
An independent sample t-test was used to compare the SIC of SAC on different economic levels. A one-way analysis of variance was used to compare the SIC of SAC in different regions and geographical features. The skewed distribution data, such as the UIC and TVOL, were analyzed with nonparametric tests (Wilcoxon and Kruskal-Wallis test). The Spearman rank correlation was used to assess the relationship between the iodine source and iodine nutrition status, thyroid goiter, and nodules. Multiple linear regressions were used to analyze the effect of iodine sources on iodine nutrition in SAC. Binary logistic regression analysis was used to analyze the effect of the iodine source on thyroid disease. All tests were two-sided, and the difference was statistically significant if P < 0.05.
-
This study was conducted according to the guidelines established in the Declaration of Helsinki, and all procedures involving human volunteers were approved by the Ethics Committee of Harbin Medical University (approval number: hrbmu201807). Written informed consent was obtained from all children’s guardians one week before the investigation, and permission from the school authorities and support from teachers.
-
The basic study information is shown in Supplementary Table S1 (available in www.besjournal.com). The study investigated the age, gender, body mass index (BMI), UIC, SIC, TVOL, dining places, and intake of iodine-rich processed foods in 5,669 SAC. It also analyzed the effects of different sources of iodine intake on children’s iodine nutritional status, goiter rate (GR), and thyroid nodules. The results found that iodized salt remained the primary source of daily iodine intake for children and contributed the most to total iodine intake. In contrast, iodine intake from iodine-rich processed foods was associated with the TVOL in children. In addition, the use of non-iodized salt in iodine-rich processed foods or when eating out had less of an impact on children’s iodine nutritional status.
Table S1. Basic information of school-age children
Baseline characteristics n Gender Age BMI
(kg/m2, mean ± SD)Boys, n (%) Girls, n (%) 8, n (%) 9, n (5) 10, n (%) Region Xinjiang 804 403 (50.1) 401 (49.9) 227 (28.2) 337 (41.9) 233 (29.0) 16.0 ± 2.4 Sichuan 804 403 (50.1) 401 (49.9) 311 (38.7) 288 (35.8) 205 (25.5) 16.3 ± 2.7 Shanxi 822 417 (50.7) 405 (49.3) 153 (18.6) 302 (36.7) 327 (39.8) 17.2 ± 3.7 Liaoning 800 391 (48.9) 409 (51.1) 226 (28.3) 359 (44.9) 215 (26.9) 18.1 ± 3.7 Fujian 815 403 (49.4) 412 (50.6) 278 (34.1) 272 (33.4) 265 (32.5) 17.1 ± 3.2 Anhui 800 399 (49.9) 401 (50.1) 247 (30.9) 280 (35.0) 273 (34.1) 17.1 ± 3.4 Hubei 824 398 (48.3) 426 (51.7) 281 (34.1) 263 (31.9) 255 (30.9) 16.8 ± 3.2 Economical level High 2,806 1,394 (49.7) 1,412 (50.3) 848 (30.2) 1,072 (38.2) 864 (30.8) 17.4 ± 3.6 Low 2,864 1,420 (49.6) 1,444 (50.4) 876 (30.6) 1,029 (35.9) 909 (31.7) 16.7 ± 3.1 Geographical features Mountain 2,030 1,010 (49.8) 1,020 (50.2) 596 (29.4) 808 (39.8) 608 (30.0) 16.7 ± 3.1 Plain 1,825 910 (49.9) 915 (50.1) 542 (29.7) 680 (37.3) 549 (30.1) 16.8 ± 3.4 Coastal 800 398 (49.8) 402 (50.3) 265 (33.1) 264 (33.0) 271 (33.9) 17.7 ± 3.4 Inland 1,015 496 (48.9) 519 (51.1) 321 (31.6) 349 (34.4) 345 (34.0) 17.3 ± 3.5 Total 5,669 2,809 (49.6) 2,854 (50.4) 1,724 (30.4) 2,101 (37.1) 1,773 (31.3) 17.0 ± 3.3 -
SAC had the largest proportion of meals at home (78.7% of all eating occasions; Fujian had the highest at 92.0%; Sichuan had the lowest at 64.3%), as shown in Table 1. The next was school canteens accounting for 15.1% (Sichuan was the highest at 26.9%; Fujian was the lowest at 2.3%), and other dining places had a total of 6.1%. The ratio of eating at home to eating in a canteen was 5.0:1, and that of eating at home to eating away from home was 3.8:1. According to the analysis of the three meals of children in one day, the proportions of dining at home for breakfast, lunch, and dinner were higher compared with other dining places (85.0% for breakfast; 57.7% for lunch; and 93.4% for dinner), and the proportion of dining in a canteen for lunch could also reach 37.7%.
Table 1. The proportion of children eating in different dining places and proportion of dining places for three meals a day
Region Dining iocation (%) Home/other
(x:1)Home/canteen
(x:1)Home Canteen Take-out Restaurant Street
foodSmall
tableCatering
pointProvinces Xinjiang 86.2 13.0 0.5 0.0 0.0 0.0 0.0 6.2 6.6 Sichuan 64.3 26.9 0.4 2.4 2.1 3.2 0.0 1.8 2.4 Shanxi 89.6 4.6 0.8 1.4 1.4 0.5 0.0 8.6 19.4 Liaoning 74.2 23.1 0.1 0.8 0.6 0.2 0.1 2.9 3.2 Fujian 92.0 2.3 0.2 1.6 1.7 0.8 1.1 11.5 27.2 Anhui 77.7 13.9 0.1 0.7 4.0 0.7 2.5 3.5 4.7 Hubei 67.2 22.0 0.2 1.2 8.4 0.2 0.1 2.1 3.0 3 meals Breakfast 85.0 5.2 0.1 1.1 6.8 0.4 0.0 — — Lunch 57.7 37.7 0.4 1.0 0.4 1.0 1.5 — — Dinner 93.4 2.4 0.4 1.5 0.7 1.0 0.1 — — Total 78.7 15.1 0.3 1.2 2.6 0.8 0.5 3.8 5.0 -
As shown in Table 2, the MWIC was 3.8 (1.7–6.3) μg/L [Liaoning was the highest at 9.4 (5.3–13.2) μg/L; Sichuan was the lowest at 1.9 (1.4–3.3) μg/L]. A total of 5,646 salt samples were collected and detected. The mean SIC ± SD was 24.8 ± 5.8 mg/kg, and the CRIS and CRQIS were 96.9% and 92.6%, respectively. The CRIS and CRQIS in all provinces met the elimination standard of iodine deficiency disease except in Fujian, where the CRIS was 89.7%, and the CRQIS was 86.1%. The median iodine intake of SACs through water was 2.7 (1.1–4.4) μg/d, and the highest was Liaoning [6.6 (3.3–9.4) μg], the lowest was Sichuan [1.3 (0.6–4.1) μg]. The average salt intake in SAC was 8.9 g. The average iodine intake of SACs through iodized salt was 220.5 ± 62.9 μg, and the highest was Xinjiang (295.4 ± 44.0 μg), and the lowest was Fujian (152.0 ± 54.4 μg). The median daily iodine intake of SAC through iodine-rich processed foods was 4.1 (1.5–8.7) μg, and the highest iodine intake for children from processed foods was Hubei [6.7 (2.8–17.1) μg] [43.2 (12.7–51.5) μg in Ezhou, Hubei], the lowest was Xinjiang [1.1 (0.5–3.8) μg] [0.7 (0.1–0.7) μg in Yining, Xinjiang]. Figure 1 presents the proportional differences in a graph. Iodine intakes mainly come from the consumption of iodized salt, accounting for 79.2%, followed by cooked food (18.4%), processed foods (1.5%) and water (1.0%). Due to the geographical location and economic conditions, children living in Xinjiang consume fewer iodine-rich processed foods and may be affected by consuming iodine oil capsules. So, after excluding the data from Xinjiang and reanalyzing the overall data, the percentage of children’s daily iodine intake from water, iodized salt, iodine-rich processed foods, and cooked food was 1.0%, 76.4%, 1.8%, and 20.9%, respectively.
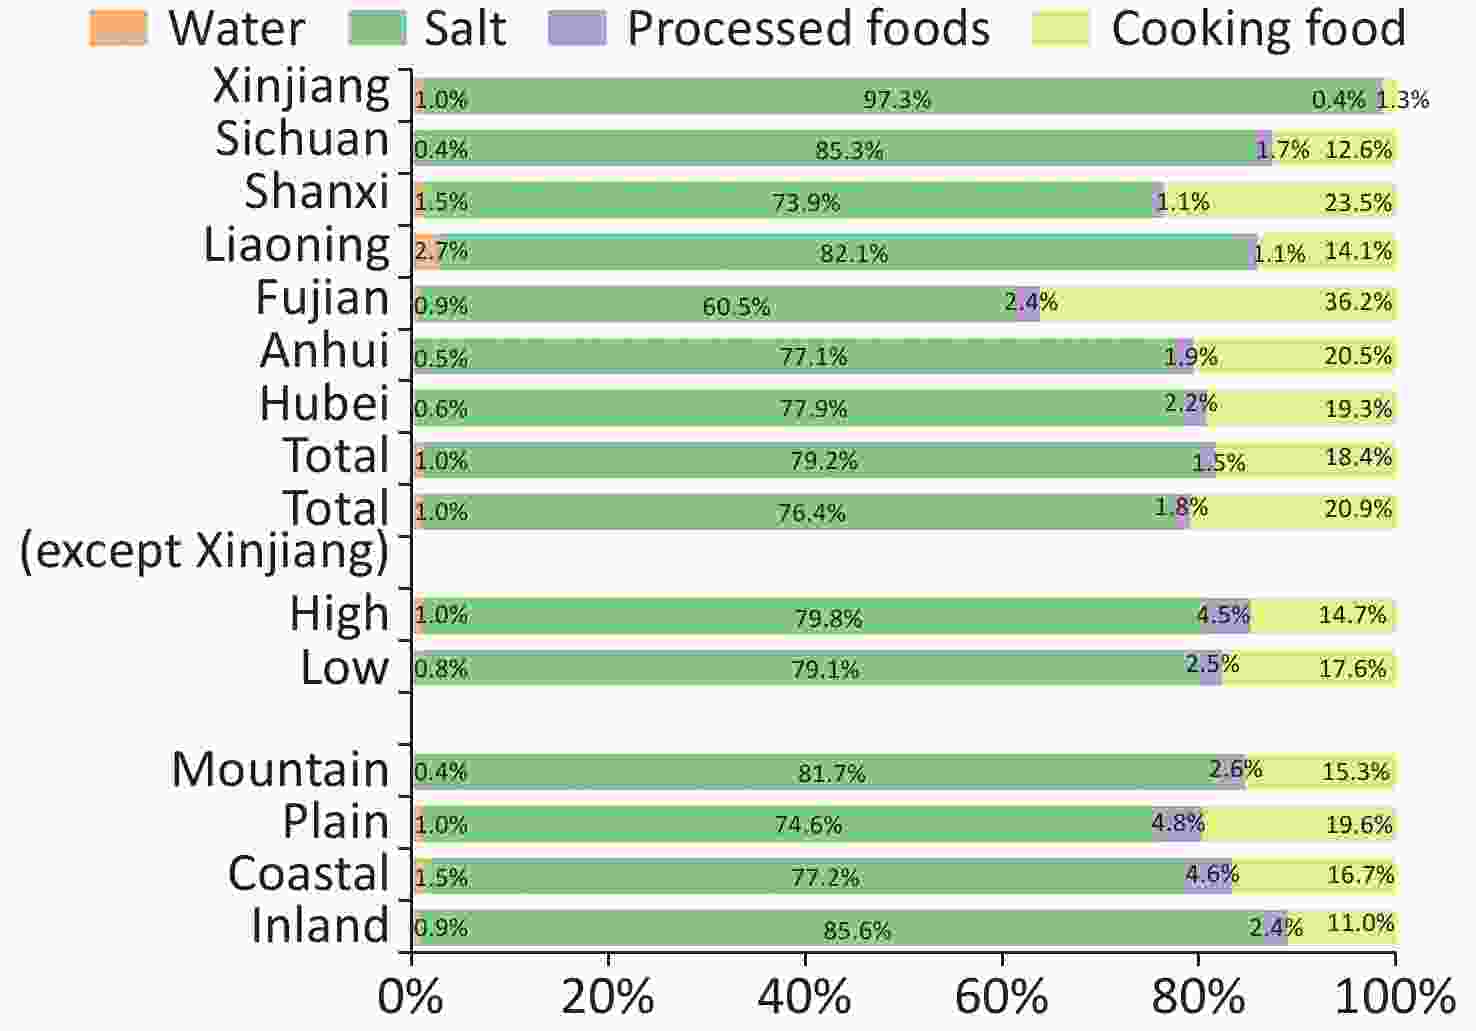
Figure 1. The contribution of different iodine sources to the total iodine intake in children. Due to the possible influence of taking iodine oil pills, the data from Xinjiang were excluded, and the overall proportion was reanalyzed.
Table 2. Iodine intake from different sources
Factors MUIC (µg/L) Total iodine
intake (µg)Source of iodine Water Salt Processed foods iodine intake
(µg)Cooking food iodine intake (µg) MWIC (µg/L) Iodine Intake (µg) SIC (mg/kg) CRIS* (%) CRQIS† (%) Iodine Intake
(µg)Region Xinjiang 258.0
(179.1, 331.8)303.5
(210.9, 389.7)4.4
(2.1, 7.2)3.0
(0.9, 9.4)26.9 ± 4.0 100.0 92.9 295.4 ± 44.0 1.1
(0.5, 3.8)4.0
(−85.0, 92.6)Sichuan 249.9
(169.6, 360.8)294.0
(199.5, 424.5)1.9
(1.4, 3.3)1.3
(0.6, 4.1)27.2 ± 6.3 97.3 93.3 250.9 ± 58.3 4.9
(2.1, 11)36.9
(−84.1, 135.2)Shanxi 234.5
(129.2, 380.5)275.9
(152.0, 447.6)5.9
(3.6, 6.4)4.2
(2.0, 6.6)25.2 ± 4.9 98.5 93.3 203.9 ± 39.8 3.1
(1.3, 8.1)64.8
(−37.6, 283.8)Liaoning 204.0
(135.5, 286.4)240.0
(159.5, 336.9)9.4
(5.3, 13.2)6.6
(3.3, 9.4)23.7 ± 5.1 96.7 95.1 197.1 ± 42.4 2.6
(1.3, 7.0)33.8
(−45.4, 137.3)Fujian 213.7
(135.9, 310.2)251.4
(159.8, 364.9)3.2
(1.5, 3.6)2.3
(0.8, 4.4)21.7 ± 7.8 89.7 86.1 152.0 ± 54.4 6.1
(2.4, 12)91.0
(−21.2, 199.5)Anhui 247.2
(164.0, 328.1)290.8
(159.8, 364.9)2.1
(1.1, 3.1)1.5
(0.7, 3.8)23.1 ± 5.3 96.1 94.5 224.1 ± 51.2 5.5
(2.8, 9.0)59.7
(−58.9, 133.8)Hubei 251.7
(174.9, 350.0)296.1
(205.8, 411.8)2.6
(1.6, 3.0)1.8
(1.1, 2.8)25.9 ± 4.1 99.9 93.1 230.6 ± 36.4 6.7
(2.8, 17.1)57.0
(−52.8, 148.1)Economical level High 228.6
(150.5, 318.2)268.8
(177.0, 268.8)3.9
(1.9, 5.8)2.7
(1.3, 4.1)24.1 ± 6.6 95.0 90.8 234.2 ± 120.6 4.3
(1.5, 11.5)21.8
(−76.1, 141.9)Low 244.8
(159.7, 346.4)287.7
(187.1, 407.5)3.2
(1.6, 6.9)2.3
(1.1, 4.8)25.6 ± 4.8 98.7 94.4 244.8 ± 63.3 4.2
(1.7, 8.0)33.2
(−67.9, 153.2)Geographical features Mountain 247.1
(167.5, 331.3)290.5
(196.7, 389.5)1.8
(1.2, 3.6)1.3
(3.2, 4.2)26.7 ± 4.9 99.3 93.0 274.7 ± 91.5 4.0
(1.5, 7.9)2.2
(−93.6, 114.6)Plain 250.1
(163.0, 366.4)298.3
(200.0, 442.6)4.2
(2.5, 7.8)2.7
(1.9, 4.8)24.6 ± 5.3 97.5 93.8 253.1 ± 108.3 4.2
(1.3, 11.8)33.5
(−72.6, 175.5)Coastal 207.8
(131.5, 297.1)244.5
(154.7, 349.6)5.2
(4.6, 6.0)3.7
(3.2, 4.2)21.2 ± 8.0 88.2 84.7 165.2 ± 62.1 5.7
(1.8, 11.9)58.1
(−29.0, 179.2)inland 211.4
(138.6, 295.4)245.2
(159.1, 352.4)3.1
(1.7, 6.1)5.2
(1.1, 9.2)23.6 ± 5.1 98.0 96.3 203.4 ± 48.8 4.8
(1.9, 8.7)34.2
(−59.5, 148.4)Total 236.6
(155.6, 344.2)278.4
(183.0, 393.2)3.8
(7, 6.4)2.7
(1.1, 4.7)24.8 ± 5.8 96.9 92.6 220.5 ± 62.9 4.1
(1.5, 8.7)51.1
(−55.9.158.3)Excluding Xinjiang 232.6
(151.2, 335.0)273.7
(177.9, 394.1)3.8
(1.7, 6.3)2.7
(1.1, 4.4)24.5 ± 6.0 − − 209.1 ± 57.0 4.8
(1.9, 9.7)57.1
(−50.8, 169.5)Note. Results were presented as $ \stackrel{-}{x} $ ± s for normal distribution data and median (25th–75th) for skewed distribution data. MUIC, median urine iodine concentration; MWIC, median water iodine; SIC, salt iodine; CRIS, coverage rate of iodized salt, CRQIS, consumption rate of qualified iodized salt; *CRIS = number of salt samples with iodine content ≥ 5 mg/kg / number of samples tested ×100%; †CRQIS = number of salt sample with qualified iodine content / number of samples tested ×100% -
As shown in Table 3, the overall MUIC of students was 236.6 (155.6–344.2) μg/L. Significant differences were observed in MUIC among the different regions (P < 0.001). The highest MUIC was Xinjiang (258.0 μg/L), and the lowest was Liaoning (204.0 μg/L). Boys had a significantly higher MUIC than girls (P < 0.001). The TVOL of 5,659 students showed a skewed distribution, and the median TVOL was 2.7 (IQR: 2.2–3.4) mL. The median TVOL was significantly different in children aged 8 (2.5, IQR: 2.0–3.1 mL), 9 (2.7, IQR: 2.2–3.4 mL), and 10 (3.0, IQR: 2.4–3.8 mL) years, which is normal according to the natural growth law of adolescents. A total of 136 children with goiter were found in this survey, and the total GR (TGR) was 2.4% (the highest rate was 4.5% in Sichuan, and the lowest rate was 0.5% in Xinjiang). The TGR in children aged 8, 9, and 10 were 2.6%, 2.8%, and 1.9%, respectively. The total nodular detection rate was 11.5%. The rate of children with nodules varied in different regions, with the highest rate of 17.5% in Xinjiang and the lowest rate of 3.3% in Fujian. When the SIC, UIC, and TVOL of SAC in different regions were compared, the levels of SIC and UIC of SAC differed significantly, and the TVOL differed among 8, 9, and 10 years of age (F = 111.6; H = 106.7; H = 144.6, P < 0.001). According to the analysis of different economic conditions and geographical characteristics, the results were also different, showing that the SIC and UIC of children living in areas with low economic levels (SIC = 25.6 mg/kg; MUIC = 244.8 μg/L) were higher than with better economic levels (SIC = 24.1 mg/kg; MUIC = 228.6 μg/L), whereas, children living in coastal areas (TVOL = 3.0 mL) or areas with better economic levels (TVOL = 2.9 mL) had higher TVOL than children in other areas (TVOL = 2.7 mL in inland areas; 2.8 mL in plain areas; 2.6 mL in mountain areas) or in lower economic levels (TVOL = 2.6 mL). The detection rate of thyroid nodules was higher in areas with high economic levels than in areas with low economic levels (13.1% in high economic levels and 9.8% in low economic levels).
Table 3. Iodine nutrition status, TVOL, and GR of SAC
Factors Urine (n = 5, 664) Thyroid (n = 5, 659) n MUIC
(P25, P75,
µg/L)P value n TVOL
(P25, P75,
mL)TGR
(%)P value 8 9 10 n TVOL
(P25, P75, mL)TGR
(%)n TVOL
(P25, P75, mL)TGR
(%)n TVOL
(P25, P75, mL)TGR
(%)Region Xinjiang 804 258.0
(179.1, 331.8)0.001 803 2.0
(1.6, 2.6)0.5 0.001 227 1.8
(1.5, 2.2)0.4 337 2.1
(1.6, 2.6)0.6 233 2.3
(1.8, 3.0)0.4 Sichuan 805 249.9
(169.6, 360.8)805 3.3
(2.7, 3.9)4.5 312 3.0
(2.5, 3.6)4.8 288 3.4
(2.8, 4.0)3.8 205 3.7
(3.0, 4.3)4.9 Shanxi 819 234.5
(129.2, 380.5)813 3.0
(2.4, 3.8)3.1 151 2.6
(2.2, 3.4)4.0 304 2.8
(2.3, 3.6)3.6 326 3.3
(2.6, 4.0)2.1 Liaoning 800 204.0
(135.5, 286.4)800 3.0
(2.3, 3.6)2.8 226 2.8
(2.2, 3.3)2.7 369 2.9
(2.3, 3.5)3.1 215 3.3
(2.6, 4.0)2.3 Fujian 814 213.7
(135.9, 310.2)814 2.8
(2.3, 3.3)2.0 278 2.4
(2.1, 3.0)2.2 272 2.9
(2.4, 3.3)2.2 265 3.0
(2.6, 3.8)1.5 Anhui 798 247.2
(164.0, 328.1)800 2.8
(2.3, 3.5)2.8 247 2.5
(2.1, 3.0)2.8 280 2.9
(2.3, 3.6)4.3 273 3.1
(2.6, 3.8)1.1 Hubei 824 251.7
(174.9, 350.0)824 2.3
(1.8, 2.9)1.5 281 2.0
(1.6, 2.4)1.1 263 2.3
(1.9, 3.0)1.9 255 2.6
(2.0, 3.2)1.6 Gender Boys 2,801 241.1
(158.6, 337.1)0.001 2,811 2.8
(2.2, 3.4)2.0 0.001 869 2.5
(2.0, 3.1)2.4 1,020 2.8
(2.2, 3.4)2.1 887 3.0
(2.4, 3.7)1.7 Girls 2,842 216.1
(139.8, 316.7)2,850 2.7
(2.1, 3.5)2.8 855 2.4
(1.9, 3.1)2.9 1,081 2.7
(2.1, 3.4)3.4 886 3.1
(2.4, 3.8)2.1 Geographic area Urban 1,968 232.0
(155.8, 331.4)0.819 1,968 2.8
(2.2, 3.5)2.7% 0.349 590 2.5
(2.0, 3.1)3.4% 776 2.8
(2.2, 3.4)2.7% 582 3.1
(2.4, 3.9)2.1% Rural 3,965 240.1
(155.5, 335.4)3,699 2.8
(2.2, 3.6)7.0% 1132 2.5
(2.0, 3.2)8.9% 1,325 2.8
(2.1, 3.5)6.0% 1,191 3.1
(2.4, 4.0)6.0% Economical level High 2,806 228.6
(150.5, 318.2)0.001 2,796 2.9
(2.3, 3.5)3.1 0.001 846 2.6
(2, 0, 3.2)3.4 1,065 2.8
(2.2, 3.4)3.4 863 3.2
(2.6, 3.9)2.4 Low 2,858 244.8
(159.7, 346.4)2,863 2.6
(2.1, 3.3)1.8 875 2.4
(1.9, 3.0)1.7 1,030 2.6
(2.1, 3.4)2.1 909 2.9
(2.2, 3.7)1.4 Geographical features Mountain 2,026 247.1
(167.5, 331.3)0.001 2,026 2.6
(2.0, 3.3)1.7 0.001 594 2.4
(1.8, 2.9)1.7 807 2.5
(2.0, 3.2)2.1 607 2.8
(2.2, 3.6)1.3 Plain 2,024 250.1
(163.0, 366.4)2,019 2.8
(2.2, 3.6)3.2 623 2.5
(2.0, 3.2)3.5 657 2.9
(2.1, 3.6)3.6 799 3.2
(2.5, 3.8)2.5 Coastal 800 207.8
(131.5, 297.1)800 3.0
(2.4, 3.7)3.1 265 2.7
(2.1, 3.4)2.6 264 3.0
(2.5, 3.6)4.2 271 3.3
(2.8, 4.1)2.6 inland 814 211.4
(138.6, 295.4)814 2.7
(2.3, 3.3)1.6 239 2.5
(2.0, 2.9)2.1 367 2.8
(2.3, 3.4)1.6 209 3.0
(2.4, 3.7)1.0 Total 5,664 236.6
(155.6, 344.2)5,659 2.7
(2.2, 3.4)2.4 1,722 2.5
(2.0, 3.1)2.6 2,103 2.7
(2.2, 3.4)2.8 1,722 3.0
(2.4, 3.8)1.9 Note. Wilcoxon test was used to compare UIC and TVOL between genders, geographic area and economical level. Kruskal–Wallis test was used to compare UIC and TVOL among region and geographical features. P < 0.05 was considered statistically significant. MUIC, median of urine iodine concentration; TVOL, thyroid volume; TGR, thyroid goiter rate. -
In Table 4, the effects of various iodine sources on iodine nutritional status and thyroid goiter and nodules in SAC were analyzed. The SIC correlated with UIC and TVOL (r = 0.999 and −0.933, respectively, P < 0.05), iodine intake from processed foods also showed a weak correlation with the TVOL (r = 0.080, P < 0.01). There was no significant correlation between other iodine sources and iodine nutritional status and between thyroid goiter and nodule in SAC. In Supplementary Table S2 (available in www.besjournal.com), the effects of various iodine sources on iodine nutritional status in children were analyzed by multiple linear regressions. Iodine from iodized salt and cooked food was significantly associated with UIC in children. The UIC increases with the iodine from salt (P < 0.001) and cooked foods (P < 0.001). After stratification by gender, age, and geographic area, trends also persisted. A significant positive correlation was found between iodine obtained from iodized salt and the TVOL at the total level (P = 0.033) and after controlling for age (P = 0.031 at 8 years, P = 0.040 at 9 years, and P = 0.047 at 10 years). In Supplementary Table S3 (available in www.besjournal.com), the effects of various iodine sources on thyroid disease were analyzed by binary logistic regression. The results showed that the iodine obtained from iodized salt was negatively related to thyroid goiter (P = 0.004, OR = 0.997, 95% CI = 0.994, 0.999). So, the iodine from iodized salt is a protective factor for thyroid goiter. The iodine from water and iodine-rich processed foods were related to thyroid nodules (water: P < 0.001, OR = 0.983, 95% CI = 0.974, 0.992; iodine-rich processed foods: P = 0.001, OR = 1.053, 95% CI = 1.022, 1.085). Therefore, we maintain that iodine from water is a protective factor, and iodine from iodine-rich processed food is a risk factor for thyroid nodules.
Table 4. The influence of iodine intake from different source on iodine nutrition status and thyroid disease
Iodine resource UIC (µg/L) TVOL (mL) TGR (%) Nodular detection rate (%) r P value r P value r P value r P value WIC −0.151 0.443 0.066 0.740 0.137 0.486 0.036 0.859 SIC 0.999* < 0.001 −0.933* 0.021 −0.272 0.162 − − Processed food iodine 0.001 0.940 0.080* < 0.001 0.074 0.720 −0.288 0.163 Cooking food iodine 0.205 0.296 0.197 0.315 −0.279 0.150 0.135 0.503 Note. UIC, urine iodine concentration; TVOL, thyroid volume; TGR, thyroid goiter rate; WIC, water iodine concentration; SIC, salt iodine concentration; *Correlation analysis was used to describe correlations between different variables. P < 0.05 was considered significant. Table S2. Effect of iodine source on iodine nutritional status of SAC
Indicators
Iodine intakeUIC (µg/L) TVOL (mL) β t P value β t P value Genders Boys WIC 0.069 0.848 0.405 0.032 0.157 0.876 SIC 0.752 8.528 < 0.001 −0.025 −0.114 0.911 Processed food iodine 0.046 0.573 0.572 0.172 0.862 0.397 Cooking food iodine 0.903 10.249 < 0.001 0.236 1.087 0.288 Girls WIC −0.009 −0.096 0.924 −0.038 −0.217 0.830 SIC 0.774 7.470 < 0.001 −0.428 −2.208 0.037 Processed food iodine 0.071 0.763 0.453 0.083 0.476 0.638 Cooking food iodine 0.917 8.796 < 0.001 0.221 1.134 0.269 Geographic area Urban WIC −0.360 −1.044 0.317 0.095 0.278 0.786 SIC 0.854 2.344 0.037 −0.588 −1.626 0.130 Processed food iodine 0.696 1.588 0.138 0.124 0.284 0.781 Cooking food iodine 0.277 0.893 0.389 −0.083 −0.271 0.791 Rural WIC −0.004 −0.042 0.967 0.013 0.060 0.953 SIC 0.727 7.384 < 0.001 −0.479 −2.123 0.050 Processed food iodine 0.040 0.431 0.672 0.114 0.538 0.598 Cooking food iodine 0.922 9.107 < 0.001 0.139 0.599 0.557 Ages (years) 8 WIC 0.152 1.302 0.206 −0.134 −0.717 0.480 SIC 0.729 5.905 < 0.001 −0.454 −2.302 0.031 Processed food iodine 0.005 0.040 0.968 0.118 0.643 0.526 Cooking food iodine 0.719 5.816 < 0.001 0.056 0.282 0.781 9 WIC 0.040 0.335 0.741 0.043 0.248 0.806 SIC 0.727 5.483 < 0.001 −0.411 −2.175 0.040 Processed food iodine 0.140 1.180 0.250 0.114 0.673 0.507 Cooking food iodine 0.845 6.395 < 0.001 0.278 1.477 0.153 10 WIC 0.020 0.179 0.860 −0.087 −0.488 0.630 SIC 0.803 6.330 < 0.001 −0.435 −2.108 0.047 Processed food iodine 0.278 2.416 0.024 0.101 0.538 0.596 Cooking food iodine 0.899 7.171 < 0.001 0.168 0.824 0.419 Total WIC 0.037 0.461 0.649 −0.039 −0.225 0.824 SIC 0.782 8.992 < 0.001 −0.432 −2.265 0.033 Processed food iodine 0.064 0.811 0.425 0.103 0.593 0.559 Cooking food iodine 0.927 10.635 < 0.001 0.224 1.172 0.253 Note. UIC, urine iodine concentration; TVOL, thyroid volume; WIC, water iodine concentration; SIC, salt iodine concentration. Table S3. Effect of iodine source on thyroid disease of SAC
Indicators Iodine intake† TGR Nodular detection rate (%) β OR 95% CI P value β OR 95% CI P value Genders Boys WIC 0.004 1.004 0.994 1.014 0.479 −0.021 0.979 0.965 0.994 0.005 SIC −0.001 0.999 0.995 1.002 0.484 0.001 1.001 1.000 1.002 0.184 Processed food iodine 0.008 1.008 0.919 1.106 0.866 0.037 1.038 0.992 1.085 0.105 Cooking food iodine 0.001 1.001 1.000 1.002 0.173 0.000 1.000 0.999 1.000 0.447 Girls WIC −0.003 0.997 0.985 1.010 0.656 −0.014 0.986 0.975 0.997 0.016 SIC −0.005 0.995 0.992 0.998 0.001 0.000 1.000 0.999 1.002 0.523 Processed food iodine −0.046 0.955 0.876 1.042 0.299 0.064 1.066 1.023 1.110 0.002 Cooking food iodine −0.001 0.999 0.998 1.001 0.275 0.000 1.000 0.999 1.001 0.902 Geographic area Urban WIC 0.003 1.003 0.990 1.015 0.670 −0.014 0.986 0.975 0.997 0.016 SIC −0.003 0.997 0.993 1.001 0.185 0.000 1.000 0.999 1.002 0.523 Processed food iodine −0.101 0.904 0.802 1.019 0.100 0.064 1.066 1.023 1.110 0.002 Cooking food iodine 0.000 1.000 0.998 1.001 0.840 0.000 1.000 0.999 1.001 0.902 Rural WIC 0.000 1.000 0.990 1.010 0.987 −0.023 0.977 0.965 0.990 < 0.001 SIC −0.003 0.997 0.994 1.000 0.023 0.001 1.001 1.000 1.002 0.113 Processed food iodine 0.018 1.018 0.942 1.101 0.648 −0.002 0.998 0.958 1.040 0.923 Cooking food iodine 0.000 1.000 0.999 1.001 0.996 0.000 1.000 1.000 1.001 0.889 Ages (years) 8 WIC −0.001 0.999 0.983 1.015 0.906 −0.028 0.972 0.951 0.994 0.012 SIC −0.002 0.998 0.994 1.002 0.262 0.001 1.001 0.999 1.002 0.409 Processed food iodine −0.011 0.989 0.885 1.106 0.847 0.045 1.046 0.986 1.109 0.139 Cooking food iodine 0.001 1.001 0.999 1.002 0.314 0.000 1.000 0.999 1.001 0.941 9 WIC 0.003 1.003 0.994 1.012 0.534 −0.014 0.986 0.972 0.999 0.038 SIC −0.003 0.997 0.993 1.001 0.115 0.001 1.001 1.000 1.002 0.211 Processed food iodine −0.035 0.966 0.881 1.059 0.455 0.070 1.072 1.027 1.120 0.002 Cooking food iodine 0.000 1.000 0.998 1.001 0.774 0.000 1.000 0.999 1.001 0.671 10 WIC −0.006 0.994 0.971 1.018 0.640 −0.012 0.988 0.974 1.002 0.083 SIC −0.005 0.995 0.991 0.999 0.022 0.000 1.000 0.999 1.002 0.733 Processed food iodine 0.003 1.003 0.876 1.148 0.964 0.024 1.024 0.965 1.088 0.431 Cooking food iodine 0.000 1.000 0.998 1.001 0.731 −0.001 0.999 0.999 1.000 0.258 Total WIC 0.001 1.001 0.993 1.009 0.896 −0.017 0.983 0.974 0.992 < 0.001 SIC −0.003 0.997 0.994 0.999 0.004 0.001 1.001 1.000 1.001 0.185 Processed food iodine −0.020 0.980 0.920 1.044 0.535 0.051 1.053 1.022 1.085 0.001 Cooking food iodine 0.000 1.000 0.999 1.001 0.996 0.000 1.000 0.999 1.000 0.461 Note. TGR, thyroid goiter rate; WIC, water iodine concentration; SIC, salt iodine concentration. Based on UIC, we calculated the children’s total iodine intake. Then, based on the frequency of processed foods, the amount of intake, and the iodine content of processed foods, we calculated the iodine intake of children through processed foods. We assumed that processed foods do not contain iodine, i.e., based on the presumption that all iodine in processed food comes from iodized salt during production and not from the food. Then, we recalculated the total iodine intake and compared its effect on UIC in children. As shown in Supplementary Table S4 (available in www.besjournal.com), when the processed food was presumed to be produced without using iodized salt, the proposed MUIC of SAC was lower than that in SAC when it was using iodized salt. However, the proposed MUIC was higher than 200 µg/L for all provinces except Liaoning (197.2 µg/L). We compared the effect on UIC when SAC ate out using non-iodized salt, and the results showed a significant difference. The proposed MUIC was 100–200 µg/L in all provinces except Xinjiang (213.0 µg/L) and Shanxi (200.9 µg/L).
Table S4. Effects of using non-iodized salt for processed foods or eating out on urinary iodine in children
Indicators Iodized salt
for processed
foodsProposed
non-iodized
salt for
processed
foodsz P Iodized salt
for dining outProposed
non-iodized
salt for dining
outz P Total
iodine
intakeMUIC Total
iodine
intakeMUIC Total
iodine
intakeMUIC Total
iodine
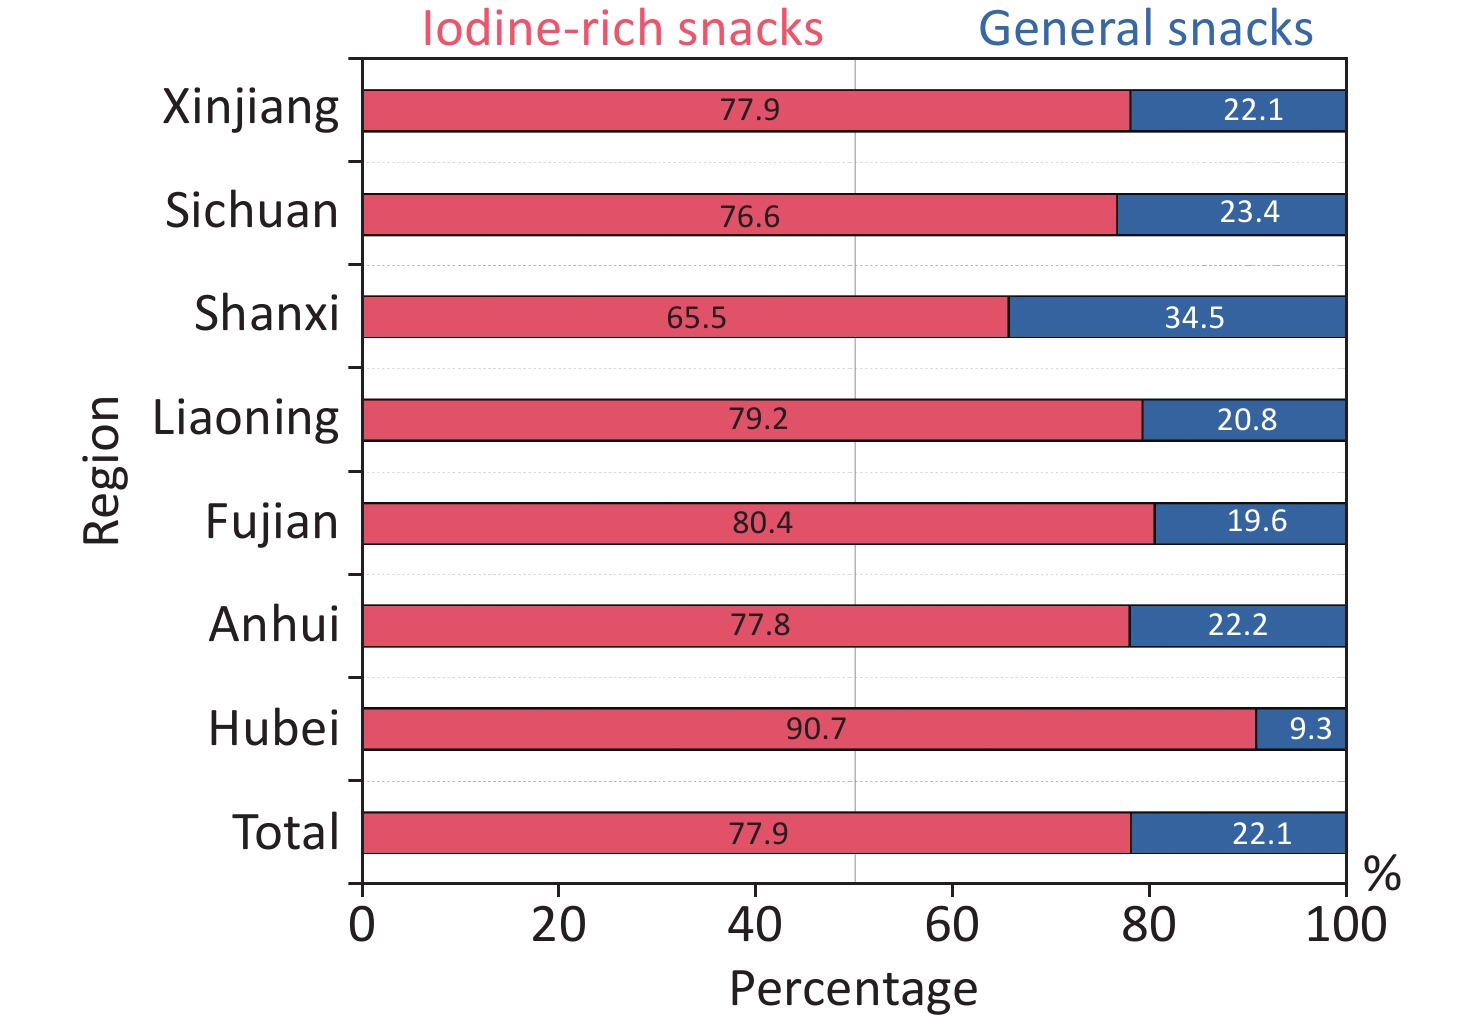
intakeMUIC Region Xinjiang 303.5 258.0 301.4 256.2 −23.935 < 0.001 303.5 258.0 250.6 213.0 −14.374 < 0.001 Sichuan 294.0 249.9 284.2 241.2 −24.579 < 0.001 294.0 249.9 175.2 148.9 −24.318 < 0.001 Shanxi 275.9 234.5 268.8 226 −24.791 < 0.001 274.9 234.5 236.3 200.9 −16.328 < 0.001 Liaoning 240.0 204.0 232.8 197.2 −24.090 < 0.001 240.0 204.0 176.9 150.4 −24.407 < 0.001 Fujian 251.4 213.7 239.5 203.9 −24.716 < 0.001 250.9 213.7 226.7 192.7 −13.0 < 0.001 Anhui 290.8 247.2 283.6 241.3 −24.457 < 0.001 290.5 247.2 213.7 181.7 −21.986 < 0.001 Hubei 296.1 251.7 273.8 234.4 −24.822 < 0.001 296.2 251.7 187.2 159.1 −23.757 < 0.001 Genders Boys 290.8 247.2 282.9 240.5 −45.576 < 0.001 290.7 247.2 215.5 183.2 −40.677 < 0.001 Girls 263.9 224.3 253.9 215.8 −46.018 < 0.001 263.5 224.3 200.6 170.5 −40.790 < 0.001 Age (years) 8 263.6 224.0 253.7 215.6 −35.586 < 0.001 263.1 224.0 196.7 167.2 −31.716 < 0.001 9 277.7 236.1 268.3 228.1 −39.454 < 0.001 277.6 236.1 213.6 181.6 −34.836 < 0.001 10 288.8 245.5 278.6 236.8 −36.306 < 0.001 288.7 245.5 210.0 178.5 −32.317 < 0.001 Geographic area Urban 273.1 232.2 263.2 223.7 −38.267 < 0.001 273.1 232.2 216.9 184.4 −33.135 < 0.001 Rural 282.5 240.1 271.7 230.9 −52.253 < 0.001 281.8 240.1 202.7 172.3 −47.121 < 0.001 Economical level High 268.9 228.6 255.1 216.8 −45.535 < 0.001 268.9 228.6 207.9 176.7 −39.588 < 0.001 Low 288.0 244.8 281.3 239.1 −46.059 < 0.001 287.7 244.8 209.9 178.4 −41.854 < 0.001 Geographical features Mountain 290.8 247.1 283.0 240.6 −38.919 < 0.001 290.5 247.1 205.4 174.6 −34.095 < 0.001 Plain 298.5 253.7 287.0 243.9 −36.604 < 0.001 298.4 253.7 221.9 188.6 −33.398 < 0.001 Coastal 244.5 207.8 233.0 198.1 −24.090 < 0.001 244.5 207.8 194.7 165.5 −22.075 < 0.001 Inland 245.3 208.5 240.1 204.1 −27.584 < 0.001 245.2 208.5 204.5 173.5 −22.621 < 0.001 Total 278.4 236.6 268.0 228.4 −64764 < 0.001 278.2 236.6 209.2 177.8 −57.606 < 0.001 Note. MUIC, median of urine iodine concentration. Through the questionnaire survey of the favorite snacks of SAC in each region, 16 favorite foods were found, including 1) puffed food, 2) candy, 3) dim sum, 4) cookies, 5) spicy strips, 6) chocolate, 7) instant noodles, 8) fruits, 9) seaweed, 10) dairy products, 11) drinks, 12) ice cream, 13) salty dried nuts, 14) jelly, 15) ham sausage, and 16) preserved fruit. In addition, two-thirds of them were iodine-rich processed foods, as shown in Supplementary Figure S1 (available in www.besjournal.com).
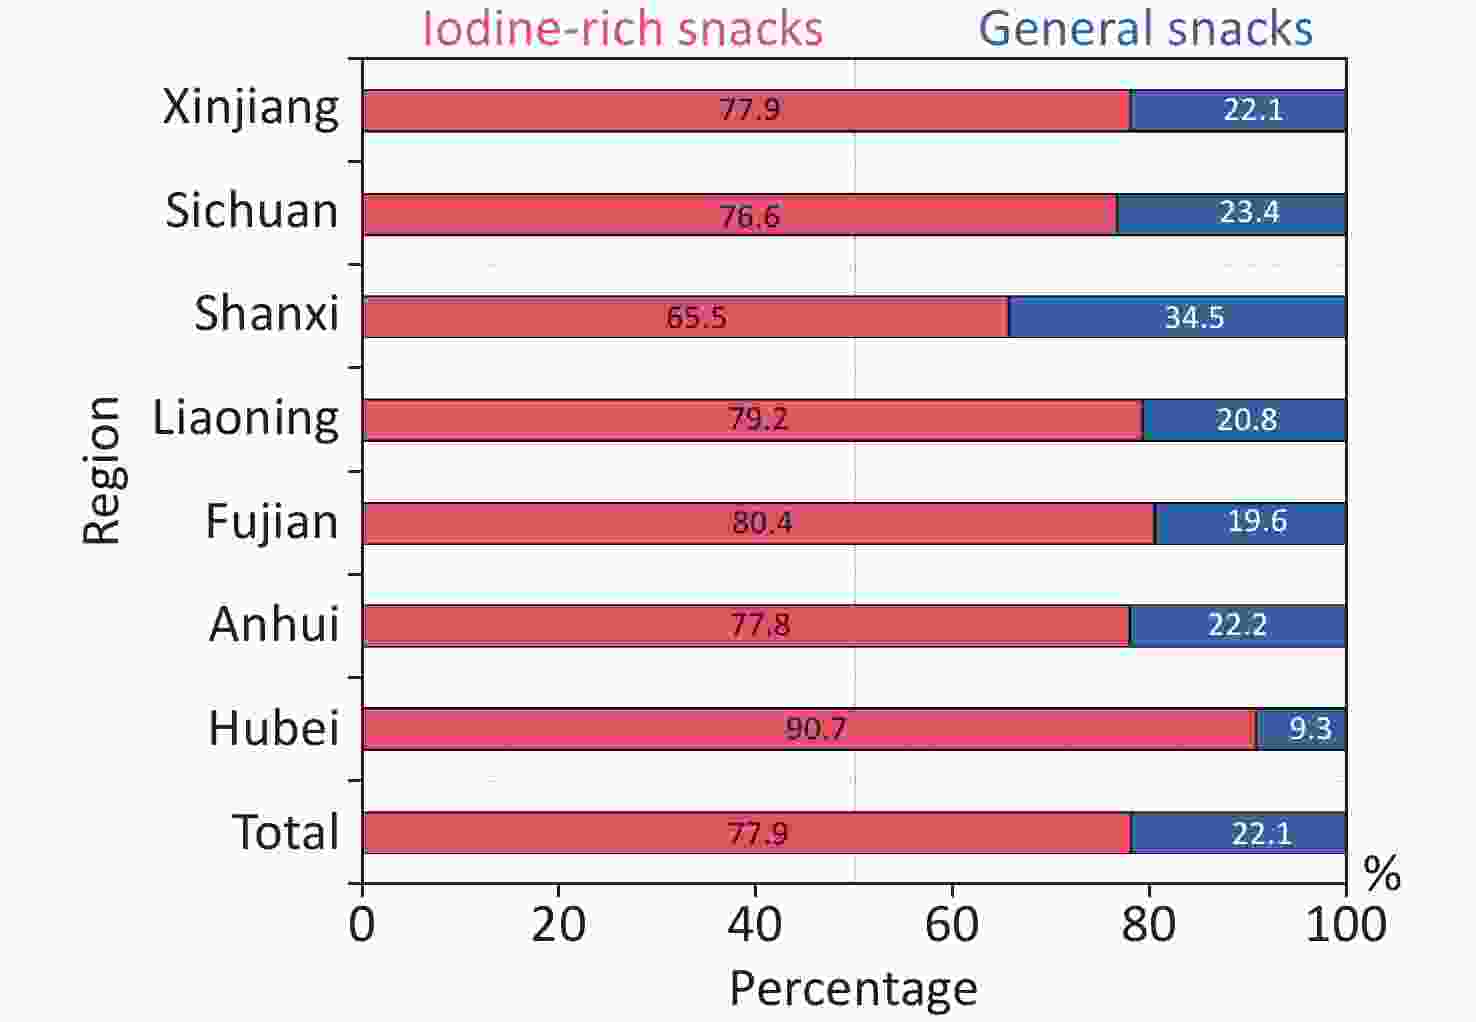
Figure S1. The percentage of iodine-rich processed foods in children's favorite snacks.
-
This study investigated the iodine nutritional status and different sources of iodine intake of 5,669 SAC in seven provinces of China by UIC, SIC, TVOL, dining places, and intake of iodine-rich processed food. It further analyzed the effect of different sources of iodine intake on children’s iodine nutritional status, GR, and thyroid nodules. Iodized salt remains the primary source of daily iodine intake for children and makes the largest contribution to the total iodine intake. Iodine intake from iodine-rich processed foods was related to the TVOL in children. Also, the use of non-iodized salt in iodine-rich processed foods or diets when eating out had less of an effect on the children’s iodine nutrition status.
The dining place is an important determinant of children’s dietary behavior. The consumption of food away from home or school has particularly been in the spotlight [29]. This nationally representative sample analysis of 5,669 children involving > 100,000 eating occasions showed that most energy intakes came from foods eaten at home and in canteens (78.7% and 15.1%). A study in the UK showed [30] that the main eating location across all age groups was at home (69%–79% of eating occasions), with the highest energy intake. It was consistent with this study. Children also chose take-out, restaurants, street food, and other ways to eat, and the proportion could reach 5.4%. Thus, in keeping with the rapid pace of a developing economic society and people’s lives, children and adults would choose to eat out to relieve the pressures of life and for a change in their environment. However, for SAC, at an important stage of growth and development, eating at home was still the first choice. An analysis of three meals per day in children found that most children chose to eat at home for breakfast and dinner, while lunch was more likely to be eaten at school. (The proportion of lunch in school canteens was less than that of eating at home. This may be due to non-boarding students who chose mostly to eat at home). Then, we took economic level into consideration mainly because 1) economic level may influence the children’s nutrition and further influence height, weight, and TVOL in SAC; 2) household income may influence dietary diversity and children’s choice of processed foods; 3) economic level may also influence SAC’s choice of dining location.
Urine iodine excretion is a good marker of recent dietary intake of iodine over days [31] and is the measure of choice for assessing iodine status. The results showed that the MUIC of SAC was 236.6 μg/L, higher than the national MUI level for 8–10-year-old children in 2019 (207.1 μg/L). Additionally, it was above 200 μg/L in every region, demonstrating that the iodine status of SAC was sufficient. The implementation of USI successfully improved iodine nutrition for the entire population. However, the CRIS and CRQIS of children in Fujian province were 89.7% and 86.1%, respectively, which were slightly lower than the national standard [32] for eliminating IDD (CRIS ≥ 95%; CRQIS > 90%) and also lower than the national IDD survey results in 2019 (CRIS = 94.3%; CRQIS = 92.3%) [33]. It may be because coastal areas tend to be economically developed, with diversified food and higher iodine intake influenced by sources besides iodized salt, for example, fresh kelp, fish, and others. On the other hand, after the reform of the salt system, the variety of salt has increased, and non-iodized salt has become more accessible. In the coastal villages, there was a case of private salt sales, causing a relatively low CRIS. In addition, it may be related to the misunderstanding of IDD among coastal residents that they can intake enough iodine by eating seafood and drinking water. However, it has been shown [34] that coastal residents cannot obtain enough iodine by only consuming seafood. In addition, we considered that the MUIC was a population-level indicator. When a minority of the group does not eat iodized salt, the MUIC will not be significantly affected. Only when more than half of the population has low levels of iodine nutrition does the MUIC drop significantly. So, even if the MUI level was optimal, some people may still be iodine inadequate. Furthermore, the iodine nutrition level of children in coastal areas was optimal only when iodized salt was consumed. Therefore, it is necessary to continue to heighten the awareness of IDD among coastal residents and to address the problem of non-iodized salt and private salt’s effect on the iodized salt market.
In nearly all regions affected by iodine deficiency, salt iodization is the most effective way to control iodine deficiency. Although iodized salt was the dominant source of the population’s iodine intake, there were still other complementary iodine resources. In this research, some areas in Xinjiang were found taking iodized oil pills. In addition to iodized salt intake and iodized oil pills, there is a certain amount of iodine in food. Most commonly consumed foods provide 3–80 μg per serving [35-36]. Bouillon cubes, containing iodized salt, cow’s milk, and dairy products, are important dietary iodine sources and contribute to adequate iodine intakes in many countries [37-38]. In this study, the main iodine-rich foods consumed in coastal areas such as Fujian were seafood, kelp, laver, and seaweed. In inland areas, they were mainly cooked meat, pickled vegetables, all kinds of sauce, and salted duck eggs.
While iodine in the diet was previously assumed to come predominantly from household iodized salt, recent evidence suggests that an increasing amount of iodized salt is consumed through processed foods in different settings [39]. An evaluation trial from Thailand showed that using iodized salt in processed foods (excluding savory condiments) met 100% of the estimated average iodine requirement for children aged 6–12 years [40]. Iodized salt in processed foods is an important source of iodine intake. The food industry should mandate the use of iodized salt, along with population monitoring, to ensure the sustainability of optimal iodine intake. WHO, United Nations International Children’s Emergency Fund (UNICEF), and International Council for the Control of Iodine Deficiency Diseases (ICCIDD) [41-42] also recommended that all edible salt used for human and animal consumption, including processed food, should be iodized. The old version of Chinese salt iodization legislation has followed this recommendation. A recent study in Shenzhen, China, showed that the rate of iodized salt use in 224 processed foods with high market coverage was about 80% [43]. In the wave of widespread advocacy for the use of iodized salt in processed foods, we have done the following analysis. By analyzing children’s favorite snacks, we summarized 16 popular snacks, most of which were iodine-rich processed foods. So, the iodine-rich processed foods investigated in this study can represent processed food intake in addition to the children’s daily diet. By analyzing the contribution of different iodine sources to total iodine intake in children, the results show that children’s iodine sources in different areas also have certain differences, which may be influenced by the economic level and dietary habits. The iodine intake from processed foods was only 1/54 of the iodine intake from table salt. Moreover, the analysis and comparison revealed that when processed food uses non-iodized salt, the MUIC is lower than that using iodized salt in SAC. However, when the proposed MUIC of SAC was > 200 µg/L, the iodine intake was still adequate. In this study, by analyzing the relationship between different iodine sources and iodine nutritional status and thyroid disease (GR and thyroid nodules, the reason why we took thyroid goiter and nodules into account was that thyroid goiter and nodules are related to iodine nutrition, iodine deficiency, and iodine excess can lead to the increased rates of thyroid goiter and nodules, so we analyzed the relationship between the iodine intake and the goiter rate, nodules), we found that the SIC affected the iodine nutrition status of SAC, which is consistent with a previous study [44]. Iodine deficiency is one of the most important causes of goiter, and iodized salt is the main source of daily iodine intake for SAC. The intake of iodized salt is essential for goiter caused by iodine deficiency. WIC is the main factor influencing iodine intake. Also, the results of the 2017 National Survey on Iodine Levels in Drinking Water showed that China had widespread iodine deficiency in the natural environment in most areas. The MWIC in the provinces surveyed in this study were all < 10 µg/L. So, for SAC in the midst of growth and development, iodine intake from drinking water and iodized salt is essential to prevent iodine deficiency and thyroid disease. In addition, the results of this study indicated that, although in the regression analysis, the difference between iodine-rich processed foods and TVOL in SAC was not significant, there was a weak correlation between them, which suggested that the iodine intake from iodine-rich processed foods affected the TVOL of SAC. In industrialized countries where iodine-rich processed foods account for a high proportion of dietary salt intake, iodine intake from iodine-rich processed foods was essential for improving the iodine nutrition of SAC [45-46]. In low- and middle-income countries, iodized table salt alone may not be sufficient to ensure adequate population iodine levels [37]. So, iodine intake from iodine-rich processed foods may affect the total iodine intake and further affect the TVOL of SAC. Therefore, in addition to emphasizing the importance of iodized salt, other iodine sources are important for children’s iodine nutrition. In areas with a high incidence of thyroid nodules, we have observed increased consumption of iodine-rich processed foods. This is possibly due to the high consumption of processed foods by SAC and their daily iodized salt intake in areas with better economic conditions, which can cause thyroid nodules due to excessive iodine intake. Regarding the changes in the water and iodine-rich processed foods intake, we calculated the contribution of various iodine sources from a population perspective rather than from individual SAC. Besides, the processed foods we investigated in the study were industrially processed foods, which were generally produced by manufacturers with stable processes and had an iodine content that was relatively stable. The FFQ method [47], which was used in the study, was a valid and reliable dietary assessment used worldwide and was suggested as an appropriate tool to collect dietary intake data for a large-scale survey. This method generally reflects the habits of the past year. Also, the water was mostly centrally supplied, and its WIC was stable. Therefore, in summary, it was assumed that the iodine intake from processed foods had a less significant effect than salt iodine on children’s daily iodine intake. Eating iodized salt remains the main source of children’s total daily iodine intake. In addition, as the frequency of eating out increases with economic development, according to the results of the study in Supplementary Table S4, the use of non-iodized salt in eating places other than at home had little effect on the iodine nutrition of SAC, and SAC were in adequate iodine status. Also, regarding processed food, we must realize that, in recent years, processed food intake has increased worldwide, representing almost 60% of total dietary intake in several countries, such as the USA and the UK, and around 17% to 24% in Mediterranean countries, such as Spain and Italy, respectively [48]. Although, according to this study in China, iodine intake from processed foods has little impact on children’s iodine nutritional status, increased consumption of processed foods in dietary proportions was associated with a higher incidence of adverse health outcomes in countries with a higher proportion of processed food intake [49].
The strength of the study was that it analyzed the effect of the intake of processed foods on children’s iodine nutritional status, and the school-based multi-stage cluster random sampling was used to make the sample representative. As the survey subjects were children, they may not be aware of household income and, therefore, the questionnaire did not include their household income. However, the economic level mainly influenced children’s iodine intake through dietary structure, and the study can directly reflect the relevant dietary structure by investigating the amount and frequency of dietary intake. When analyzing the iodine intake from water, the data on water consumption came from the 2017 National Study of Water Consumption in People Aged 6–85 years, which was not covered in this study. In addition, the samples used for urine iodine testing in children came from a single random UIC, which was used to calculate the population’s iodine intake. Although we did not use 24-h urine samples to assess the total iodine intake, the issue of urine sample screening can be disregarded provided that adequate sample size is ensured when conducting population-based iodine nutrition monitoring [50]. In addition, the morning UIC [51] remains relatively consistent for over 24 h, and time does not affect the assessment of iodine intake.
-
Children’s iodine nutrition was adequate in this study. Iodized salt remains the primary source of daily iodine intake for children, and processed foods have less influence on children’s iodine nutrition. Therefore, for children, iodized salt should be a compulsory supplement in their routine diet. We should continue to adhere to the USI, implement various prevention and control measures according to local conditions, offer the principle of classified guidance for different populations, and supply iodine based on clinical evidence.
doi: 10.3967/bes2023.002
Relationship between Dining Place, Iodine Source, and Iodine Nutrition in School-Age Children: A Cross-Sectional Study in China
-
Abstract:
Objective This study assesses the impact of iodine-rich processed foods and dining places on the iodine nutritional status of children. Methods School-aged children (SAC) in seven provinces in China were selected by school-based multi-stage sampling. Urinary iodine, salt iodine, and thyroid volume (TVOL) were determined. Questionnaires were used to investigate dining places and iodine-rich processed foods. The water iodine was from the 2017 national survey. Multi-factor regression analysis was used to find correlations between variables. Results Children ate 78.7% of their meals at home, 15.1% at school canteens, and 6.1% at other places. The percentage of daily iodine intake from water, iodized salt, iodine-rich processed foods, and cooked food were 1.0%, 79.2%, 1.5%, and 18.4%, respectively. The salt iodine was correlated with the urinary iodine and TVOL, respectively (r = 0.999 and −0.997, P < 0.05). The iodine intake in processed foods was weakly correlated with the TVOL (r = 0.080, P < 0.01). Non-iodized salt used in processed foods or diets when eating out had less effect on children's iodine nutrition status. Conclusion Iodized salt remains the primary source of daily iodine intake of SAC, and processed food has less effect on iodine nutrition. Therefore, for children, iodized salt should be a compulsory supplement in their routine diet. -
Key words:
- Dining place /
- Source of iodine /
- Iodine-rich processed foods /
- Urinary iodine
注释: -
Figure 1. The contribution of different iodine sources to the total iodine intake in children. Due to the possible influence of taking iodine oil pills, the data from Xinjiang were excluded, and the overall proportion was reanalyzed.
S1. Basic information of school-age children
Baseline characteristics n Gender Age BMI
(kg/m2, mean ± SD)Boys, n (%) Girls, n (%) 8, n (%) 9, n (5) 10, n (%) Region Xinjiang 804 403 (50.1) 401 (49.9) 227 (28.2) 337 (41.9) 233 (29.0) 16.0 ± 2.4 Sichuan 804 403 (50.1) 401 (49.9) 311 (38.7) 288 (35.8) 205 (25.5) 16.3 ± 2.7 Shanxi 822 417 (50.7) 405 (49.3) 153 (18.6) 302 (36.7) 327 (39.8) 17.2 ± 3.7 Liaoning 800 391 (48.9) 409 (51.1) 226 (28.3) 359 (44.9) 215 (26.9) 18.1 ± 3.7 Fujian 815 403 (49.4) 412 (50.6) 278 (34.1) 272 (33.4) 265 (32.5) 17.1 ± 3.2 Anhui 800 399 (49.9) 401 (50.1) 247 (30.9) 280 (35.0) 273 (34.1) 17.1 ± 3.4 Hubei 824 398 (48.3) 426 (51.7) 281 (34.1) 263 (31.9) 255 (30.9) 16.8 ± 3.2 Economical level High 2,806 1,394 (49.7) 1,412 (50.3) 848 (30.2) 1,072 (38.2) 864 (30.8) 17.4 ± 3.6 Low 2,864 1,420 (49.6) 1,444 (50.4) 876 (30.6) 1,029 (35.9) 909 (31.7) 16.7 ± 3.1 Geographical features Mountain 2,030 1,010 (49.8) 1,020 (50.2) 596 (29.4) 808 (39.8) 608 (30.0) 16.7 ± 3.1 Plain 1,825 910 (49.9) 915 (50.1) 542 (29.7) 680 (37.3) 549 (30.1) 16.8 ± 3.4 Coastal 800 398 (49.8) 402 (50.3) 265 (33.1) 264 (33.0) 271 (33.9) 17.7 ± 3.4 Inland 1,015 496 (48.9) 519 (51.1) 321 (31.6) 349 (34.4) 345 (34.0) 17.3 ± 3.5 Total 5,669 2,809 (49.6) 2,854 (50.4) 1,724 (30.4) 2,101 (37.1) 1,773 (31.3) 17.0 ± 3.3  下载: 导出CSV
Table 1. The proportion of children eating in different dining places and proportion of dining places for three meals a day
Region Dining iocation (%) Home/other
(x:1)Home/canteen
(x:1)Home Canteen Take-out Restaurant Street
foodSmall
tableCatering
pointProvinces Xinjiang 86.2 13.0 0.5 0.0 0.0 0.0 0.0 6.2 6.6 Sichuan 64.3 26.9 0.4 2.4 2.1 3.2 0.0 1.8 2.4 Shanxi 89.6 4.6 0.8 1.4 1.4 0.5 0.0 8.6 19.4 Liaoning 74.2 23.1 0.1 0.8 0.6 0.2 0.1 2.9 3.2 Fujian 92.0 2.3 0.2 1.6 1.7 0.8 1.1 11.5 27.2 Anhui 77.7 13.9 0.1 0.7 4.0 0.7 2.5 3.5 4.7 Hubei 67.2 22.0 0.2 1.2 8.4 0.2 0.1 2.1 3.0 3 meals Breakfast 85.0 5.2 0.1 1.1 6.8 0.4 0.0 — — Lunch 57.7 37.7 0.4 1.0 0.4 1.0 1.5 — — Dinner 93.4 2.4 0.4 1.5 0.7 1.0 0.1 — — Total 78.7 15.1 0.3 1.2 2.6 0.8 0.5 3.8 5.0
下载: 导出CSV
Table 2. Iodine intake from different sources
Factors MUIC (µg/L) Total iodine
intake (µg)Source of iodine Water Salt Processed foods iodine intake
(µg)Cooking food iodine intake (µg) MWIC (µg/L) Iodine Intake (µg) SIC (mg/kg) CRIS* (%) CRQIS† (%) Iodine Intake
(µg)Region Xinjiang 258.0
(179.1, 331.8)303.5
(210.9, 389.7)4.4
(2.1, 7.2)3.0
(0.9, 9.4)26.9 ± 4.0 100.0 92.9 295.4 ± 44.0 1.1
(0.5, 3.8)4.0
(−85.0, 92.6)Sichuan 249.9
(169.6, 360.8)294.0
(199.5, 424.5)1.9
(1.4, 3.3)1.3
(0.6, 4.1)27.2 ± 6.3 97.3 93.3 250.9 ± 58.3 4.9
(2.1, 11)36.9
(−84.1, 135.2)Shanxi 234.5
(129.2, 380.5)275.9
(152.0, 447.6)5.9
(3.6, 6.4)4.2
(2.0, 6.6)25.2 ± 4.9 98.5 93.3 203.9 ± 39.8 3.1
(1.3, 8.1)64.8
(−37.6, 283.8)Liaoning 204.0
(135.5, 286.4)240.0
(159.5, 336.9)9.4
(5.3, 13.2)6.6
(3.3, 9.4)23.7 ± 5.1 96.7 95.1 197.1 ± 42.4 2.6
(1.3, 7.0)33.8
(−45.4, 137.3)Fujian 213.7
(135.9, 310.2)251.4
(159.8, 364.9)3.2
(1.5, 3.6)2.3
(0.8, 4.4)21.7 ± 7.8 89.7 86.1 152.0 ± 54.4 6.1
(2.4, 12)91.0
(−21.2, 199.5)Anhui 247.2
(164.0, 328.1)290.8
(159.8, 364.9)2.1
(1.1, 3.1)1.5
(0.7, 3.8)23.1 ± 5.3 96.1 94.5 224.1 ± 51.2 5.5
(2.8, 9.0)59.7
(−58.9, 133.8)Hubei 251.7
(174.9, 350.0)296.1
(205.8, 411.8)2.6
(1.6, 3.0)1.8
(1.1, 2.8)25.9 ± 4.1 99.9 93.1 230.6 ± 36.4 6.7
(2.8, 17.1)57.0
(−52.8, 148.1)Economical level High 228.6
(150.5, 318.2)268.8
(177.0, 268.8)3.9
(1.9, 5.8)2.7
(1.3, 4.1)24.1 ± 6.6 95.0 90.8 234.2 ± 120.6 4.3
(1.5, 11.5)21.8
(−76.1, 141.9)Low 244.8
(159.7, 346.4)287.7
(187.1, 407.5)3.2
(1.6, 6.9)2.3
(1.1, 4.8)25.6 ± 4.8 98.7 94.4 244.8 ± 63.3 4.2
(1.7, 8.0)33.2
(−67.9, 153.2)Geographical features Mountain 247.1
(167.5, 331.3)290.5
(196.7, 389.5)1.8
(1.2, 3.6)1.3
(3.2, 4.2)26.7 ± 4.9 99.3 93.0 274.7 ± 91.5 4.0
(1.5, 7.9)2.2
(−93.6, 114.6)Plain 250.1
(163.0, 366.4)298.3
(200.0, 442.6)4.2
(2.5, 7.8)2.7
(1.9, 4.8)24.6 ± 5.3 97.5 93.8 253.1 ± 108.3 4.2
(1.3, 11.8)33.5
(−72.6, 175.5)Coastal 207.8
(131.5, 297.1)244.5
(154.7, 349.6)5.2
(4.6, 6.0)3.7
(3.2, 4.2)21.2 ± 8.0 88.2 84.7 165.2 ± 62.1 5.7
(1.8, 11.9)58.1
(−29.0, 179.2)inland 211.4
(138.6, 295.4)245.2
(159.1, 352.4)3.1
(1.7, 6.1)5.2
(1.1, 9.2)23.6 ± 5.1 98.0 96.3 203.4 ± 48.8 4.8
(1.9, 8.7)34.2
(−59.5, 148.4)Total 236.6
(155.6, 344.2)278.4
(183.0, 393.2)3.8
(7, 6.4)2.7
(1.1, 4.7)24.8 ± 5.8 96.9 92.6 220.5 ± 62.9 4.1
(1.5, 8.7)51.1
(−55.9.158.3)Excluding Xinjiang 232.6
(151.2, 335.0)273.7
(177.9, 394.1)3.8
(1.7, 6.3)2.7
(1.1, 4.4)24.5 ± 6.0 − − 209.1 ± 57.0 4.8
(1.9, 9.7)57.1
(−50.8, 169.5)Note. Results were presented as $ \stackrel{-}{x} $ ± s for normal distribution data and median (25th–75th) for skewed distribution data. MUIC, median urine iodine concentration; MWIC, median water iodine; SIC, salt iodine; CRIS, coverage rate of iodized salt, CRQIS, consumption rate of qualified iodized salt; *CRIS = number of salt samples with iodine content ≥ 5 mg/kg / number of samples tested ×100%; †CRQIS = number of salt sample with qualified iodine content / number of samples tested ×100%
下载: 导出CSV
Table 3. Iodine nutrition status, TVOL, and GR of SAC
Factors Urine (n = 5, 664) Thyroid (n = 5, 659) n MUIC
(P25, P75,
µg/L)P value n TVOL
(P25, P75,
mL)TGR
(%)P value 8 9 10 n TVOL
(P25, P75, mL)TGR
(%)n TVOL
(P25, P75, mL)TGR
(%)n TVOL
(P25, P75, mL)TGR
(%)Region Xinjiang 804 258.0
(179.1, 331.8)0.001 803 2.0
(1.6, 2.6)0.5 0.001 227 1.8
(1.5, 2.2)0.4 337 2.1
(1.6, 2.6)0.6 233 2.3
(1.8, 3.0)0.4 Sichuan 805 249.9
(169.6, 360.8)805 3.3
(2.7, 3.9)4.5 312 3.0
(2.5, 3.6)4.8 288 3.4
(2.8, 4.0)3.8 205 3.7
(3.0, 4.3)4.9 Shanxi 819 234.5
(129.2, 380.5)813 3.0
(2.4, 3.8)3.1 151 2.6
(2.2, 3.4)4.0 304 2.8
(2.3, 3.6)3.6 326 3.3
(2.6, 4.0)2.1 Liaoning 800 204.0
(135.5, 286.4)800 3.0
(2.3, 3.6)2.8 226 2.8
(2.2, 3.3)2.7 369 2.9
(2.3, 3.5)3.1 215 3.3
(2.6, 4.0)2.3 Fujian 814 213.7
(135.9, 310.2)814 2.8
(2.3, 3.3)2.0 278 2.4
(2.1, 3.0)2.2 272 2.9
(2.4, 3.3)2.2 265 3.0
(2.6, 3.8)1.5 Anhui 798 247.2
(164.0, 328.1)800 2.8
(2.3, 3.5)2.8 247 2.5
(2.1, 3.0)2.8 280 2.9
(2.3, 3.6)4.3 273 3.1
(2.6, 3.8)1.1 Hubei 824 251.7
(174.9, 350.0)824 2.3
(1.8, 2.9)1.5 281 2.0
(1.6, 2.4)1.1 263 2.3
(1.9, 3.0)1.9 255 2.6
(2.0, 3.2)1.6 Gender Boys 2,801 241.1
(158.6, 337.1)0.001 2,811 2.8
(2.2, 3.4)2.0 0.001 869 2.5
(2.0, 3.1)2.4 1,020 2.8
(2.2, 3.4)2.1 887 3.0
(2.4, 3.7)1.7 Girls 2,842 216.1
(139.8, 316.7)2,850 2.7
(2.1, 3.5)2.8 855 2.4
(1.9, 3.1)2.9 1,081 2.7
(2.1, 3.4)3.4 886 3.1
(2.4, 3.8)2.1 Geographic area Urban 1,968 232.0
(155.8, 331.4)0.819 1,968 2.8
(2.2, 3.5)2.7% 0.349 590 2.5
(2.0, 3.1)3.4% 776 2.8
(2.2, 3.4)2.7% 582 3.1
(2.4, 3.9)2.1% Rural 3,965 240.1
(155.5, 335.4)3,699 2.8
(2.2, 3.6)7.0% 1132 2.5
(2.0, 3.2)8.9% 1,325 2.8
(2.1, 3.5)6.0% 1,191 3.1
(2.4, 4.0)6.0% Economical level High 2,806 228.6
(150.5, 318.2)0.001 2,796 2.9
(2.3, 3.5)3.1 0.001 846 2.6
(2, 0, 3.2)3.4 1,065 2.8
(2.2, 3.4)3.4 863 3.2
(2.6, 3.9)2.4 Low 2,858 244.8
(159.7, 346.4)2,863 2.6
(2.1, 3.3)1.8 875 2.4
(1.9, 3.0)1.7 1,030 2.6
(2.1, 3.4)2.1 909 2.9
(2.2, 3.7)1.4 Geographical features Mountain 2,026 247.1
(167.5, 331.3)0.001 2,026 2.6
(2.0, 3.3)1.7 0.001 594 2.4
(1.8, 2.9)1.7 807 2.5
(2.0, 3.2)2.1 607 2.8
(2.2, 3.6)1.3 Plain 2,024 250.1
(163.0, 366.4)2,019 2.8
(2.2, 3.6)3.2 623 2.5
(2.0, 3.2)3.5 657 2.9
(2.1, 3.6)3.6 799 3.2
(2.5, 3.8)2.5 Coastal 800 207.8
(131.5, 297.1)800 3.0
(2.4, 3.7)3.1 265 2.7
(2.1, 3.4)2.6 264 3.0
(2.5, 3.6)4.2 271 3.3
(2.8, 4.1)2.6 inland 814 211.4
(138.6, 295.4)814 2.7
(2.3, 3.3)1.6 239 2.5
(2.0, 2.9)2.1 367 2.8
(2.3, 3.4)1.6 209 3.0
(2.4, 3.7)1.0 Total 5,664 236.6
(155.6, 344.2)5,659 2.7
(2.2, 3.4)2.4 1,722 2.5
(2.0, 3.1)2.6 2,103 2.7
(2.2, 3.4)2.8 1,722 3.0
(2.4, 3.8)1.9 Note. Wilcoxon test was used to compare UIC and TVOL between genders, geographic area and economical level. Kruskal–Wallis test was used to compare UIC and TVOL among region and geographical features. P < 0.05 was considered statistically significant. MUIC, median of urine iodine concentration; TVOL, thyroid volume; TGR, thyroid goiter rate.
下载: 导出CSV
Table 4. The influence of iodine intake from different source on iodine nutrition status and thyroid disease
Iodine resource UIC (µg/L) TVOL (mL) TGR (%) Nodular detection rate (%) r P value r P value r P value r P value WIC −0.151 0.443 0.066 0.740 0.137 0.486 0.036 0.859 SIC 0.999* < 0.001 −0.933* 0.021 −0.272 0.162 − − Processed food iodine 0.001 0.940 0.080* < 0.001 0.074 0.720 −0.288 0.163 Cooking food iodine 0.205 0.296 0.197 0.315 −0.279 0.150 0.135 0.503 Note. UIC, urine iodine concentration; TVOL, thyroid volume; TGR, thyroid goiter rate; WIC, water iodine concentration; SIC, salt iodine concentration; *Correlation analysis was used to describe correlations between different variables. P < 0.05 was considered significant.
下载: 导出CSV
S2. Effect of iodine source on iodine nutritional status of SAC
Indicators
Iodine intakeUIC (µg/L) TVOL (mL) β t P value β t P value Genders Boys WIC 0.069 0.848 0.405 0.032 0.157 0.876 SIC 0.752 8.528 < 0.001 −0.025 −0.114 0.911 Processed food iodine 0.046 0.573 0.572 0.172 0.862 0.397 Cooking food iodine 0.903 10.249 < 0.001 0.236 1.087 0.288 Girls WIC −0.009 −0.096 0.924 −0.038 −0.217 0.830 SIC 0.774 7.470 < 0.001 −0.428 −2.208 0.037 Processed food iodine 0.071 0.763 0.453 0.083 0.476 0.638 Cooking food iodine 0.917 8.796 < 0.001 0.221 1.134 0.269 Geographic area Urban WIC −0.360 −1.044 0.317 0.095 0.278 0.786 SIC 0.854 2.344 0.037 −0.588 −1.626 0.130 Processed food iodine 0.696 1.588 0.138 0.124 0.284 0.781 Cooking food iodine 0.277 0.893 0.389 −0.083 −0.271 0.791 Rural WIC −0.004 −0.042 0.967 0.013 0.060 0.953 SIC 0.727 7.384 < 0.001 −0.479 −2.123 0.050 Processed food iodine 0.040 0.431 0.672 0.114 0.538 0.598 Cooking food iodine 0.922 9.107 < 0.001 0.139 0.599 0.557 Ages (years) 8 WIC 0.152 1.302 0.206 −0.134 −0.717 0.480 SIC 0.729 5.905 < 0.001 −0.454 −2.302 0.031 Processed food iodine 0.005 0.040 0.968 0.118 0.643 0.526 Cooking food iodine 0.719 5.816 < 0.001 0.056 0.282 0.781 9 WIC 0.040 0.335 0.741 0.043 0.248 0.806 SIC 0.727 5.483 < 0.001 −0.411 −2.175 0.040 Processed food iodine 0.140 1.180 0.250 0.114 0.673 0.507 Cooking food iodine 0.845 6.395 < 0.001 0.278 1.477 0.153 10 WIC 0.020 0.179 0.860 −0.087 −0.488 0.630 SIC 0.803 6.330 < 0.001 −0.435 −2.108 0.047 Processed food iodine 0.278 2.416 0.024 0.101 0.538 0.596 Cooking food iodine 0.899 7.171 < 0.001 0.168 0.824 0.419 Total WIC 0.037 0.461 0.649 −0.039 −0.225 0.824 SIC 0.782 8.992 < 0.001 −0.432 −2.265 0.033 Processed food iodine 0.064 0.811 0.425 0.103 0.593 0.559 Cooking food iodine 0.927 10.635 < 0.001 0.224 1.172 0.253 Note. UIC, urine iodine concentration; TVOL, thyroid volume; WIC, water iodine concentration; SIC, salt iodine concentration.
下载: 导出CSV
S3. Effect of iodine source on thyroid disease of SAC
Indicators Iodine intake† TGR Nodular detection rate (%) β OR 95% CI P value β OR 95% CI P value Genders Boys WIC 0.004 1.004 0.994 1.014 0.479 −0.021 0.979 0.965 0.994 0.005 SIC −0.001 0.999 0.995 1.002 0.484 0.001 1.001 1.000 1.002 0.184 Processed food iodine 0.008 1.008 0.919 1.106 0.866 0.037 1.038 0.992 1.085 0.105 Cooking food iodine 0.001 1.001 1.000 1.002 0.173 0.000 1.000 0.999 1.000 0.447 Girls WIC −0.003 0.997 0.985 1.010 0.656 −0.014 0.986 0.975 0.997 0.016 SIC −0.005 0.995 0.992 0.998 0.001 0.000 1.000 0.999 1.002 0.523 Processed food iodine −0.046 0.955 0.876 1.042 0.299 0.064 1.066 1.023 1.110 0.002 Cooking food iodine −0.001 0.999 0.998 1.001 0.275 0.000 1.000 0.999 1.001 0.902 Geographic area Urban WIC 0.003 1.003 0.990 1.015 0.670 −0.014 0.986 0.975 0.997 0.016 SIC −0.003 0.997 0.993 1.001 0.185 0.000 1.000 0.999 1.002 0.523 Processed food iodine −0.101 0.904 0.802 1.019 0.100 0.064 1.066 1.023 1.110 0.002 Cooking food iodine 0.000 1.000 0.998 1.001 0.840 0.000 1.000 0.999 1.001 0.902 Rural WIC 0.000 1.000 0.990 1.010 0.987 −0.023 0.977 0.965 0.990 < 0.001 SIC −0.003 0.997 0.994 1.000 0.023 0.001 1.001 1.000 1.002 0.113 Processed food iodine 0.018 1.018 0.942 1.101 0.648 −0.002 0.998 0.958 1.040 0.923 Cooking food iodine 0.000 1.000 0.999 1.001 0.996 0.000 1.000 1.000 1.001 0.889 Ages (years) 8 WIC −0.001 0.999 0.983 1.015 0.906 −0.028 0.972 0.951 0.994 0.012 SIC −0.002 0.998 0.994 1.002 0.262 0.001 1.001 0.999 1.002 0.409 Processed food iodine −0.011 0.989 0.885 1.106 0.847 0.045 1.046 0.986 1.109 0.139 Cooking food iodine 0.001 1.001 0.999 1.002 0.314 0.000 1.000 0.999 1.001 0.941 9 WIC 0.003 1.003 0.994 1.012 0.534 −0.014 0.986 0.972 0.999 0.038 SIC −0.003 0.997 0.993 1.001 0.115 0.001 1.001 1.000 1.002 0.211 Processed food iodine −0.035 0.966 0.881 1.059 0.455 0.070 1.072 1.027 1.120 0.002 Cooking food iodine 0.000 1.000 0.998 1.001 0.774 0.000 1.000 0.999 1.001 0.671 10 WIC −0.006 0.994 0.971 1.018 0.640 −0.012 0.988 0.974 1.002 0.083 SIC −0.005 0.995 0.991 0.999 0.022 0.000 1.000 0.999 1.002 0.733 Processed food iodine 0.003 1.003 0.876 1.148 0.964 0.024 1.024 0.965 1.088 0.431 Cooking food iodine 0.000 1.000 0.998 1.001 0.731 −0.001 0.999 0.999 1.000 0.258 Total WIC 0.001 1.001 0.993 1.009 0.896 −0.017 0.983 0.974 0.992 < 0.001 SIC −0.003 0.997 0.994 0.999 0.004 0.001 1.001 1.000 1.001 0.185 Processed food iodine −0.020 0.980 0.920 1.044 0.535 0.051 1.053 1.022 1.085 0.001 Cooking food iodine 0.000 1.000 0.999 1.001 0.996 0.000 1.000 0.999 1.000 0.461 Note. TGR, thyroid goiter rate; WIC, water iodine concentration; SIC, salt iodine concentration.
下载: 导出CSV
S4. Effects of using non-iodized salt for processed foods or eating out on urinary iodine in children
Indicators Iodized salt
for processed
foodsProposed
non-iodized
salt for
processed
foodsz P Iodized salt
for dining outProposed
non-iodized
salt for dining
outz P Total
iodine
intakeMUIC Total
iodine
intakeMUIC Total
iodine
intakeMUIC Total
iodine
intakeMUIC Region Xinjiang 303.5 258.0 301.4 256.2 −23.935 < 0.001 303.5 258.0 250.6 213.0 −14.374 < 0.001 Sichuan 294.0 249.9 284.2 241.2 −24.579 < 0.001 294.0 249.9 175.2 148.9 −24.318 < 0.001 Shanxi 275.9 234.5 268.8 226 −24.791 < 0.001 274.9 234.5 236.3 200.9 −16.328 < 0.001 Liaoning 240.0 204.0 232.8 197.2 −24.090 < 0.001 240.0 204.0 176.9 150.4 −24.407 < 0.001 Fujian 251.4 213.7 239.5 203.9 −24.716 < 0.001 250.9 213.7 226.7 192.7 −13.0 < 0.001 Anhui 290.8 247.2 283.6 241.3 −24.457 < 0.001 290.5 247.2 213.7 181.7 −21.986 < 0.001 Hubei 296.1 251.7 273.8 234.4 −24.822 < 0.001 296.2 251.7 187.2 159.1 −23.757 < 0.001 Genders Boys 290.8 247.2 282.9 240.5 −45.576 < 0.001 290.7 247.2 215.5 183.2 −40.677 < 0.001 Girls 263.9 224.3 253.9 215.8 −46.018 < 0.001 263.5 224.3 200.6 170.5 −40.790 < 0.001 Age (years) 8 263.6 224.0 253.7 215.6 −35.586 < 0.001 263.1 224.0 196.7 167.2 −31.716 < 0.001 9 277.7 236.1 268.3 228.1 −39.454 < 0.001 277.6 236.1 213.6 181.6 −34.836 < 0.001 10 288.8 245.5 278.6 236.8 −36.306 < 0.001 288.7 245.5 210.0 178.5 −32.317 < 0.001 Geographic area Urban 273.1 232.2 263.2 223.7 −38.267 < 0.001 273.1 232.2 216.9 184.4 −33.135 < 0.001 Rural 282.5 240.1 271.7 230.9 −52.253 < 0.001 281.8 240.1 202.7 172.3 −47.121 < 0.001 Economical level High 268.9 228.6 255.1 216.8 −45.535 < 0.001 268.9 228.6 207.9 176.7 −39.588 < 0.001 Low 288.0 244.8 281.3 239.1 −46.059 < 0.001 287.7 244.8 209.9 178.4 −41.854 < 0.001 Geographical features Mountain 290.8 247.1 283.0 240.6 −38.919 < 0.001 290.5 247.1 205.4 174.6 −34.095 < 0.001 Plain 298.5 253.7 287.0 243.9 −36.604 < 0.001 298.4 253.7 221.9 188.6 −33.398 < 0.001 Coastal 244.5 207.8 233.0 198.1 −24.090 < 0.001 244.5 207.8 194.7 165.5 −22.075 < 0.001 Inland 245.3 208.5 240.1 204.1 −27.584 < 0.001 245.2 208.5 204.5 173.5 −22.621 < 0.001 Total 278.4 236.6 268.0 228.4 −64764 < 0.001 278.2 236.6 209.2 177.8 −57.606 < 0.001 Note. MUIC, median of urine iodine concentration.
下载: 导出CSV
-
[1] Cui SL, Liu P, Su XH, et al. Surveys in areas of high risk of iodine deficiency and iodine excess in China, 2012-2014: current status and examination of the relationship between urinary iodine concentration and goiter prevalence in children aged 8-10 years. Biomed Environ Sci, 2017; 30, 88−96. [2] Hetzel BS. Iodine deficiency disorders (IDD) and their eradication. Lancet, 1983; 2, 1126−9. [3] UNICEF. Global database, based on Multiple Indicator Cluster Surveys (MICS), Demographic and Health Surveys (DHS) and other nationally representative household surveys, 2013-2018. Percentage of households consuming salt with any iodine, 2018-2019. https://data.unicef.org/topic/nutrition/iodine/. [2021-12-11]. [4] Endemic Disease Control Center of the Chinese Center for Disease Control and Prevention. 2019 national iodine deficiency disorders monitoring report. 2019. (In Chinese) [5] Murray CW, Egan SK, Kim H, et al. US food and drug Administration's Total Diet Study: dietary intake of perchlorate and iodine. J Expo Sci Environ Epidemiol, 2008; 18, 571−80. doi: 10.1038/sj.jes.7500648 [6] Zava TT, Zava DT. Assessment of Japanese iodine intake based on seaweed consumption in Japan: a literature-based analysis. Thyroid Res, 2011; 4, 14. doi: 10.1186/1756-6614-4-14 [7] Perrine CG, Sullivan KM, Flores R, et al. Intakes of dairy products and dietary supplements are positively associated with iodine status among U. S. children. J Nutr, 2013; 143, 1155−60. doi: 10.3945/jn.113.176289 [8] Clifton VL, Hodyl NA, Fogarty PA, et al. The impact of iodine supplementation and bread fortification on urinary iodine concentrations in a mildly iodine deficient population of pregnant women in South Australia. Nutr J, 2013; 12, 32. doi: 10.1186/1475-2891-12-32 [9] SzymLek-Gay EA, Gray AR, Heath ALM, et al. Iodine-fortified toddler milk improves dietary iodine intakes and iodine status in toddlers: a randomised controlled trial. Eur J Nutr, 2020; 59, 909−19. doi: 10.1007/s00394-019-01950-5 [10] Nga TT, Winichagoon P, Dijkhuizen MA, et al. Multi-micronutrient-fortified biscuits decreased prevalence of anemia and improved micronutrient status and effectiveness of deworming in rural Vietnamese school children. J Nutr, 2009; 139, 1013−21. doi: 10.3945/jn.108.099754 [11] IGN. Program guidance on the use of iodized salt in industrially processed foods.https://www.ign.org/program-guidance-on-the-use-of-iodized-salt-in-industrially-processed-foods.htm. [12] Seguin RA, Aggarwal A, Vermeylen F, et al. Consumption frequency of foods away from home linked with higher body mass index and lower fruit and vegetable intake among adults: a cross-sectional study. J Environ Public Health, 2016; 2016, 3074241. [13] Bezerra IN, Curioni C, Sichieri R. Association between eating out of home and body weight. Nutr Rev, 2012; 70, 65−79. doi: 10.1111/j.1753-4887.2011.00459.x [14] Kant AK, Whitley MI, Graubard BI. Away from home meals: associations with biomarkers of chronic disease and dietary intake in American adults, NHANES 2005-2010. Int J Obes (Lond), 2015; 39, 820−7. doi: 10.1038/ijo.2014.183 [15] Zhang XF, Du WW, Zhang JG, et al. Association between the frequencies of eating out and overweight/obesity among dinners in restaurants aged 18-65 years in 6 Provinces of China. Chin Health Educ, 2020; 36, 779−83,92. (In Chinese [16] Penney TL, Almiron-Roig E, Shearer C, et al. Modifying the food environment for childhood obesity prevention: challenges and opportunities. Proc Nutr Soc, 2014; 73, 226−36. doi: 10.1017/S0029665113003819 [17] Powell LM, Nguyen BT. Fast-food and full-service restaurant consumption among children and adolescents: effect on energy, beverage, and nutrient intake. JAMA Pediatr, 2013; 167, 14−20. doi: 10.1001/jamapediatrics.2013.417 [18] Burke SJ, McCarthy SN, O'Neill JL, et al. An examination of the influence of eating location on the diets of Irish children. Public Health Nutr, 2007; 10, 599−607. doi: 10.1017/S1368980007258379 [19] Stig A, Jesper K, Klaus M, et al. Reliability of studies of iodine intake and recommendations for number of samples in groups and in individuals. Br J Nutr, 2008; 99, 813−8. doi: 10.1017/S0007114507842292 [20] Endemic Disease Control Center of the Chinese Center for Disease Control and Prevention. 2017 national survey results of water iodine content in drinking Water. 2017. (In Chinese) [21] Pan XB. Consumption of plain water and association with new-onset overweight risk among Chinese. Hebei Medical University. 2019. (In Chinese) [22] Endemic Disease Control Center of the Chinese Center for Disease Control and Prevention. 2011 national iodine deficiency disease condition surveillance report. 2011. (In Chinese) [23] Yang YX. China food composition tables standard edition. 6th ed. Peking University Press. 2018. (In Chinese) [24] Endemic Disease Control Center of the Chinese Center for Disease Control and Prevention. Prevention of iodine deficiency diseases manual. People's Medical Publishing House. 2007. [25] Zhang XL, Dai XD, Sun HJ, et al. Investigation on the iodine loss rate of iodine salt in cooking state. Chin J Chem Educ, 2008; 2, 61−2. (In Chinese [26] Zimmermann MB, Aeberli I, Andersson M, et al. Thyroglobulin is a sensitive measure of both deficient and excess iodine intakes in children and indicates no adverse effects on thyroid function in the UIC range of 100-299 μg/L: a UNICEF/ICCIDD study group report. J Clin Endocrinol Metab, 2013; 98, 1271−80. doi: 10.1210/jc.2012-3952 [27] State General Administration of Quality Supervision, Inspection and Quarantine, China National Standardization Administration. GB/T13025.7-2012 General test method in salt industry—Determination of iodine. Standards Press of China. 2012. (In Chinese) [28] Liu SJ, Chen ZH, Jia QZ, et al. WS276-2007 Diagnostic criteria for endemic goiter. People's Medical Publishing House. 2007 (In Chinese) [29] Tyrrell RL, Greenhalgh F, Hodgson S, et al. Food environments of young people: linking individual behaviour to environmental context. J Public Health (Oxf), 2018; 39, 95−104. [30] Ziauddeen N, Page P, Penney TL, et al. Eating at food outlets and leisure places and "on the go" is associated with less-healthy food choices than eating at home and in school in children: cross-sectional data from the UK National Diet and Nutrition Survey Rolling Program (2008-2014). Am J Clin Nutr, 2018; 107, 992−1003. doi: 10.1093/ajcn/nqy057 [31] Liu XB, Wang J, Li YJ, et al. Suggested Sample Size of 24-hour Urine Collection in Assessing Iodine Status among Adult Males with Insufficient Iodine Intake. Biomed Environ Sci, 2021; 34, 324−9. [32] Ministry of Health, National Standardization Management Committee. GB16006-2008 Criteria for elimination of iodine deficiency disorders. Standards Press of China. 2008. (In Chinese) [33] Endemic Disease Control Center of the Chinese Center for Disease Control and Prevention. 2019 national iodine deficiency disease condition surveillance report. 2019. (In Chinese) [34] Yu J, Liu P, Shen HM, et al. The inhabitant's iodine nutrition status of some coastal areas in China: a cross-sectional study. Chin J Endemiol, 2011; 30, 594−7. (In Chinese [35] Pearce EN, Pino S, He XM, et al. Sources of dietary iodine: bread, cows' milk, and infant formula in the Boston area. J Clin Endocrinol Metab, 2004; 89, 3421−4. doi: 10.1210/jc.2003-032002 [36] Thomson BM, Vannoort RW, Haslemore RM. Dietary exposure and trends of exposure to nutrient elements iodine, iron, selenium and sodium from the 2003-4 New Zealand Total Diet Survey. Br J Nutr, 2008; 99, 614−25. doi: 10.1017/S0007114507812001 [37] Abizari AR, Dold S, Kupka R, et al. More than two-thirds of dietary iodine in children in northern Ghana is obtained from bouillon cubes containing iodized salt. Public Health Nutr, 2017; 20, 1107−13. doi: 10.1017/S1368980016003098 [38] van der Reijden OL, Zimmermann MB, Galetti V. Iodine in dairy milk: Sources, concentrations and importance to human health. Best Pract Res Clin Endocrinol Metab, 2017; 31, 385−95. doi: 10.1016/j.beem.2017.10.004 [39] Brown IJ, Tzoulaki I, Candeias V, et al. Salt intakes around the world: implications for public health. Int J Epidemiol, 2009; 38, 791−813. doi: 10.1093/ije/dyp139 [40] Chotivichien S, Chongchaithet N, Aksornchu P, et al. Assessment of the contribution of industrially processed foods to salt and iodine intake in Thailand. PLoS One, 2021; 16, e0253590. doi: 10.1371/journal.pone.0253590 [41] World Health Organization. Guideline: fortification of food-grade salt with iodine for the prevention and control of iodine deficiency disorders. World Health Organization. 2014. [42] WHO, UNICEF, ICCIDD. Assessment of iodine deficiency disorders and monitoring their elimination: a guide for programme managers. 2nd ed. WHO. 2017. [43] Tan HX, luo X, Liu YY, et al. Detection and correlation between the content of sodium and iodine in pre-packaged foods. J Hyg Res, 2020; 49, 1002−7. (In Chinese [44] Chao H, Zhang YF, Liu P, et al. Relationship between iodine content in household iodized salt and thyroid volume distribution in children. Biomed Environ Sci, 2016; 29, 391−7. [45] Blankenship JL, Garrett GS, Khan NA, et al. Effect of iodized salt on organoleptic properties of processed foods: a systematic review. J Food Sci Technol, 2018; 55, 3341−52. doi: 10.1007/s13197-018-3277-9 [46] Knowles J, Van Der Haar F, Shehata M, et al. Iodine Intake through processed Food: Case Studies from Egypt, Indonesia, the philippines, the Russian federation and Ukraine, 2010-2015. Nutrients, 2017; 9, 797. doi: 10.3390/nu9080797 [47] Tabacchi G, Filippi AR, Amodio E, et al. A meta-analysis of the validity of FFQ targeted to adolescents. Public Health Nutr, 2016; 19, 1168−83. doi: 10.1017/S1368980015002505 [48] Casas R. Moving towards a healthier dietary pattern free of ultra-processed foods. Nutrients, 2021; 14, 118. doi: 10.3390/nu14010118 [49] Dicken SJ, Batterham RL. The role of diet quality in mediating the association between ultra-processed food intake, obesity and health-related outcomes: a review of prospective cohort studies. Nutrients, 2021; 14, 23. doi: 10.3390/nu14010023 [50] Yan YQ, Chen ZP. Discussion and suggestions on several problems in the application of standardized urinary iodine determination methods. Chin J Endemiol, 1999; 18, 60−2. (In Chinese [51] Perrine CG, Cogswell ME, Swanson CA, et al. Comparison of population iodine estimates from 24-hour urine and timed-spot urine samples. Thyroid, 2014; 24, 748−57. doi: 10.1089/thy.2013.0404 -
 22071Supplementary Materials.pdf

-

 点击查看大图
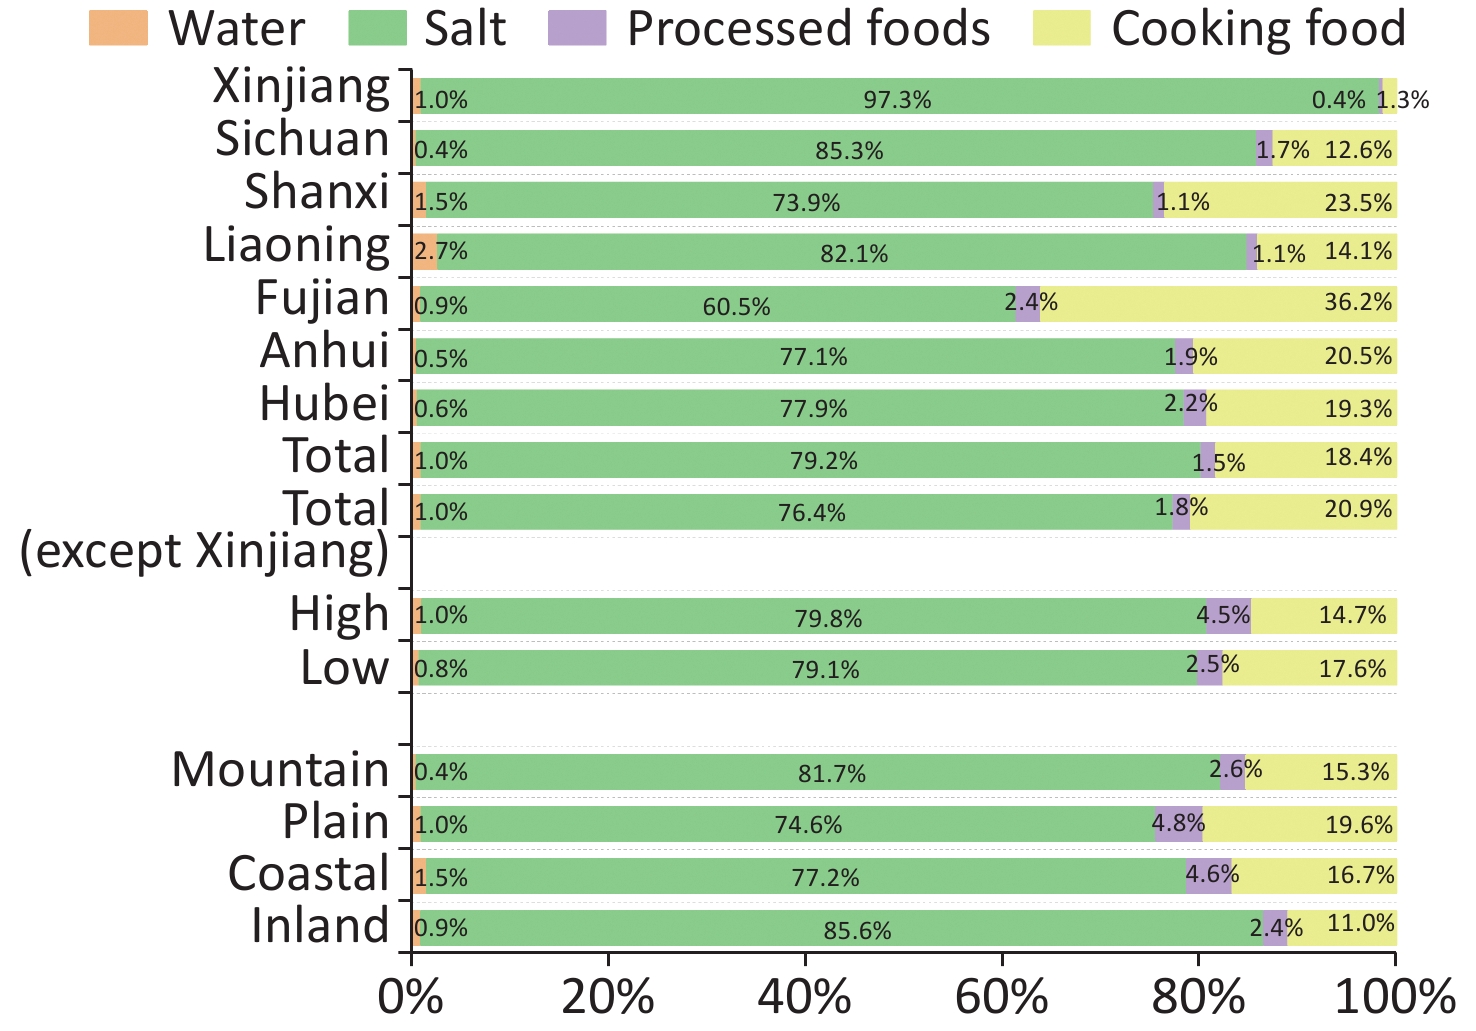
计量
- 文章访问数: 639
- HTML全文浏览量: 241
- PDF下载量: 141
- 被引次数: 0

 Quick Links