

 下载:
下载:


-
Gua Sha is an ancient Chinese traditional remedy that has been used for about 2,000 years and is still quite popular in Asia and worldwide among practitioners of traditional medicine to treat colds, fever, flu, heat stroke, respiratory and digestive problems, chronic pain, and other health issues[1–8]. This safe, inexpensive, and simple technique, also known as scraping, consists of repeated stroking of lubricated skin with a soft-edged instrument to induce the appearance of transient subcutaneous petechiae caused by extravasation of blood, which typically resolves within several days[4].
In addition to the longstanding support for its effectiveness rooted in the extensive empirical knowledge dating back to ancient times, the effectiveness of Gua Sha has also been demonstrated using randomized controlled trials in numerous studies. For example, several studies from China and the West reported that this technique had beneficial effects on chronic neck and lower back pain with no adverse effects[9–12]. Furthermore, in a randomized controlled trial of 119 subjects, Gua Sha was more effective than standard procedures in reducing multiple symptoms of diabetic peripheral neuropathy while showing no adverse effects[13]. A meta-analysis of five randomized controlled trials strongly supported that co-therapy with Gua Sha and modern medicine had a significant positive effect on perimenopausal syndrome, reflected by the changes in the Kupperman Menopausal Index Score, serum levels of follicle-stimulating hormone, and other criteria[14].
However, despite the very long history and proven effectiveness of this technique, little is known about the molecular mechanisms underlying the effects of Gua Sha on the human body. Several studies on humans or model animals have shown that the healing effects of Gua Sha could be mediated by an increase in immune response and decrease in inflammation, based on measuring changes in the levels of pro-inflammatory and immunosuppressive cytokines[6,15,16]. However, to our knowledge, no genome-level work has been conducted to study any changes that occur in response to Gua Sha in the transcriptome or other types of molecules. This contrasts with other traditional Chinese medicine techniques, such as acupuncture and moxibustion, which have been found to be effective for various health issues[17–21], and have also received some attention from modern genomic methods[22–26]. Therefore, in this study, we performed a proof-of-principle study to investigate whether Gua Sha can induce transcriptome changes that could be directly associated with this technique. Indeed, we could identify very subtle, yet consistent transcriptome changes affecting the expression of three histone genes that could have implications for the immune response and inflammation.
-
Nine female volunteers between 20 and 26 years of age were recruited. All volunteers were in good health, were not treated during their menstrual period, and were not taking any medications. Each volunteer was given Gua Sha treatment on her back by the same physician, a Gua Sha expert from a traditional Chinese medicine hospital who had been performing this procedure for multiple years (see Authors′ Contributions section), with a smooth-edged Gua Sha instrument on the same day. Gua Sha treatment lasted for approximately 18 min and was terminated after the appearance of red petechiae on the skin.
-
Peripheral blood samples from each volunteer were drawn by an experienced nurse immediately before and 3 h after the Gua Sha treatment (Supplementary Table S1, available in www.besjournal.com) into Tempus Blood RNA Tubes (Thermo Fisher Scientific) containing reagents that immediately lysed blood cells and inactivated RNase, thus stabilizing the RNA. Blood samples were stored at −80 °C before RNA extraction. All volunteers provided informed consent and the experiments were approved by the ethics review board of the School of Medicine, Huaqiao University.
Table S1. Information of the samples
Sample id Participant age Information Participant id 831 21 before guasha 1 832 21 after guasha 1 833 21 before guasha 2 834 21 after guasha 2 835 21 before guasha 3 836 21 after guasha 3 837 20 before guasha 4 838 20 after guasha 4 839 21 before guasha 5 840 21 after guasha 5 841 25 before guasha 6 842 25 after guasha 6 843 26 before guasha 7 844 26 after guasha 7 845 21 before guasha 8 846 21 after guasha 8 847 20 before guasha 9 848 20 after guasha 9 -
Total RNA was isolated using the Tempus Spin RNA Isolation Kit (Thermo Fisher Scientific), following the manufacturer′s instructions. The RNA-seq libraries were constructed by Novogene Corporation (Beijing) after removing globin mRNA and rRNA from the total RNA preparations using the Globin-Zero Gold rRNA Removal Kit, followed by the strand-specific lncRNA-seq protocol. As a result, RNA-seq analysis included both polyA+ and polyA− RNA species. Libraries were then sequenced by the Novogene Corporation (Beijing) using the Illumina Hiseq X Ten platform with paired-end 150 bp (PE150) strategy on a 10 gigabase (GB) scale.
-
The expression levels of genes were estimated based on the RNA-seq data using Salmon software[27] for the reference human transcriptome (GRCh38) from the Ensembl database[28] and 2,721 vlincRNA (very long intergenic non-coding RNA) transcripts taken from previous publications[29,30], as described previously[31].
Two-tier principal component analysis (PCA) was performed for all 18 samples using the prcomp function in the R environment[32]. Genes with very low expression levels (mean of the raw read counts across all 18 samples ≤ 1) were excluded from the analysis. The first tier of PCA (Figure 1A–C) was based on the variance stabilizing transformation[33] (using the vst function from the DESeq2 package[34] in the R environment[32]) of the raw read counts of the 23,768 remaining genes. The second tier of PCA (Figure 1D–F) was performed on the same data after an additional processing step: the variance between individuals was removed as a “batch effect” prior to the analysis using the removeBatchEffect function of the limma package[35] in the R environment[32]. Two tiers of uniform manifold approximation and projection (UMAP) analysis[36] were also performed based on the same data using the same pipeline as the PCA.
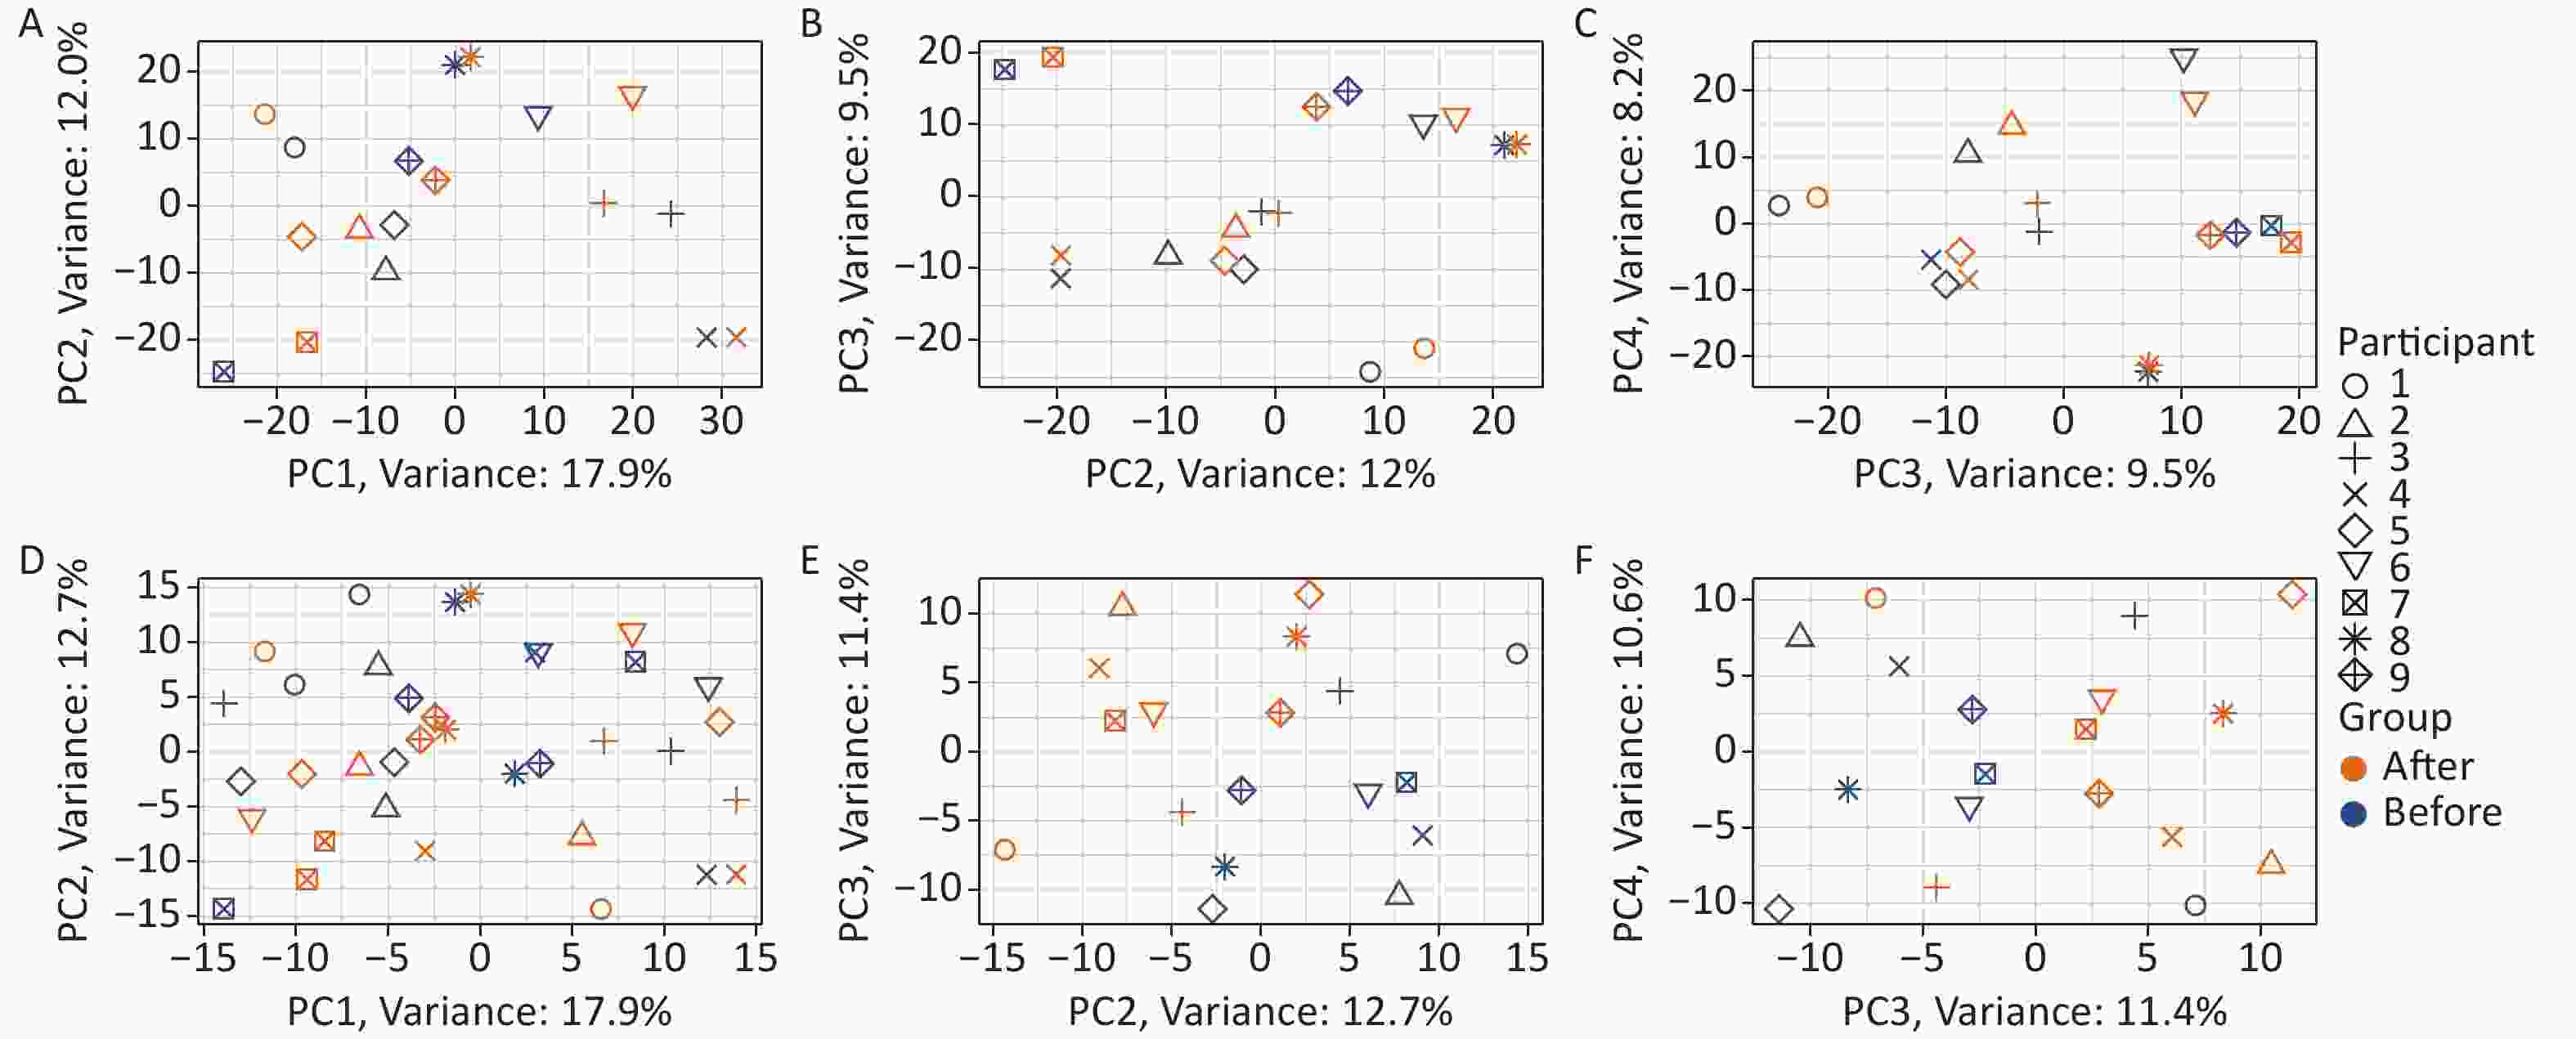
Figure 1. Effects of Gua Sha on the total blood transcriptome. The figure shows the PCA plots of the study participants before and after Gua Sha treatment based on (A–C) the original expression levels of all genes and vlincRNAs or (D–F) after the individual-specific variance was removed.
Differential expression analysis was performed using three packages in the R environment, DESeq2[34], edgeR[37], and limma[35], separately, with the recommended pipelines from the manuals of each package. In the analysis, the individual from whom the sample was derived was included as a covarying factor in the design to eliminate its influence, according to the manual of each package. For example, when using the DESeq2 package, the design formula became “~ individual + treatment”, in which the term “individual” represents the individual-specific transcriptome changes — either related to the Gua Sha treatment or not, but constituting the undesired covarying factor — and the “treatment” term is the factor of interest — effects of the Gua Sha treatment common to all individuals. With such a formula, the packages in the differential expression analysis try to minimize the influence of the former covarying factor and detect the changes due to the factor of interest. In the analysis using DESeq2, genes were filtered to remove those with mean raw read count across all 18 samples ≤ 1, resulting in 23,768 remaining genes; while in the analysis using edgeR and limma, the filterByExpr function from the edgeR package was employed to filter out genes with low expression level as recommended in their manuals, resulting in 16,935 remaining genes. False discovery rate (FDR) calculations were done by the packages using the Benjamini-Hochberg procedure.
-
Gene co-expression analysis was performed using 18 samples (9 individuals, before and after the treatment) based on the read counts of genes after the variance-stabilizing transformation and the removal of variances between individuals. Spearman′s correlation tests were performed between the expression levels of each of the three histone genes, H1-2, H1-3, and H1-4, and all other genes, using the corr.test function from the psych package[38] in the R environment. A gene was identified as co-expressed with the histone genes if its expression level significantly correlated with any of the three histone genes under the threshold of Spearman′s ρ > 0.6 or < −0.6 and FDR < 5%. FDR was calculated using the Benjamini-Hochberg procedure, starting with the raw correlation P values and the p.adjust function in the R environment.
-
The GO[39] and Reactome pathway[40] enrichment analyses were performed using the clusterProfiler package[41] in the R environment[32]. Significantly enriched terms were identified by the threshold of FDR < 5%, which was calculated by the package using the Benjamini-Hochberg procedure. The absence of results from the analysis in the corresponding figures and tables indicates that no term was significantly enriched in that analysis.
-
Since the basal human transcriptome, as well as its changes in response to Gua Sha, would likely be influenced by multiple individual-specific factors (e.g., gender, age, nutrition, genetics, and health conditions), we tried to limit the effect of inter-individual variation by selecting participants of the same gender and a narrow age group. Volunteers were asked to fast for 12 h before the Gua Sha to remove as much of the potential transcriptome effects caused by nutritional differences prior to treatment as possible. While Gua Sha is typically performed on people with certain symptoms (e.g., colds, fever, pain), in this study, we focused on apparently healthy participants to remove confounding factors caused by differences in diseases and health conditions (e.g., colds could be caused by different pathogens and pain could have multiple underlying reasons), medications taken to treat them, and so on. Overall, we assumed that if Gua Sha can induce changes in the transcriptomes of healthy people, it can do the same in individuals with a disease. Likewise, after treatment, volunteers were asked to perform the same activity (sit and rest) to avoid as much as possible transcriptome changes caused by post-treatment activities unrelated to Gua Sha treatment.
A previous study showed that Gua Sha induces a number of pro-inflammatory cytokines in serum[16]; therefore, we assumed that this treatment could also induce certain changes in the whole blood transcriptome. Based on the above considerations, in this study, we analyzed changes in the peripheral blood transcriptome of nine young healthy female volunteers (Supplementary Table S1) caused by Gua Sha treatment (METHODS). Two peripheral blood samples were collected from each individual: one immediately before Gua Sha treatment and one 3 h after treatment. The short time interval was chosen for the following reasons: 1) to ensure that the detected changes in the transcriptome were primary effects of Gua Sha; 2) to be able to limit the study subjects to the same activity (sitting and relaxing) to avoid detecting effects caused by differences in post-treatment activities; and 3) to be able to detect possible transient effects of Gua Sha.
To detect changes induced by Gua Sha, blood RNAs were subjected to RNA-seq analysis that preserved both polyadenylated and non-polyadenylated RNA species (METHODS). We then calculated the expression levels of all annotated human genes and the widespread class of vlincRNAs discovered by our group[29,42]. The reason for including the latter transcripts was that their expression in whole blood reflects changes in the physiological status of an organism, such as chronological age or the presence of non-blood cancers[31]. As shown in Figure 1, the differences between the blood transcriptome profiles were dominated by the differences between the individuals, as revealed by the PCA based on the expression levels of genes and vlincRNAs (Figure 1A–C). This observation is consistent with the large amount of inter-individual variation in transcriptome profiles that has been extensively documented in the human population[43] and could also represent individual-specific differences in response to Gua Sha.
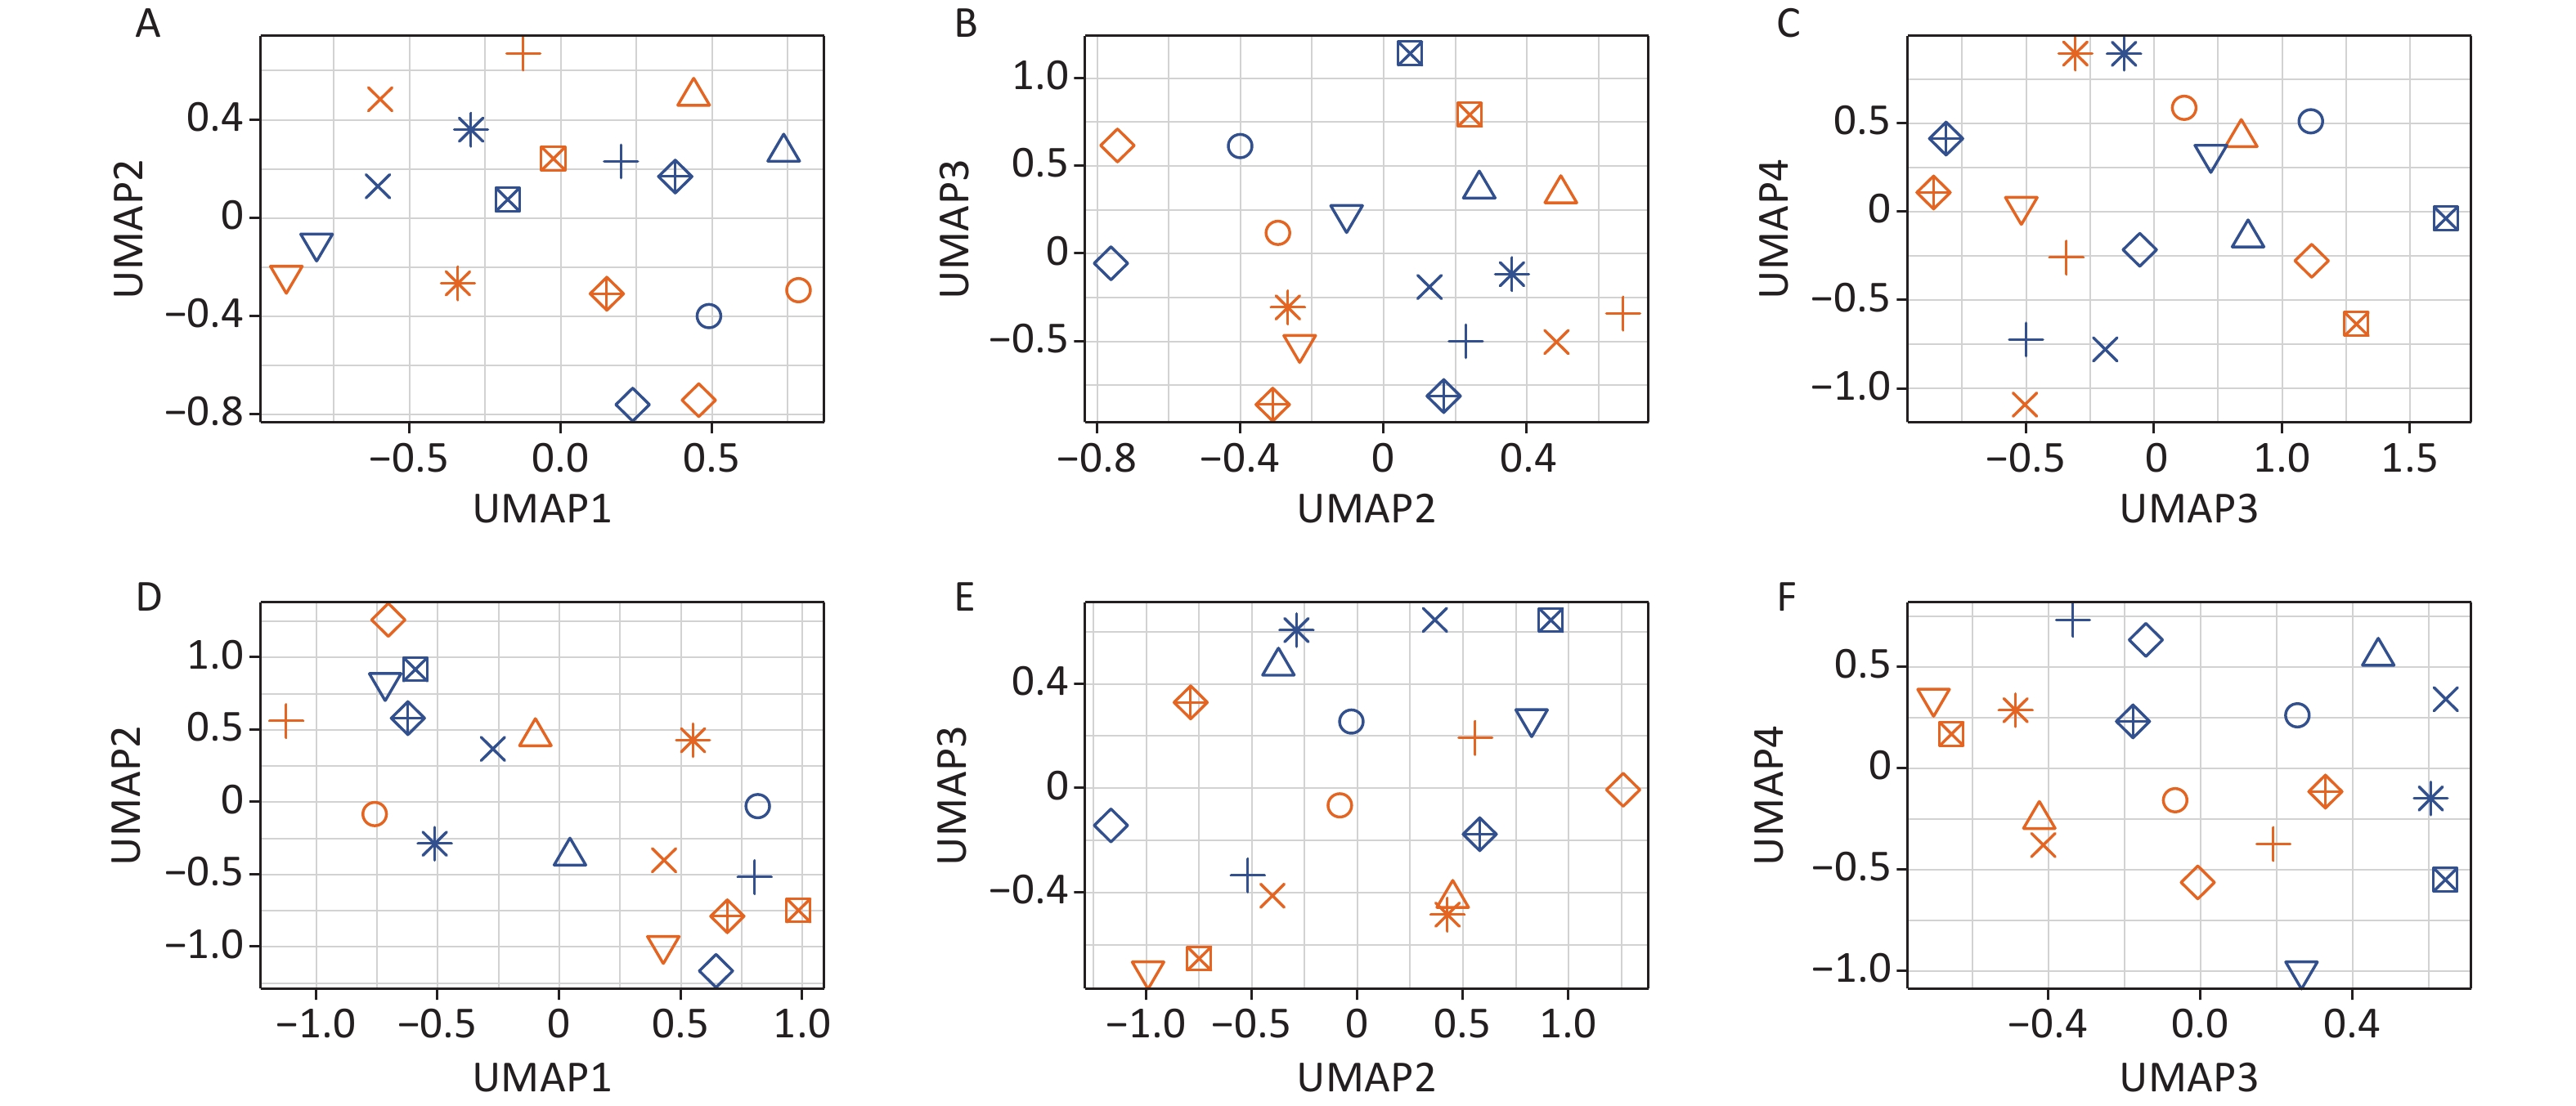
The consistent effect of the treatment on the blood transcriptome became obvious only after the removal of the individual-specific variance (Figure 1D–F; METHODS). This was particularly apparent in the PC2 and PC3 dimensions, as evident from the obvious separation of the samples before and after Gua Sha treatment (Figure 1E), which was absent before the removal of the variance caused by the individual-specific effects (Figure 1B). UMAP analysis revealed essentially the same results as PCA (the effects of the Gua Sha treatment were observed in UMAP3 and UMAP4 after the individual-specific variance removal; Supplementary Figure S1, available in www.besjournal.com). These results indicated that although Gua Sha treatment shifted the peripheral blood transcriptome profile, the common changes induced in all individuals were rather subtle.
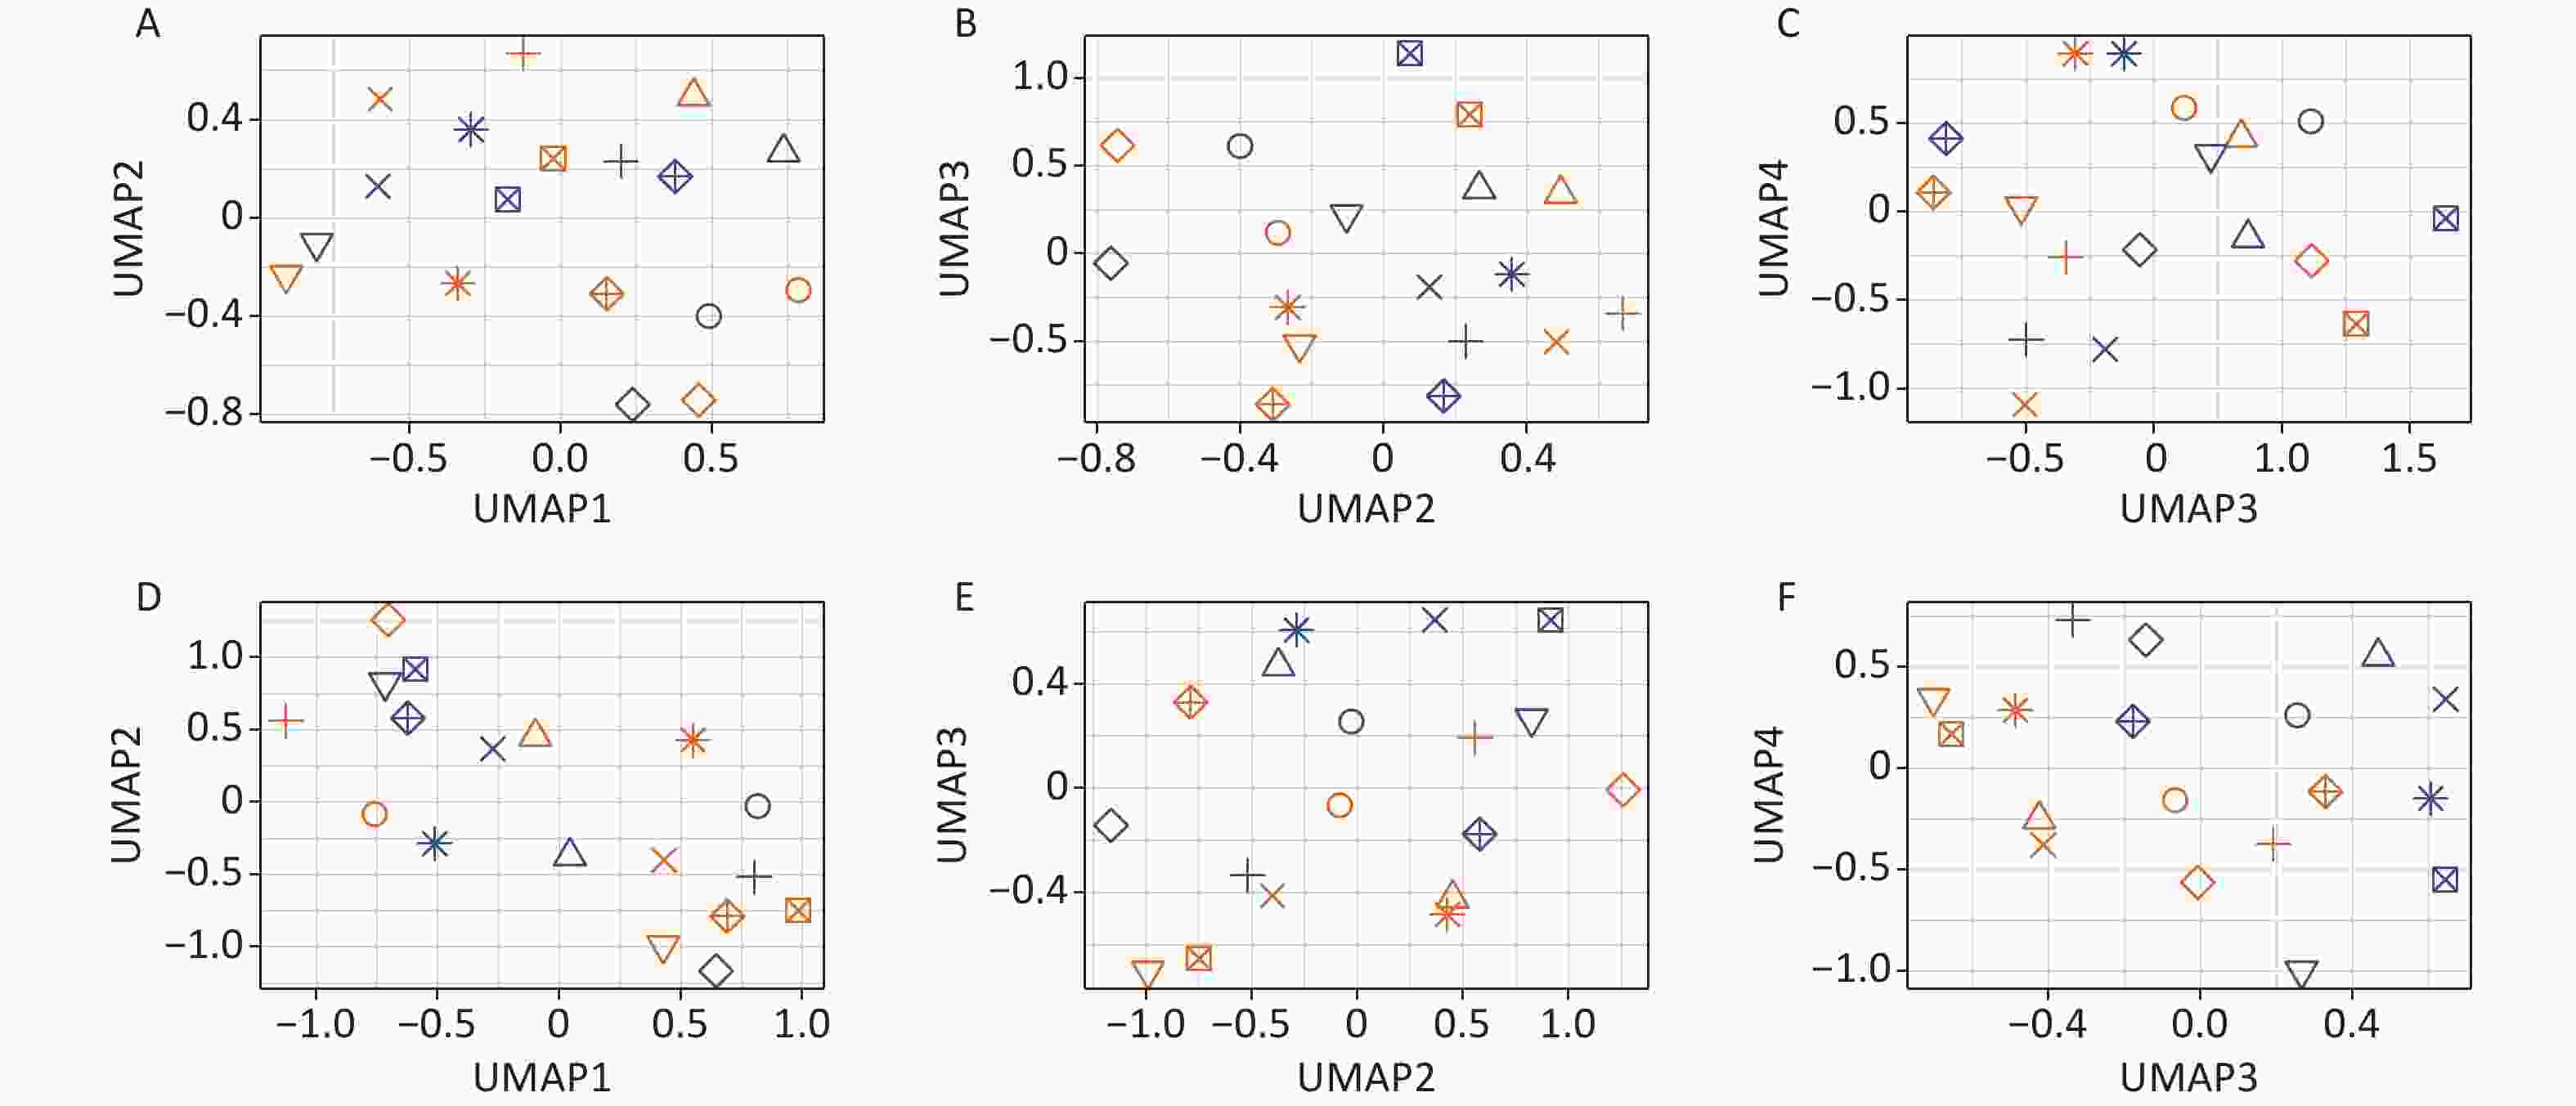
Figure S1. Effects of Gua Sha on the total blood transcriptome. The figure shows the UMAP analysis plots of the study participants before and after Gua Sha based on (A–C)the original expression levels of all genes and vlincRNAs or (D–F) after the individual-specific variance was removed.
-
To further characterize the blood transcriptome changes induced by Gua Sha treatment, differential expression analyses were independently performed with DESeq2, edgeR, and limma (METHODS), the 3 packages representing some of the most popular tools for differential expression analysis[44–46]. DESeq2 and edgeR were designed for RNA-seq data, whereas limma was initially designed for microarrays and then expanded for RNA-seq data[45–47]. The main difference among them is that DESeq2 and edgeR rely on negative binomial models to derive differentially expressed genes (DEGs) while limma uses a linear model[45–47]. Since only few DEGs were identified with a conservative FDR cutoff of < 5% (7, 6 and 2 by DESeq2, edgeR and limma, respectively), we relaxed it to a moderate threshold of < 10%[48] which is still in the range of FDR used in differential expression analysis[49]. As the result, the DESeq2, edgeR, and limma packages identified 12, 22, and 5 DEGs, respectively (Figure 2A; Supplementary Table S2, available in www.besjournal.com). Three histone genes, H1-2, H1-3, and H1-4, were shared by the three DEG sets and were upregulated after Gua Sha treatment (Figure 2A and B). The expression fold changes (after vs. before the treatment) of the three histone genes were small (the log2 fold changes of the three histone genes were ~0.30–0.33, see Supplementary Table S2), which is in line with the above finding of the subtlety of the global effects of Gua Sha on the transcriptome. However, the trends of increased expression in response to Gua Sha were statistically significant (Figure 2B). Specifically, histone H1 genes H1-2, H1-3, and H1-4 were upregulated in response to Gua Sha treatment with P values of 2.4 × 10⁻⁷, 1.4 × 10⁻⁹, and 2.7 × 10⁻⁶, respectively, as calculated using the two-tailed paired Wilcoxon test (Figure 2B).
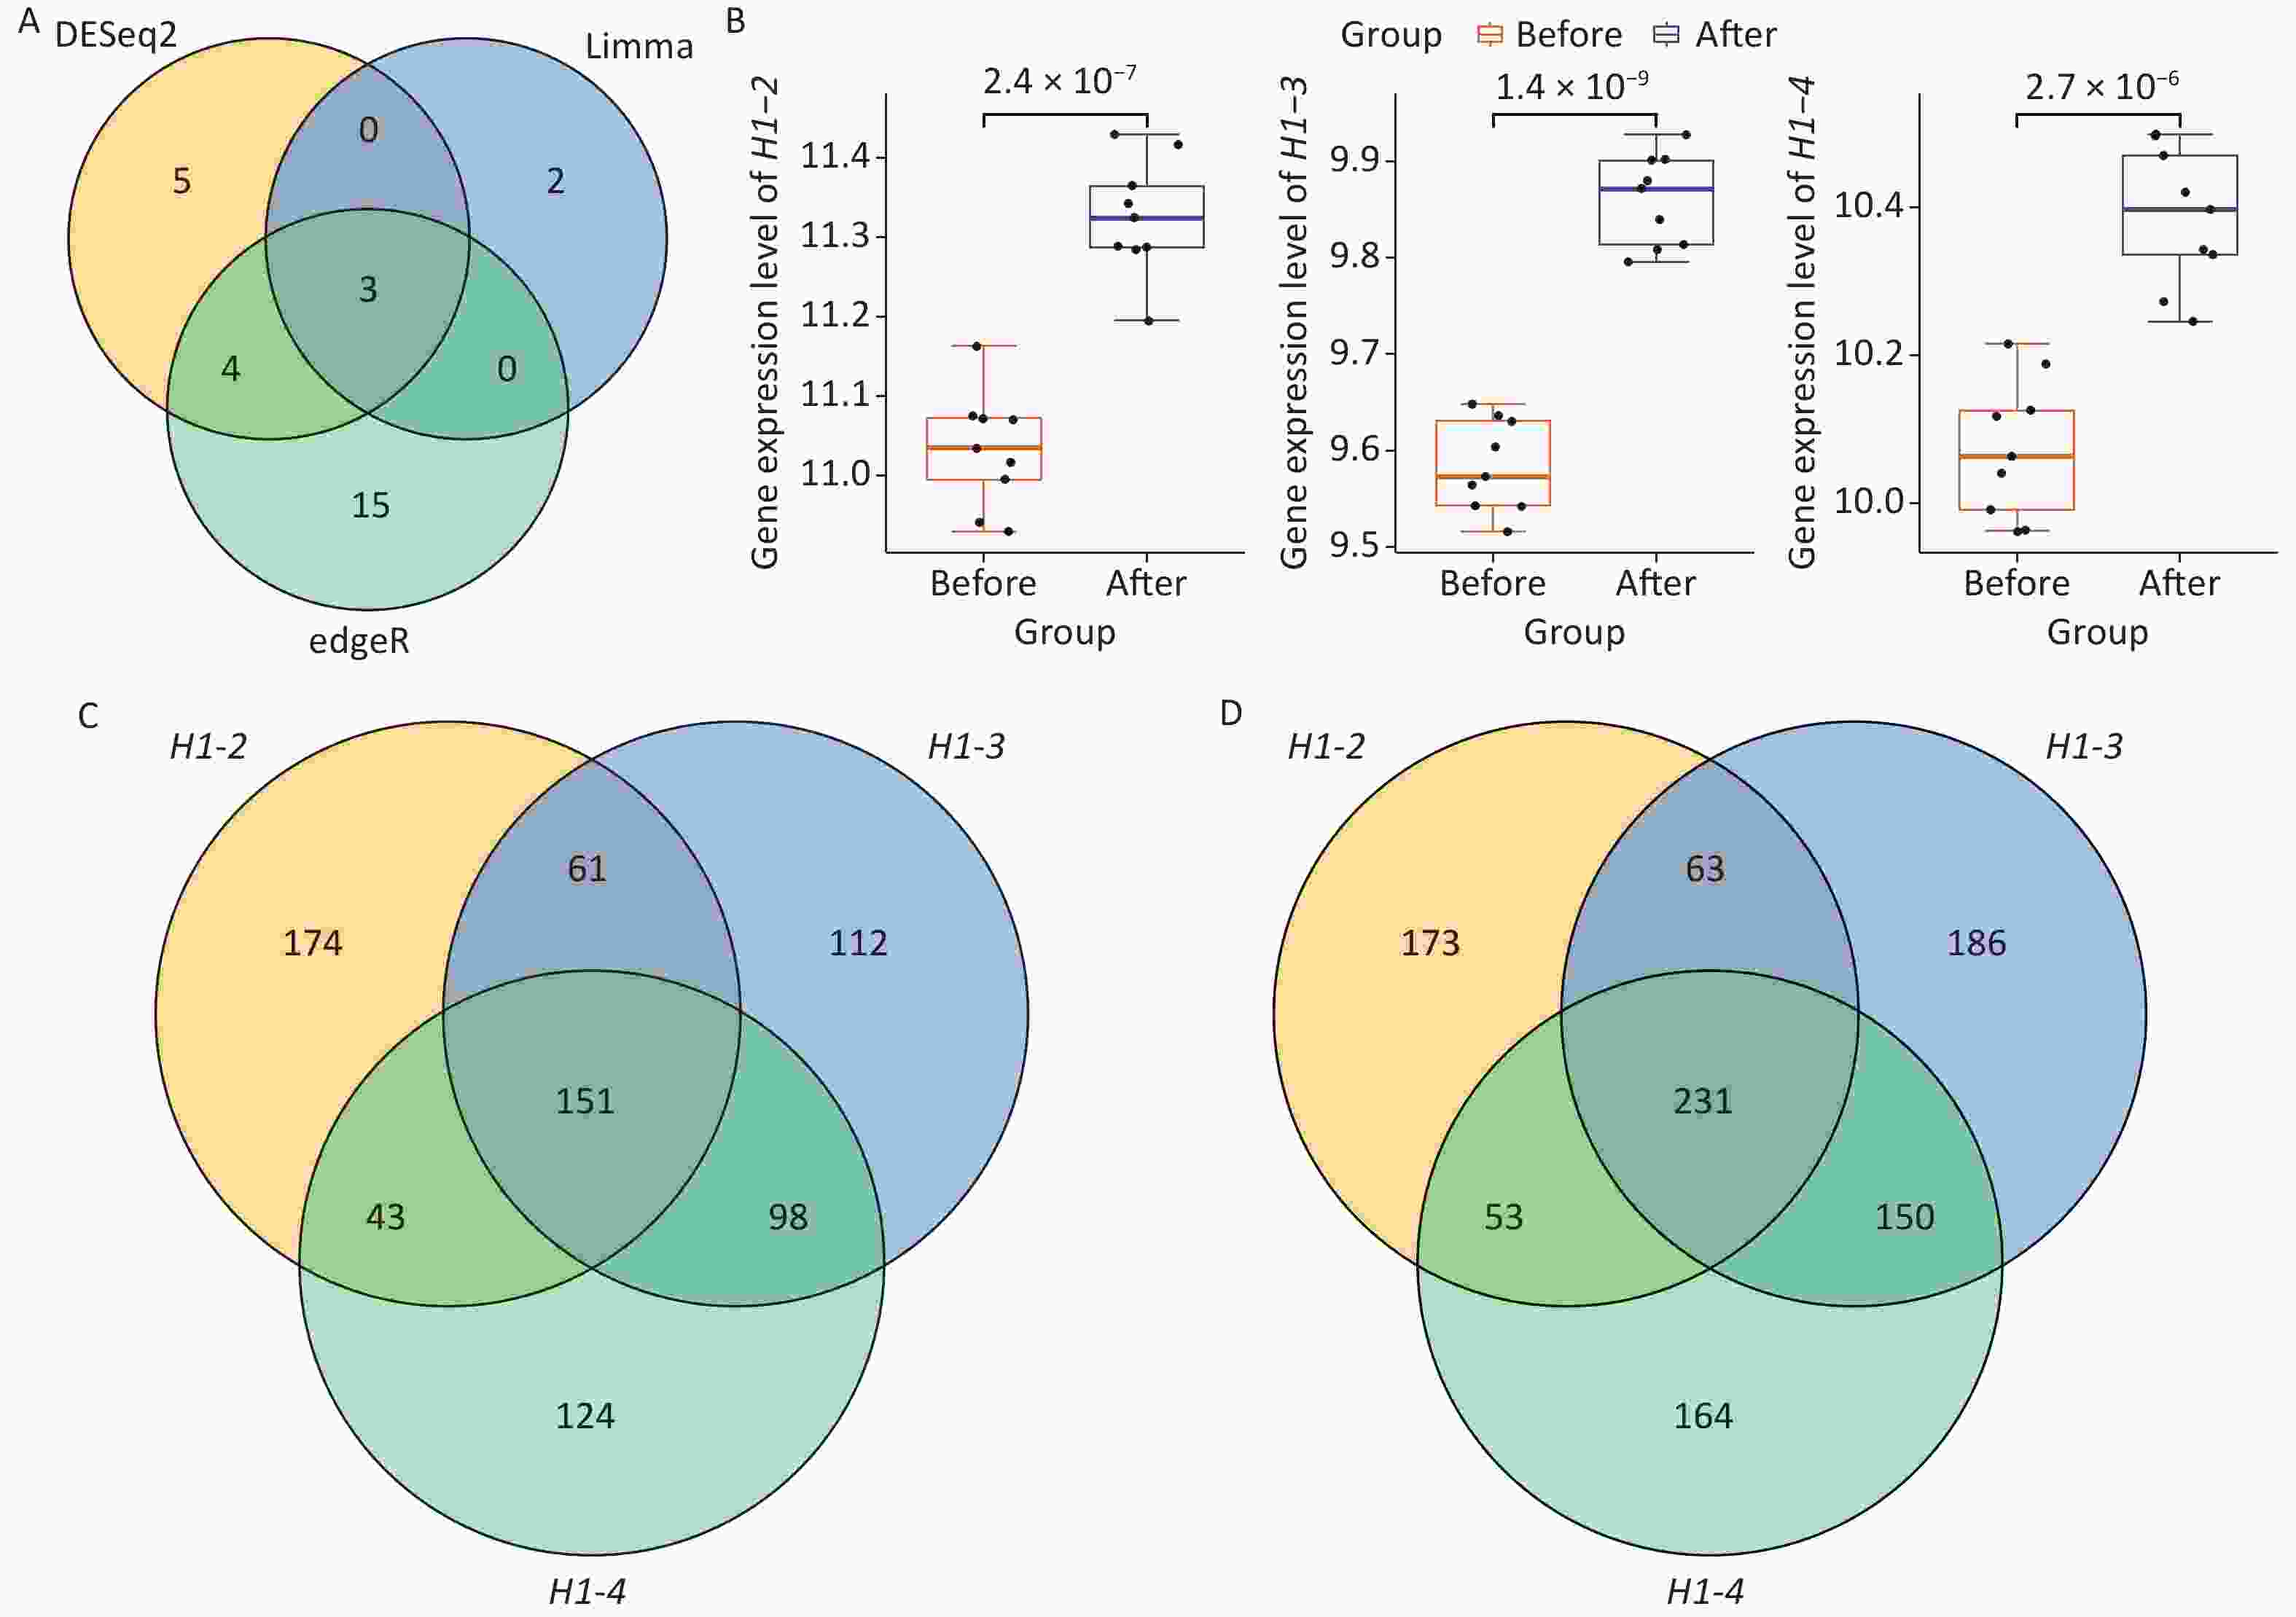
Figure 2. Identification of the histone genes induced by Gua Sha treatment and their potential regulatory networks. (A) Venn diagram of the DEG sets identified by DESeq2, edgeR and limma methods. (B) Expression levels of the 3 histone genes, H1-2, H1-3, and H1-4, before and after the Gua Sha treatment. The P values were determined using a two-tailed paired Wilcoxon test are shown in the figure. (C and D) Venn diagrams of genes (C) positively and (D) negatively co-expressed with the 3 histone genes.
To further explore the properties of genes responding to Gua Sha treatment, we identified GO terms and Reactome pathways enriched in the 29 DEGs found by at least one package (Figure 2A) relative to the background of all genes (METHODS). The only terms and pathways identified were associated with the 3 histone genes and were related to multiple biological processes and pathways such as histone methylation, regulation of gene silencing, apoptosis, cellular senescence, and programmed cell death, in which products of these genes have been previously implicated[50–59] (Supplementary Figure S2, available in www.besjournal.com). The diversity of processes and pathways is reflective of the fundamental biological functions of the products encoded by these three genes, which represent members of the H1 family of histone proteins that bind to linker DNA between nucleosomes to form chromatin fibers, and are thus necessary for the condensation of nucleosome chains into highly ordered structures[51], and regulation of gene expression through epigenetic modifications, nucleosome spacing, and chromatin remodeling[51,52,60,61]. Some H1 functions are not related to chromatin organization; for example, in response to DNA damage, the histone protein H1.2 can translocate from the nucleus to the cytosol where it activates the pro-apoptotic protein Bak, leading to apoptosis[53,62–64]. The basic biological functions of the H1 family, combined with multiple reports that associate members of this family with disease[56,65–69], prompted us to further investigate the potential mechanisms of the function of the 3 H1 histones in the Gua Sha response.
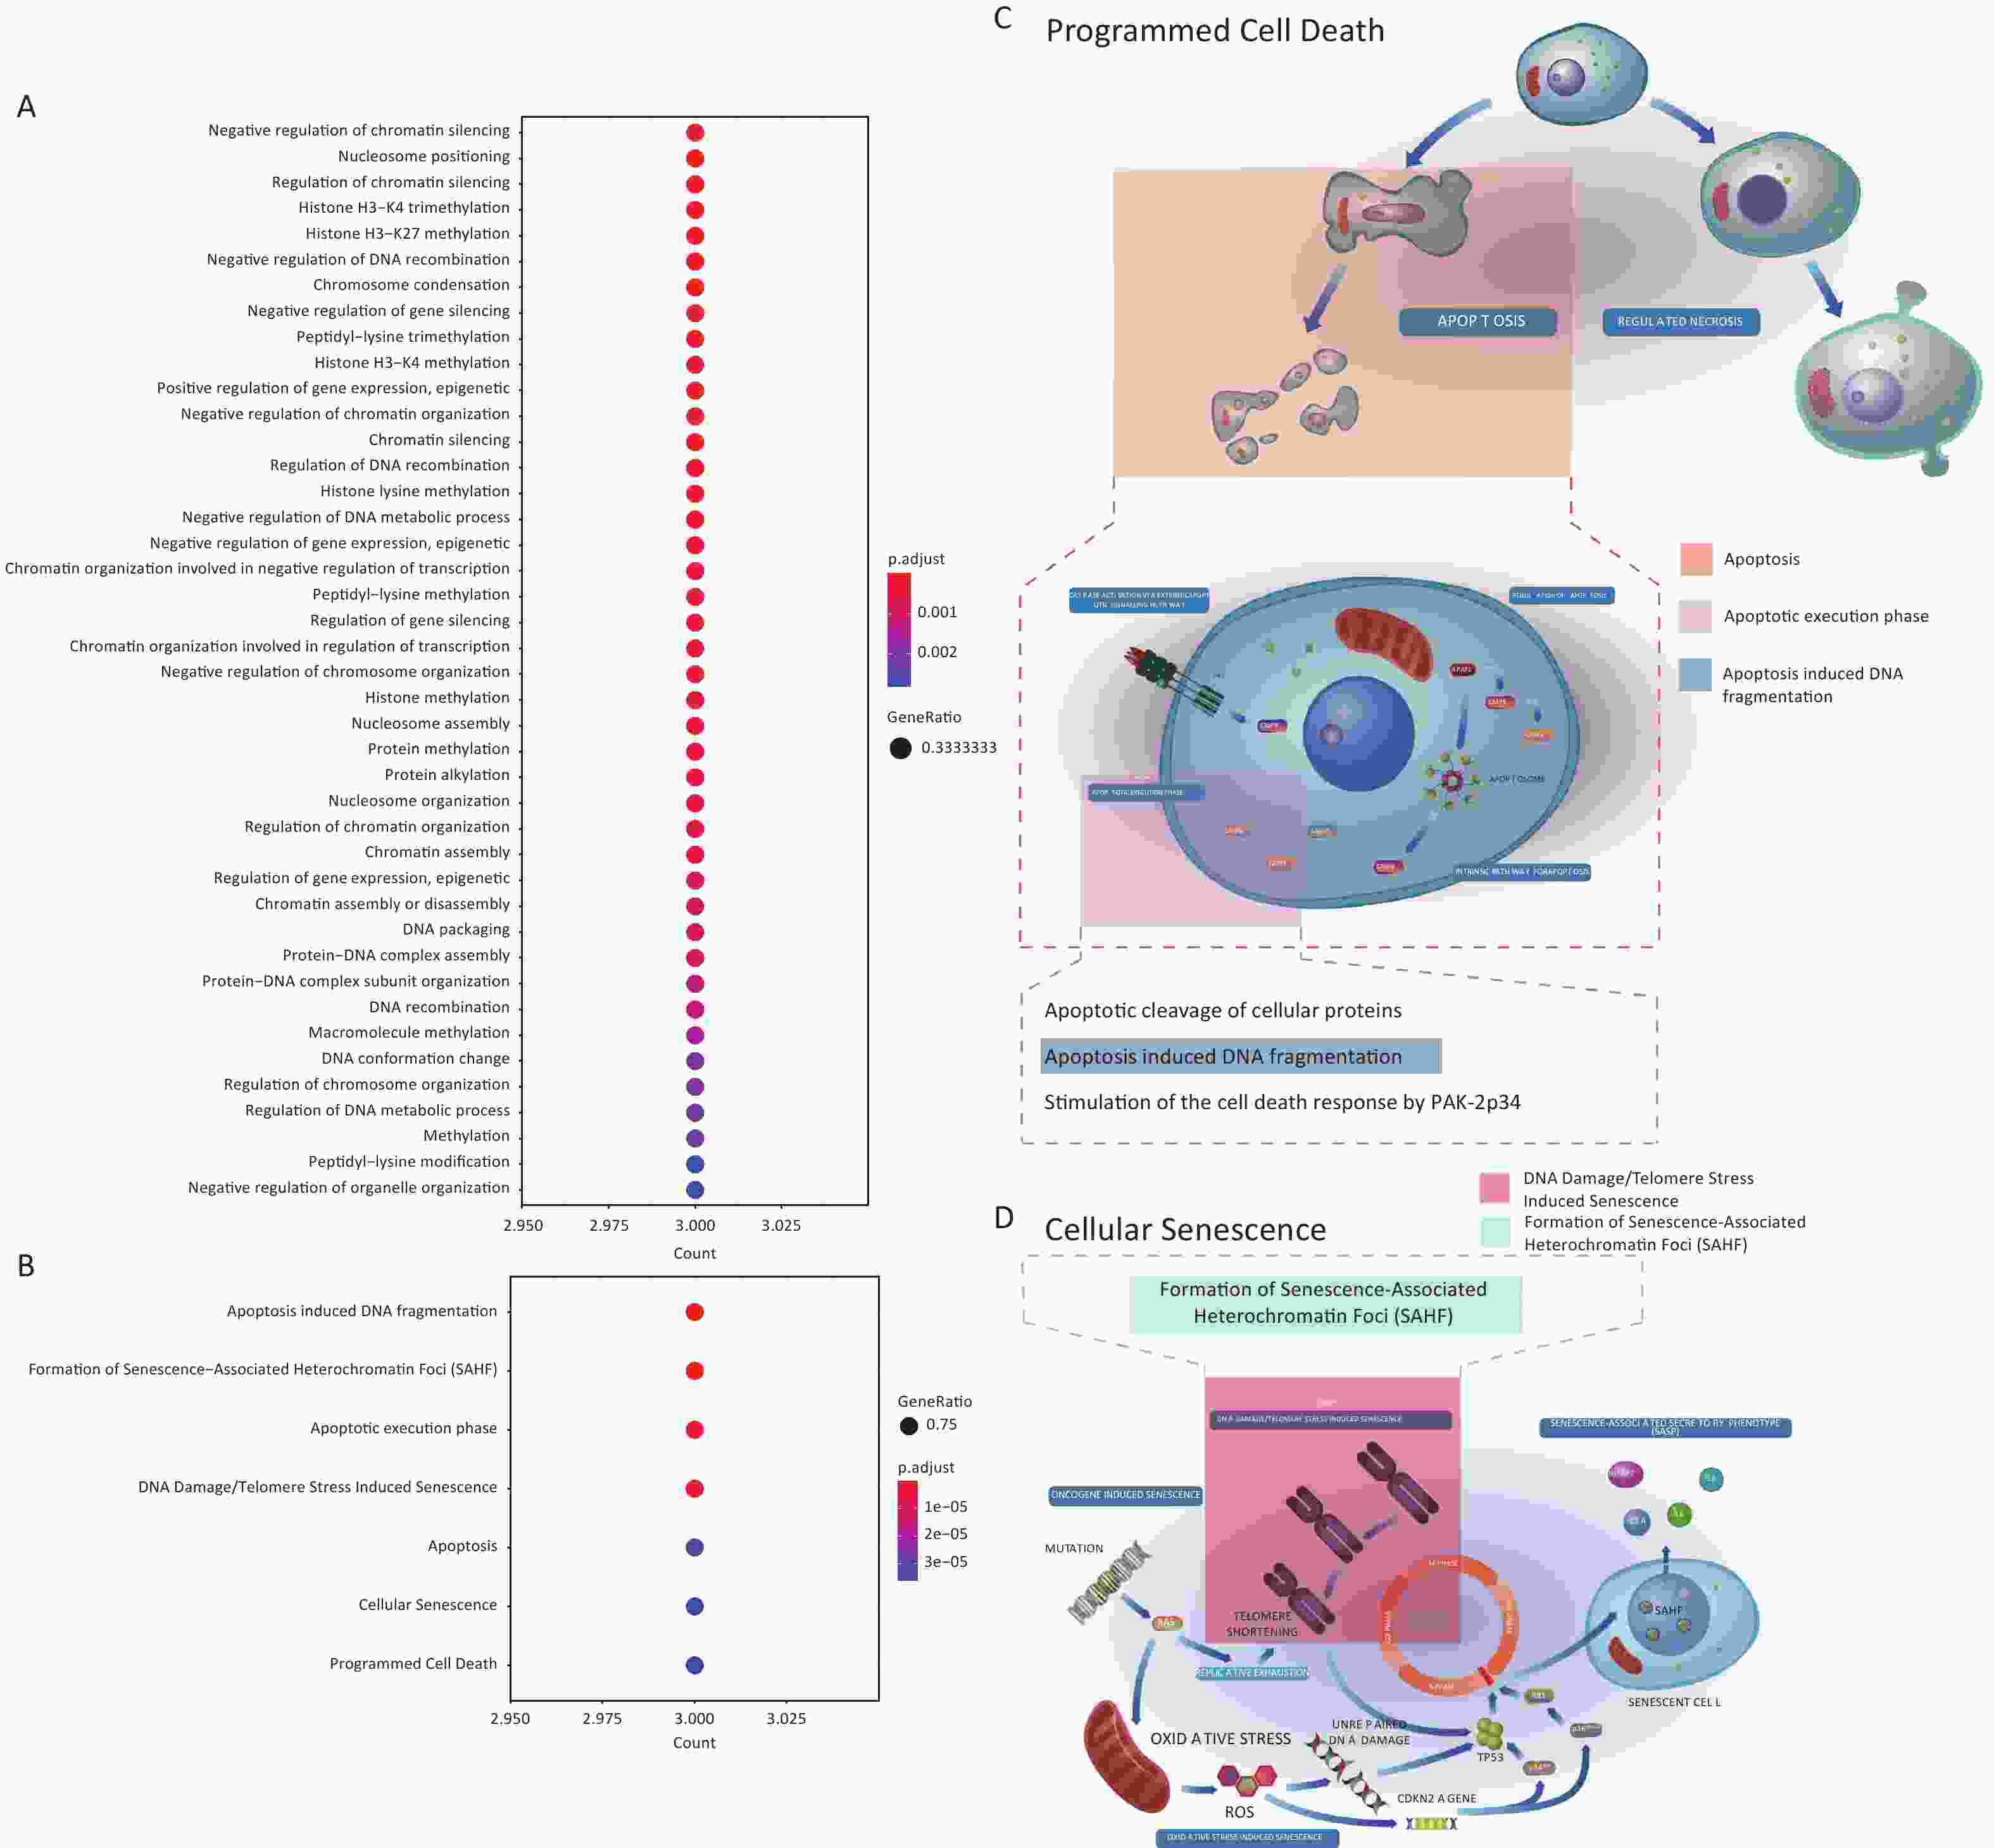
Figure S2. Enriched GO terms and Reactome pathways of the 3 histone genes. (A) Enriched GO terms in the Biological Process (BP) category. (B) Enriched Reactomepathways. (C&D) Diagrams of the (C) “Programmed Cell Death” and (D) “Cell Senescence” Reactome pathways with the enriched pathways highlighted. These two panels are derivatives offigures from Reactome website which are licensed under Creative Comments Attribution 4.0 International (CC BY 4.0) License.
-
Since the products of the 3 histone genes can affect expression of other genes, to further investigate how the 3 H1 family members might mediate the effect of Gua Sha treatment, we attempted to identify potential members of their networks using a co-expression analysis (METHODS). We identified 763 and 1,020 genes that were positively and negatively co-expressed with the three histone genes, respectively (Figure 2C and D;
Supplementary Table S3 , available in www.besjournal.com). Interestingly, genes positively co-expressed with the histone genes showed enrichment in the cellular component GO term “T cell receptor complex” (FDR = 0.074%; Supplementary Table S4, available in www.besjournal.com). In addition, they showed enrichment in such Reactome pathway terms, as “phosphorylation of CD3 and TCR zeta chains”, “translocation of ZAP-70 to immunological synapse” and “generation of second messenger molecules” — all under the parent term of T cell receptor signaling pathway — and “co-stimulation by the CD28 family” with its child term “PD-1 signaling” (Figure 3A; Supplementary Table S5, available in www.besjournal.com). The above terms represent important signaling pathways related to the activation of the adaptive immune system. These results indicate that the induction of histone genes by Gua Sha treatment could result in the activation of T lymphocyte-mediated adaptive immunity (Figure 3B), which is consistent with the observed increase in active immune cells, including activated T lymphocytes, found in mice treated with Gua Sha[16]. Negatively co-expressed genes were enriched in multiple GO and Reactome pathway terms related to “platelet activation, signaling and aggregation”, as well as in several GO terms of signal transduction in response to DNA damage (Figure 4; Supplementary Tables S4 and S5). In general, platelet activation is a complex phenomenon associated with hemostasis and inflammation (reviewed in[70]) that could be relevant to the effects of Gua Sha treatment (see DISCUSSION). Additionally, 83 and 79 vlincRNAs were identified as positively and negatively co-expressed with at least one of the three histone genes, respectively (Supplementary Table S3 ), indicating that non-coding transcripts might also be involved in mediating the effect of Gua Sha treatment.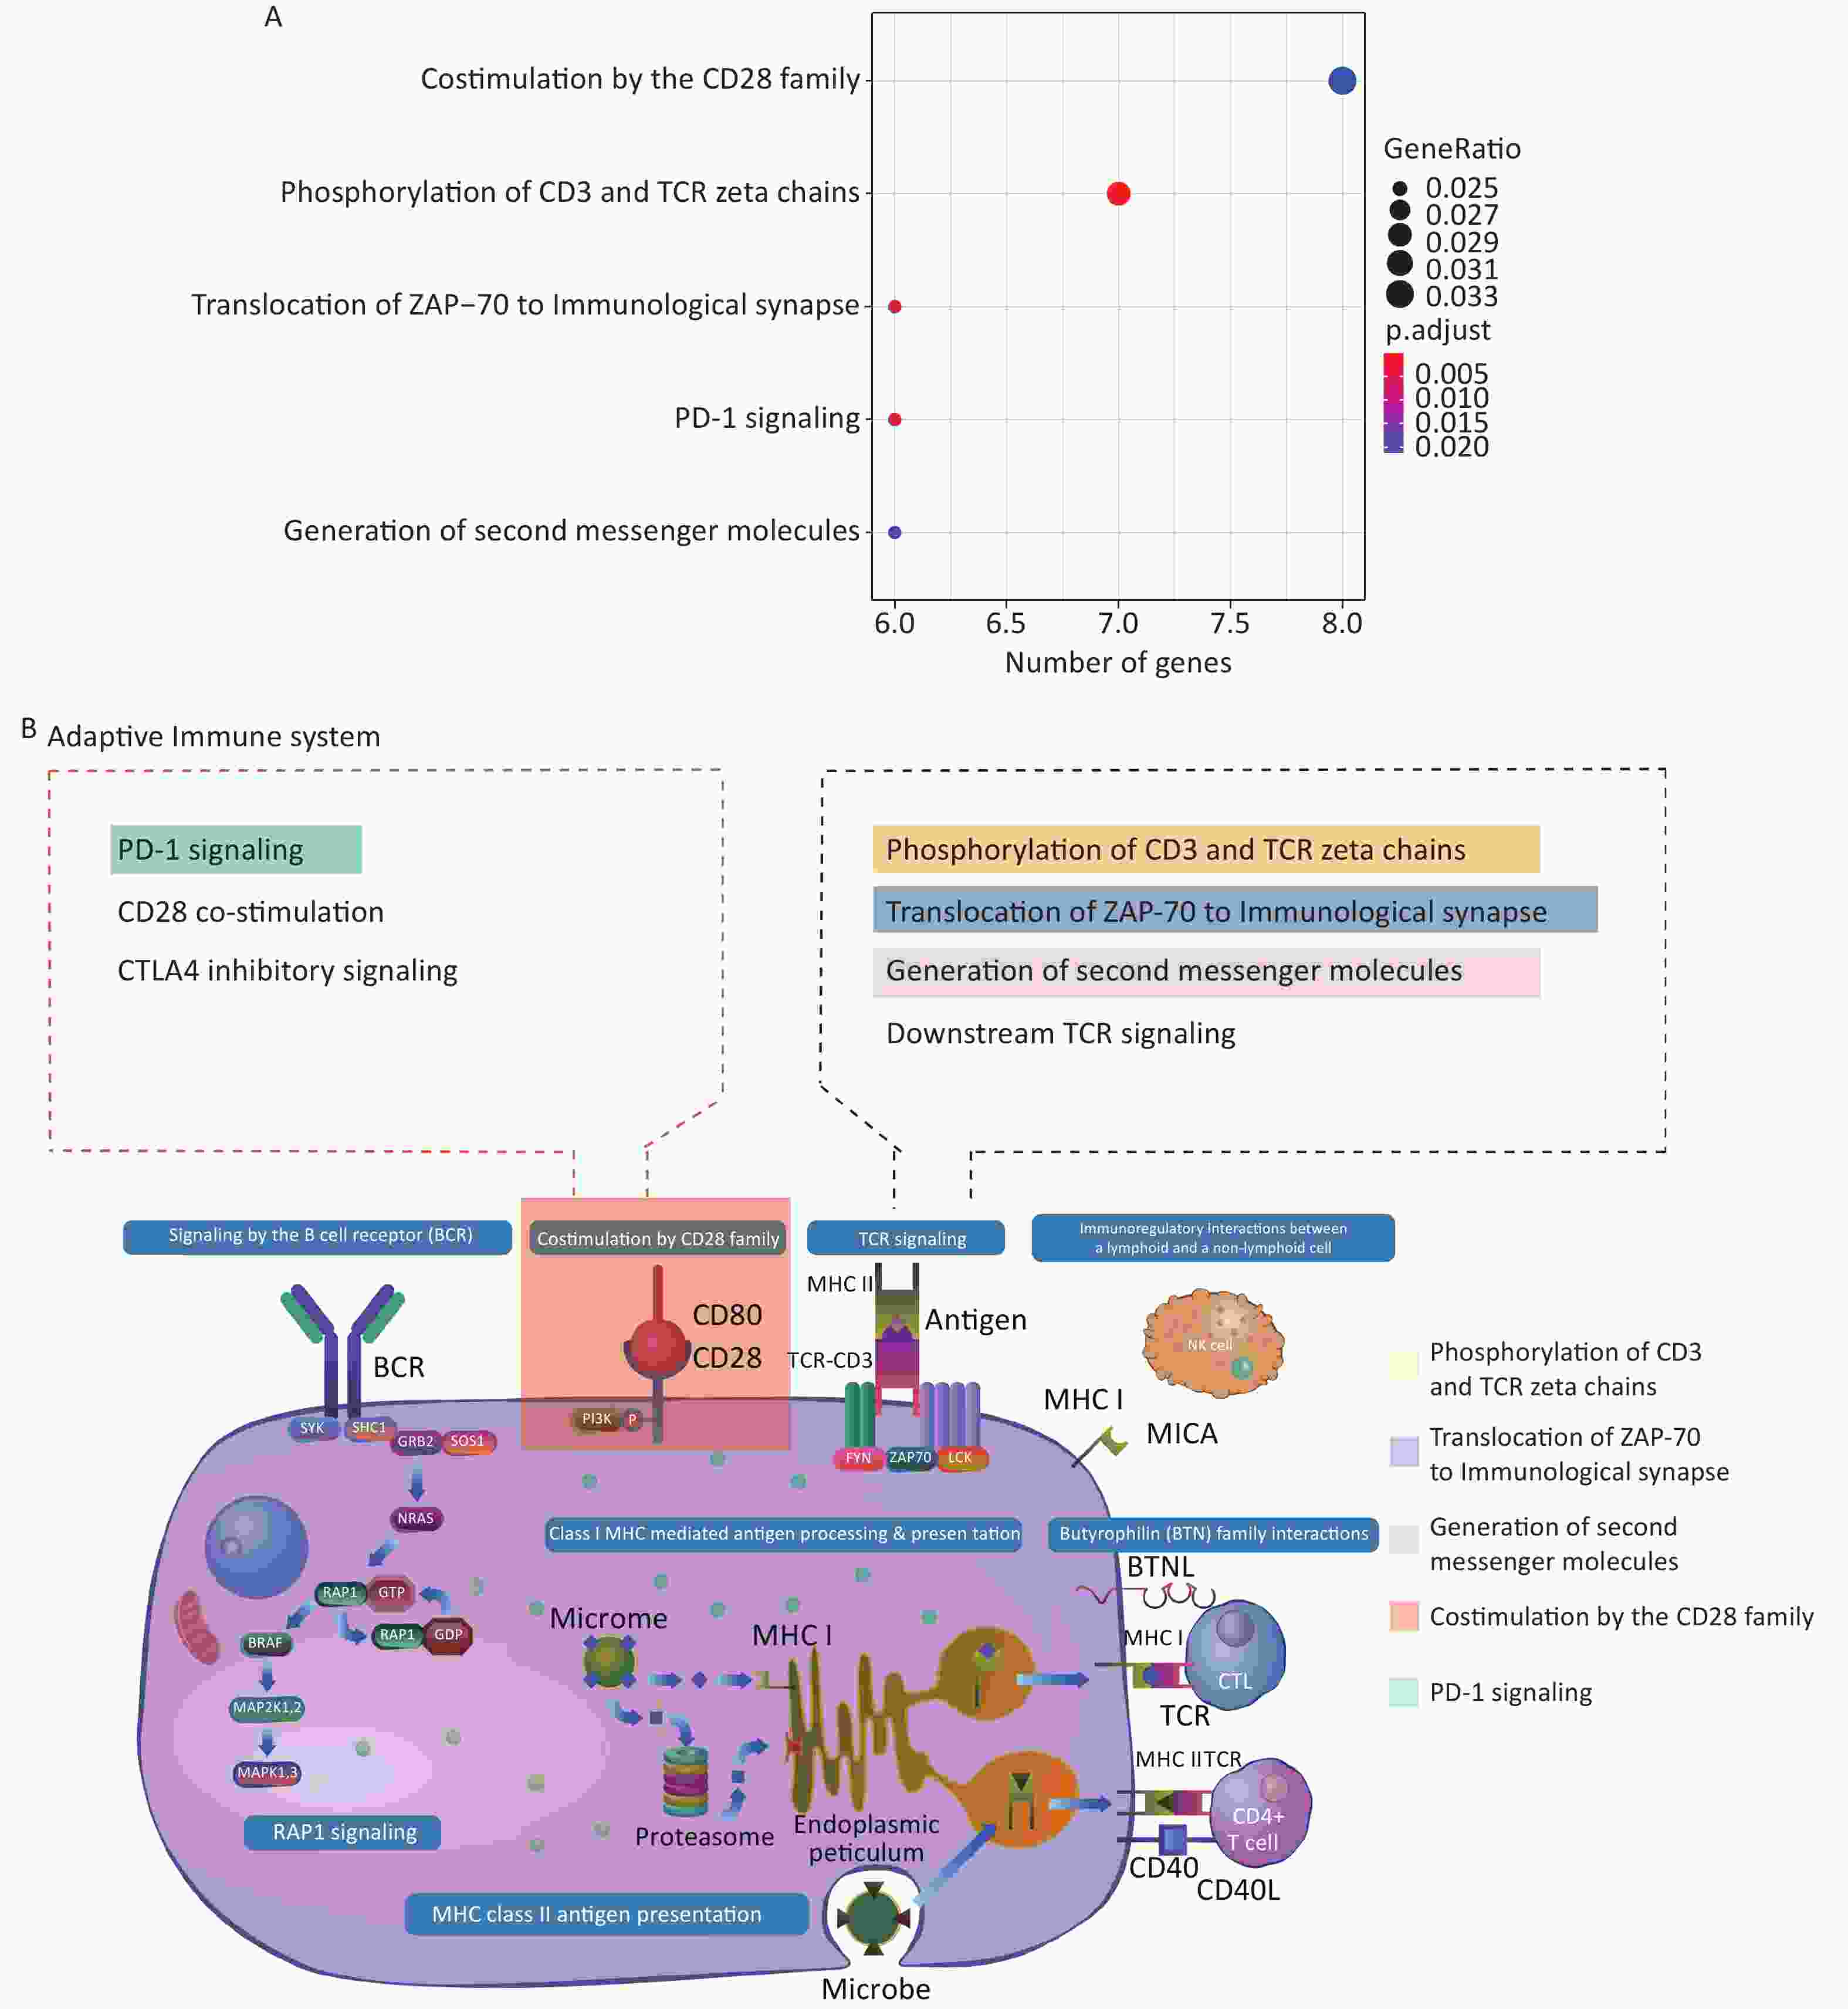
Figure 3. Enriched GO terms and Reactome pathways of genes positively co-expressed with the 3 histone genes. (A) Enriched Reactome pathways. (B) Diagram of the “Adaptive Immune System” Reactome pathways with the enriched pathways highlighted. This panel is a derivative from a figure from the Reactome website which is licensed under Creative Commons Attribution 4.0 International (CC BY 4.0) License.
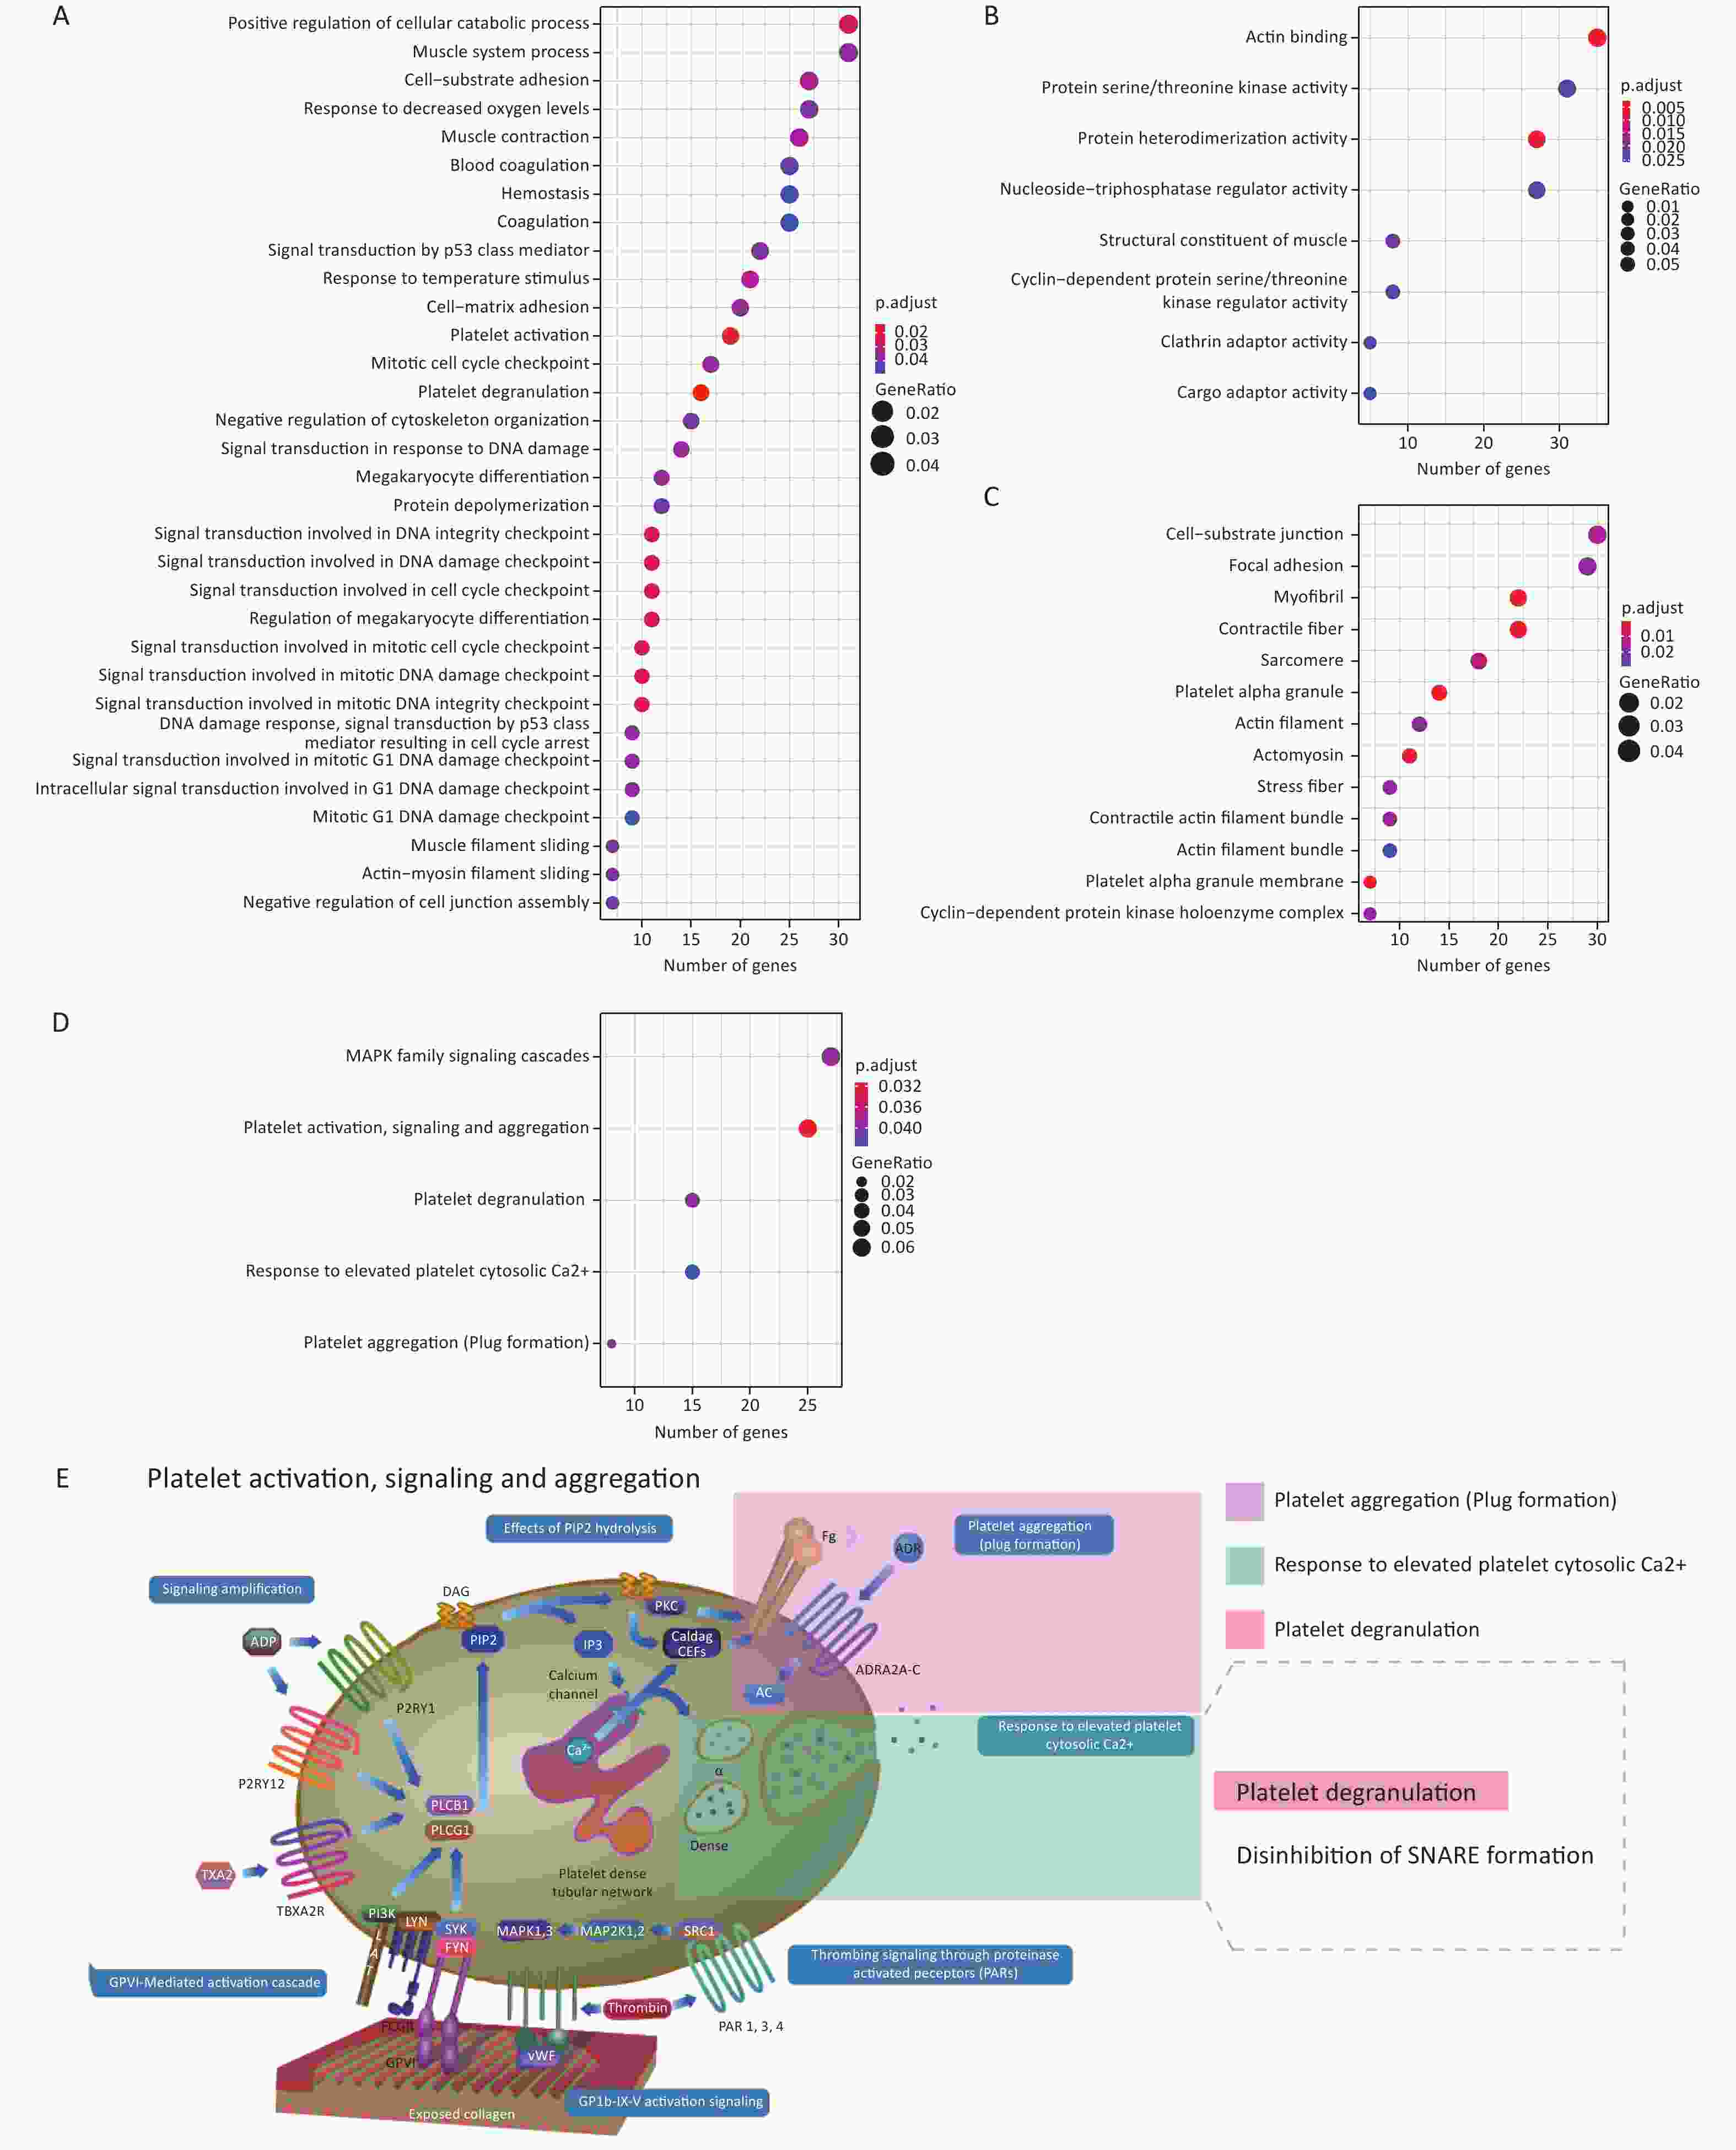
Figure 4. Enriched GO terms and Reactome pathways of genes negatively co-expressed with the 3 histone genes. (A–C) Enriched GO terms corresponding to (A) BP, (B) MF and (C) CC categories. The X-axes represents the number of genes in each category. (D) Enriched Reactome pathways. (E) Diagram of the “Platelet activation, signaling and aggregation” Reactome pathways with the enriched pathways highlighted. This panel is a derivative from a figure from the Reactome website which is licensed under Creative Commons Attribution 4.0 International (CC BY 4.0) License. GO, gene ontology; BP, biological process; MF, molecular function; CC, cellular component.
Table S4. Enriched GO terms of genes co-expressed with the 3 histone genes
co-
expression setGO
categoryID Description GeneRatio BgRatio P value FDR gene ID Positively
co-expressedCC GO:0042101 T cell receptor complex 13/412 135/21872 1.70549×10⁻⁶ 0.000740185 TRGV5/TRBC1/TRBC2/TRAV2/TRAV4/TRAV10/TRAV20/TRDV1/TRBV3-1/TRBV13/TRAC/TRBV28/TRAV1-1 Negatively
co-expressedBP GO:0030168 platelet activation 19/643 184/21081 3.78922×10⁻⁶ 0.014034576 ITGA2B/CD9/VCL/PIK3CB/F2RL3/FERMT3/ENTPD2/GNA15/PF4V1/VWF/GNAQ/DMTN/SELP/GP5/GP1BA/PDGFA/GP1BB/ITGB3/PDPK1 Negatively
co-expressedBP GO:0002576 platelet degranulation 16/643 140/21081 5.98362×10⁻⁶ 0.014034576 ITGA2B/CD9/VCL/SYTL4/THBS1/MMRN1/FERMT3/LY6G6F/VWF/SPARC/EGF/DMTN/PPBP/SELP/PDGFA/ITGB3 Negatively
co-expressedBP GO:0031331 positive regulation of cellular catabolic process 31/643 441/21081 1.5926×10⁻⁵ 0.022382635 UPF1/PIK3CB/TRIB3/TRIM14/METTL16/SH3BP4/TRIM5/ROCK2/UBQLN1/MDM2/MOV10/PLEKHF1/ENDOG/SNX33/DDRGK1/YTHDF2/TNF/SIRT6/GSK3B/RBX1/ZC3HAV1/TFEB/FOXO3/EGF/SESN3/BAG3/DAB2/SCOC/FLCN/TICAM1/PUM1 Negatively
co-expressedBP GO:0072401 signal transduction involved in DNA integrity checkpoint 11/643 82/21081 3.82905×10⁻⁵ 0.022382635 CNOT3/CNOT6/GADD45A/MDM2/CNOT10/CHEK2/E2F4/BABAM1/CASP2/RINT1/PML Negatively
co-expressedBP GO:0072422 signal transduction involved in DNA damage checkpoint 11/643 82/21081 3.82905×10⁻⁵ 0.022382635 CNOT3/CNOT6/GADD45A/MDM2/CNOT10/CHEK2/E2F4/BABAM1/CASP2/RINT1/PML Negatively
co-expressedBP GO:0072413 signal transduction involved in mitotic cell cycle checkpoint 10/643 68/21081 3.83568×10⁻⁵ 0.022382635 CNOT3/CNOT6/GADD45A/MDM2/CNOT10/CHEK2/E2F4/CASP2/RINT1/PML Negatively
co-expressedBP GO:1902402 signal transduction involved in mitotic DNA damage checkpoint 10/643 68/21081 3.83568×10⁻⁵ 0.022382635 CNOT3/CNOT6/GADD45A/MDM2/CNOT10/CHEK2/E2F4/CASP2/RINT1/PML Negatively
co-expressedBP GO:1902403 signal transduction involved in mitotic DNA integrity checkpoint 10/643 68/21081 3.83568×10⁻⁵ 0.022382635 CNOT3/CNOT6/GADD45A/MDM2/CNOT10/CHEK2/E2F4/CASP2/RINT1/PML Negatively
co-expressedBP GO:0072395 signal transduction involved in cell cycle checkpoint 11/643 83/21081 4.29426×10⁻⁵ 0.022382635 CNOT3/CNOT6/GADD45A/MDM2/CNOT10/CHEK2/E2F4/BABAM1/CASP2/RINT1/PML Negatively
co-expressedBP GO:0045652 regulation of megakaryocyte differentiation 11/643 84/21081 4.80728×10⁻⁵ 0.022550949 ITGA2B/THBS1/MOV10/MTURN/L3MBTL1/H3C14/H3C8/TESC/KAT2B/GP1BA/H4C1 Negatively
co-expressedBP GO:0031589 cell-substrate adhesion 27/643 393/21081 8.16793×10⁻⁵ 0.032790264 ITGA2B/VCL/ARHGAP6/PIK3CB/CORO1C/ROCK2/THBS1/RASA1/FERMT3/EPHB1/JAM3/ACTN3/LAMC3/GSK3B/CTTN/OLFM4/VWF/MKLN1/RAB1A/DMTN/LIMS1/TACSTD2/BCAM/ITGB3/CEACAM6/PDPK1/TBCD Negatively
co-expressedBP GO:0009266 response to temperature stimulus 21/643 269/21081 8.54454×10⁻⁵ 0.032790264 CREBBP/GLRX2/ADRB1/NTSR1/HSPA8/PTGES3/HSPH1/HTR2B/NUP42/THBS1/EPHB1/IGFBP7/SCARA5/UCP2/IRAK1/GSK3B/GMPR/DNAJA4/BAG3/DNAJB4/DNAJB6 Negatively
co-expressedBP GO:0006936 muscle contraction 26/643 374/21081 9.08705×10⁻⁵ 0.032790264 MAP2K3/VCL/CALCRL/CALD1/DOCK4/ROCK2/HTR2B/RAP1GDS1/OXTR/MYBPC1/ACTN3/MYLK/CTTN/CNN1/SLC6A8/TPM1/GSTO1/KIT/UCN/TPM4/SYNM/MYL4/ARG2/TMOD1/SLMAP/TCAP Negatively
co-expressedBP GO:0030219 megakaryocyte differentiation 12/643 108/21081 0.000113029 0.037121885 ITGA2B/THBS1/MOV10/MTURN/L3MBTL1/H3C14/H3C8/TESC/KAT2B/KIT/GP1BA/H4C1 Negatively
co-expressedBP GO:0007160 cell-matrix adhesion 20/643 257/21081 0.000130468 0.037121885 ITGA2B/VCL/ARHGAP6/PIK3CB/CORO1C/ROCK2/THBS1/RASA1/FERMT3/JAM3/ACTN3/GSK3B/CTTN/MKLN1/DMTN/LIMS1/BCAM/ITGB3/CEACAM6/PDPK1 Negatively
co-expressedBP GO:0003012 muscle system process 31/643 494/21081 0.000132949 0.037121885 MAP2K3/VCL/CALCRL/MAP2K4/ERRFI1/CALD1/DOCK4/ROCK2/HTR2B/RAP1GDS1/OXTR/MYBPC1/ACTN3/MYLK/CTTN/MTPN/FOXO3/CNN1/SLC6A8/TPM1/GSTO1/KIT/UCN/TPM4/SYNM/MYL4/ARG2/TMOD1/SORBS2/SLMAP/TCAP Negatively
co-expressedBP GO:0042770 signal transduction in response to DNA damage 14/643 144/21081 0.000134569 0.037121885 CNOT3/CNOT6/GADD45A/MDM2/BATF/CNOT10/CHEK2/E2F4/BABAM1/FOXO3/ATAD5/CASP2/RINT1/PML Negatively
co-expressedBP GO:0007093 mitotic cell cycle checkpoint 17/643 200/21081 0.000143505 0.037121885 CNOT3/CNOT6/GADD45A/TOP2A/MDM2/CDK5RAP2/NABP2/BCL2L1/CNOT10/CHEK2/E2F4/CASP2/RINT1/PML/MAD2L1/WEE1/BLM Negatively
co-expressedBP GO:0006977 DNA damage response, signal transduction by p53 class mediator resulting in cell cycle arrest 9/643 65/21081 0.000150355 0.037121885 CNOT3/CNOT6/GADD45A/MDM2/CNOT10/CHEK2/E2F4/CASP2/PML Negatively
co-expressedBP GO:0072431 signal transduction involved in mitotic G1 DNA damage checkpoint 9/643 66/21081 0.000169454 0.037852724 CNOT3/CNOT6/GADD45A/MDM2/CNOT10/CHEK2/E2F4/CASP2/PML Negatively
co-expressedBP GO:1902400 intracellular signal transduction involved in G1 DNA damage checkpoint 9/643 66/21081 0.000169454 0.037852724 CNOT3/CNOT6/GADD45A/MDM2/CNOT10/CHEK2/E2F4/CASP2/PML Negatively
co-expressedBP GO:0036293 response to decreased oxygen levels 27/643 415/21081 0.000199619 0.0390948 CREBBP/PSME4/PSMD9/RWDD3/HP1BP3/ROCK2/UBQLN1/MDM2/TLR2/THBS1/HIF1AN/ENDOG/UCP2/OXTR/IRAK1/RBX1/PSMB5/TM9SF4/CUL2/MYB/FOXO3/ATF4/ALAS2/NKX3-1/PML/DDIT4/FIS1 Negatively
co-expressedBP GO:0072331 signal transduction by p53 class mediator 22/643 307/21081 0.000201959 0.0390948 CNOT3/NOP2/CNOT6/GADD45A/ELL3/MDM2/SSRP1/BATF/HIPK1/CNOT10/CHEK2/L3MBTL1/E2F4/NUAK1/CSNK2A1/FOXO3/ATAD5/CASP2/PML/TAF3/DDIT4/BLM Negatively
co-expressedBP GO:0030049 muscle filament sliding 7/643 41/21081 0.000216684 0.0390948 MYBPC1/ACTN3/TPM1/TPM4/MYL4/TMOD1/TCAP Negatively
co-expressedBP GO:0033275 actin-myosin filament sliding 7/643 41/21081 0.000216684 0.0390948 MYBPC1/ACTN3/TPM1/TPM4/MYL4/TMOD1/TCAP Negatively
co-expressedBP GO:1901889 negative regulation of cell junction assembly 7/643 41/21081 0.000216684 0.0390948 ARHGAP6/CORO1C/ROCK2/TLR2/THBS1/TNF/DMTN Negatively
co-expressedBP GO:0051494 negative regulation of cytoskeleton organization 15/643 170/21081 0.000231628 0.040243291 ARHGAP6/CDK5RAP2/SPTB/MTPN/KAT2B/APC2/INPP5K/DMTN/CCNF/TACSTD2/PFN2/HIP1R/TMOD1/SSH2/TBCD Negatively
co-expressedBP GO:0051261 protein depolymerization 12/643 117/21081 0.000242369 0.040605398 KIF2A/HSPA8/DNAJC6/MAP1A/KIF24/MICAL3/SPTB/MTPN/APC2/MICAL2/DMTN/TMOD1 Negatively
co-expressedBP GO:0007596 blood coagulation 25/643 378/21081 0.000265392 0.042929379 ITGA2B/CD9/VCL/PIK3CB/F2RL3/THBS1/MMRN1/FERMT3/H3C14/H3C8/PRKAR2B/ENTPD2/GNA15/PF4V1/VWF/AKAP1/GNAQ/DMTN/SELP/GP5/GP1BA/PDGFA/GP1BB/ITGB3/PDPK1 Negatively
co-expressedBP GO:0031571 mitotic G1 DNA damage checkpoint 9/643 72/21081 0.000331393 0.049274038 CNOT3/CNOT6/GADD45A/MDM2/CNOT10/CHEK2/E2F4/CASP2/PML Negatively
co-expressedBP GO:0007599 hemostasis 25/643 384/21081 0.000336126 0.049274038 ITGA2B/CD9/VCL/PIK3CB/F2RL3/THBS1/MMRN1/FERMT3/H3C14/H3C8/PRKAR2B/ENTPD2/GNA15/PF4V1/VWF/AKAP1/GNAQ/DMTN/SELP/GP5/GP1BA/PDGFA/GP1BB/ITGB3/PDPK1 Negatively
co-expressedBP GO:0050817 coagulation 25/643 384/21081 0.000336126 0.049274038 ITGA2B/CD9/VCL/PIK3CB/F2RL3/THBS1/MMRN1/FERMT3/H3C14/H3C8/PRKAR2B/ENTPD2/GNA15/PF4V1/VWF/AKAP1/GNAQ/DMTN/SELP/GP5/GP1BA/PDGFA/GP1BB/ITGB3/PDPK1 Negatively
co-expressedMF GO:0003779 actin binding 35/659 470/20616 3.54915×10⁻⁶ 0.002825125 VCL/MYH7B/KLHL5/PANX1/CORO1C/CALD1/YWHAH/FLNC/IQGAP2/XIRP2/MAP1A/SYNPO/MYBPC1/MICAL3/ACTN3/MYLK/SPTB/CTTN/DBN1/CNN1/MICAL2/DIAPH3/TPM1/DAAM2/ZNF185/DMTN/TPM4/MYL4/PFN2/LDB3/HIP1R/FLNB/TMOD1/SSH2/TLN2 Negatively
co-expressedMF GO:0046982 protein heterodimerization activity 27/659 330/20616 8.61374×10⁻⁶ 0.003428269 ADRB1/GADD45A/CEACAM8/YWHAH/TOP2A/IRAK2/BMP6/JAM3/BCL2L1/SRGAP2C/IRAK1/KATNA1/CENPW/H3C14/H3C8/ATF4/TPM1/TPM4/RALGAPA2/H2AC13/PDGFA/H2BC14/H4C1/CEACAM6/PIK3R2/HIP1R/TAF3 Negatively
co-expressedMF GO:0008307 structural constituent of muscle 8/659 45/20616 7.91105×10⁻⁵ 0.020990665 MYBPC1/ACTN3/TPM1/TPM4/KRT19/SYNM/SORBS2/TCAP Negatively
co-expressedMF GO:0004674 protein serine/threonine kinase activity 31/659 469/20616 0.000120427 0.022651572 MAP2K3/MAP2K4/CCNK/SGK3/ACVR1/RIOK1/PAK4/IRAK2/ROCK2/BMPR1B/BRAF/KALRN/HIPK1/RPS6KA3/CHEK2/IRAK1/BMPR2/SIK1B/MYLK/NUAK1/GSK3B/EIF2AK1/MAST3/CSNK2A1/CCND3/PIM1/STK40/MAP3K3/HIPK3/CILK1/PDPK1 Negatively
co-expressedMF GO:0060589 nucleoside-triphosphatase regulator activity 27/659 390/20616 0.000154577 0.022651572 ARHGAP6/FNIP2/SMAP2/ARFGAP1/ERRFI1/HSPH1/DOCK4/STARD8/SH3BP4/HTR2B/RAP1GDS1/IQGAP2/RASA1/ARHGAP27/TBC1D3/TBC1D3B/TBC1D22B/RGS18/BAG3/FLCN/GNAQ/DNAJB4/TAGAP/RALGAPA2/DNAJB6/TBCD/AGAP4 Negatively
co-expressedMF GO:0016538 cyclin-dependent protein serine/threonine kinase regulator activity 8/659 50/20616 0.000171227 0.022651572 CCNK/CCNE2/CCND3/CCNG1/KAT2B/CCNI/CCNA1/CCNF Negatively
co-expressedMF GO:0035615 clathrin adaptor activity 5/659 18/20616 0.000199197 0.022651572 STON2/LDLRAP1/DAB2/AP2A1/HIP1R Negatively
co-expressedMF GO:0140312 cargo adaptor activity 5/659 19/20616 0.000263261 0.026194518 STON2/LDLRAP1/DAB2/AP2A1/HIP1R Negatively
co-expressedCC GO:0031091 platelet alpha granule 14/668 102/21872 2.67402×10⁻⁶ 0.000845285 ITGA2B/CD9/SYTL4/THBS1/MMRN1/FERMT3/LY6G6F/VWF/SPARC/EGF/PPBP/SELP/PDGFA/ITGB3 Negatively
co-expressedCC GO:0031092 platelet alpha granule membrane 7/668 23/21872 3.84295×10⁻⁶ 0.000845285 ITGA2B/CD9/SYTL4/LY6G6F/SPARC/SELP/ITGB3 Negatively
co-expressedCC GO:0030016 myofibril 22/668 239/21872 4.61904×10⁻⁶ 0.000845285 VCL/CORO1C/CALD1/FLNC/DCTN4/XIRP2/SYNPO/MYBPC1/KAT2B/TPM1/BAG3/TPM4/MTM1/KRT19/SYNM/MYL4/DNAJB6/LDB3/FLNB/TMOD1/SORBS2/TCAP Negatively
co-expressedCC GO:0043292 contractile fiber 22/668 251/21872 1.01267×10⁻⁵ 0.001389892 VCL/CORO1C/CALD1/FLNC/DCTN4/XIRP2/SYNPO/MYBPC1/KAT2B/TPM1/BAG3/TPM4/MTM1/KRT19/SYNM/MYL4/DNAJB6/LDB3/FLNB/TMOD1/SORBS2/TCAP Negatively
co-expressedCC GO:0042641 actomyosin 11/668 81/21872 3.45542×10⁻⁵ 0.003794051 DCTN4/XIRP2/SYNPO/MYLK/DBN1/KAT2B/TPM1/BAG3/TPM4/LDB3/FLNB Negatively
co-expressedCC GO:0030017 sarcomere 18/668 219/21872 0.000144378 0.013210542 CORO1C/FLNC/DCTN4/XIRP2/SYNPO/KAT2B/TPM1/BAG3/TPM4/MTM1/KRT19/MYL4/DNAJB6/LDB3/FLNB/TMOD1/SORBS2/TCAP Negatively
co-expressedCC GO:0030055 cell-substrate junction 30/668 483/21872 0.00020871 0.016368807 ITGA2B/CD9/VCL/REXO2/HSPA8/CORO1C/FLNC/STARD8/PAK4/DCTN4/FERMT3/XIRP2/SLC4A2/PCBP2/TGM2/ACTN3/MRC2/CTTN/CNN1/DCAF6/PRUNE1/ZNF185/DAB2/TPM4/LIMS1/ITGB3/FLNB/PDPK1/SORBS2/TLN2 Negatively
co-expressedCC GO:0001725 stress fiber 9/668 71/21872 0.000301135 0.017529376 DCTN4/XIRP2/SYNPO/MYLK/TPM1/BAG3/TPM4/LDB3/FLNB Negatively
co-expressedCC GO:0097517 contractile actin filament bundle 9/668 71/21872 0.000301135 0.017529376 DCTN4/XIRP2/SYNPO/MYLK/TPM1/BAG3/TPM4/LDB3/FLNB Negatively
co-expressedCC GO:0000307 cyclin-dependent protein kinase holoenzyme complex 7/668 44/21872 0.000344238 0.017529376 CCNK/CCNE2/CCND3/CCNG1/CCNI/CCNA1/CCNF Negatively
co-expressedCC GO:0005925 focal adhesion 29/668 475/21872 0.000351226 0.017529376 ITGA2B/CD9/VCL/REXO2/HSPA8/CORO1C/FLNC/STARD8/PAK4/DCTN4/XIRP2/SLC4A2/PCBP2/TGM2/ACTN3/MRC2/CTTN/CNN1/DCAF6/PRUNE1/ZNF185/DAB2/TPM4/LIMS1/ITGB3/FLNB/PDPK1/SORBS2/TLN2 Negatively
co-expressedCC GO:0005884 actin filament 12/668 124/21872 0.000420981 0.019259866 ARHGAP6/JAM3/ACTN3/CTTN/DBN1/APC2/MICAL2/TPM1/DMTN/TPM4/LDB3/TMOD1 Negatively
co-expressedCC GO:0032432 actin filament bundle 9/668 79/21872 0.000670616 0.028320644 DCTN4/XIRP2/SYNPO/MYLK/TPM1/BAG3/TPM4/LDB3/FLNB -
In this study, we showed that transcriptome changes induced by Gua Sha were subtle. This contrasts somewhat with the longstanding empirical knowledge proving the effectiveness of this technique. However, there could be objective reasons to explain this apparent contradiction. First, Gua Sha was conducted on healthy volunteers with no apparent health issues, such as cold and fever, while Gua Sha is typically performed on people who have health problems that might exhibit stronger transcriptome changes. Second, we focused on immediate changes that could be directly attributed to Gua Sha by keeping the participants in the same controlled environment post-treatment to minimize the risk of detecting changes unrelated to Gua Sha that could occur if the volunteers were allowed to continue with their normal routines. However, it is conceivable that longer times are needed to allow transcriptome changes related to the treatment to become more apparent. Third, many of the responses to Gua Sha could be individual-specific, while we focused on common transcriptome changes across individuals. Indeed, as the analysis has shown, the latter concern was valid because most of the transcriptomic differences, even after a short interval post-treatment, had individual-specific signatures. Fourth, in this study, we performed a bulk transcriptome analysis; however, the actual changes could affect only a small fraction of specific immune cells in the blood. Therefore, single-cell transcriptome analysis of the blood might be a good alternative approach to further study the molecular changes induced by Gua Sha.
Despite these caveats, we identified three genes whose expression changes could be associated with treatment. These genes encode members of the H1 histone family of proteins that have been widely implicated in the control of chromatin state and gene expression. However, in addition to their well-known roles in maintaining chromatin structure, H1 histones can drive an inflammatory response in microglia[71], and the expression of H1 subtypes plays a role in neutrophil differentiation[59]. Furthermore, using co-expression analysis, we found that the three histone genes may affect the expression of genes associated with the T cell receptor complex and platelet activation involved in the immune response and inflammation. The association between Gua Sha and inflammation and the immune system found in this study using a genomics approach was also consistent with previous studies relying on traditional biochemical and cell-based assays. For example, Chen et al. found an increase in active immune cells, levels of the pro-inflammatory cytokines tumor necrosis factor-alpha (TNF-α), IL-6, and IL-1β, and a decrease in the immunosuppressive cytokine IL-10 in healthy mice following Gua Sha treatment[16]. In contrast, a negative effect of Gua Sha on proinflammatory cytokines has been reported in other studies. For example, Yuen et al. found a reduction in TNF-α following treatment in elderly individuals with chronic lower back pain[15]. The inhibitory effect of Gua Sha on the expression of TNF-α and other pro-inflammatory cytokines, such as IL-1β and IL-6, was also observed in rats with lumbar disc herniation induced by autologous nucleus pulposus[6]. The differences among studies might be due to differences in the species used and the health status of the subjects. Nonetheless, these studies strongly suggest that Gua Sha exerts its effects, at least in part, by affecting the immune system, which is consistent with our findings. In addition, the enrichment of functions related to platelet activation among the genes negatively co-expressed with the three histones is consistent with a previous study in which Gua Sha was shown to improve blood flow via blood vessel expansion in mice[16].
Overall, this study shows that changes in the transcriptome profile can occur in response to Gua Sha, and they likely represent the physiological mechanisms behind the healing effect of this procedure. However, given the subtlety of the effects and/or individual-specific variation, more extensive studies on the effects of Gua Sha on transcriptome that involve 100′s or even more participants of both genders, different age groups, and health conditions and conducted at different time points after the treatment are required to comprehensively understand the effects of Gua Sha. We hope that this work will be an important stepping stone leading to such endeavors.
-
KAPRANOV Philipp conceived the project and supervised the analytical and wet laboratory parts of the project. QI Fei performed all bioinformatic analyses with the help of CHEN Jun Jie and XIA Qiu. CAI Ye and HAN Xue Er organized the participation in the study and performed the molecular biology part of the project. CHEN Chun Li performed the Gua Sha treatments. KAPRANOV Philipp and QI Fei wrote the manuscript with help from CAI Ye.
-
The data presented in this study were deposited in the GSA-Human repository (accession number HRA002107). Custom R scripts for analysis were deposited at Github (
https://github.com/qifei9/guasha_code ) and are also available at Zenodo (https://doi.org/10.5281/zenodo.7046437 ). -
All participants provided informed consent and the experiments were approved by the ethics review board of the School of Medicine, Huaqiao University.
Table S2-1. Differentially expressed gene (from DESeq2)
ensembl_gene_id baseMean log2FoldChange lfcSE Stat P value FDR gene_name description ENSG00000214827 64.16297166 1.493942715 0.260220811 5.741057803 9.4087×10⁻⁹ 0.000154256 MTCP1 mature T cell proliferation 1 [Source:HGNC Symbol;Acc:HGNC:7423] ENSG00000124575 798.5727007 0.296755402 0.05441918 5.453139882 4.94881×10⁻⁸ 0.000270453 H1-3 H1.3 linker histone, cluster member [Source:HGNC Symbol;Acc:HGNC:4717] ENSG00000187837 2289.23317 0.300660272 0.054600331 5.506565042 3.65903×10⁻⁸ 0.000270453 H1-2 H1.2 linker histone, cluster member [Source:HGNC Symbol;Acc:HGNC:4716] ENSG00000204217 480.6833203 -0.406750982 0.080115793 -5.077038679 3.83363×10⁻⁷ 0.001571308 BMPR2 bone morphogenetic protein receptor type 2 [Source:HGNC Symbol;Acc:HGNC:1078] ENSG00000168298 1157.053419 0.328110533 0.067928283 4.830249209 1.36362×10⁻⁶ 0.004471319 H1-4 H1.4 linker histone, cluster member [Source:HGNC Symbol;Acc:HGNC:4718] ENSG00000096060 979.6341952 -0.39402708 0.086629147 -4.548435393 5.40462×10⁻⁶ 0.012658399 FKBP5 FKBP prolyl isomerase 5 [Source:HGNC Symbol;Acc:HGNC:3721] ENSG00000110442 371.7090693 -0.600848784 0.131946879 -4.553717294 5.27062×10⁻⁶ 0.012658399 COMMD9 COMM domain containing 9 [Source:HGNC Symbol;Acc:HGNC:25014] ENSG00000084070 1900.52367 -0.289763837 0.069497266 -4.169427832 3.05365×10⁻⁵ 0.060009013 SMAP2 small ArfGAP2 [Source:HGNC Symbol;Acc:HGNC:25082] ENSG00000123739 620.5511379 -0.483504896 0.116447888 -4.152113929 3.29418×10⁻⁵ 0.060009013 PLA2G12A phospholipase A2 group XIIA [Source:HGNC Symbol;Acc:HGNC:18554] ENSG00000113369 11149.31946 0.311698679 0.076233343 4.088744733 4.33714×10⁻⁵ 0.066977594 ARRDC3 arrestin domain containing 3 [Source:HGNC Symbol;Acc:HGNC:29263] ENSG00000131724 2109.54573 -0.248040047 0.060786585 -4.080506378 4.49377×10⁻⁵ 0.066977594 IL13RA1 interleukin 13 receptor subunit alpha 1 [Source:HGNC Symbol;Acc:HGNC:5974] ENSG00000134294 4578.9579 -0.170354167 0.042931362 -3.968058736 7.24605×10⁻⁵ 0.098999127 SLC38A2 solute carrier family 38 member 2 [Source:HGNC Symbol;Acc:HGNC:13448] Table S2-2. Differentially expressed gene (from edgeR)
ensembl_gene_id logFC logCPM LR P value FDR gene_name Description ENSG00000124575 0.309799605 5.487281968 43.38682354 4.49203×10⁻¹¹ 7.60725×10⁻⁷ H1-3 H1.3 linker histone, cluster member [Source:HGNC Symbol;Acc:HGNC:4717] ENSG00000187837 0.306963565 7.005778529 38.96442011 4.316×10⁻¹⁰ 3.65458×10⁻⁶ H1-2 H1.2 linker histone, cluster member [Source:HGNC Symbol;Acc:HGNC:4716] ENSG00000168298 0.333311562 6.020909117 32.60636959 1.12844×10⁻⁸ 6.37006×10⁻⁵ H1-4 H1.4 linker histone, cluster member [Source:HGNC Symbol;Acc:HGNC:4718] ENSG00000171570 1.384045622 -0.419382355 27.33424231 1.71154×10⁻⁷ 0.000724621 RAB4B-EGLN2 RAB4B-EGLN2 readthrough (NMD candidate) [Source:HGNC Symbol;Acc:HGNC:44465] ENSG00000084070 -0.296305422 6.738678619 23.3404188 1.35718×10⁻⁶ 0.004596764 SMAP2 small ArfGAP2 [Source:HGNC Symbol;Acc:HGNC:25082] ENSG00000103528 0.742628658 0.660627565 19.89188104 8.19476×10⁻⁶ 0.023129712 SYT17 synaptotagmin 17 [Source:HGNC Symbol;Acc:HGNC:24119] chr3|-|45568133|45637894 0.329651452 2.961292083 17.95456028 2.26242×10⁻⁵ 0.050928266 chr7|-|120722088|120884459 0.220481038 5.424892423 17.79683804 2.45791×10⁻⁵ 0.050928266 chr6|.|70514778|70576433 0.317854207 4.057239769 17.61353566 2.70655×10⁻⁵ 0.050928266 ENSG00000231663 0.825028712 -0.002144218 16.76494125 4.23078×10⁻⁵ 0.059048884 COA6-AS1 COA6 antisense RNA 1 [Source:HGNC Symbol;Acc:HGNC:40825] ENSG00000108932 0.217086639 5.293972707 16.72257685 4.32631×10⁻⁵ 0.059048884 SLC16A6 solute carrier family 16 member 6 [Source:HGNC Symbol;Acc:HGNC:10927] ENSG00000166091 -0.300489201 3.237928158 16.54552647 4.74959×10⁻⁵ 0.059048884 CMTM5 CKLF like MARVEL transmembrane domain containing 5 [Source:HGNC Symbol;Acc:HGNC:19176] ENSG00000152894 0.313897754 3.053789615 16.4911751 4.8877×10⁻⁵ 0.059048884 PTPRK protein tyrosine phosphatase receptor type K [Source:HGNC Symbol;Acc:HGNC:9674] chr6|-|32888761|32941594 0.199017448 4.600545182 16.41005066 5.1014×10⁻⁵ 0.059048884 ENSG00000137822 -0.266919972 3.384625621 16.3627927 5.23019×10⁻⁵ 0.059048884 TUBGCP4 tubulin gamma complex associated protein 4 [Source:HGNC Symbol;Acc:HGNC:16691] ENSG00000119280 -0.296697647 2.935253383 16.03428476 6.22058×10⁻⁵ 0.06412104 C1orf198 chromosome 1 open reading frame 198 [Source:HGNC Symbol;Acc:HGNC:25900] ENSG00000134294 -0.191680164 8.004342413 15.96962062 6.43672×10⁻⁵ 0.06412104 SLC38A2 solute carrier family 38 member 2 [Source:HGNC Symbol;Acc:HGNC:13448] ENSG00000118520 -0.265640827 4.079454811 15.82451837 6.94961×10⁻⁵ 0.065384256 ARG1 arginase 1 [Source:HGNC Symbol;Acc:HGNC:663] chr12|-|70531159|70637922 0.217701182 4.973764891 15.5522941 8.02542×10⁻⁵ 0.069985352 ENSG00000184226 0.254850495 5.531625636 15.49664714 8.26517×10⁻⁵ 0.069985352 PCDH9 protocadherin 9 [Source:HGNC Symbol;Acc:HGNC:8661] ENSG00000096060 -0.373474055 5.778941128 15.24657113 9.43479×10⁻⁵ 0.076084831 FKBP5 FKBP prolyl isomerase 5 [Source:HGNC Symbol;Acc:HGNC:3721] ENSG00000214827 0.497508124 1.643255066 14.67631358 0.00012764 0.098253989 MTCP1 mature T cell proliferation 1 [Source:HGNC Symbol;Acc:HGNC:7423] Table S2-3. Differentially expressed gene (from limma)
ensembl_gene_id logFC AveExpr t P value FDR gene_name Description ENSG00000124575 0.309467991 5.45596542 8.034084723 1.03714×10⁻⁶ 0.017563963 H1-3 H1.3 linker histone, cluster member [Source:HGNC Symbol;Acc:HGNC:4717] ENSG00000187837 0.306700585 6.983057696 7.180006826 3.88287×10⁻⁶ 0.032878228 H1-2 H1.2 linker histone, cluster member [Source:HGNC Symbol;Acc:HGNC:4716] ENSG00000168298 0.331759486 5.99733428 6.104367275 2.34919×10⁻⁵ 0.09869282 H1-4 H1.4 linker histone, cluster member [Source:HGNC Symbol;Acc:HGNC:4718] ENSG00000239839 -0.581143124 3.700863559 -5.981680364 2.91387×10⁻⁵ 0.09869282 DEFA3 defensin alpha 3 [Source:HGNC Symbol;Acc:HGNC:2762] ENSG00000118113 -0.46949816 1.537650125 -6.001373067 2.81445×10⁻⁵ 0.09869282 MMP8 matrix metallopeptidase 8 [Source:HGNC Symbol;Acc:HGNC:7175] Table S5. Enriched Reactome pathways of genes co-expressed with the 3 histone genes
co-
expression setID Description GeneRatio BgRatio P value FDR gene ID Positively
co-expressedR-HSA-202427 Phosphorylation of CD3 and TCR zeta chains 7/241 22/10856 3.12608×10⁻⁷ 0.000242271 PAG1/HLA-DRB1/HLA-DQA1/HLA-DRB5/HLA-DPB1/HLA-DPA1/HLA-DQA2 Positively
co-expressedR-HSA-202430 Translocation of ZAP-70 to Immunological synapse 6/241 19/10856 2.39515×10⁻⁶ 0.000928119 HLA-DRB1/HLA-DQA1/HLA-DRB5/HLA-DPB1/HLA-DPA1/HLA-DQA2 Positively
co-expressedR-HSA-389948 PD-1 signaling 6/241 23/10856 8.27074×10⁻⁶ 0.002136609 HLA-DRB1/HLA-DQA1/HLA-DRB5/HLA-DPB1/HLA-DPA1/HLA-DQA2 Positively
co-expressedR-HSA-202433 Generation of second messenger molecules 6/241 34/10856 8.98002×10⁻⁵ 0.017398789 HLA-DRB1/HLA-DQA1/HLA-DRB5/HLA-DPB1/HLA-DPA1/HLA-DQA2 Positively
co-expressedR-HSA-388841 Costimulation by the CD28 family 8/241 69/10856 0.000136543 0.021164141 MAP3K8/CTLA4/HLA-DRB1/HLA-DQA1/HLA-DRB5/HLA-DPB1/HLA-DPA1/HLA-DQA2 Negatively
co-expressedR-HSA-76002 Platelet activation, signaling and aggregation 25/418 263/10856 2.81052×10⁻⁵ 0.031421596 ITGA2B/CD9/VCL/PIK3CB/GNA15/SYTL4/PIK3R2/VWF/SPARC/RAP1B/F2RL3/THBS1/MMRN1/EGF/PDPK1/FERMT3/GNAQ/PPBP/SELP/GP5/GP1BA/PDGFA/GP1BB/LY6G6F/ITGB3 Negatively
co-expressedR-HSA-76009 Platelet Aggregation (Plug Formation) 8/418 39/10856 9.7169×10⁻⁵ 0.039158317 ITGA2B/VWF/RAP1B/PDPK1/GP5/GP1BA/GP1BB/ITGB3 Negatively
co-expressedR-HSA-114608 Platelet degranulation 15/418 129/10856 0.00012681 0.039158317 ITGA2B/CD9/VCL/SYTL4/VWF/SPARC/THBS1/MMRN1/EGF/FERMT3/PPBP/SELP/PDGFA/LY6G6F/ITGB3 Negatively
co-expressedR-HSA-5683057 MAPK family signaling cascades 27/418 325/10856 0.000140101 0.039158317 ITGA2B/VCL/PIK3CB/PSME4/SPTB/RBX1/PSMB5/PIK3R2/VWF/PSMD9/CCND3/FOXO3/KBTBD7/FLT3/PSPN/RAP1B/DLG4/EGF/RASA1/MOV10/KIT/BRAF/KALRN/BCL2L1/IL3RA/PDGFA/ITGB3 Negatively
co-expressedR-HSA-76005 Response to elevated platelet cytosolic Ca2+ 15/418 134/10856 0.000194527 0.043496173 ITGA2B/CD9/VCL/SYTL4/VWF/SPARC/THBS1/MMRN1/EGF/FERMT3/PPBP/SELP/PDGFA/LY6G6F/ITGB3
doi: 10.3967/bes2023.053
Traditional Chinese Medicine Treatment, Gua Sha, can Induce Subtle Molecular Changes in Gene Expression
-
Abstract:
Objective Here, we explored molecular changes that could potentially mediate healing effects of Gua Sha — a method employed by the Chinese traditional medicine with proven track records of safe and efficient applications dating back to ancient times as well as support from randomized controlled trials performed by modern medical studies — yet remaining almost entirely unexplored by the modern-day high-throughput methods of the -omics sciences. Methods We investigated transcriptome changes occurring shortly after Gua Sha treatment in the whole blood of healthy volunteers using bulk RNA-seq analysis. We applied various analytical tools to identify genes with consistent expression changes in multiple individuals in response to Gua Sha and their networks. Results We found that while the changes were very subtle and individual-specific, we could identify consistent upregulation of three histone genes. Further analysis of the potential regulatory networks of these histone genes revealed the enrichment of functions involved in the immune response and inflammation. Conclusion The significance of these results in the context of potential effects of Gua Sha and the next steps in exploring the molecular mechanisms of action of this technique are discussed. -
Key words:
- Gua Sha /
- Transcriptomics /
- Histone /
- Long non-coding RNAs /
- Chinese traditional medicine /
- Immune system /
- Inflammation
注释:1) COMPETING INTERESTS: -
Figure 1. Effects of Gua Sha on the total blood transcriptome. The figure shows the PCA plots of the study participants before and after Gua Sha treatment based on (A–C) the original expression levels of all genes and vlincRNAs or (D–F) after the individual-specific variance was removed.
S1. Effects of Gua Sha on the total blood transcriptome. The figure shows the UMAP analysis plots of the study participants before and after Gua Sha based on (A–C)the original expression levels of all genes and vlincRNAs or (D–F) after the individual-specific variance was removed.
Figure 2. Identification of the histone genes induced by Gua Sha treatment and their potential regulatory networks. (A) Venn diagram of the DEG sets identified by DESeq2, edgeR and limma methods. (B) Expression levels of the 3 histone genes, H1-2, H1-3, and H1-4, before and after the Gua Sha treatment. The P values were determined using a two-tailed paired Wilcoxon test are shown in the figure. (C and D) Venn diagrams of genes (C) positively and (D) negatively co-expressed with the 3 histone genes.
S2. Enriched GO terms and Reactome pathways of the 3 histone genes. (A) Enriched GO terms in the Biological Process (BP) category. (B) Enriched Reactomepathways. (C&D) Diagrams of the (C) “Programmed Cell Death” and (D) “Cell Senescence” Reactome pathways with the enriched pathways highlighted. These two panels are derivatives offigures from Reactome website which are licensed under Creative Comments Attribution 4.0 International (CC BY 4.0) License.
Figure 3. Enriched GO terms and Reactome pathways of genes positively co-expressed with the 3 histone genes. (A) Enriched Reactome pathways. (B) Diagram of the “Adaptive Immune System” Reactome pathways with the enriched pathways highlighted. This panel is a derivative from a figure from the Reactome website which is licensed under Creative Commons Attribution 4.0 International (CC BY 4.0) License.
Figure 4. Enriched GO terms and Reactome pathways of genes negatively co-expressed with the 3 histone genes. (A–C) Enriched GO terms corresponding to (A) BP, (B) MF and (C) CC categories. The X-axes represents the number of genes in each category. (D) Enriched Reactome pathways. (E) Diagram of the “Platelet activation, signaling and aggregation” Reactome pathways with the enriched pathways highlighted. This panel is a derivative from a figure from the Reactome website which is licensed under Creative Commons Attribution 4.0 International (CC BY 4.0) License. GO, gene ontology; BP, biological process; MF, molecular function; CC, cellular component.
S1. Information of the samples
Sample id Participant age Information Participant id 831 21 before guasha 1 832 21 after guasha 1 833 21 before guasha 2 834 21 after guasha 2 835 21 before guasha 3 836 21 after guasha 3 837 20 before guasha 4 838 20 after guasha 4 839 21 before guasha 5 840 21 after guasha 5 841 25 before guasha 6 842 25 after guasha 6 843 26 before guasha 7 844 26 after guasha 7 845 21 before guasha 8 846 21 after guasha 8 847 20 before guasha 9 848 20 after guasha 9  下载: 导出CSV
S4. Enriched GO terms of genes co-expressed with the 3 histone genes
co-
expression setGO
categoryID Description GeneRatio BgRatio P value FDR gene ID Positively
co-expressedCC GO:0042101 T cell receptor complex 13/412 135/21872 1.70549×10⁻⁶ 0.000740185 TRGV5/TRBC1/TRBC2/TRAV2/TRAV4/TRAV10/TRAV20/TRDV1/TRBV3-1/TRBV13/TRAC/TRBV28/TRAV1-1 Negatively
co-expressedBP GO:0030168 platelet activation 19/643 184/21081 3.78922×10⁻⁶ 0.014034576 ITGA2B/CD9/VCL/PIK3CB/F2RL3/FERMT3/ENTPD2/GNA15/PF4V1/VWF/GNAQ/DMTN/SELP/GP5/GP1BA/PDGFA/GP1BB/ITGB3/PDPK1 Negatively
co-expressedBP GO:0002576 platelet degranulation 16/643 140/21081 5.98362×10⁻⁶ 0.014034576 ITGA2B/CD9/VCL/SYTL4/THBS1/MMRN1/FERMT3/LY6G6F/VWF/SPARC/EGF/DMTN/PPBP/SELP/PDGFA/ITGB3 Negatively
co-expressedBP GO:0031331 positive regulation of cellular catabolic process 31/643 441/21081 1.5926×10⁻⁵ 0.022382635 UPF1/PIK3CB/TRIB3/TRIM14/METTL16/SH3BP4/TRIM5/ROCK2/UBQLN1/MDM2/MOV10/PLEKHF1/ENDOG/SNX33/DDRGK1/YTHDF2/TNF/SIRT6/GSK3B/RBX1/ZC3HAV1/TFEB/FOXO3/EGF/SESN3/BAG3/DAB2/SCOC/FLCN/TICAM1/PUM1 Negatively
co-expressedBP GO:0072401 signal transduction involved in DNA integrity checkpoint 11/643 82/21081 3.82905×10⁻⁵ 0.022382635 CNOT3/CNOT6/GADD45A/MDM2/CNOT10/CHEK2/E2F4/BABAM1/CASP2/RINT1/PML Negatively
co-expressedBP GO:0072422 signal transduction involved in DNA damage checkpoint 11/643 82/21081 3.82905×10⁻⁵ 0.022382635 CNOT3/CNOT6/GADD45A/MDM2/CNOT10/CHEK2/E2F4/BABAM1/CASP2/RINT1/PML Negatively
co-expressedBP GO:0072413 signal transduction involved in mitotic cell cycle checkpoint 10/643 68/21081 3.83568×10⁻⁵ 0.022382635 CNOT3/CNOT6/GADD45A/MDM2/CNOT10/CHEK2/E2F4/CASP2/RINT1/PML Negatively
co-expressedBP GO:1902402 signal transduction involved in mitotic DNA damage checkpoint 10/643 68/21081 3.83568×10⁻⁵ 0.022382635 CNOT3/CNOT6/GADD45A/MDM2/CNOT10/CHEK2/E2F4/CASP2/RINT1/PML Negatively
co-expressedBP GO:1902403 signal transduction involved in mitotic DNA integrity checkpoint 10/643 68/21081 3.83568×10⁻⁵ 0.022382635 CNOT3/CNOT6/GADD45A/MDM2/CNOT10/CHEK2/E2F4/CASP2/RINT1/PML Negatively
co-expressedBP GO:0072395 signal transduction involved in cell cycle checkpoint 11/643 83/21081 4.29426×10⁻⁵ 0.022382635 CNOT3/CNOT6/GADD45A/MDM2/CNOT10/CHEK2/E2F4/BABAM1/CASP2/RINT1/PML Negatively
co-expressedBP GO:0045652 regulation of megakaryocyte differentiation 11/643 84/21081 4.80728×10⁻⁵ 0.022550949 ITGA2B/THBS1/MOV10/MTURN/L3MBTL1/H3C14/H3C8/TESC/KAT2B/GP1BA/H4C1 Negatively
co-expressedBP GO:0031589 cell-substrate adhesion 27/643 393/21081 8.16793×10⁻⁵ 0.032790264 ITGA2B/VCL/ARHGAP6/PIK3CB/CORO1C/ROCK2/THBS1/RASA1/FERMT3/EPHB1/JAM3/ACTN3/LAMC3/GSK3B/CTTN/OLFM4/VWF/MKLN1/RAB1A/DMTN/LIMS1/TACSTD2/BCAM/ITGB3/CEACAM6/PDPK1/TBCD Negatively
co-expressedBP GO:0009266 response to temperature stimulus 21/643 269/21081 8.54454×10⁻⁵ 0.032790264 CREBBP/GLRX2/ADRB1/NTSR1/HSPA8/PTGES3/HSPH1/HTR2B/NUP42/THBS1/EPHB1/IGFBP7/SCARA5/UCP2/IRAK1/GSK3B/GMPR/DNAJA4/BAG3/DNAJB4/DNAJB6 Negatively
co-expressedBP GO:0006936 muscle contraction 26/643 374/21081 9.08705×10⁻⁵ 0.032790264 MAP2K3/VCL/CALCRL/CALD1/DOCK4/ROCK2/HTR2B/RAP1GDS1/OXTR/MYBPC1/ACTN3/MYLK/CTTN/CNN1/SLC6A8/TPM1/GSTO1/KIT/UCN/TPM4/SYNM/MYL4/ARG2/TMOD1/SLMAP/TCAP Negatively
co-expressedBP GO:0030219 megakaryocyte differentiation 12/643 108/21081 0.000113029 0.037121885 ITGA2B/THBS1/MOV10/MTURN/L3MBTL1/H3C14/H3C8/TESC/KAT2B/KIT/GP1BA/H4C1 Negatively
co-expressedBP GO:0007160 cell-matrix adhesion 20/643 257/21081 0.000130468 0.037121885 ITGA2B/VCL/ARHGAP6/PIK3CB/CORO1C/ROCK2/THBS1/RASA1/FERMT3/JAM3/ACTN3/GSK3B/CTTN/MKLN1/DMTN/LIMS1/BCAM/ITGB3/CEACAM6/PDPK1 Negatively
co-expressedBP GO:0003012 muscle system process 31/643 494/21081 0.000132949 0.037121885 MAP2K3/VCL/CALCRL/MAP2K4/ERRFI1/CALD1/DOCK4/ROCK2/HTR2B/RAP1GDS1/OXTR/MYBPC1/ACTN3/MYLK/CTTN/MTPN/FOXO3/CNN1/SLC6A8/TPM1/GSTO1/KIT/UCN/TPM4/SYNM/MYL4/ARG2/TMOD1/SORBS2/SLMAP/TCAP Negatively
co-expressedBP GO:0042770 signal transduction in response to DNA damage 14/643 144/21081 0.000134569 0.037121885 CNOT3/CNOT6/GADD45A/MDM2/BATF/CNOT10/CHEK2/E2F4/BABAM1/FOXO3/ATAD5/CASP2/RINT1/PML Negatively
co-expressedBP GO:0007093 mitotic cell cycle checkpoint 17/643 200/21081 0.000143505 0.037121885 CNOT3/CNOT6/GADD45A/TOP2A/MDM2/CDK5RAP2/NABP2/BCL2L1/CNOT10/CHEK2/E2F4/CASP2/RINT1/PML/MAD2L1/WEE1/BLM Negatively
co-expressedBP GO:0006977 DNA damage response, signal transduction by p53 class mediator resulting in cell cycle arrest 9/643 65/21081 0.000150355 0.037121885 CNOT3/CNOT6/GADD45A/MDM2/CNOT10/CHEK2/E2F4/CASP2/PML Negatively
co-expressedBP GO:0072431 signal transduction involved in mitotic G1 DNA damage checkpoint 9/643 66/21081 0.000169454 0.037852724 CNOT3/CNOT6/GADD45A/MDM2/CNOT10/CHEK2/E2F4/CASP2/PML Negatively
co-expressedBP GO:1902400 intracellular signal transduction involved in G1 DNA damage checkpoint 9/643 66/21081 0.000169454 0.037852724 CNOT3/CNOT6/GADD45A/MDM2/CNOT10/CHEK2/E2F4/CASP2/PML Negatively
co-expressedBP GO:0036293 response to decreased oxygen levels 27/643 415/21081 0.000199619 0.0390948 CREBBP/PSME4/PSMD9/RWDD3/HP1BP3/ROCK2/UBQLN1/MDM2/TLR2/THBS1/HIF1AN/ENDOG/UCP2/OXTR/IRAK1/RBX1/PSMB5/TM9SF4/CUL2/MYB/FOXO3/ATF4/ALAS2/NKX3-1/PML/DDIT4/FIS1 Negatively
co-expressedBP GO:0072331 signal transduction by p53 class mediator 22/643 307/21081 0.000201959 0.0390948 CNOT3/NOP2/CNOT6/GADD45A/ELL3/MDM2/SSRP1/BATF/HIPK1/CNOT10/CHEK2/L3MBTL1/E2F4/NUAK1/CSNK2A1/FOXO3/ATAD5/CASP2/PML/TAF3/DDIT4/BLM Negatively
co-expressedBP GO:0030049 muscle filament sliding 7/643 41/21081 0.000216684 0.0390948 MYBPC1/ACTN3/TPM1/TPM4/MYL4/TMOD1/TCAP Negatively
co-expressedBP GO:0033275 actin-myosin filament sliding 7/643 41/21081 0.000216684 0.0390948 MYBPC1/ACTN3/TPM1/TPM4/MYL4/TMOD1/TCAP Negatively
co-expressedBP GO:1901889 negative regulation of cell junction assembly 7/643 41/21081 0.000216684 0.0390948 ARHGAP6/CORO1C/ROCK2/TLR2/THBS1/TNF/DMTN Negatively
co-expressedBP GO:0051494 negative regulation of cytoskeleton organization 15/643 170/21081 0.000231628 0.040243291 ARHGAP6/CDK5RAP2/SPTB/MTPN/KAT2B/APC2/INPP5K/DMTN/CCNF/TACSTD2/PFN2/HIP1R/TMOD1/SSH2/TBCD Negatively
co-expressedBP GO:0051261 protein depolymerization 12/643 117/21081 0.000242369 0.040605398 KIF2A/HSPA8/DNAJC6/MAP1A/KIF24/MICAL3/SPTB/MTPN/APC2/MICAL2/DMTN/TMOD1 Negatively
co-expressedBP GO:0007596 blood coagulation 25/643 378/21081 0.000265392 0.042929379 ITGA2B/CD9/VCL/PIK3CB/F2RL3/THBS1/MMRN1/FERMT3/H3C14/H3C8/PRKAR2B/ENTPD2/GNA15/PF4V1/VWF/AKAP1/GNAQ/DMTN/SELP/GP5/GP1BA/PDGFA/GP1BB/ITGB3/PDPK1 Negatively
co-expressedBP GO:0031571 mitotic G1 DNA damage checkpoint 9/643 72/21081 0.000331393 0.049274038 CNOT3/CNOT6/GADD45A/MDM2/CNOT10/CHEK2/E2F4/CASP2/PML Negatively
co-expressedBP GO:0007599 hemostasis 25/643 384/21081 0.000336126 0.049274038 ITGA2B/CD9/VCL/PIK3CB/F2RL3/THBS1/MMRN1/FERMT3/H3C14/H3C8/PRKAR2B/ENTPD2/GNA15/PF4V1/VWF/AKAP1/GNAQ/DMTN/SELP/GP5/GP1BA/PDGFA/GP1BB/ITGB3/PDPK1 Negatively
co-expressedBP GO:0050817 coagulation 25/643 384/21081 0.000336126 0.049274038 ITGA2B/CD9/VCL/PIK3CB/F2RL3/THBS1/MMRN1/FERMT3/H3C14/H3C8/PRKAR2B/ENTPD2/GNA15/PF4V1/VWF/AKAP1/GNAQ/DMTN/SELP/GP5/GP1BA/PDGFA/GP1BB/ITGB3/PDPK1 Negatively
co-expressedMF GO:0003779 actin binding 35/659 470/20616 3.54915×10⁻⁶ 0.002825125 VCL/MYH7B/KLHL5/PANX1/CORO1C/CALD1/YWHAH/FLNC/IQGAP2/XIRP2/MAP1A/SYNPO/MYBPC1/MICAL3/ACTN3/MYLK/SPTB/CTTN/DBN1/CNN1/MICAL2/DIAPH3/TPM1/DAAM2/ZNF185/DMTN/TPM4/MYL4/PFN2/LDB3/HIP1R/FLNB/TMOD1/SSH2/TLN2 Negatively
co-expressedMF GO:0046982 protein heterodimerization activity 27/659 330/20616 8.61374×10⁻⁶ 0.003428269 ADRB1/GADD45A/CEACAM8/YWHAH/TOP2A/IRAK2/BMP6/JAM3/BCL2L1/SRGAP2C/IRAK1/KATNA1/CENPW/H3C14/H3C8/ATF4/TPM1/TPM4/RALGAPA2/H2AC13/PDGFA/H2BC14/H4C1/CEACAM6/PIK3R2/HIP1R/TAF3 Negatively
co-expressedMF GO:0008307 structural constituent of muscle 8/659 45/20616 7.91105×10⁻⁵ 0.020990665 MYBPC1/ACTN3/TPM1/TPM4/KRT19/SYNM/SORBS2/TCAP Negatively
co-expressedMF GO:0004674 protein serine/threonine kinase activity 31/659 469/20616 0.000120427 0.022651572 MAP2K3/MAP2K4/CCNK/SGK3/ACVR1/RIOK1/PAK4/IRAK2/ROCK2/BMPR1B/BRAF/KALRN/HIPK1/RPS6KA3/CHEK2/IRAK1/BMPR2/SIK1B/MYLK/NUAK1/GSK3B/EIF2AK1/MAST3/CSNK2A1/CCND3/PIM1/STK40/MAP3K3/HIPK3/CILK1/PDPK1 Negatively
co-expressedMF GO:0060589 nucleoside-triphosphatase regulator activity 27/659 390/20616 0.000154577 0.022651572 ARHGAP6/FNIP2/SMAP2/ARFGAP1/ERRFI1/HSPH1/DOCK4/STARD8/SH3BP4/HTR2B/RAP1GDS1/IQGAP2/RASA1/ARHGAP27/TBC1D3/TBC1D3B/TBC1D22B/RGS18/BAG3/FLCN/GNAQ/DNAJB4/TAGAP/RALGAPA2/DNAJB6/TBCD/AGAP4 Negatively
co-expressedMF GO:0016538 cyclin-dependent protein serine/threonine kinase regulator activity 8/659 50/20616 0.000171227 0.022651572 CCNK/CCNE2/CCND3/CCNG1/KAT2B/CCNI/CCNA1/CCNF Negatively
co-expressedMF GO:0035615 clathrin adaptor activity 5/659 18/20616 0.000199197 0.022651572 STON2/LDLRAP1/DAB2/AP2A1/HIP1R Negatively
co-expressedMF GO:0140312 cargo adaptor activity 5/659 19/20616 0.000263261 0.026194518 STON2/LDLRAP1/DAB2/AP2A1/HIP1R Negatively
co-expressedCC GO:0031091 platelet alpha granule 14/668 102/21872 2.67402×10⁻⁶ 0.000845285 ITGA2B/CD9/SYTL4/THBS1/MMRN1/FERMT3/LY6G6F/VWF/SPARC/EGF/PPBP/SELP/PDGFA/ITGB3 Negatively
co-expressedCC GO:0031092 platelet alpha granule membrane 7/668 23/21872 3.84295×10⁻⁶ 0.000845285 ITGA2B/CD9/SYTL4/LY6G6F/SPARC/SELP/ITGB3 Negatively
co-expressedCC GO:0030016 myofibril 22/668 239/21872 4.61904×10⁻⁶ 0.000845285 VCL/CORO1C/CALD1/FLNC/DCTN4/XIRP2/SYNPO/MYBPC1/KAT2B/TPM1/BAG3/TPM4/MTM1/KRT19/SYNM/MYL4/DNAJB6/LDB3/FLNB/TMOD1/SORBS2/TCAP Negatively
co-expressedCC GO:0043292 contractile fiber 22/668 251/21872 1.01267×10⁻⁵ 0.001389892 VCL/CORO1C/CALD1/FLNC/DCTN4/XIRP2/SYNPO/MYBPC1/KAT2B/TPM1/BAG3/TPM4/MTM1/KRT19/SYNM/MYL4/DNAJB6/LDB3/FLNB/TMOD1/SORBS2/TCAP Negatively
co-expressedCC GO:0042641 actomyosin 11/668 81/21872 3.45542×10⁻⁵ 0.003794051 DCTN4/XIRP2/SYNPO/MYLK/DBN1/KAT2B/TPM1/BAG3/TPM4/LDB3/FLNB Negatively
co-expressedCC GO:0030017 sarcomere 18/668 219/21872 0.000144378 0.013210542 CORO1C/FLNC/DCTN4/XIRP2/SYNPO/KAT2B/TPM1/BAG3/TPM4/MTM1/KRT19/MYL4/DNAJB6/LDB3/FLNB/TMOD1/SORBS2/TCAP Negatively
co-expressedCC GO:0030055 cell-substrate junction 30/668 483/21872 0.00020871 0.016368807 ITGA2B/CD9/VCL/REXO2/HSPA8/CORO1C/FLNC/STARD8/PAK4/DCTN4/FERMT3/XIRP2/SLC4A2/PCBP2/TGM2/ACTN3/MRC2/CTTN/CNN1/DCAF6/PRUNE1/ZNF185/DAB2/TPM4/LIMS1/ITGB3/FLNB/PDPK1/SORBS2/TLN2 Negatively
co-expressedCC GO:0001725 stress fiber 9/668 71/21872 0.000301135 0.017529376 DCTN4/XIRP2/SYNPO/MYLK/TPM1/BAG3/TPM4/LDB3/FLNB Negatively
co-expressedCC GO:0097517 contractile actin filament bundle 9/668 71/21872 0.000301135 0.017529376 DCTN4/XIRP2/SYNPO/MYLK/TPM1/BAG3/TPM4/LDB3/FLNB Negatively
co-expressedCC GO:0000307 cyclin-dependent protein kinase holoenzyme complex 7/668 44/21872 0.000344238 0.017529376 CCNK/CCNE2/CCND3/CCNG1/CCNI/CCNA1/CCNF Negatively
co-expressedCC GO:0005925 focal adhesion 29/668 475/21872 0.000351226 0.017529376 ITGA2B/CD9/VCL/REXO2/HSPA8/CORO1C/FLNC/STARD8/PAK4/DCTN4/XIRP2/SLC4A2/PCBP2/TGM2/ACTN3/MRC2/CTTN/CNN1/DCAF6/PRUNE1/ZNF185/DAB2/TPM4/LIMS1/ITGB3/FLNB/PDPK1/SORBS2/TLN2 Negatively
co-expressedCC GO:0005884 actin filament 12/668 124/21872 0.000420981 0.019259866 ARHGAP6/JAM3/ACTN3/CTTN/DBN1/APC2/MICAL2/TPM1/DMTN/TPM4/LDB3/TMOD1 Negatively
co-expressedCC GO:0032432 actin filament bundle 9/668 79/21872 0.000670616 0.028320644 DCTN4/XIRP2/SYNPO/MYLK/TPM1/BAG3/TPM4/LDB3/FLNB
下载: 导出CSV
S2-1. Differentially expressed gene (from DESeq2)
ensembl_gene_id baseMean log2FoldChange lfcSE Stat P value FDR gene_name description ENSG00000214827 64.16297166 1.493942715 0.260220811 5.741057803 9.4087×10⁻⁹ 0.000154256 MTCP1 mature T cell proliferation 1 [Source:HGNC Symbol;Acc:HGNC:7423] ENSG00000124575 798.5727007 0.296755402 0.05441918 5.453139882 4.94881×10⁻⁸ 0.000270453 H1-3 H1.3 linker histone, cluster member [Source:HGNC Symbol;Acc:HGNC:4717] ENSG00000187837 2289.23317 0.300660272 0.054600331 5.506565042 3.65903×10⁻⁸ 0.000270453 H1-2 H1.2 linker histone, cluster member [Source:HGNC Symbol;Acc:HGNC:4716] ENSG00000204217 480.6833203 -0.406750982 0.080115793 -5.077038679 3.83363×10⁻⁷ 0.001571308 BMPR2 bone morphogenetic protein receptor type 2 [Source:HGNC Symbol;Acc:HGNC:1078] ENSG00000168298 1157.053419 0.328110533 0.067928283 4.830249209 1.36362×10⁻⁶ 0.004471319 H1-4 H1.4 linker histone, cluster member [Source:HGNC Symbol;Acc:HGNC:4718] ENSG00000096060 979.6341952 -0.39402708 0.086629147 -4.548435393 5.40462×10⁻⁶ 0.012658399 FKBP5 FKBP prolyl isomerase 5 [Source:HGNC Symbol;Acc:HGNC:3721] ENSG00000110442 371.7090693 -0.600848784 0.131946879 -4.553717294 5.27062×10⁻⁶ 0.012658399 COMMD9 COMM domain containing 9 [Source:HGNC Symbol;Acc:HGNC:25014] ENSG00000084070 1900.52367 -0.289763837 0.069497266 -4.169427832 3.05365×10⁻⁵ 0.060009013 SMAP2 small ArfGAP2 [Source:HGNC Symbol;Acc:HGNC:25082] ENSG00000123739 620.5511379 -0.483504896 0.116447888 -4.152113929 3.29418×10⁻⁵ 0.060009013 PLA2G12A phospholipase A2 group XIIA [Source:HGNC Symbol;Acc:HGNC:18554] ENSG00000113369 11149.31946 0.311698679 0.076233343 4.088744733 4.33714×10⁻⁵ 0.066977594 ARRDC3 arrestin domain containing 3 [Source:HGNC Symbol;Acc:HGNC:29263] ENSG00000131724 2109.54573 -0.248040047 0.060786585 -4.080506378 4.49377×10⁻⁵ 0.066977594 IL13RA1 interleukin 13 receptor subunit alpha 1 [Source:HGNC Symbol;Acc:HGNC:5974] ENSG00000134294 4578.9579 -0.170354167 0.042931362 -3.968058736 7.24605×10⁻⁵ 0.098999127 SLC38A2 solute carrier family 38 member 2 [Source:HGNC Symbol;Acc:HGNC:13448]
下载: 导出CSV
S2-2. Differentially expressed gene (from edgeR)
ensembl_gene_id logFC logCPM LR P value FDR gene_name Description ENSG00000124575 0.309799605 5.487281968 43.38682354 4.49203×10⁻¹¹ 7.60725×10⁻⁷ H1-3 H1.3 linker histone, cluster member [Source:HGNC Symbol;Acc:HGNC:4717] ENSG00000187837 0.306963565 7.005778529 38.96442011 4.316×10⁻¹⁰ 3.65458×10⁻⁶ H1-2 H1.2 linker histone, cluster member [Source:HGNC Symbol;Acc:HGNC:4716] ENSG00000168298 0.333311562 6.020909117 32.60636959 1.12844×10⁻⁸ 6.37006×10⁻⁵ H1-4 H1.4 linker histone, cluster member [Source:HGNC Symbol;Acc:HGNC:4718] ENSG00000171570 1.384045622 -0.419382355 27.33424231 1.71154×10⁻⁷ 0.000724621 RAB4B-EGLN2 RAB4B-EGLN2 readthrough (NMD candidate) [Source:HGNC Symbol;Acc:HGNC:44465] ENSG00000084070 -0.296305422 6.738678619 23.3404188 1.35718×10⁻⁶ 0.004596764 SMAP2 small ArfGAP2 [Source:HGNC Symbol;Acc:HGNC:25082] ENSG00000103528 0.742628658 0.660627565 19.89188104 8.19476×10⁻⁶ 0.023129712 SYT17 synaptotagmin 17 [Source:HGNC Symbol;Acc:HGNC:24119] chr3|-|45568133|45637894 0.329651452 2.961292083 17.95456028 2.26242×10⁻⁵ 0.050928266 chr7|-|120722088|120884459 0.220481038 5.424892423 17.79683804 2.45791×10⁻⁵ 0.050928266 chr6|.|70514778|70576433 0.317854207 4.057239769 17.61353566 2.70655×10⁻⁵ 0.050928266 ENSG00000231663 0.825028712 -0.002144218 16.76494125 4.23078×10⁻⁵ 0.059048884 COA6-AS1 COA6 antisense RNA 1 [Source:HGNC Symbol;Acc:HGNC:40825] ENSG00000108932 0.217086639 5.293972707 16.72257685 4.32631×10⁻⁵ 0.059048884 SLC16A6 solute carrier family 16 member 6 [Source:HGNC Symbol;Acc:HGNC:10927] ENSG00000166091 -0.300489201 3.237928158 16.54552647 4.74959×10⁻⁵ 0.059048884 CMTM5 CKLF like MARVEL transmembrane domain containing 5 [Source:HGNC Symbol;Acc:HGNC:19176] ENSG00000152894 0.313897754 3.053789615 16.4911751 4.8877×10⁻⁵ 0.059048884 PTPRK protein tyrosine phosphatase receptor type K [Source:HGNC Symbol;Acc:HGNC:9674] chr6|-|32888761|32941594 0.199017448 4.600545182 16.41005066 5.1014×10⁻⁵ 0.059048884 ENSG00000137822 -0.266919972 3.384625621 16.3627927 5.23019×10⁻⁵ 0.059048884 TUBGCP4 tubulin gamma complex associated protein 4 [Source:HGNC Symbol;Acc:HGNC:16691] ENSG00000119280 -0.296697647 2.935253383 16.03428476 6.22058×10⁻⁵ 0.06412104 C1orf198 chromosome 1 open reading frame 198 [Source:HGNC Symbol;Acc:HGNC:25900] ENSG00000134294 -0.191680164 8.004342413 15.96962062 6.43672×10⁻⁵ 0.06412104 SLC38A2 solute carrier family 38 member 2 [Source:HGNC Symbol;Acc:HGNC:13448] ENSG00000118520 -0.265640827 4.079454811 15.82451837 6.94961×10⁻⁵ 0.065384256 ARG1 arginase 1 [Source:HGNC Symbol;Acc:HGNC:663] chr12|-|70531159|70637922 0.217701182 4.973764891 15.5522941 8.02542×10⁻⁵ 0.069985352 ENSG00000184226 0.254850495 5.531625636 15.49664714 8.26517×10⁻⁵ 0.069985352 PCDH9 protocadherin 9 [Source:HGNC Symbol;Acc:HGNC:8661] ENSG00000096060 -0.373474055 5.778941128 15.24657113 9.43479×10⁻⁵ 0.076084831 FKBP5 FKBP prolyl isomerase 5 [Source:HGNC Symbol;Acc:HGNC:3721] ENSG00000214827 0.497508124 1.643255066 14.67631358 0.00012764 0.098253989 MTCP1 mature T cell proliferation 1 [Source:HGNC Symbol;Acc:HGNC:7423]
下载: 导出CSV
S2-3. Differentially expressed gene (from limma)
ensembl_gene_id logFC AveExpr t P value FDR gene_name Description ENSG00000124575 0.309467991 5.45596542 8.034084723 1.03714×10⁻⁶ 0.017563963 H1-3 H1.3 linker histone, cluster member [Source:HGNC Symbol;Acc:HGNC:4717] ENSG00000187837 0.306700585 6.983057696 7.180006826 3.88287×10⁻⁶ 0.032878228 H1-2 H1.2 linker histone, cluster member [Source:HGNC Symbol;Acc:HGNC:4716] ENSG00000168298 0.331759486 5.99733428 6.104367275 2.34919×10⁻⁵ 0.09869282 H1-4 H1.4 linker histone, cluster member [Source:HGNC Symbol;Acc:HGNC:4718] ENSG00000239839 -0.581143124 3.700863559 -5.981680364 2.91387×10⁻⁵ 0.09869282 DEFA3 defensin alpha 3 [Source:HGNC Symbol;Acc:HGNC:2762] ENSG00000118113 -0.46949816 1.537650125 -6.001373067 2.81445×10⁻⁵ 0.09869282 MMP8 matrix metallopeptidase 8 [Source:HGNC Symbol;Acc:HGNC:7175]
下载: 导出CSV
S5. Enriched Reactome pathways of genes co-expressed with the 3 histone genes
co-
expression setID Description GeneRatio BgRatio P value FDR gene ID Positively
co-expressedR-HSA-202427 Phosphorylation of CD3 and TCR zeta chains 7/241 22/10856 3.12608×10⁻⁷ 0.000242271 PAG1/HLA-DRB1/HLA-DQA1/HLA-DRB5/HLA-DPB1/HLA-DPA1/HLA-DQA2 Positively
co-expressedR-HSA-202430 Translocation of ZAP-70 to Immunological synapse 6/241 19/10856 2.39515×10⁻⁶ 0.000928119 HLA-DRB1/HLA-DQA1/HLA-DRB5/HLA-DPB1/HLA-DPA1/HLA-DQA2 Positively
co-expressedR-HSA-389948 PD-1 signaling 6/241 23/10856 8.27074×10⁻⁶ 0.002136609 HLA-DRB1/HLA-DQA1/HLA-DRB5/HLA-DPB1/HLA-DPA1/HLA-DQA2 Positively
co-expressedR-HSA-202433 Generation of second messenger molecules 6/241 34/10856 8.98002×10⁻⁵ 0.017398789 HLA-DRB1/HLA-DQA1/HLA-DRB5/HLA-DPB1/HLA-DPA1/HLA-DQA2 Positively
co-expressedR-HSA-388841 Costimulation by the CD28 family 8/241 69/10856 0.000136543 0.021164141 MAP3K8/CTLA4/HLA-DRB1/HLA-DQA1/HLA-DRB5/HLA-DPB1/HLA-DPA1/HLA-DQA2 Negatively
co-expressedR-HSA-76002 Platelet activation, signaling and aggregation 25/418 263/10856 2.81052×10⁻⁵ 0.031421596 ITGA2B/CD9/VCL/PIK3CB/GNA15/SYTL4/PIK3R2/VWF/SPARC/RAP1B/F2RL3/THBS1/MMRN1/EGF/PDPK1/FERMT3/GNAQ/PPBP/SELP/GP5/GP1BA/PDGFA/GP1BB/LY6G6F/ITGB3 Negatively
co-expressedR-HSA-76009 Platelet Aggregation (Plug Formation) 8/418 39/10856 9.7169×10⁻⁵ 0.039158317 ITGA2B/VWF/RAP1B/PDPK1/GP5/GP1BA/GP1BB/ITGB3 Negatively
co-expressedR-HSA-114608 Platelet degranulation 15/418 129/10856 0.00012681 0.039158317 ITGA2B/CD9/VCL/SYTL4/VWF/SPARC/THBS1/MMRN1/EGF/FERMT3/PPBP/SELP/PDGFA/LY6G6F/ITGB3 Negatively
co-expressedR-HSA-5683057 MAPK family signaling cascades 27/418 325/10856 0.000140101 0.039158317 ITGA2B/VCL/PIK3CB/PSME4/SPTB/RBX1/PSMB5/PIK3R2/VWF/PSMD9/CCND3/FOXO3/KBTBD7/FLT3/PSPN/RAP1B/DLG4/EGF/RASA1/MOV10/KIT/BRAF/KALRN/BCL2L1/IL3RA/PDGFA/ITGB3 Negatively
co-expressedR-HSA-76005 Response to elevated platelet cytosolic Ca2+ 15/418 134/10856 0.000194527 0.043496173 ITGA2B/CD9/VCL/SYTL4/VWF/SPARC/THBS1/MMRN1/EGF/FERMT3/PPBP/SELP/PDGFA/LY6G6F/ITGB3
下载: 导出CSV
-
[1] So JTY. Treatment of disease with acupuncture. Paradigm Publications. 1987. [2] Zhang XQ, Hao WS. Holographic meridian scraping therapy. Foreign Languages Press. 2000. [3] Tsai PS, Lee PH, Wang MY. Demographics, training, and practice patterns of practitioners of folk medicine in Taiwan: a survey of the Taipei Metropolitan Area. J Altern Complement Med, 2008; 14, 1243−8. doi: 10.1089/acm.2008.0316 [4] Nielsen A. Gua Sha: a traditional technique for modern practice. 2nd ed. Churchill Livingstone. 2012. [5] Tu WZ, Cheng RD, Hu J, et al. Combination treatment with Gua Sha and Blood-letting causes attenuation of systemic inflammation, activated coagulation, tissue ischemia and injury during heatstroke in rats. Chin J Integr Med, 2015; 21, 610−7. doi: 10.1007/s11655-014-1816-4 [6] Yang M, Zhang HY, Yue RZ, et al. Gua Sha attenuates thermal hyperalgesia and decreases proinflammatory cytokine expression in serum in rats with lumbar disc herniation induced by autologous nucleus pulposus. J Tradit Chin Med, 2018; 38, 698−704. doi: 10.1016/S0254-6272(18)30908-7 [7] Wang YW, Xi ZW, Pu B, et al. Gua sha therapy for chronic low back pain: a protocol for systematic review. Medicine (Baltimore), 2020; 99, e20606. doi: 10.1097/MD.0000000000020606 [8] Xu X, Liao HC, Tian YJ, et al. The effect of scraping therapy on perimenopausal syndrome: a synthesis of evidence. Complement Med Res, 2018; 25, 413−6. doi: 10.1159/000490910 [9] Braun M, Schwickert M, Nielsen A, et al. Effectiveness of traditional Chinese "Gua Sha" therapy in patients with chronic neck pain: a randomized controlled trial. Pain Med, 2011; 12, 362−9. doi: 10.1111/j.1526-4637.2011.01053.x [10] Lauche R, Wübbeling K, Lüdtke R, et al. Randomized controlled pilot study: pain intensity and pressure pain thresholds in patients with neck and low back pain before and after Traditional East Asian "Gua Sha" therapy. Am J Chin Med, 2012; 40, 905−17. doi: 10.1142/S0192415X1250067X [11] Saha FJ, Brummer G, Lauche R, et al. Gua Sha therapy for chronic low back pain: a randomized controlled trial. Complement Ther Clin Pract, 2019; 34, 64−9. doi: 10.1016/j.ctcp.2018.11.002 [12] Wang XQ, Duan PB, Zheng M, et al. Effect of scraping therapy on chronic low back pain: a systematic review and meta-analysis of randomized controlled trials. J Manipulative Physiol Ther, 2021; 44, 255−70. doi: 10.1016/j.jmpt.2020.08.003 [13] Xie XL, Lu LQ, Zhou XP, et al. Effect of Gua Sha therapy on patients with diabetic peripheral neuropathy: a randomized controlled trial. Complement Ther Clin Pract, 2019; 35, 348−52. doi: 10.1016/j.ctcp.2019.03.018 [14] Ren Q, Yu XY, Liao FJ, et al. Effects of Gua Sha therapy on perimenopausal syndrome: a systematic review and meta-analysis of randomized controlled trials. Complement Ther Clin Pract, 2018; 31, 268−77. doi: 10.1016/j.ctcp.2018.03.012 [15] Yuen JWM, Tsang WWN, Tse SHM, et al. The effects of Gua sha on symptoms and inflammatory biomarkers associated with chronic low back pain: a randomized active-controlled crossover pilot study in elderly. Complement Ther Med, 2017; 32, 25−32. doi: 10.1016/j.ctim.2017.03.010 [16] Chen TT, Liu NH, Liu JX, et al. Gua Sha, a press-stroke treatment of the skin, boosts the immune response to intradermal vaccination. PeerJ, 2016; 4, e2451. doi: 10.7717/peerj.2451 [17] Zhao L, Chen J, Li Y, et al. The Long-term effect of acupuncture for migraine prophylaxis: a randomized clinical trial. JAMA Intern Med, 2017; 177, 508−15. doi: 10.1001/jamainternmed.2016.9378 [18] Zhao L, Li DH, Zheng H, et al. Acupuncture as adjunctive therapy for chronic stable angina: a randomized clinical trial. JAMA Intern Med, 2019; 179, 1388−97. doi: 10.1001/jamainternmed.2019.2407 [19] Chang SC, Kim DH, Jang EY, et al. Acupuncture attenuates alcohol dependence through activation of endorphinergic input to the nucleus accumbens from the arcuate nucleus. Sci Adv, 2019; 5, eaax1342. doi: 10.1126/sciadv.aax1342 [20] He YH, Guo XF, May BH, et al. Clinical evidence for association of acupuncture and acupressure with improved cancer pain: a systematic review and meta-analysis. JAMA Oncol, 2020; 6, 271−8. doi: 10.1001/jamaoncol.2019.5233 [21] Liu SB, Wang ZF, Su YS, et al. A neuroanatomical basis for electroacupuncture to drive the vagal–adrenal axis. Nature, 2021; 598, 641−5. doi: 10.1038/s41586-021-04001-4 [22] Yin HY, Tang Y, Lu SF, et al. Gene Expression Profiles at Moxibustioned Site (ST36): a microarray analysis. Evid Based Complement Alternat Med, 2013; 2013, 890579. [23] Garcia-Vivas JM, Galaviz-Hernandez C, Fernandez-Retana J, et al. Transcriptomic profiling of adipose tissue in obese women in response to acupuncture catgut embedding therapy with Moxibustion. J Altern Complement Med, 2016; 22, 658−68. doi: 10.1089/acm.2015.0200 [24] Wang Y, Jiang HL, Meng H, et al. Genome-wide transcriptome analysis of hippocampus in rats indicated that TLR/NLR signaling pathway was involved in the pathogenisis of depressive disorder induced by chronic restraint stress. Brain Res Bull, 2017; 134, 195−204. doi: 10.1016/j.brainresbull.2017.07.021 [25] Wang ZQ, Huang Y, Wang D, et al. Genome-wide regulation of acupuncture and moxibustion on ulcerative colitis rats. Evid Based Complement Alternat Med, 2021; 2021, 9945121. [26] Li J, Peng C, Lai DJ, et al. PET-CT and RNA sequencing reveal novel targets for acupuncture-induced lowering of blood pressure in spontaneously hypertensive rats. Sci Rep, 2021; 11, 10973. doi: 10.1038/s41598-021-90467-1 [27] Patro R, Duggal G, Love MI, et al. Salmon provides fast and bias-aware quantification of transcript expression. Nat Methods, 2017; 14, 417−9. doi: 10.1038/nmeth.4197 [28] Howe KL, Achuthan P, Allen J, et al. Ensembl 2021. Nucleic Acids Res, 2021; 49, D884−91. doi: 10.1093/nar/gkaa942 [29] St Laurent G, Shtokalo D, Dong B, et al. VlincRNAs controlled by retroviral elements are a hallmark of pluripotency and cancer. Genome Biol, 2013; 14, R73. doi: 10.1186/gb-2013-14-7-r73 [30] Caron M, St-Onge P, Drouin S, et al. Very long intergenic non-coding RNA transcripts and expression profiles are associated to specific childhood acute lymphoblastic leukemia subtypes. PloS One, 2018; 13, e0207250. doi: 10.1371/journal.pone.0207250 [31] Qi F, Gao F, Cai Y, et al. Complex age- and cancer-related changes in human blood transcriptome—implications for pan-cancer diagnostics. Front Genet, 2021; 12, 746879. doi: 10.3389/fgene.2021.746879 [32] 请参照https://cran.r-project.org/doc/FAQ/R-FAQ.html#Citing-R R Core Team. R: a language and environment for statistical computing. Vienna, Austria: R Foundation for Statistical Computing. 2022 [33] Anders S, Huber W. Differential expression analysis for sequence count data. Genome Biol, 2010; 11, R106. doi: 10.1186/gb-2010-11-10-r106 [34] Love MI, Huber W, Anders S. Moderated estimation of fold change and dispersion for RNA-seq data with DESeq2. Genome Biol, 2014; 15, 550. doi: 10.1186/s13059-014-0550-8 [35] Ritchie ME, Phipson B, Wu D, et al. limma powers differential expression analyses for RNA-sequencing and microarray studies. Nucleic Acids Res, 2015; 43, e47. doi: 10.1093/nar/gkv007 [36] McInnes L, Healy J, Saul N, et al. UMAP: uniform manifold approximation and projection. J Open Source Softw, 2018; 3, 861. doi: 10.21105/joss.00861 [37] Robinson MD, McCarthy DJ, Smyth GK. edgeR: a Bioconductor package for differential expression analysis of digital gene expression data. Bioinformatics, 2010; 26, 139−40. doi: 10.1093/bioinformatics/btp616 [38] 请参照https: //cran. r-project. org/web/packages/psych/citation. html 和https://www.scholars.northwestern.edu/en/publications/psych-procedures-for-personality-and-psychological-research Revelle W. Psych: procedures for psychological, psychometric, and personality research. Evanston, Illinois; 2022 [39] Gene Ontology Consortium. The gene ontology resource: enriching a GOld mine. Nucleic Acids Res, 2021; 49, D325−34. doi: 10.1093/nar/gkaa1113 [40] Jassal B, Matthews L, Viteri G, et al. The reactome pathway knowledgebase. Nucleic Acids Res, 2020; 48, D498−503. [41] Yu GC, Wang LG, Han YY, et al. clusterProfiler: an R package for comparing biological themes among gene clusters. Omics J Integr Biol, 2012; 16, 284−7. doi: 10.1089/omi.2011.0118 [42] Kapranov P, St Laurent G, Raz T, et al. The majority of total nuclear-encoded non-ribosomal RNA in a human cell is 'dark matter' un-annotated RNA. BMC Biol, 2010; 8, 149. doi: 10.1186/1741-7007-8-149 [43] Daca-Roszak P, Zietkiewicz E. Transcriptome variation in human populations and its potential application in forensics. J Appl Genet, 2019; 60, 319−28. doi: 10.1007/s13353-019-00510-1 [44] 请参照https://www.jove.com/t/62528/three-differential-expression-analysis-methods-for-rna-sequencing Liu SY, Wang ZT, Zhu RH, et al. Three differential expression analysis methods for rna sequencing: limma, EdgeR, DESeq2. J Vis Exp JoVE, 2021; 175, e62528 [45] Liu X, Zhao JL, Xue LT, et al. A comparison of transcriptome analysis methods with reference genome. BMC Genomics, 2022; 23, 232. doi: 10.1186/s12864-022-08465-0 [46] Stupnikov A, McInerney CE, Savage KI, et al. Robustness of differential gene expression analysis of RNA-seq. Comput Struct Biotechnol J, 2021; 19, 3470−81. doi: 10.1016/j.csbj.2021.05.040 [47] Flanagan K, Li WX, Greenblatt EJ, et al. End-to-end pipeline for differential analysis of pausing in ribosome profiling data. STAR Protoc, 2022; 3, 101605. doi: 10.1016/j.xpro.2022.101605 [48] McDonald JH. Multiple comparisons. In: McDonald JH. Handbook of Biological Statistics. 3rd ed. Sparky House Publishing. 2014, 254–60. [49] Berger TC, Vigeland MD, Hjorthaug HS, et al. Neuronal and glial DNA methylation and gene expression changes in early epileptogenesis. PLOS ONE, 2019; 14, e0226575. doi: 10.1371/journal.pone.0226575 [50] Terme JM, Sesé B, Millán-Ariño L, et al. Histone H1 variants are differentially expressed and incorporated into chromatin during differentiation and reprogramming to pluripotency. J Biol Chem, 2011; 286, 35347−57. doi: 10.1074/jbc.M111.281923 [51] Harshman SW, Young NL, Parthun MR, et al. H1 histones: current perspectives and challenges. Nucleic Acids Res, 2013; 41, 9593−609. doi: 10.1093/nar/gkt700 [52] Yang SM, Kim BJ, Toro LN, et al. H1 linker histone promotes epigenetic silencing by regulating both DNA methylation and histone H3 methylation. Proc Natl Acad Sci USA, 2013; 110, 1708−13. doi: 10.1073/pnas.1213266110 [53] Garg M, Perumalsamy LR, Shivashankar GV, et al. The linker histone H1.2 is an intermediate in the apoptotic response to cytokine deprivation in T-effectors. Int J Cell Biol, 2014; 2014, 674753. [54] Kim JM, Kim K, Punj V, et al. Linker histone H1.2 establishes chromatin compaction and gene silencing through recognition of H3K27me3. Sci Rep, 2015; 5, 16714. doi: 10.1038/srep16714 [55] Kalashnikova AA, Rogge RA, Hansen JC. Linker histone H1 and protein-protein interactions. Biochim Biophys Acta, 2016; 1859, 455−61. doi: 10.1016/j.bbagrm.2015.10.004 [56] Bauden M, Kristl T, Sasor A, et al. Histone profiling reveals the H1.3 histone variant as a prognostic biomarker for pancreatic ductal adenocarcinoma. BMC Cancer, 2017; 17, 810. doi: 10.1186/s12885-017-3834-z [57] Izzo A, Ziegler-Birling C, Hill PWS, et al. Dynamic changes in H1 subtype composition during epigenetic reprogramming. J Cell Biol, 2017; 216, 3017−28. doi: 10.1083/jcb.201611012 [58] Li ZM, Li YL, Tang M, et al. Destabilization of linker histone H1.2 is essential for ATM activation and DNA damage repair. Cell Res, 2018; 28, 756−70. doi: 10.1038/s41422-018-0048-0 [59] Sollberger G, Streeck R, Apel F, et al. Linker histone H1.2 and H1.4 affect the neutrophil lineage determination. eLife, 2020; 9, e52563. doi: 10.7554/eLife.52563 [60] Kamieniarz K, Izzo A, Dundr M, et al. A dual role of linker histone H1.4 Lys 34 acetylation in transcriptional activation. Genes Dev, 2012; 26, 797−802. doi: 10.1101/gad.182014.111 [61] Weiss T, Hergeth S, Zeissler U, et al. Histone H1 variant-specific lysine methylation by G9a/KMT1C and Glp1/KMT1D. Epigenetics Chromatin, 2010; 3, 7. doi: 10.1186/1756-8935-3-7 [62] Konishi A, Shimizu S, Hirota J, et al. Involvement of histone H1.2 in apoptosis Induced by DNA double-strand breaks. Cell, 2003; 114, 673−88. doi: 10.1016/S0092-8674(03)00719-0 [63] Lindenboim L, Borner C, Stein R. Nuclear proteins acting on mitochondria. Biochim Biophys Acta, 2011; 1813, 584−96. doi: 10.1016/j.bbamcr.2010.11.016 [64] Cascone A, Bruelle C, Lindholm D, et al. Destabilization of the outer and inner mitochondrial membranes by core and linker histones. PLoS ONE, 2012; 7, e35357. doi: 10.1371/journal.pone.0035357 [65] Medrzycki M, Zhang YZ, McDonald JF, et al. Profiling of linker histone variants in ovarian cancer. Front Biosci, 2012; 17, 396−406. doi: 10.2741/3934 [66] Duce JA, Smith DP, Blake RE, et al. Linker histone h1 binds to disease associated amyloid-like fibrils. J Mol Biol, 2006; 361, 493−505. doi: 10.1016/j.jmb.2006.06.038 [67] Okamura H, Yoshida K, Amorim BR, et al. Histone H1.2 is translocated to mitochondria and associates with bak in bleomycin-induced apoptotic cells. J Cell Biochem, 2008; 103, 1488−96. doi: 10.1002/jcb.21537 [68] Flex E, Martinelli S, Van Dijck A, et al. Aberrant function of the C-terminal tail of HIST1H1E accelerates cellular senescence and causes premature aging. Am J Hum Genet, 2019; 105, 493−508. doi: 10.1016/j.ajhg.2019.07.007 [69] Millán-Ariño L, Islam ABMMK, Izquierdo-Bouldstridge A, et al. Mapping of six somatic linker histone H1 variants in human breast cancer cells uncovers specific features of H1.2. Nucleic Acids Res, 2014; 42, 4474−93. doi: 10.1093/nar/gku079 [70] Jenne CN, Urrutia R, Kubes P. Platelets: bridging hemostasis, inflammation, and immunity. Int J Lab Hematol, 2013; 35, 254−61. doi: 10.1111/ijlh.12084 [71] Gilthorpe JD, Oozeer F, Nash J, et al. Extracellular histone H1 is neurotoxic and drives a pro-inflammatory response in microglia. F1000Res, 2013; 2, 148. doi: 10.12688/f1000research.2-148.v1 -
 22202+Supplementary Materials.pdf

-

 点击查看大图
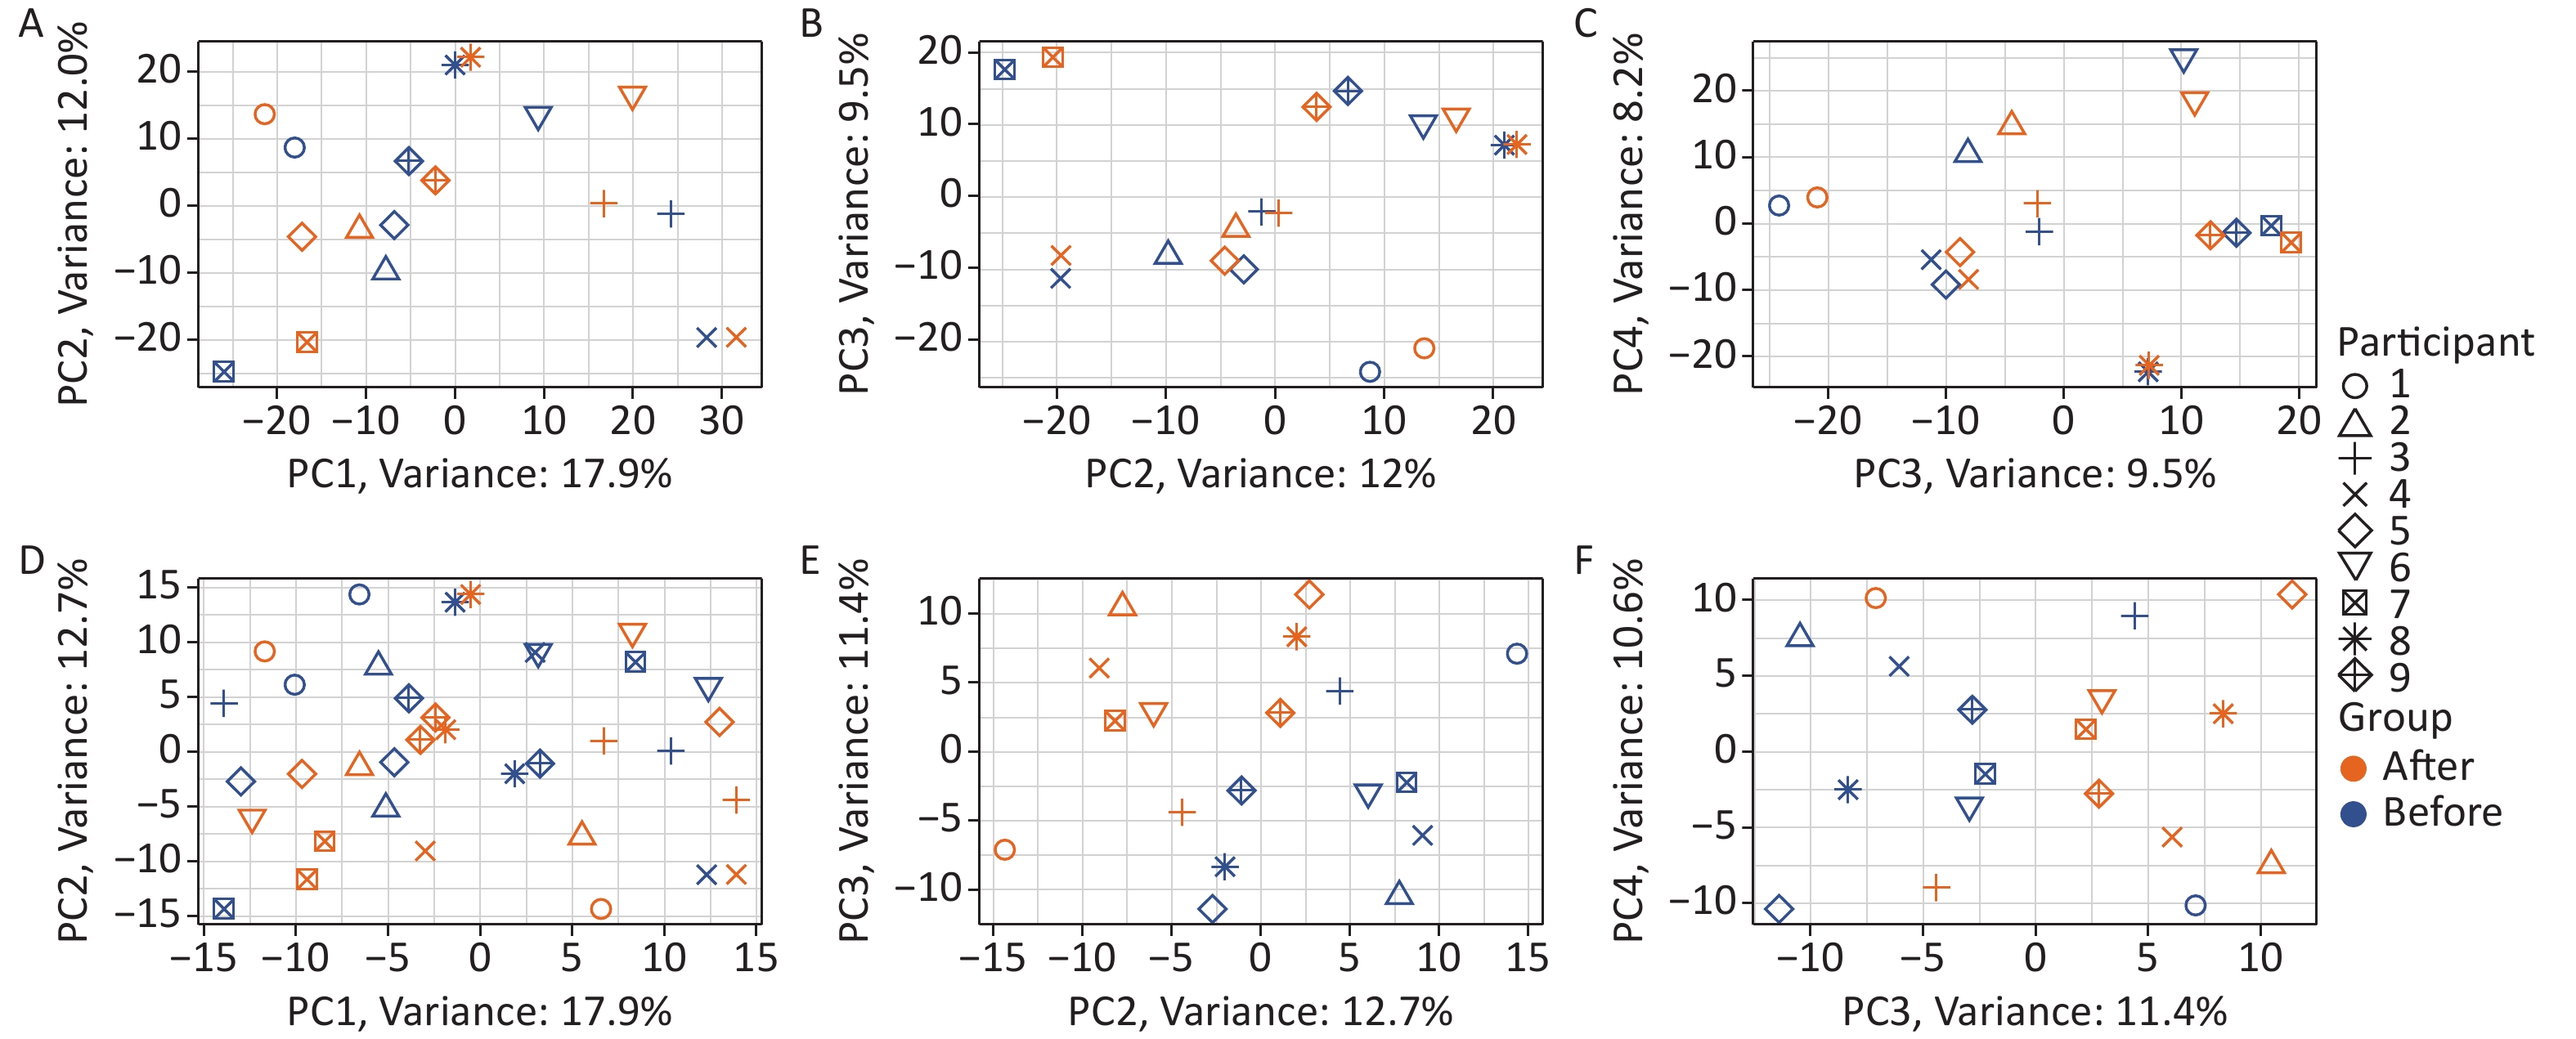
计量
- 文章访问数: 775
- HTML全文浏览量: 359
- PDF下载量: 83
- 被引次数: 0

 Quick Links