

 下载:
下载:

-
Breastfeeding is associated with many short- and long-term benefits for infants and their mothers, including improved health and child development. In addition, breastfed individuals have lower risks of obesity and other related chronic diseases, including diabetes, hypertension, hyperlipidemia, cardiovascular disease, and some types of cancer later in life[1]. Despite its established benefits, the prevalence of exclusive breastfeeding is much lower in China than it is in other middle-income countries[2]. Given that the causes of breastfeeding are multifactorial, several national ministries and commissions jointly issued the "Breastfeeding Promotion Action Plan 2021–2025" in November 2021, which aimed to provide supportive measures at many levels, from policy directives to social attitudes and values, and health-care services to improve breastfeeding practices in China[3].
Childhood obesity is a global pandemic. Globally, an estimated 38 million children aged < 5 years were overweight or obese in 2019[4]. The Chinese National Nutrition and Health Survey (CNNHS) reported that the prevalence of overweight and obesity in children aged < 5 years in 2013 was 8.4% and 3.1%, respectively[5]. Evidence suggests that obesity could begin in the first 1,000 days of life and become established in preschool years, and that one in five obese children aged four years will suffer from adult obesity[6-8]. Preventive strategies in early life are effective public health interventions for curbing this pandemic. In October 2020, the National Health Commission, along with five stakeholders, jointly issued the Implementation Plan for Childhood and Adolescent Obesity Prevention and Control, which emphasized the promotion of feeding infants and young children to prevent and control childhood obesity[9].
Evidence of the protective effect of breastfeeding is more consistent when considering overweight and obesity[10-12]; in addition, a dose-response relationship with longer breastfeeding duration has been described in some studies[13-14]. Body composition is significantly different between breastfed and formula-fed infants in the first 2 years of life[15-17]. However, it remains unknown whether this difference in body composition persists in later years; besides, there are few relevant studies on the topic, especially in China. In addition, there is some evidence that a longer breastfeeding duration is negatively associated with body fat mass in preschool[18] and older children[19-21], although this association is not evident in all studies[22-24].
Preschool is a pivotal time during which the mechanisms of growth and development are established, with potential lifelong effects on health. However, there are limited studies on the mid- and long-term effects of breastfeeding and breastfeeding duration on more accurate body composition indicators than BMI, which is a surrogate measure of physical growth in Chinese population. Furthermore, it is necessary to provide scientific evidence for infant and young child feeding guidelines to promote scientific feeding practices and prevent and control childhood obesity. The present study aimed to further assess whether body composition at 3–5 years, as measured using bioelectrical impedance analysis (BIA), was related to breastfeeding duration in Chinese children using data from the National Nutrition and Health Systematic Survey for children aged 0–17 years in China in 2019–2020.
-
This cross-sectional study was conducted between 2019 and 2020. Data were obtained from the National Nutrition and Health Systematic Survey for children 0–17 years of age in China (CNHSC). The study methodology has been previously reported[25]. We included children aged 3–5 years who were singleton pregnancies and were free of birth defects and other diseases that affect growth (such as cardiovascular diseases, chronic nephritis, tuberculosis, hepatitis, endemic diseases, and chronic bronchitis). Children whose body composition could not be measured using BIA, such as those with epilepsy, were excluded. The participants were from six survey sites in five provinces of China: Taigu County of Jinzhong, Shanxi Province; Dongchang District of Tonghua, and Yongji County, Jilin Province; Qingshan Lake District of Nanchang, Jiangxi Province; Yuelu District of Changsha, Hunan Province; and Longchuan County of Heyuan, Guangdong Province.
This study was approved by the Ethics Review Board of the National Institute for Nutrition and Health, Chinese Center for Disease Control and Prevention (Number: 2019-009). Written informed consent was obtained from each child’s caregiver prior to the survey.
-
Data on feeding practices during children first 2 years were collected through face-to-face interviews with the caregivers of the children, most of whom were mothers. Data on the breastfeeding status and weaning time were collected. On this basis, breastfeeding duration was calculated and divided into six feeding groups: never breastfed, breastfed for < 4 months, breastfed for 4–5 months, breastfed for 6–11 months, breastfed for 12–23 months, and breastfed for ≥ 24 months.
-
The weight was measured in light clothing and height was measured without footwear; BIA assessment was performed immediately after. Measurements were performed once by a trained examiner, using uniform instruments. At least one quality control staff member was appointed to conduct on-site supervision to ensure the accuracy and standardization of the measurement methods. Based on these results, z-scores were calculated using the least mean square (LMS) method based on the WHO Growth and Development Standards[26-27]. The height-for-age Z-score (HAZ), weight-for-age Z-score (WAZ), weight-for-height Z-score (WHZ), and BMI-for-age Z-score (BAZ) were calculated using the formula Z = [(X/M)L-1]/(S × L), where X indicates anthropometric data, such as height and weight of the children. The LMS method is based on the Box-Cox normal transformation, and the parameters L, M, and S represent the Box-Cox conversion powers, median of the growth standard, and coefficients of variation, respectively. Stunting was defined as HAZ < -2 (HAZ of children below two standard deviations of the median height of growth standards). Underweight participants were defined as WAZ < -2. For children aged 3 and 4 years, WHZ < -2 was defined as wasting, 2 < WHZ ≤ 3 overweight, and WHZ > 3 obesity. For children aged 5 years, BAZ < -2 was defined as wasting, 1 < BAZ ≤ 2 overweight, and BAZ > 2 obesity.
A bioelectrical impedance analysis device (InBody 770 body composition analyzer, South Korea) was used to measure total fat-free mass, body fat mass, and percentage of body fat in children aged 3–5 years. Measurement was taken in the morning, with the participants fasting and wearing light clothing, after emptying the bladder and bowels, and after a 2 h break from intense physical activity. During the analysis, it was ensured that the test child had bare and clean hands and feet that were properly positioned on the handles or platform and were in contact with the electrodes. Children whose body composition could not be measured using BIA, such as children with epilepsy or those with electronic devices inside their bodies, were excluded. Height-adjusted indices were calculated because fat mass and fat-free mass depend on height. We used height raised to a power of 2 to calculate the fat mass index [body fat mass (kg)/height (m)2], and height raised to a power of 2.5 to calculate the fat-free mass index [fat-free mass (kg)/height (m)2.5][18].
-
The following potential confounders were obtained: age, gender, birth weight, residential area, eating behavior score (calculated according to the dietary behavior questionnaire over the past month; the higher the score, the less healthy the children’s eating behavior), diet quality distance score, middle/high-level physical activity time per day (categorized as ˂ 60 min and ˃ 60 min based on Exercise Guide for Preschoolers in China[28]), and nocturnal sleep time (the average time of nocturnal sleep per day over the past week, in hours). Parental BMI (categorized as underweight [BMI < 18.5 kg/m2], normal [18.5–23.9 kg/m2], overweight [24.0–27.9 kg/m2], and obesity [≥ 28.0 kg/m2], according to categorization of BMI in adults in China issued in 2013[29]) and parental education level (four categories, including junior high school or below, high school, associate’s degree, and bachelor’s degree or above) was collected using a household questionnaire.
The diet quality distance (DQD) score is an indicator of the Chinese diet balance index for preschool children[30] and was calculated using food intake data collected by a food frequency questionnaire over the past week and referred to the Chinese Dietary Guidelines for preschool children[31]. The DQD ranges from 0 to 60 points and provides a comprehensive picture of dietary imbalances. A score of 0 indicates that the diet is balanced; 1–12 points mean that the diet is appropriate; 13–24 points are classified as low-degree dietary imbalance; 25–36 points and ≥ 37 points indicate that the diet is moderate and high-degree dietary imbalance, respectively.
-
Approximately normally distributed data such as height, Z score, fat-free mass, and body fat percentage of children were expressed as means and standard deviations.
Student’s t-test and analysis of variance (ANOVA) were used to compare the mean values for each group. Non-normally distributed data, such as total body weight, BMI, and body fat mass, were expressed as interquartile range (IQR), and Student’s t-test and ANOVA were used to compare the means of each group after logarithmic transformation. The chi-squared test was used to compare the differences between categorical variables.
Total fat-free mass, fat-free mass index, fat mass, fat mass index, and body fat percentage were included in the general linear model as continuous variables. Gender was adjusted to control for variations caused by the normal growth and development of boys and girls. Breastfeeding status and duration at infancy were analyzed as categorical variables and compared with the reference group. A regression model was used to calculate the mean value of each indicator of body composition after adjusting for potential confounders. For residual normal data such as fat-free mass, fat-free mass index, and percentage of body fat, the mean, mean difference, and 95% confidence interval (CI) were the original values in the regression analysis. In contrast, for fat mass and fat mass index, whose residual values were normal after logarithmic transformation, the mean, mean difference, and 95% CI were antilog results after logarithmic transformation. All data were analyzed using SAS (version 9.4; SAS Institute Inc., Cary, NC, USA). Statistical tests were two-sided, and a P value ˂ 0.05 was considered statistically significant.
-
Overall, 2008 participants were included in the analysis, and the numbers of children aged 3, 4, and 5 years were 642, 700, and 666, respectively (Figure 1). The characteristics of the children and their parents are presented in Table 1. Approximately 89.2% of the children were ever breastfed and the median duration of breastfeeding was 12 months (IQR, 7–15 months). As the children grew, their height, weight, total body water, fat mass, and fat-free mass gradually increased (all P < 0.001; Table 2). Body composition indicators were stratified by age for subsequent analyses.
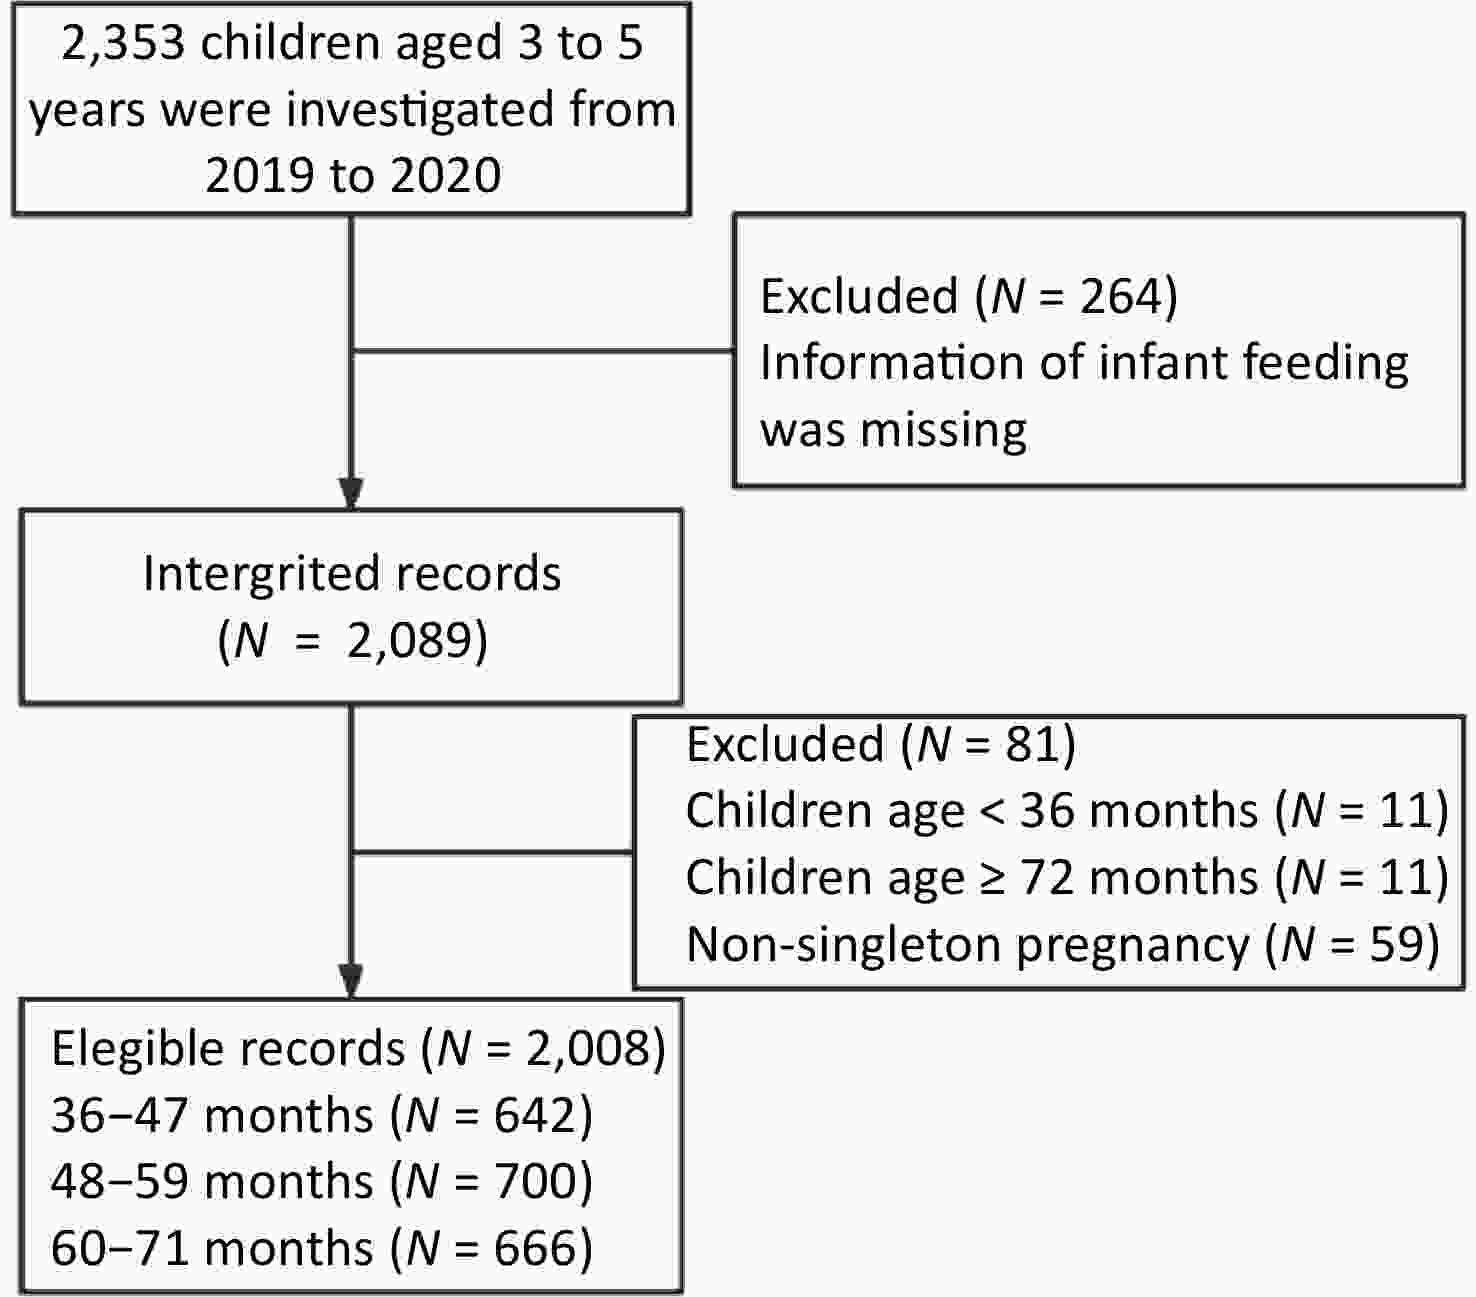
Figure 1. Flowchart of study participants.
Table 1. Characteristics of children and parents
Characteristics N (%) or Mean ± SD Children Age groups (years) 3 32.0 (642/2,008) 4 34.8 (700/2,008) 5 33.2 (666/2,008) Gender Boy 50.2 (1,008/2,008) Girl 49.8 (1,000/2,008) Residential area Urban 54.9 (1,102/2,008) Rural 45.1 (906/2,008) Region North 55.1 (1,106/2,008) South 44.9 (902/2,008) Survey site Taigu County 18.0 (362/2,008) Jichang District 17.9 (360/2,008) Yongji County 19.1 (384/2,008) Qingshan Lake District 17.6 (354/2,008) Yuelu District 19.4 (388/2,008) Longchuan County 8.0 (160/2,008) Annual household income (per capita CNY*) ˂ 10,000 4.2 (85/2,004) 10,000– 7.3 (146/2,004) ≥ 20,000 12.2 (245/2,004) Refusal to answer 41.3 (828/2,004) Unknown 34.9 (700/2,004) Birth weight (g) < 2,500 2.6 (47/1,814) 2,500–4,000 90.7 (1,645/1,814) > 4,000 6.7 (122/1,814) Gestational age pre-term 4.6 (92/1,997) Term 95.4 (1,905/1,997) Nutrition status Stunting 1.1 (22/2,008) Wasting 1.7 (34/2,008) Underweight 0.8 (17/2,008) Overweight or obesity 9.6 (193/2,008) Breastfeeding Never 10.8 (217/2,007) Ever 89.2 (1,790/2,007) Duration of breastfeeding (months) Never 11.2 (217/1,931) < 4 11.4 (221/1,931) 4– 3.6 (69/1,931) 6– 28.4 (548/1,931) 12– 41.4 (800/1,931) ≥ 24 3.9 (76/1,931) Middle/high-level physical activity time (min) ≥ 60 81.0 (1,467/1,811) < 60 19.0 (344/1,811) Nocturnal sleep time (hours) 9.5 ± 0.6 Eating behavior scores 19.2 ± 3.4 Diet quality distance (scores) 22.6 ± 8.9 Parents Maternal BMI (kg/m2) Underweight 9.4 (180/1,912) Normal 72.2 (1,381/1,912) Overweight 15.1 (288/1,912) Obesity 3.3 (63/1,912) Maternal education Junior high school or below 27.0 (537/1,988) High school 18.5 (368/1,988) Associate’s degree 22.6 (450/1,988) Bachelor’s degree or above 31.8 (633/1,988) Father’s BMI (kg/m2) Underweight 3.0 (56/1,868) Normal 56.6 (1,057/1,868) Overweight 33.3 (622/1,868) Obesity 7.1 (133/1,868) Father’s education Junior high school or below 29.1 (580/1,996) High school 19.5 (390/1,996) Associate’s degree 19.9 (397/1,996) Bachelor’s degree or above 31.5 (629/1,996) Note. *CNY: Chinese Yuan. Table 2. Status of body composition and anthropometric measurements for children aged 3 to 5 years
Variables Total 3 years 4 years 5 years n M (IQR) or
Mean ± SDn M (IQR) or
Mean ± SDn M (IQR) or
Mean ± SDn M (IQR) or
Mean ± SDBody composition Total body water (kg) 2,007 10.8 ± 1.7 641 9.5 ± 1.1 700 10.7 ± 1.3 666 12.2 ± 1.5 Total fat-free mass (kg) 1,999 14.6 ± 2.3 641 12.8 ± 1.5 700 14.6 ± 1.7 658 16.5 ± 1.9 Fat-free mass index (kg/m2.5) 1,999 12.3 ± 0.8 641 12.8 ± 0.8 700 12.3 ± 0.7 658 11.9 ± 0.7 Total body fat mass (kg) 1,968 3.0 (2.4, 4.0) 632 2.7 (2.1, 3.5) 693 3.2 (2.5, 4.0) 643 3.3 (2.6, 4.5) Fat mass index (kg/m2) 1,968 2.7 (2.1, 3.5) 632 2.7 (2.2, 3.4) 693 2.8 (2.2, 3.5) 643 2.6 (2.1, 3.5) Percentage body fat (%) 1,968 18.2 ± 5.5 632 18.1 ± 5.1 693 18.6 ± 5.5 643 18.1 ± 6.0 Anthropometric status* Height (cm) 2,008 107.1 ± 7.4 642 99.9 ± 4.6 700 107.1 ± 4.9 666 114.0 ± 4.9 Weight (kg) 2,002 17.4 (15.6, 19.6) 642 15.3 (14.2, 16.6) 700 17.5 (16.0, 19.3) 660 19.6 (18.0, 22.1) BMI (kg/m2) 2,002 15.4 (14.6, 16.3) 642 15.4 (14.7, 16.2) 700 15.4 (14.6, 16.3) 660 15.3 (14.5, 16.5) WAZ 2,002 0.2 ± 1.1 642 0.1 ± 1.0 700 0.2 ± 1.0 660 0.3 ± 1.2 HAZ 2,008 0.2 ± 1.0 642 0.1 ± 1.0 700 0.1 ± 1.0 666 0.3 ± 1.0 WHZ 1,342 0.1 ± 1.0 642 0.1 ±1.0 700 0.1 ± 1.0 / / BAZ 2,002 0.1 ± 1.1 642 0.1 ±1.0 700 0.2 ± 1.0 660 0.2 ± 1.3 Note. *HAZ: Height-for-age Z-score, WAZ: Weight-for-age Z-score, WHZ: Weight-for-height Z-score, BAZ: BMI-for-age Z-score. -
After adjusting for gender, birth weight, survey sites, nocturnal sleep time, middle- and high-level physical activity time, eating behavior score, balanced diet index score, parental BMI, and education level, HAZ was lower in ever breastfed children than in never breastfed children (0.12 vs. 0.42, F = 4.14, P = 0.043) at 3 years of age (Table 3). In addition, WAZ was lower in ever breastfed children than in never breastfed children (0.31 vs. 0.65, F = 4.99, P = 0.026) at 4 years of age. The difference in the WAZ for different breastfeeding durations was statistically significant (F = 2.43, P = 0.034), and the WAZ was lower in children who breastfed for 12–23 months than in those who never breastfed (0.21 vs. 0.66) among children aged 4 years. No statistically significant difference in WHZ/BAZ was observed among children with different breastfeeding durations (Table 4).
Table 3. Relationship between breastfeeding duration and HAZ and WAZ of participants stratified by age
Variables n Height-for-age Z-score (HAZ) Weight-for-age Z-score (WAZ) Adjusted* Difference
(95% CI)Adjusted** Difference
(95% CI)Adjusted* Difference
(95% CI)Adjusted** Difference
(95% CI)Children aged 3 years Breastfeeding 642 Never 72 0.27 Referent 0.42 Referent 0.15 Referent 0.25 Referent Ever 570 0.12 −0.15
(−0.41, 0.10)0.12 −0.30
(−0.58, −0.01)0.14 0
(−0.25, 0.24)0.21 −0.03
(−0.30, 0.23)F value 1.46 4.14 0 0.06 P value 0.228 0.043 0.969 0.799 Breastfeeding duration (months) 623 Never 72 0.27 Referent 0.41 Referent 0.15 Referent 0.24 Referent < 4 68 0 −0.27
(−0.71, 0.16)−0.03 −0.43
(−0.94, 0.08)0.13 −0.02
(−0.44, 0.40)0.27 0.03
(−0.44, 0.49)4– 17 0.66 0.39
(−0.31, 1.08)0.38 −0.02
(−0.81, 0.76)0.50 0.36
(−0.32, 1.03)0.32 0.07
(−0.65, 0.79)6– 174 0.21 −0.06
(−0.42, 0.30)0.23 −0.18
(−0.60, 0.25)0.18 0.03
(−0.32, 0.38)0.24 0
(−0.39, 0.39)12– 266 0.03 −0.24
(−0.59, 0.10)0.05 −0.36
(−0.76, 0.05)0.07 −0.07
(−0.40, 0.26)0.19 −0.06
(−0.43, 0.31)≥ 24 26 0.16 −0.12
(−0.70, 0.47)−0.29 −0.69
(−1.41, 0.03)0.34 0.20
(−0.37, 0.77)−0.08 −0.33
(−0.99, 0.34)F value 2.15 2.19 0.96 0.44 P value 0.058 0.054 0.440 0.819 Children aged 4 years Breastfeeding 699 Never 71 0.38 Referent 0.40 Referent 0.46 Referent 0.65 Referent Ever 628 0.10 −0.28
(−0.51, −0.04)0.12 −0.28
(−0.58, 0.01)0.15 −0.31
(−0.55, −0.07)0.31 −0.34
(−0.64, −0.04)F value 5.21 3.60 6.22 4.99 P value 0.023 0.058 0.013 0.026 Breastfeeding duration (months) 663 Never 71 0.38 Referent 0.41 Referent 0.46 Referent 0.66 Referent < 4 80 0.21 −0.17
(−0.56, 0.22)0.29 −0.12
(−0.60, 0.35)0.21 −0.25
(−0.65, 0.15)0.44 −0.22
(−0.70, 0.26)4– 24 0.10 −0.28
(−0.85, 0.29)0.14 −0.28
(−0.93, 0.37)0.15 −0.31
(−0.89, 0.28)0.29 −0.37
(−1.03, 0.29)6– 196 0.16 −0.22
(−0.55, 0.12)0.23 −0.18
(−0.60, 0.24)0.20 −0.26
(−0.60, 0.08)0.48 −0.18
(−0.61, 0.24)12– 264 0.07 −0.30
(−0.62, 0.02)0.03 −0.38
(−0.78, 0.02)0.15 −0.31
(−0.64, 0.02)0.21 −0.45
(−0.85, −0.05)≥ 24 28 0.10 −0.27
(−0.81, 0.26)−0.06 −0.47
(−1.09, 0.14)0.13 −0.33
(−0.88, 0.22)0.14 −0.52
(−1.15, 0.10)F value 1.23 1.84 1.18 2.43 P value 0.292 0.105 0.315 0.034 Children aged 5 years Breastfeeding 666 Never 74 0.48 Referent 0.40 Referent 0.53 Referent 0.33 Referent Ever 592 0.32 −0.16
(−0.39, 0.06)0.34 −0.06
(−0.35, 0.24)0.13 −0.22
(−0.49, 0.06)0.34 0.02
(−0.34, 0.37)F value 1.96 0.14 2.46 0.01 P value 0.162 0.709 0.117 0.925 Breastfeeding duration (months) 645 Never 74 0.48 Referent 0.40 Referent 0.53 Referent 0.36 Referent < 4 73 0.51 0.03
(−0.36, 0.42)0.67 0.27
(−0.22, 0.75)0.37 −0.16
(−0.63, 0.31)0.64 0.28
(−0.30, 0.87)4– 28 0.42 0.06
(−0.59, 0.46)0.42 0.01
(−0.60, 0.63)0.53 0
(−0.64, 0.63)0.68 0.32
(−0.42, 1.06)6– 178 0.35 −0.13
(−0.46, 0.19)0.39 −0.01
(−0.44, 0.41)0.28 −0.26
(−0.65, 0.14)0.25 −0.10
(−0.62, 0.41)12– 270 0.22 −0.27
(−0.58, 0.04)0.25 −0.15
(−0.55, 0.24)0.29 −0.25
(−0.62, 0.13)0.34 −0.02
(−0.49, 0.46)≥ 24 22 0.41 −0.07
(−0.65, 0.50)0.39 −0.01
(−0.67, 0.65)0.16 −0.37
(−1.07, 0.32)0.23 −0.13
(−0.92, 0.67)F value 1.82 1.69 0.92 1.28 P value 0.106 0.135 0.470 0.273 Note. *Mean value after adjusting for gender. **Mean values after adjusting for gender, birth weight, survey site, nocturnal sleep time, middle- and high-level physical activity time, eating behavior score, balanced diet index score, parental BMI, and education level. Table 4. Relationship between breastfeeding duration and WHZ or BAZ of participants stratified by age
Variables n Weight-for-height Z-score (WHZ) or BMI-for-age Z-score (BAZ) Adjusted* Difference (95% CI) Adjusted** Difference (95% CI) Children aged 3 years Breastfeeding 642 Never 72 −0.02 Referent 0.001 Referent Ever 570 0.11 −0.08 0.21 0.21 (−0.07, 0.49) F value 1.00 0.13 (−0.12, 0.37) 2.08 P value 0.317 0.150 Breastfeeding duration (months) 623 Never 72 −0.02 Referent 0.01 Referent < 4 68 0.19 0.21 (−0.22, 0.64) 0.42 0.42 (−0.08, 0.91) 4– 17 0.19 0.21 (−0.48, 0.89) 0.14 0.13 (−0.63, 0.89) 6– 174 0.08 0.10 (−0.26, 0.45) 0.16 0.15 (−0.26, 0.56) 12– 266 0.09 0.37 (−0.21, 0.95) 0.22 0.22 (−0.17, 0.61) ≥ 24 26 0.35 0.10 0.09 (−0.61, 0.80) F value 0.70 1.03 P value 0.626 0.399 Children aged 4 years Breastfeeding 699 Never 71 0.28 Referent 0.55 Referent Ever 628 0.10 −0.18 (−0.43, 0.07) 0.32 −0.23 (−0.54, 0.09) F value 2.09 1.94 P value 0.149 0.164 Breastfeeding duration (months) 663 Never 71 0.28 Referent 0.56 Referent < 4 80 0.10 −0.19 (−0.60, 0.23) 0.37 −0.20 (−0.71, 0.32) 4– 24 0.09 −0.19 (−0.80, 0.41) 0.27 −0.29 (−1.00, 0.42) 6– 196 0.12 −0.17 (−0.52, 0.19) 0.47 −0.09 (−0.54, 0.37) 12– 264 0.12 −0.16 (−0.51, 0.18) 0.26 −0.30 (−0.74, 0.13) ≥ 24 28 0.05 −0.23 (−0.81, 0.34) 0.22 −0.34 (−1.01, 0.33) F value 0.39 1.10 P value 0.856 0.361 Children aged 5 years Breastfeeding 666 Never 74 0.31 Referent 0.08 Referent Ever 592 0.14 −0.17 (−0.47, 0.13) 0.17 0.09 (−0.30, 0.49) F value 1.26 0.21 P value 0.262 0.649 Breastfeeding duration (months) 645 Never 74 0.32 Referent 0.12 Referent < 4 73 0.08 −0.24 (−0.76, 0.27) 0.33 0.21 (−0.44, 0.86) 4– 28 0.40 0.08 (−0.61, 0.77) 0.62 0.50 (−0.32, 1.33) 6– 178 0.07 −0.25 (−0.68, 0.18) −0.01 −0.13 (−0.70, 0.44) 12– 270 0.20 −0.12 (−0.53, 0.29) 0.25 0.13 (−0.40, 0.66) ≥ 24 22 −0.23 −0.55 (−1.30, 0.21) −0.12 −0.24 (−1.13, 0.64) F value 1.21 1.58 P value 0.301 0.166 Note. * Mean value after adjusting for gender. **Mean value after adjusting for gender, birthweight, survey site, nocturnal sleep time, middle- and high-level physical activity time, eating behavior score, balanced diet index score, parental BMI, and education level. -
After adjusting for gender, birth weight, survey sites, HAZ (fat-free mass index was not adjusted by HAZ), nocturnal sleep time, middle- and high-level physical activity time, eating behavior score, balanced diet index score, parental BMI, and education level, there were no significant differences in fat-free mass index among the ever breastfed and never breastfed groups and different breastfeeding duration groups for children aged 3–5 years (Table 5).
Table 5. Relationship between breastfeeding status and fat-free mass and fat-free mass index of children stratified by age
Variables n Fat-free mass, kg Fat-free mass index, kg/m2.5 Adjusted* Difference
(95% CI)Adjusted** Difference
(95% CI)Adjusted* Difference
(95% CI)Adjusted** Difference
(95% CI)Children aged 3 years Breastfeeding 641 Never 71 12.72 Referent 12.52 Referent 12.70 Referent 12.62 Referent Ever 570 12.75 0.03
(−0.32, 0.38)12.84 0.32
(0.06, 0.59)12.75 0.05
(−0.14, 0.24)12.76 0.14
(−0.09, 0.37)F value 0.03 5.91 0.31 1.50 P value 0.868 0.015 0.580 0.222 Breastfeeding duration (months) 622 Never 71 12.72 Referent 12.51 Referent 12.70 Referent 12.63 Referent < 4 68 12.76 0.03
(−0.57, 0.64)12.98 0.46
(0.01, 0.92)12.74 0.04
(−0.29, 0.37)12.83 0.21
(−0.19, 0.61)4– 17 13.62 0.89
(−0.07, 1.86)13.06 0.54
(−0.16, 1.24)12.74 0.04
(−0.49, 0.56)12.70 0.07
(−0.54, 0.69)6– 174 12.85 0.13
(−0.37, 0.63)12.85 0.33
(−0.05, 0.71)12.74 0.04
(−0.23, 0.31)12.74 0.11
(−0.22, 0.44)12– 266 12.63 −0.10
(−0.58, 0.38)12.85 0.33
(−0.03, 0.69)12.77 0.07
(−0.18, 0.33)12.81 0.19
(−0.13, 0.51)≥ 24 26 12.76 0.03
(−0.78, 0.85)12.57 0.06
(−0.59, 0.71)12.77 0.08
(−0.37, 0.52)12.74 0.12
(−0.45, 0.68)F value 1.88 1.94 0.13 0.59 P value 0.096 0.086 0.986 0.711 Children aged 4 years Breastfeeding 699 Never 71 15.20 Referent 14.64 Referent 12.25 Referent 12.17 Referent Ever 628 14.49 −0.71
(−1.12, −0.30)14.31 −0.33
(−0.66, −0.003)12.25 −0.004
(−0.17, 0.16)12.13 −0.04
(−0.26, 0.18)F value 11.79 3.92 0.00 0.12 P value < 0.001 0.048 0.960 0.728 Breastfeeding duration (months) 663 Never 71 15.19 Referent 14.64 Referent Referent 12.17 Referent < 4 80 14.53 −0.67
(−1.34, 0.01)14.29 −0.34
(−0.87, 0.19)12.25 −0.04
(−0.32, 0.24)12.15 −0.01
(−0.38, 0.33)4– 24 14.71 −0.49
(−1.46, 0.49)14.59 −0.04
(−0.77, 0.69)12.22 0.08
(−0.32, 0.49)12.21 0.04
(−0.45, 0.53)6– 196 14.57 −0.62
(−1.19, −0.04)14.30 −0.33
(−0.80, 0.13)12.34 0.001
(−0.24, 0.24)12.17 −0.003
(−0.32, 0.31)12– 264 14.46 −0.73
(−1.29, −0.18)14.26 −0.37
(−0.82, 0.07)12.26 0.004
(−0.23, 0.23)12.08 −0.09
(−0.39, 0.21)≥ 24 28 14.69 −0.51
(−1.43, 0.42)14.48 −0.16
(−0.85, 0.53)12.26 0.001
(−0.38, 0.39)12.17 0.004
(−0.46, 0.47)F value 2.30 1.24 0.13 0.31 P value 0.044 0.290 0.986 0.908 Children aged 5 years Breastfeeding 658 Never 74 16.91 Referent 16.42 Referent 11.96 Referent 11.81 Referent Ever 584 16.46 −0.45
(−0.87, −0.02)16.40 −0.01
(−0.37, 0.33)11.90 −0.06
(−0.22, 0.10)11.87 0.06
(−0.15, 0.28)F value 4.24 0.01 0.55 0.36 P value 0.040 0.914 0.459 0.547 Breastfeeding duration (months) 637 Never 74 16.91 Referent 16.48 Referent 11.97 Referent 11.83 Referent < 4 72 16.79 −0.12
(−0.86, 0.61)16.52 0.04
(−0.52, 0.61)11.92 −0.05
(−0.32, 0.23)11.91 0.08
(−0.27, 0.42)4– 27 16.43 −0.48
(−1.48, 0.51)16.31 −0.16
(−0.87, 0.54)11.87 −0.09
(−0.47, 0.28)11.84 0.01
(−0.43, 0.44)6– 174 16.31 −0.61
(−1.22, 0.01)16.08 −0.40
(−0.89, 0.09)11.87 −0.10
(−0.33, 0.13)11.73 −0.11
(−0.41, 0.20)12– 268 16.45 −0.46
(−1.04, 0.12)16.64 0.16
(−0.29, 0.62)11.94 −0.03
(−0.25, 0.19)11.97 0.14
(−0.14, 0.42)≥ 24 22 16.19 −0.72
(−1.79, 0.35)16.14 −0.33
(−1.10, 0.43)11.76 −0.21
(0.61, 0.20)11.85 0.02
(−0.45, 0.49)F value 1.80 4.09 0.62 1.96 P value 0.110 0.001 0.684 0.083 Note. * Mean value after adjusting for gender. **Mean value after adjusting for gender, birthweight, survey site, nocturnal sleep time, middle-and high-level physical activity time, eating behavior score, balanced diet index score, parental BMI, and education level. HAZ was also adjusted for fat-free mass. After adjusting for potential confounders, the fat-free mass of ever breastfed infants was higher than that of never breastfed infants (12.84 kg vs. 12.52 kg, F = 5.91, P = 0.015) among children aged 3 years, and was lower (14.31 kg vs. 14.64 kg, F = 3.92, P = 0.048) among children aged 4 years. No statistically significant difference was observed between the two groups in children aged 5 years.
For children aged 3 and 4 years, there was no statistically significant difference in fat-free mass among those with different breastfeeding durations after adjusting for potential confounders.
For children aged 5 years, the overall difference in fat-free mass (F = 4.09, P = 0.001) among children with different breastfeeding durations was statistically significant. However, there were no significant differences between the different breastfeeding duration groups and the reference group (never breastfed).
-
After adjusting for potential confounders, there was no statistically significant difference in body fat indicators between the ever breastfed and never breastfed groups and the different breastfeeding duration groups for children aged 3–5 years (Tables 6–7).
Table 6. Relationship between breastfeeding status and body fat mass, and fat mass index
Variables n Body fat mass, kg Body fat mass index, kg/m2 Adjusted* Difference
(95% CI)Adjusted** Difference
(95% CI)Adjusted* Difference
(95% CI)Adjusted** Difference
(95% CI)Children aged 3 years Breastfeeding 632 Never 72 2.76 Referent 2.75 Referent 2.77 Referent 2.73 Referent Ever 560 2.71 0.98
(0.90, 1.07)2.79 1.02
(0.91, 1.12)2.72 0.98
(0.90, 1.10)2.80 1.03
(0.93, 1.13)F value 0.18 0.08 0.16 0.26 P value 0.669 0.771 0.690 0.608 Breastfeeding duration
(months)613 Never 72 2.76 Referent 2.74 Referent 2.77 Referent 2.73 Referent < 4 68 2.78 1.01
(0.86, 1.18)2.92 1.07
(0.89, 1.27)2.79 1.01
(0.87, 1.17)2.95 1.08
(0.91, 1.29)4– 16 2.86 1.03
(0.80, 1.34)2.83 1.03
(0.78, 1.37)2.72 0.98
(0.77, 1.26)2.76 1.01
(0.77, 1.33)6– 172 2.73 0.99
(0.87, 1.13)2.80 1.02
(0.88, 1.19)2.72 0.98
(0.87, 1.11)2.78 1.02
(0.88, 1.18)12– 264 2.69 0.97
(0.86, 1.10)2.73 1.00
(0.87, 1.15)2.72 0.98
(0.87, 1.11)2.77 1.01
(0.88, 1.17)≥ 24 21 2.44 0.88
(0.70, 1.11)2.67 0.97
(0.75, 1.27)2.53 0.91
(0.73, 1.14)2.83 1.04
(0.80, 1.34)F value 0.54 0.31 0.28 0.32 P value 0.750 0.909 0.926 0.899 Children aged 4 years Breastfeeding 692 Never 68 3.31 Referent 3.46 Referent 2.81 Referent 2.92 Referent Ever 624 3.16 0.95
(0.86, 1.05)3.18 0.92
(0.81, 1.04)2.77 0.98
(0.90, 1.08)2.78 0.95
(0.85, 1.07)F value 0.90 1.69 0.10 0.64 P value 0.344 0.194 0.749 0.425 Breastfeeding duration
(months)656 Never 68 3.31 Referent 3.49 Referent 2.81 Referent 2.94 Referent < 4 78 3.26 0.98
(0.83, 1.16)3.35 0.96
(0.79, 1.18)2.86 1.02
(0.87, 1.19)2.93 0.99
(0.82, 1.20)4– 24 3.11 0.94
(0.74, 1.19)3.04 0.87
(0.66, 1.14)2.71 0.96
(0.77, 1.21)2.63 0.89
(0.69, 1.15)6– 195 3.2 0.97
(0.84, 1.11)3.30 0.95
(0.79, 1.13)2.80 0.99
(0.87, 1.13)2.85 0.97
(0.82, 1.14)12– 263 3.11 0.94
(0.82, 1.08)3.13 0.9
(0.76, 1.06)2.74 0.97
(0.86, 1.11)2.75 0.94
(0.80, 1.10)≥ 24 28 3.16 0.95
(0.76, 1.19)3.11 0.89
(0.69, 1.15)2.75 0.98
(0.79, 1.21)2.74 0.93
(0.73, 1.18)F value 0.37 0.86 0.22 0.57 P value 0.869 0.507 0.952 0.724 Children aged 5 years Breastfeeding 643 Never 71 3.48 Referent 3.22 Referent 2.66 Referent 2.46 Referent Ever 572 3.42 0.98
(0.88, 1.09)3.54 1.1
(0.96, 1.26)2.65 1.00
(0.90, 1.10)2.73 1.11
(0.97, 1.26)F value 0.10 1.81 0.01 2.39 P value 0.747 0.180 0.929 0.123 Breastfeeding duration
(months)623 Never 71 3.49 Referent 3.24 Referent 2.66 Referent 2.48 Referent < 4 70 3.14 0.90
(0.75, 1.08)3.46 1.07
(0.85, 1.35)2.41 0.9
(0.76, 1.07)2.61 1.06
(0.85, 1.31)4– 26 3.83 1.10
(0.86, 1.41)4.22 1.30
(0.98, 1.73)2.96 1.11
(0.88, 1.4)3.24 1.31
(1.00, 1.72)6– 175 3.39 0.97
(0.83, 1.13)3.42 1.05
(0.86, 1.29)2.63 0.99
(0.85, 1.14)2.64 1.07
(0.88, 1.29)12– 259 3.49 1.00
(0.87, 1.16)3.55 1.09
(0.91, 1.32)2.71 1.02
(0.89, 1.17)2.74 1.11
(0.93, 1.32)≥ 24 22 3.43 0.98
(0.76, 1.28)3.73 1.15
(0.84, 1.57)2.66 1.00
(0.78, 1.28)2.89 1.17
(0.87, 1.56)F value 1.04 1.29 1.33 1.54 P value 0.391 0.269 0.251 0.175 Note. Regression analyses of body fat mass and body fat mass index were conducted after logarithmic transformation, and the antilog of the mean difference after logarithmic transformation was reported. * Mean value after adjusting for gender. **Mean value after adjusting for gender, birthweight, survey site, nocturnal sleep time, middle- and high-level physical activity time, eating behavior score, balanced diet index score, parental BMI, and education level. Table 7. Association of breastfeeding status with percentage of fat in children stratified by age
Variables n Percentage of body fat, % Adjusted* Difference (95% CI) Adjusted** Difference (95% CI) Children aged 3 years Breastfeeding 632 Never 72 18.22 Referent 18.44 Referent Ever 560 18.07 −0.15 (−1.41, 1.11) 18.55 0.11 (−1.33, 1.55) F value 0.05 0.02 P value 0.817 0.882 Breastfeeding duration (months) 613 Never 72 18.22 Referent 18.44 Referent < 4 68 18.54 0.32 (−1.86, 2.50) 19.40 0.96 (−1.56, 3.48) 4– 16 17.29 −0.93 (−4.40, 2.55) 17.49 −0.95 (−4.83, 2.94) 6– 172 17.99 −0.23 (−2.04, 1.58) 18.35 −0.09 (−2.20, 2.02) 12– 264 18.12 −0.10 (−1.82, 1.62) 18.39 −0.05 (−2.05, 1.95) ≥ 24 21 17.46 −0.76 (−3.95, 2.44) 19.13 0.69 (−3.06, 4.44) F value 0.28 0.51 P value 0.927 0.767 Children aged 4 years Breastfeeding 692 Never 68 18.87 Referent 19.10 Referent Ever 624 18.53 −0.35 (−1.69, 0.99) 18.63 −0.47 (−2.17, 1.23) F value 0.26 0.29 P value 0.611 0.590 Breastfeeding duration (months) 656 Never 68 18.87 Referent 19.23 Referent < 4 78 19.17 0.30 (−1.94, 2.54) 19.49 0.26 (−2.50, 3.02) 4– 24 17.99 −0.89 (−4.11, 2.33) 17.79 −1.43 (−5.16, 2.29) 6– 195 18.65 −0.21 (−2.11, 1.69) 19.02 −0.21 (−2.63, 2.20) 12– 263 18.29 −0.58 (−2.41, 1.25) 18.47 −0.76 (−3.06, 1.54) ≥ 24 28 18.20 −0.67 (−3.72, 2.37) 18.17 −1.06 (−4.59, 2.46) F value 0.47 0.60 P value 0.801 0.702 Children aged 5 years Breastfeeding 643 Never 71 18.35 Referent 17.07 Referent Ever 572 18.01 −0.34 (−1.82, 1.13) 18.50 1.43 (−0.50, 3.36) F value 0.21 2.13 P value 0.646 0.146 Breastfeeding duration (months) 623 Never 71 18.36 Referent 17.18 Referent < 4 70 17.06 −1.30 (−3.82, 1.21) 18.51 1.34 (−1.85, 4.52) 4– 26 19.97 1.60 (−1.85, 5.06) 21.31 4.13 (0.13, 8.13) 6– 175 17.87 −0.49 (−2.61, 1.62) 18.07 0.89 (−1.89, 3.68) 12– 259 18.10 −0.27 (−2.28, 1.74) 18.38 1.20 (−1.39, 3.80) ≥ 24 22 18.53 0.17 (−3.51, 3.85) 19.68 2.50 (−1.81, 6.81) F value 1.02 1.61 P value 0.404 0.157 Note. *Mean value after adjusting for gender. **Mean value after adjusting for gender, birthweight, survey site, nocturnal sleep time, middle- and high-level physical activity time, eating behavior score, balanced diet index score, parental BMI, and education level. -
In the present study, no significant associations were detected between fat mass, fat mass index, and fat percentage in children age 3–5 years and breastfeeding status or duration. Although fat-free mass was higher in ever breastfed children than in never breastfed children at 3 years of age and lower at 4 years of age, the difference was eliminated at 5 years of age. After adjusting for potential confounders, there was no significant association between fat-free mass index and breastfeeding status or duration of breastfeeding in children aged 3–5 years.
-
In the present study, we found that, compared with the never breastfed group, the HAZ of the ever breastfed group was lower among children aged 3 years, and the WAZ of the ever breastfed group was lower among children aged 4 years. However, consistent with findings from earlier studies[18,23], we found that there was no difference in WHZ/BAZ between breastfed and non-breastfed children aged 3–5 years. The Promotion of Breastfeeding Intervention Trial (PROBIT) showed that breastfeeding promotion intervention resulted in substantial increases in breastfeeding duration and exclusivity. However, there were no observed significant effects on BMI, waist or hip circumference, triceps thickness, or subscapular skinfold thickness at the age of 6.5 years[32]. Weight gain results from linear growth and soft tissue gain. Linear growth appeared to be predominantly associated with childhood weight gain. This may partly explain why the significant results disappeared when WHZ/BAZ was used to represent the weight change separated from the change in height.
-
Three studies (two prospective studies[16,33] and a retrospective study[23]) showed no statistically significant difference in the fat mass of breastfed and formula-fed preschool children, which was measured using dual-energy X-ray absorptiometry (DXA), the gold standard for body composition measurement. Sobik et al.[34] reported that there was no significant difference in fat mass index (FMI) between breastfed (BF) and cow’s milk-based formula-fed (MF) children at 36 and 48 months. However, by 60 and 72 months, BF children had significantly lower FMI (3.6 and 3.5 kg fat mass/m2, respectively) than MF children (4.1 and 4.1 kg fat mass/m2, respectively). In their study, 526 children [BF, MF, and Soy formula (SF) were 178, 179, and 169, respectively] were recruited at 1–2 months of age and followed up at 3, 6, 9, 12, 24, 36, 48, 60, and 72 months of age when body composition was measured using DXA. Although DXA and BIA were used to measure body composition in the study by Sobik et al. and in the current study, respectively, BIA and DXA reported high concordance for FM values[35] and some studies reported results consistent with those of DXA[23,33]. In addition, birth weight and physical growth of children are related to body composition; for example, the breastfeeding of preterm infants, compared with formula feeding, is associated with slower weight gain and lower fat mass[36-37]. Sobik et al. excluded infants who were preterm (< 37 weeks), had birth weight < 2.7 kg or > 4.1 kg, and body weights < 5 kg at 3 months of age, which may have led to statistically significant results.
Similar to the results of the present study, some studies found no significant differences in fat mass indicators at 3 years[22], 5–6 years[23,38], 6–8 years of age[39] among different breastfeeding durations. In contrast, Robinson et al. reported that children with longer duration of breastfeeding had lower fat mass at 4 years compared with never breastfed children (4.5 kg in children breastfed for 12 months or more and 5.0 kg in children never breastfed). Robinson et al. only adjusted for the timing of complementary feeding and some child and parental characteristics (such as gender, birth weight, maternal age, BMI, and education level), whereas we adjusted for those confounders and recent diet, eating behavior, physical activity, and night sleep time of preschool children. Therefore, the inconsistent association between these two studies may be partly explained by the confounders. Although different from the breastfeeding duration groups in our study, Hildebrand et al. recently reported that breastfeeding duration was inversely associated with the percentage body fat in children at ages 4–8 years[40]. Their cross-sectional study included 823 children (16% were overweight and 13% obese), and they found that adjusted mean percentage body fat was 16.8, 14.5, and 13.4, respectively, for none, ˂ 6, and ≥ 6 months of exclusive breastfeeding, although no statistically significant associations were observed between breastfeeding and obesity. As the present study only included 9.6% overweight/obese children, our results do not refute the significant inverse association found in this study.
-
Compared to that of formula-fed children, the fat free mass of breastfed infants was higher for children aged 3 years (12.84 kg vs. 12.52 kg, P = 0.015) and lower for those aged 4 years (14.31 kg vs. 14.64 kg, P = 0.048); and the difference was eliminated for 5-year-old children (16.40 kg vs. 16.42 kg, P = 0.914) after adjusting for potential confounders. Due to the normal growth and development of preschool children and the introduction of confounders that affect infant feeding and child body composition, the effect of breastfeeding on fat-free mass has faded. Nancy et al.[16] reported that the fat-free mass of formula-fed infants was higher than that of breastfed infants at 3 months of age, and the bone mineral content of formula-fed infants was higher than that of breast-fed infants at 12 months; however, the difference was no longer statistically significant after 2 years of age. Furthermore, a systematic review and meta-analysis in 2012 showed that formula-fed infants had a higher fat-free mass at 3–4 months, 8–9 months, and 12 months of age than breastfed infants, but the difference was no longer significant after 12 months of age[17]. In addition, according to the reference values of body composition for children aged 0–10 years in the United States, as reported by Fomon et al. in 1982[41], and a review of body composition of children from the fetal stage to 5 years of age by Toro-Ramos et al. in 2015[42], children aged 4–6 years experienced rapid increases in body fat and fat-free mass. Meanwhile, there were three age groups (3, 4, and 5 years) rather than a follow-up of the same population, although the basic characteristics were similar. Therefore, it could not be determined whether the differences originated from age or population. Future studies should explore the association of breastfeeding and fat-free mass in preschool children and its inconsistency with different ages.
Because linear growth appeared to be predominantly associated with childhood fat-free mass, we used the fat-free mass index to represent the fat-free mass change that was separated from the change in height, and found that there was no difference in the fat-free mass index between breastfed and non-breastfed infants. Sobik et al. reported findings consistent with ours[34]. In addition, consistent with our findings, some studies found no statistically significant difference in fat-free mass index in preschool children among different breastfeeding durations[22,38-39].
The proportion of breastfeeding was 89.2% in this study. Li et al. summarized the data of 20 cities across China and found that the prevalence of breastfeeding at 0 or 1 month ranged from 82.09% in Shanghai (large city, Eastern China) to 99.5% in Akesu (a medium-sized city in Xinjiang Uygur Autonomous Region, West China) from 2007 to 2017[43]. Globally, the prevalence of breastfeeding was approximately 97%, 95%, and 85% in lower-middle-, upper-middle-, and high-income countries, respectively, in 2010[2]. Despite its established benefits, the prevalence of breastfeeding in some regions of China is much lower than that in other middle-income countries. Therefore, public health efforts should be made to raise awareness regarding the benefits of breastfeeding and its continuation in adherence to recommendations for optimal benefit.
-
The present study explored the relationship between breastfeeding duration in infants and body composition of 3 to 5-year-old children in the Chinese population, which could provide scientific evidence for formulating infant and young child feeding guidelines to promote breastfeeding and early prevention of overweight and obesity in children. However, this study had several limitations. First, as this was a cross-sectional study, the relationship between breastfeeding in infants and body composition of preschool children may not be causal. In addition, as an observational study, unrecognized confounders may still exist, although we adjusted for some recognized confounders through stratified and multifactorial analyses. Finally, the study retrospectively collected data on breastfeeding duration in infants aged 3–5 years, which may lead to a recall bias.
-
Although breastfeeding has multiple health benefits, there may not be a clear association between breastfeeding duration and body fat mass. Future studies should explore the association between breastfeeding duration and fat-free mass in preschool children and its inconsistency with different ages. It is recommended that the government, health workers, and social forces join efforts to foster a positive environment for breastfeeding and promote scientific breastfeeding in China for other health benefits.
-
The authors declare that they have no competing interests.
doi: 10.3967/bes2023.085
Association of Breastfeeding Duration with Body Composition in Children Aged 3–5 Years
-
Abstract:
Objective This study aimed to assess the relationship between the body composition of children aged 3–5 years and breastfeeding status and duration. Methods The study was conducted using data from the National Nutrition and Health Systematic Survey for children 0–17 years of age in China (CNHSC), a nationwide cross-sectional study. Breastfeeding information and potential confounders were collected using standardized questionnaires administered through face-to-face interviews. The body composition of preschool children was measured using bioelectrical impedance analysis. A multivariate linear regression model was used to assess the relationship between breastfeeding duration and body composition after adjusting for potential confounders. Results In total, 2,008 participants were included in the study. Of these, 89.2% were ever breastfed and the median duration of breastfeeding was 12 months (IQR 7–15 months). Among children aged 3 years, the height-for-age Z-score (HAZ) for the ever breastfed group was lower than that for never breastfed group (0.12 vs. 0.42, P = 0.043). In addition, the weight-for-age Z-score (WAZ) of the ever breastfed group was lower than that of the never breastfed group (0.31 vs. 0.65, P = 0.026), and the WAZ was lower in children aged 4 years who breastfed between 12 and 23 months than in those who never breastfed. Compared to the formula-fed children, the fat-free mass of breastfed infants was higher for children aged 3 years (12.84 kg vs. 12.52 kg, P = 0.015) and lower for those aged 4 years (14.31 kg vs. 14.64 kg, P = 0.048), but no difference was detected for children aged 5 years (16.40 kg vs. 16.42 kg, P = 0.910) after adjusting for potential confounders. No significant difference was detected in the weight-for-height Z-score (WHZ), body mass index (BMI)-for-age Z-score (BAZ), fat-free mass index, and body fat indicators in the ever breastfed and never breastfed groups and among various breastfeeding duration groups for children aged 3–5 years. Conclusion No obvious associations were detected between breastfeeding duration, BMI, and fat mass indicators. Future prospective studies should explore the relationship between breastfeeding status and fat-free mass. -
Key words:
- Breastfeeding /
- Breastfeeding duration /
- Bioelectrical impedance analysis /
- Body composition /
- Pre-school children
注释:1) AUTHORS’ CONTRIBUTIONS: -
Table 1. Characteristics of children and parents
Characteristics N (%) or Mean ± SD Children Age groups (years) 3 32.0 (642/2,008) 4 34.8 (700/2,008) 5 33.2 (666/2,008) Gender Boy 50.2 (1,008/2,008) Girl 49.8 (1,000/2,008) Residential area Urban 54.9 (1,102/2,008) Rural 45.1 (906/2,008) Region North 55.1 (1,106/2,008) South 44.9 (902/2,008) Survey site Taigu County 18.0 (362/2,008) Jichang District 17.9 (360/2,008) Yongji County 19.1 (384/2,008) Qingshan Lake District 17.6 (354/2,008) Yuelu District 19.4 (388/2,008) Longchuan County 8.0 (160/2,008) Annual household income (per capita CNY*) ˂ 10,000 4.2 (85/2,004) 10,000– 7.3 (146/2,004) ≥ 20,000 12.2 (245/2,004) Refusal to answer 41.3 (828/2,004) Unknown 34.9 (700/2,004) Birth weight (g) < 2,500 2.6 (47/1,814) 2,500–4,000 90.7 (1,645/1,814) > 4,000 6.7 (122/1,814) Gestational age pre-term 4.6 (92/1,997) Term 95.4 (1,905/1,997) Nutrition status Stunting 1.1 (22/2,008) Wasting 1.7 (34/2,008) Underweight 0.8 (17/2,008) Overweight or obesity 9.6 (193/2,008) Breastfeeding Never 10.8 (217/2,007) Ever 89.2 (1,790/2,007) Duration of breastfeeding (months) Never 11.2 (217/1,931) < 4 11.4 (221/1,931) 4– 3.6 (69/1,931) 6– 28.4 (548/1,931) 12– 41.4 (800/1,931) ≥ 24 3.9 (76/1,931) Middle/high-level physical activity time (min) ≥ 60 81.0 (1,467/1,811) < 60 19.0 (344/1,811) Nocturnal sleep time (hours) 9.5 ± 0.6 Eating behavior scores 19.2 ± 3.4 Diet quality distance (scores) 22.6 ± 8.9 Parents Maternal BMI (kg/m2) Underweight 9.4 (180/1,912) Normal 72.2 (1,381/1,912) Overweight 15.1 (288/1,912) Obesity 3.3 (63/1,912) Maternal education Junior high school or below 27.0 (537/1,988) High school 18.5 (368/1,988) Associate’s degree 22.6 (450/1,988) Bachelor’s degree or above 31.8 (633/1,988) Father’s BMI (kg/m2) Underweight 3.0 (56/1,868) Normal 56.6 (1,057/1,868) Overweight 33.3 (622/1,868) Obesity 7.1 (133/1,868) Father’s education Junior high school or below 29.1 (580/1,996) High school 19.5 (390/1,996) Associate’s degree 19.9 (397/1,996) Bachelor’s degree or above 31.5 (629/1,996) Note. *CNY: Chinese Yuan.  下载: 导出CSV
Table 2. Status of body composition and anthropometric measurements for children aged 3 to 5 years
Variables Total 3 years 4 years 5 years n M (IQR) or
Mean ± SDn M (IQR) or
Mean ± SDn M (IQR) or
Mean ± SDn M (IQR) or
Mean ± SDBody composition Total body water (kg) 2,007 10.8 ± 1.7 641 9.5 ± 1.1 700 10.7 ± 1.3 666 12.2 ± 1.5 Total fat-free mass (kg) 1,999 14.6 ± 2.3 641 12.8 ± 1.5 700 14.6 ± 1.7 658 16.5 ± 1.9 Fat-free mass index (kg/m2.5) 1,999 12.3 ± 0.8 641 12.8 ± 0.8 700 12.3 ± 0.7 658 11.9 ± 0.7 Total body fat mass (kg) 1,968 3.0 (2.4, 4.0) 632 2.7 (2.1, 3.5) 693 3.2 (2.5, 4.0) 643 3.3 (2.6, 4.5) Fat mass index (kg/m2) 1,968 2.7 (2.1, 3.5) 632 2.7 (2.2, 3.4) 693 2.8 (2.2, 3.5) 643 2.6 (2.1, 3.5) Percentage body fat (%) 1,968 18.2 ± 5.5 632 18.1 ± 5.1 693 18.6 ± 5.5 643 18.1 ± 6.0 Anthropometric status* Height (cm) 2,008 107.1 ± 7.4 642 99.9 ± 4.6 700 107.1 ± 4.9 666 114.0 ± 4.9 Weight (kg) 2,002 17.4 (15.6, 19.6) 642 15.3 (14.2, 16.6) 700 17.5 (16.0, 19.3) 660 19.6 (18.0, 22.1) BMI (kg/m2) 2,002 15.4 (14.6, 16.3) 642 15.4 (14.7, 16.2) 700 15.4 (14.6, 16.3) 660 15.3 (14.5, 16.5) WAZ 2,002 0.2 ± 1.1 642 0.1 ± 1.0 700 0.2 ± 1.0 660 0.3 ± 1.2 HAZ 2,008 0.2 ± 1.0 642 0.1 ± 1.0 700 0.1 ± 1.0 666 0.3 ± 1.0 WHZ 1,342 0.1 ± 1.0 642 0.1 ±1.0 700 0.1 ± 1.0 / / BAZ 2,002 0.1 ± 1.1 642 0.1 ±1.0 700 0.2 ± 1.0 660 0.2 ± 1.3 Note. *HAZ: Height-for-age Z-score, WAZ: Weight-for-age Z-score, WHZ: Weight-for-height Z-score, BAZ: BMI-for-age Z-score.
下载: 导出CSV
Table 3. Relationship between breastfeeding duration and HAZ and WAZ of participants stratified by age
Variables n Height-for-age Z-score (HAZ) Weight-for-age Z-score (WAZ) Adjusted* Difference
(95% CI)Adjusted** Difference
(95% CI)Adjusted* Difference
(95% CI)Adjusted** Difference
(95% CI)Children aged 3 years Breastfeeding 642 Never 72 0.27 Referent 0.42 Referent 0.15 Referent 0.25 Referent Ever 570 0.12 −0.15
(−0.41, 0.10)0.12 −0.30
(−0.58, −0.01)0.14 0
(−0.25, 0.24)0.21 −0.03
(−0.30, 0.23)F value 1.46 4.14 0 0.06 P value 0.228 0.043 0.969 0.799 Breastfeeding duration (months) 623 Never 72 0.27 Referent 0.41 Referent 0.15 Referent 0.24 Referent < 4 68 0 −0.27
(−0.71, 0.16)−0.03 −0.43
(−0.94, 0.08)0.13 −0.02
(−0.44, 0.40)0.27 0.03
(−0.44, 0.49)4– 17 0.66 0.39
(−0.31, 1.08)0.38 −0.02
(−0.81, 0.76)0.50 0.36
(−0.32, 1.03)0.32 0.07
(−0.65, 0.79)6– 174 0.21 −0.06
(−0.42, 0.30)0.23 −0.18
(−0.60, 0.25)0.18 0.03
(−0.32, 0.38)0.24 0
(−0.39, 0.39)12– 266 0.03 −0.24
(−0.59, 0.10)0.05 −0.36
(−0.76, 0.05)0.07 −0.07
(−0.40, 0.26)0.19 −0.06
(−0.43, 0.31)≥ 24 26 0.16 −0.12
(−0.70, 0.47)−0.29 −0.69
(−1.41, 0.03)0.34 0.20
(−0.37, 0.77)−0.08 −0.33
(−0.99, 0.34)F value 2.15 2.19 0.96 0.44 P value 0.058 0.054 0.440 0.819 Children aged 4 years Breastfeeding 699 Never 71 0.38 Referent 0.40 Referent 0.46 Referent 0.65 Referent Ever 628 0.10 −0.28
(−0.51, −0.04)0.12 −0.28
(−0.58, 0.01)0.15 −0.31
(−0.55, −0.07)0.31 −0.34
(−0.64, −0.04)F value 5.21 3.60 6.22 4.99 P value 0.023 0.058 0.013 0.026 Breastfeeding duration (months) 663 Never 71 0.38 Referent 0.41 Referent 0.46 Referent 0.66 Referent < 4 80 0.21 −0.17
(−0.56, 0.22)0.29 −0.12
(−0.60, 0.35)0.21 −0.25
(−0.65, 0.15)0.44 −0.22
(−0.70, 0.26)4– 24 0.10 −0.28
(−0.85, 0.29)0.14 −0.28
(−0.93, 0.37)0.15 −0.31
(−0.89, 0.28)0.29 −0.37
(−1.03, 0.29)6– 196 0.16 −0.22
(−0.55, 0.12)0.23 −0.18
(−0.60, 0.24)0.20 −0.26
(−0.60, 0.08)0.48 −0.18
(−0.61, 0.24)12– 264 0.07 −0.30
(−0.62, 0.02)0.03 −0.38
(−0.78, 0.02)0.15 −0.31
(−0.64, 0.02)0.21 −0.45
(−0.85, −0.05)≥ 24 28 0.10 −0.27
(−0.81, 0.26)−0.06 −0.47
(−1.09, 0.14)0.13 −0.33
(−0.88, 0.22)0.14 −0.52
(−1.15, 0.10)F value 1.23 1.84 1.18 2.43 P value 0.292 0.105 0.315 0.034 Children aged 5 years Breastfeeding 666 Never 74 0.48 Referent 0.40 Referent 0.53 Referent 0.33 Referent Ever 592 0.32 −0.16
(−0.39, 0.06)0.34 −0.06
(−0.35, 0.24)0.13 −0.22
(−0.49, 0.06)0.34 0.02
(−0.34, 0.37)F value 1.96 0.14 2.46 0.01 P value 0.162 0.709 0.117 0.925 Breastfeeding duration (months) 645 Never 74 0.48 Referent 0.40 Referent 0.53 Referent 0.36 Referent < 4 73 0.51 0.03
(−0.36, 0.42)0.67 0.27
(−0.22, 0.75)0.37 −0.16
(−0.63, 0.31)0.64 0.28
(−0.30, 0.87)4– 28 0.42 0.06
(−0.59, 0.46)0.42 0.01
(−0.60, 0.63)0.53 0
(−0.64, 0.63)0.68 0.32
(−0.42, 1.06)6– 178 0.35 −0.13
(−0.46, 0.19)0.39 −0.01
(−0.44, 0.41)0.28 −0.26
(−0.65, 0.14)0.25 −0.10
(−0.62, 0.41)12– 270 0.22 −0.27
(−0.58, 0.04)0.25 −0.15
(−0.55, 0.24)0.29 −0.25
(−0.62, 0.13)0.34 −0.02
(−0.49, 0.46)≥ 24 22 0.41 −0.07
(−0.65, 0.50)0.39 −0.01
(−0.67, 0.65)0.16 −0.37
(−1.07, 0.32)0.23 −0.13
(−0.92, 0.67)F value 1.82 1.69 0.92 1.28 P value 0.106 0.135 0.470 0.273 Note. *Mean value after adjusting for gender. **Mean values after adjusting for gender, birth weight, survey site, nocturnal sleep time, middle- and high-level physical activity time, eating behavior score, balanced diet index score, parental BMI, and education level.
下载: 导出CSV
Table 4. Relationship between breastfeeding duration and WHZ or BAZ of participants stratified by age
Variables n Weight-for-height Z-score (WHZ) or BMI-for-age Z-score (BAZ) Adjusted* Difference (95% CI) Adjusted** Difference (95% CI) Children aged 3 years Breastfeeding 642 Never 72 −0.02 Referent 0.001 Referent Ever 570 0.11 −0.08 0.21 0.21 (−0.07, 0.49) F value 1.00 0.13 (−0.12, 0.37) 2.08 P value 0.317 0.150 Breastfeeding duration (months) 623 Never 72 −0.02 Referent 0.01 Referent < 4 68 0.19 0.21 (−0.22, 0.64) 0.42 0.42 (−0.08, 0.91) 4– 17 0.19 0.21 (−0.48, 0.89) 0.14 0.13 (−0.63, 0.89) 6– 174 0.08 0.10 (−0.26, 0.45) 0.16 0.15 (−0.26, 0.56) 12– 266 0.09 0.37 (−0.21, 0.95) 0.22 0.22 (−0.17, 0.61) ≥ 24 26 0.35 0.10 0.09 (−0.61, 0.80) F value 0.70 1.03 P value 0.626 0.399 Children aged 4 years Breastfeeding 699 Never 71 0.28 Referent 0.55 Referent Ever 628 0.10 −0.18 (−0.43, 0.07) 0.32 −0.23 (−0.54, 0.09) F value 2.09 1.94 P value 0.149 0.164 Breastfeeding duration (months) 663 Never 71 0.28 Referent 0.56 Referent < 4 80 0.10 −0.19 (−0.60, 0.23) 0.37 −0.20 (−0.71, 0.32) 4– 24 0.09 −0.19 (−0.80, 0.41) 0.27 −0.29 (−1.00, 0.42) 6– 196 0.12 −0.17 (−0.52, 0.19) 0.47 −0.09 (−0.54, 0.37) 12– 264 0.12 −0.16 (−0.51, 0.18) 0.26 −0.30 (−0.74, 0.13) ≥ 24 28 0.05 −0.23 (−0.81, 0.34) 0.22 −0.34 (−1.01, 0.33) F value 0.39 1.10 P value 0.856 0.361 Children aged 5 years Breastfeeding 666 Never 74 0.31 Referent 0.08 Referent Ever 592 0.14 −0.17 (−0.47, 0.13) 0.17 0.09 (−0.30, 0.49) F value 1.26 0.21 P value 0.262 0.649 Breastfeeding duration (months) 645 Never 74 0.32 Referent 0.12 Referent < 4 73 0.08 −0.24 (−0.76, 0.27) 0.33 0.21 (−0.44, 0.86) 4– 28 0.40 0.08 (−0.61, 0.77) 0.62 0.50 (−0.32, 1.33) 6– 178 0.07 −0.25 (−0.68, 0.18) −0.01 −0.13 (−0.70, 0.44) 12– 270 0.20 −0.12 (−0.53, 0.29) 0.25 0.13 (−0.40, 0.66) ≥ 24 22 −0.23 −0.55 (−1.30, 0.21) −0.12 −0.24 (−1.13, 0.64) F value 1.21 1.58 P value 0.301 0.166 Note. * Mean value after adjusting for gender. **Mean value after adjusting for gender, birthweight, survey site, nocturnal sleep time, middle- and high-level physical activity time, eating behavior score, balanced diet index score, parental BMI, and education level.
下载: 导出CSV
Table 5. Relationship between breastfeeding status and fat-free mass and fat-free mass index of children stratified by age
Variables n Fat-free mass, kg Fat-free mass index, kg/m2.5 Adjusted* Difference
(95% CI)Adjusted** Difference
(95% CI)Adjusted* Difference
(95% CI)Adjusted** Difference
(95% CI)Children aged 3 years Breastfeeding 641 Never 71 12.72 Referent 12.52 Referent 12.70 Referent 12.62 Referent Ever 570 12.75 0.03
(−0.32, 0.38)12.84 0.32
(0.06, 0.59)12.75 0.05
(−0.14, 0.24)12.76 0.14
(−0.09, 0.37)F value 0.03 5.91 0.31 1.50 P value 0.868 0.015 0.580 0.222 Breastfeeding duration (months) 622 Never 71 12.72 Referent 12.51 Referent 12.70 Referent 12.63 Referent < 4 68 12.76 0.03
(−0.57, 0.64)12.98 0.46
(0.01, 0.92)12.74 0.04
(−0.29, 0.37)12.83 0.21
(−0.19, 0.61)4– 17 13.62 0.89
(−0.07, 1.86)13.06 0.54
(−0.16, 1.24)12.74 0.04
(−0.49, 0.56)12.70 0.07
(−0.54, 0.69)6– 174 12.85 0.13
(−0.37, 0.63)12.85 0.33
(−0.05, 0.71)12.74 0.04
(−0.23, 0.31)12.74 0.11
(−0.22, 0.44)12– 266 12.63 −0.10
(−0.58, 0.38)12.85 0.33
(−0.03, 0.69)12.77 0.07
(−0.18, 0.33)12.81 0.19
(−0.13, 0.51)≥ 24 26 12.76 0.03
(−0.78, 0.85)12.57 0.06
(−0.59, 0.71)12.77 0.08
(−0.37, 0.52)12.74 0.12
(−0.45, 0.68)F value 1.88 1.94 0.13 0.59 P value 0.096 0.086 0.986 0.711 Children aged 4 years Breastfeeding 699 Never 71 15.20 Referent 14.64 Referent 12.25 Referent 12.17 Referent Ever 628 14.49 −0.71
(−1.12, −0.30)14.31 −0.33
(−0.66, −0.003)12.25 −0.004
(−0.17, 0.16)12.13 −0.04
(−0.26, 0.18)F value 11.79 3.92 0.00 0.12 P value < 0.001 0.048 0.960 0.728 Breastfeeding duration (months) 663 Never 71 15.19 Referent 14.64 Referent Referent 12.17 Referent < 4 80 14.53 −0.67
(−1.34, 0.01)14.29 −0.34
(−0.87, 0.19)12.25 −0.04
(−0.32, 0.24)12.15 −0.01
(−0.38, 0.33)4– 24 14.71 −0.49
(−1.46, 0.49)14.59 −0.04
(−0.77, 0.69)12.22 0.08
(−0.32, 0.49)12.21 0.04
(−0.45, 0.53)6– 196 14.57 −0.62
(−1.19, −0.04)14.30 −0.33
(−0.80, 0.13)12.34 0.001
(−0.24, 0.24)12.17 −0.003
(−0.32, 0.31)12– 264 14.46 −0.73
(−1.29, −0.18)14.26 −0.37
(−0.82, 0.07)12.26 0.004
(−0.23, 0.23)12.08 −0.09
(−0.39, 0.21)≥ 24 28 14.69 −0.51
(−1.43, 0.42)14.48 −0.16
(−0.85, 0.53)12.26 0.001
(−0.38, 0.39)12.17 0.004
(−0.46, 0.47)F value 2.30 1.24 0.13 0.31 P value 0.044 0.290 0.986 0.908 Children aged 5 years Breastfeeding 658 Never 74 16.91 Referent 16.42 Referent 11.96 Referent 11.81 Referent Ever 584 16.46 −0.45
(−0.87, −0.02)16.40 −0.01
(−0.37, 0.33)11.90 −0.06
(−0.22, 0.10)11.87 0.06
(−0.15, 0.28)F value 4.24 0.01 0.55 0.36 P value 0.040 0.914 0.459 0.547 Breastfeeding duration (months) 637 Never 74 16.91 Referent 16.48 Referent 11.97 Referent 11.83 Referent < 4 72 16.79 −0.12
(−0.86, 0.61)16.52 0.04
(−0.52, 0.61)11.92 −0.05
(−0.32, 0.23)11.91 0.08
(−0.27, 0.42)4– 27 16.43 −0.48
(−1.48, 0.51)16.31 −0.16
(−0.87, 0.54)11.87 −0.09
(−0.47, 0.28)11.84 0.01
(−0.43, 0.44)6– 174 16.31 −0.61
(−1.22, 0.01)16.08 −0.40
(−0.89, 0.09)11.87 −0.10
(−0.33, 0.13)11.73 −0.11
(−0.41, 0.20)12– 268 16.45 −0.46
(−1.04, 0.12)16.64 0.16
(−0.29, 0.62)11.94 −0.03
(−0.25, 0.19)11.97 0.14
(−0.14, 0.42)≥ 24 22 16.19 −0.72
(−1.79, 0.35)16.14 −0.33
(−1.10, 0.43)11.76 −0.21
(0.61, 0.20)11.85 0.02
(−0.45, 0.49)F value 1.80 4.09 0.62 1.96 P value 0.110 0.001 0.684 0.083 Note. * Mean value after adjusting for gender. **Mean value after adjusting for gender, birthweight, survey site, nocturnal sleep time, middle-and high-level physical activity time, eating behavior score, balanced diet index score, parental BMI, and education level. HAZ was also adjusted for fat-free mass.
下载: 导出CSV
Table 6. Relationship between breastfeeding status and body fat mass, and fat mass index
Variables n Body fat mass, kg Body fat mass index, kg/m2 Adjusted* Difference
(95% CI)Adjusted** Difference
(95% CI)Adjusted* Difference
(95% CI)Adjusted** Difference
(95% CI)Children aged 3 years Breastfeeding 632 Never 72 2.76 Referent 2.75 Referent 2.77 Referent 2.73 Referent Ever 560 2.71 0.98
(0.90, 1.07)2.79 1.02
(0.91, 1.12)2.72 0.98
(0.90, 1.10)2.80 1.03
(0.93, 1.13)F value 0.18 0.08 0.16 0.26 P value 0.669 0.771 0.690 0.608 Breastfeeding duration
(months)613 Never 72 2.76 Referent 2.74 Referent 2.77 Referent 2.73 Referent < 4 68 2.78 1.01
(0.86, 1.18)2.92 1.07
(0.89, 1.27)2.79 1.01
(0.87, 1.17)2.95 1.08
(0.91, 1.29)4– 16 2.86 1.03
(0.80, 1.34)2.83 1.03
(0.78, 1.37)2.72 0.98
(0.77, 1.26)2.76 1.01
(0.77, 1.33)6– 172 2.73 0.99
(0.87, 1.13)2.80 1.02
(0.88, 1.19)2.72 0.98
(0.87, 1.11)2.78 1.02
(0.88, 1.18)12– 264 2.69 0.97
(0.86, 1.10)2.73 1.00
(0.87, 1.15)2.72 0.98
(0.87, 1.11)2.77 1.01
(0.88, 1.17)≥ 24 21 2.44 0.88
(0.70, 1.11)2.67 0.97
(0.75, 1.27)2.53 0.91
(0.73, 1.14)2.83 1.04
(0.80, 1.34)F value 0.54 0.31 0.28 0.32 P value 0.750 0.909 0.926 0.899 Children aged 4 years Breastfeeding 692 Never 68 3.31 Referent 3.46 Referent 2.81 Referent 2.92 Referent Ever 624 3.16 0.95
(0.86, 1.05)3.18 0.92
(0.81, 1.04)2.77 0.98
(0.90, 1.08)2.78 0.95
(0.85, 1.07)F value 0.90 1.69 0.10 0.64 P value 0.344 0.194 0.749 0.425 Breastfeeding duration
(months)656 Never 68 3.31 Referent 3.49 Referent 2.81 Referent 2.94 Referent < 4 78 3.26 0.98
(0.83, 1.16)3.35 0.96
(0.79, 1.18)2.86 1.02
(0.87, 1.19)2.93 0.99
(0.82, 1.20)4– 24 3.11 0.94
(0.74, 1.19)3.04 0.87
(0.66, 1.14)2.71 0.96
(0.77, 1.21)2.63 0.89
(0.69, 1.15)6– 195 3.2 0.97
(0.84, 1.11)3.30 0.95
(0.79, 1.13)2.80 0.99
(0.87, 1.13)2.85 0.97
(0.82, 1.14)12– 263 3.11 0.94
(0.82, 1.08)3.13 0.9
(0.76, 1.06)2.74 0.97
(0.86, 1.11)2.75 0.94
(0.80, 1.10)≥ 24 28 3.16 0.95
(0.76, 1.19)3.11 0.89
(0.69, 1.15)2.75 0.98
(0.79, 1.21)2.74 0.93
(0.73, 1.18)F value 0.37 0.86 0.22 0.57 P value 0.869 0.507 0.952 0.724 Children aged 5 years Breastfeeding 643 Never 71 3.48 Referent 3.22 Referent 2.66 Referent 2.46 Referent Ever 572 3.42 0.98
(0.88, 1.09)3.54 1.1
(0.96, 1.26)2.65 1.00
(0.90, 1.10)2.73 1.11
(0.97, 1.26)F value 0.10 1.81 0.01 2.39 P value 0.747 0.180 0.929 0.123 Breastfeeding duration
(months)623 Never 71 3.49 Referent 3.24 Referent 2.66 Referent 2.48 Referent < 4 70 3.14 0.90
(0.75, 1.08)3.46 1.07
(0.85, 1.35)2.41 0.9
(0.76, 1.07)2.61 1.06
(0.85, 1.31)4– 26 3.83 1.10
(0.86, 1.41)4.22 1.30
(0.98, 1.73)2.96 1.11
(0.88, 1.4)3.24 1.31
(1.00, 1.72)6– 175 3.39 0.97
(0.83, 1.13)3.42 1.05
(0.86, 1.29)2.63 0.99
(0.85, 1.14)2.64 1.07
(0.88, 1.29)12– 259 3.49 1.00
(0.87, 1.16)3.55 1.09
(0.91, 1.32)2.71 1.02
(0.89, 1.17)2.74 1.11
(0.93, 1.32)≥ 24 22 3.43 0.98
(0.76, 1.28)3.73 1.15
(0.84, 1.57)2.66 1.00
(0.78, 1.28)2.89 1.17
(0.87, 1.56)F value 1.04 1.29 1.33 1.54 P value 0.391 0.269 0.251 0.175 Note. Regression analyses of body fat mass and body fat mass index were conducted after logarithmic transformation, and the antilog of the mean difference after logarithmic transformation was reported. * Mean value after adjusting for gender. **Mean value after adjusting for gender, birthweight, survey site, nocturnal sleep time, middle- and high-level physical activity time, eating behavior score, balanced diet index score, parental BMI, and education level.
下载: 导出CSV
Table 7. Association of breastfeeding status with percentage of fat in children stratified by age
Variables n Percentage of body fat, % Adjusted* Difference (95% CI) Adjusted** Difference (95% CI) Children aged 3 years Breastfeeding 632 Never 72 18.22 Referent 18.44 Referent Ever 560 18.07 −0.15 (−1.41, 1.11) 18.55 0.11 (−1.33, 1.55) F value 0.05 0.02 P value 0.817 0.882 Breastfeeding duration (months) 613 Never 72 18.22 Referent 18.44 Referent < 4 68 18.54 0.32 (−1.86, 2.50) 19.40 0.96 (−1.56, 3.48) 4– 16 17.29 −0.93 (−4.40, 2.55) 17.49 −0.95 (−4.83, 2.94) 6– 172 17.99 −0.23 (−2.04, 1.58) 18.35 −0.09 (−2.20, 2.02) 12– 264 18.12 −0.10 (−1.82, 1.62) 18.39 −0.05 (−2.05, 1.95) ≥ 24 21 17.46 −0.76 (−3.95, 2.44) 19.13 0.69 (−3.06, 4.44) F value 0.28 0.51 P value 0.927 0.767 Children aged 4 years Breastfeeding 692 Never 68 18.87 Referent 19.10 Referent Ever 624 18.53 −0.35 (−1.69, 0.99) 18.63 −0.47 (−2.17, 1.23) F value 0.26 0.29 P value 0.611 0.590 Breastfeeding duration (months) 656 Never 68 18.87 Referent 19.23 Referent < 4 78 19.17 0.30 (−1.94, 2.54) 19.49 0.26 (−2.50, 3.02) 4– 24 17.99 −0.89 (−4.11, 2.33) 17.79 −1.43 (−5.16, 2.29) 6– 195 18.65 −0.21 (−2.11, 1.69) 19.02 −0.21 (−2.63, 2.20) 12– 263 18.29 −0.58 (−2.41, 1.25) 18.47 −0.76 (−3.06, 1.54) ≥ 24 28 18.20 −0.67 (−3.72, 2.37) 18.17 −1.06 (−4.59, 2.46) F value 0.47 0.60 P value 0.801 0.702 Children aged 5 years Breastfeeding 643 Never 71 18.35 Referent 17.07 Referent Ever 572 18.01 −0.34 (−1.82, 1.13) 18.50 1.43 (−0.50, 3.36) F value 0.21 2.13 P value 0.646 0.146 Breastfeeding duration (months) 623 Never 71 18.36 Referent 17.18 Referent < 4 70 17.06 −1.30 (−3.82, 1.21) 18.51 1.34 (−1.85, 4.52) 4– 26 19.97 1.60 (−1.85, 5.06) 21.31 4.13 (0.13, 8.13) 6– 175 17.87 −0.49 (−2.61, 1.62) 18.07 0.89 (−1.89, 3.68) 12– 259 18.10 −0.27 (−2.28, 1.74) 18.38 1.20 (−1.39, 3.80) ≥ 24 22 18.53 0.17 (−3.51, 3.85) 19.68 2.50 (−1.81, 6.81) F value 1.02 1.61 P value 0.404 0.157 Note. *Mean value after adjusting for gender. **Mean value after adjusting for gender, birthweight, survey site, nocturnal sleep time, middle- and high-level physical activity time, eating behavior score, balanced diet index score, parental BMI, and education level.
下载: 导出CSV
-
[1] Binns C, Lee M, Low WY. The long-term public health benefits of breastfeeding. Asia Pac J Public Health, 2016; 28, 7−14. doi: 10.1177/1010539515624964 [2] Victora CG, Bahl R, Barros AJD, et al. Breastfeeding in the 21st century: epidemiology, mechanisms, and lifelong effect. Lancet, 2016; 387, 475−90. doi: 10.1016/S0140-6736(15)01024-7 [3] National Health Commission of the People's Republic of China. http://www.nhc.gov.cn/fys/s3585/202111/96aa8421ae0045708f3f06e776355193.shtml. [2021-11-23]. [4] World Health Organization. Obesity and overweight. https://www.who.int/news-room/fact-sheets/detail/obesity-and-overweight. [2021-03-12]. [5] Yu DM, Ju LH, Zhao LY, et al. Prevalence and characteristics of overweight and obesity in Chinese children aged 0–5 years. Chin J Epidemiol, 2018; 39, 710−14. (In Chinese [6] Mameli C, Mazzantini S, Zuccotti GV. Nutrition in the first 1000 days: the origin of childhood obesity. Int J Environ Res Public Health, 2016; 13, 838. doi: 10.3390/ijerph13090838 [7] Yang ZY, Huffman SL. Nutrition in pregnancy and early childhood and associations with obesity in developing countries. Matern Child Nutr, 2013; 9, 105−19. doi: 10.1111/mcn.12010 [8] Lanigan J, Barber S, Singhal A. Prevention of obesity in preschool children. Proc Nutr Soc, 2010; 69, 204−10. doi: 10.1017/S0029665110000029 [9] Yang ZY, Zhang Q, Fang HY, et al. Collaborative efforts of families, schools, health care providers, and the government to control childhood obesity in China. Biomed Environ Sci, 2021; 34, 439−42. [10] Arenz S, Rückerl R, Koletzko B, et al. Breast-feeding and childhood obesity-a systematic review. Int J Obes, 2004; 28, 1247−56. doi: 10.1038/sj.ijo.0802758 [11] Horta BL, de Mola CL, Victora CG. Long-term consequences of breastfeeding on cholesterol, obesity, systolic blood pressure and type 2 diabetes: a systematic review and meta-analysis. Acta Paediatr, 2015; 104, 30−7. doi: 10.1111/apa.13133 [12] Owen CG, Martin RM, Whincup PH, et al. Effect of infant feeding on the risk of obesity across the life course: a quantitative review of published evidence. Pediatrics, 2005; 115, 1367−77. doi: 10.1542/peds.2004-1176 [13] Yan J, Liu L, Zhu Y, et al. The association between breastfeeding and childhood obesity: a meta-analysis. BMC Public Health, 2014; 14, 1267. doi: 10.1186/1471-2458-14-1267 [14] Harder T, Bergmann R, Kallischnigg G, et al. Duration of breastfeeding and risk of overweight: a meta-analysis. Am J Epidemiol, 2005; 162, 397−403. doi: 10.1093/aje/kwi222 [15] Bell KA, Wagner CL, Feldman HA, et al. Associations of infant feeding with trajectories of body composition and growth. Am J Clin Nutr, 2017; 106, 491−8. doi: 10.3945/ajcn.116.151126 [16] Butte NF, Wong WW, Hopkinson JM, et al. Infant feeding mode affects early growth and body composition. Pediatrics, 2000; 106, 1355−66. doi: 10.1542/peds.106.6.1355 [17] Chris G, Karen ML, Shalini S, et al. Effect of breastfeeding compared with formula feeding on infant body composition: a systematic review and meta-analysis. Am J Clin Nutr, 2012; 95, 656−69. doi: 10.3945/ajcn.111.027284 [18] Robinson SM, Marriott LD, Crozier SR, et al. Variations in infant feeding practice are associated with body composition in childhood: a prospective cohort study. J Clin Endocrinol Metab, 2009; 94, 2799−805. doi: 10.1210/jc.2009-0030 [19] Pruszkowska-Przybylska P, Sitek A, Rosset I, et al. The association between socioeconomic status, duration of breastfeeding, parental age and birth parameters with BMI, body fat and muscle mass among prepubertal children in Poland. Anthropol Anz, 2019; 76, 409−19. doi: 10.1127/anthranz/2019/0955 [20] Toschke AM, Martin RM, von Kries R, et al. Infant feeding method and obesity: body mass index and dual-energy X-ray absorptiometry measurements at 9-10 y of age from the Avon Longitudinal Study of Parents and Children (ALSPAC). Am J Clin Nutr, 2007; 85, 1578−85. doi: 10.1093/ajcn/85.6.1578 [21] Yin J, Quinn S, Dwyer T, et al. Maternal diet, breastfeeding and adolescent body composition: a 16-year prospective study. Eur J Clin Nutr, 2012; 66, 1329−34. doi: 10.1038/ejcn.2012.122 [22] Ejlerskov KT, Christensen LB, RITZ C, et al. The impact of early growth patterns and infant feeding on body composition at 3 years of age. Br J Nutr, 2015; 114, 316−27. doi: 10.1017/S0007114515001427 [23] Burdette HL, Whitaker RC, Hall WC, et al. Breastfeeding, introduction of complementary foods, and adiposity at 5 y of age. Am J Clin Nutr, 2006; 83, 550−8. doi: 10.1093/ajcn.83.3.550 [24] Tulldahl J, Pettersson K, Andersson SW, et al. Mode of infant feeding and achieved growth in adolescence: early feeding patterns in relation to growth and body composition in adolescence. Obes Res, 1999; 7, 431−7. doi: 10.1002/j.1550-8528.1999.tb00430.x [25] Yang ZY, Zhang Q, Zhai Y, et al. National nutrition and health systematic survey for children 0-17 years of age in China. Biomed Environ Sci, 2021; 34, 891−9. [26] World Health Organization. WHO child growth standards: Methods and development. http://www.who.int/nutrition/publications/childgrowthstandards_technical_report_1/en/. [2021-01-10]. [27] World Health Organization. Growth reference data for 5-19 year. 2007. http://www.who.int/growthref/en/. [2021-01-10]. [28] Guan HY, Zhao X, Qu S, et al. Physical activity guideline for Chinese preschoolers aged 3-6 years. Chinese Journal of Children Health Care, 2020; 714−20. (In Chinese [29] National Health Commission of the People’s Republic of China. WS/T 428-2013 Criteria of weight for adults. Standards Press of China, Beijing, China, 2013. (In Chinese) [30] Fang YH, He YN, Li CL. Evaluation of dietary quality of Chinese preschool children based on Chinese diet balance index for preschool children. Chin J Prev Med, 2020; 54, 662−7. (In Chinese [31] Chinese Nutrition Society. Chinese dietary guideline 2016. People’s Medical Publishing House. 2016. (In Chinese) [32] Kramer MS, Matush L, Vanilovich I, et al. Effects of prolonged and exclusive breastfeeding on child height, weight, adiposity, and blood pressure at age 6.5 y: evidence from a large randomized trial. Am J Clin Nutr, 2007; 86, 1717−21. doi: 10.1093/ajcn/86.5.1717 [33] Durmuş B, Heppe DHM, Gishti O, et al. General and abdominal fat outcomes in school-age children associated with infant breastfeeding patterns. Am J Clin Nutr, 2014; 99, 1351−8. doi: 10.3945/ajcn.113.075937 [34] Sobik S, Sims CR, McCorkle G, et al. Early infant feeding effect on growth and body composition during the first 6 years and neurodevelopment at age 72 months. Pediatr Res, 2021; 90, 140−7. doi: 10.1038/s41390-020-01157-z [35] Achamrah N, Colange G, Delay J, et al. Comparison of body composition assessment by DXA and BIA according to the body mass index: a retrospective study on 3655 measures. PLoS One, 2018; 13, e0200465. doi: 10.1371/journal.pone.0200465 [36] Cerasani J, Ceroni F, De Cosmi V, et al. Human milk feeding and preterm infants' growth and body composition: a literature review. Nutrients, 2020; 12, 1155. doi: 10.3390/nu12041155 [37] Kakaroukas A, Abrahamse-Berkeveld M, Hayes L, et al. Early infancy growth, body composition and type of feeding in late and moderate preterms. Pediatr Res, 2022. [38] de Beer M, Vrijkotte TGM, Fall CHD, et al. Associations of infant feeding and timing of linear growth and relative weight gain during early life with childhood body composition. Int J Obes, 2015; 39, 586−92. doi: 10.1038/ijo.2014.200 [39] Sanchez-Escobedo S, Azcorra H, Bogin B, et al. Birth weight, birth order, and age at first solid food introduction influence child growth and body composition in 6- to 8-year-old Maya children: the importance of the first 1000 days of life. Am J Hum Biol, 2020; 32, e23385. [40] Hildebrand JS, Ferguson PL, Sciscione AC, et al. Breastfeeding associations with childhood obesity and body composition: findings from a racially diverse maternal-child cohort. Child Obes, 2022; 18, 178−87. doi: 10.1089/chi.2021.0138 [41] Fomon SJ, Haschke F, Ziegler EE, et al. Body composition of reference children from birth to age 10 years. Am J Clin Nutr, 1982; 35, 1169−75. doi: 10.1093/ajcn/35.5.1169 [42] Toro-Ramos T, Paley C, Pi-Sunyer FX, et al. Body composition during fetal development and infancy through the age of 5 years. Eur J Clin Nutr, 2015; 69, 1279−89. doi: 10.1038/ejcn.2015.117 [43] Li Q, Tian JL, Xu FL, et al. Breastfeeding in China: a review of changes in the past decade. Int J Environ Res Public Health, 2020; 17, 8234. doi: 10.3390/ijerph17218234 -

 点击查看大图

计量
- 文章访问数: 421
- HTML全文浏览量: 196
- PDF下载量: 179
- 被引次数: 0

 Quick Links