

 下载:
下载:


-
Anemia, a global public health problem, has significant adverse consequences on the cognitive development of children and the work capacity of adults; affecting social and economic development. Globally, roughly 43% of children under five years of age, 38% of pregnant women, and 29% of non-pregnant women had anemia. Anemia during pregnancy significantly increases the risk of low birth weight and preterm birth. A 10 g/L increase in hemoglobin has been estimated to decrease the risk of maternal and perinatal mortality by 29% and 28%, respectively. Prenatal iron supplementation increases birth weight, reducing the risk of low birth weight. Poor iron status can be transferred from mother to child. Infants born prematurely or with low birth weight have compromised iron stores at birth and are at an increased risk of iron deficiency and anemia. It is evidenced that iron deficiency anemia (IDA) accounts for approximately 50% of anemia[1,2], and leads to millions of maternal and infant mortality cases annually, worldwide.
A low-iron diet (LID)[3,4,5] or LID-bloodletting[6,7] in rats are the main rat IDA model. The LID model needs 3–4 to weeks[3,4,5]. LID bloodletting requires a similar amount of time but causes irritation and injury in rats[7]. Both methods need to detect hemoglobin (Hb) values in 2–7 weeks in all rats during whole period to determine whether the rats are anemic[6]. To avoid harmful effects in rats and tedious work, an alternative method is to measure the Hb of all rats and select rats with low Hb values, that is, lower than 9 mg/kg after treatment for a predetermined period such as three weeks or longer[4,7]. The two models are considered uncertain when the rats develop IDA. The substitute method could partly overcome this problem, however, it needs experience to make decisions regarding the time log and induce the waste of rats. Fu et.al. reported a series of studies on pregnant rats with IDA induced by LID and the status of their offspring[8]. The study showed that Hb, red blood cells (RBC), and hematocrit (HCT) levels of offspring from IDA parent rats were significantly lower than those of offspring from the non-IDA control group[8-9]. In addition, birth survival rate and 21 days survival rate of offspring of IDA parents were 80.8% and 51.2%, respectively, while the control group’s was 95.5% and 83.3%[9]. Xie et al. generated IDA offspring rats using LID pregnancy rats to evaluate goose heme, but the birth survival rate and adult survival rate were not mentioned[10]. These studies show the potential feasibility of establishing a stable IDA rat model with a controllable time log and high survival rates. In this study, an IDA rat model was developed using LID pregnant rats and continuous LID in their offspring. IDA model rats were evaluated using iron intervention. This study aimed to establish an iron deficiency anemia rat model with controllable time markers, low mortality, and a high anemia rate in pregnant rats and their offspring.
All the animals were purchased from Beijing Vital River Laboratory Animal Technology. The research protocol was evaluated by the Laboratory Animal Welfare & Ethics Committee, National Institute for Nutrition and Health, Chinese Center for Disease Control and Prevention (20180925).
Pregnant rats (12 weeks, 12 weeks, 330 ± 34 g) that were pregnant for 14 days were divided into two groups: control group A (Group A) and LID group (Group B). Pregnant rats delivered were counted as day 0. Baby rats were allowed to lactate for 21 days, which was the rats wean time. The offspring in Group A were designated as the normal control (NC) group. The offspring in Group B were randomly divided into five IDA groups according to their body weight on day 21. The iron-containing solution was administered by oral gavage and the body weights of all offspring were recorded once daily throughout the 28 days observation period. Grouping, diet, water, and supplemental iron dosages are shown in Table 1. A 12 hours light/dark cycle was used, and the room temperature was kept between 18 °C and 25 °C with humidity from 20% to 50%. All the animals were provided with water and normal chow ad libitum.
Table 1. Grouping, diet, water, and supplemental iron dosages during pregnancy, lactating, and observation periods
Pregnant rat groups Diet and water in pregnancy and lactating of pregnant rats The offspring groups Diet and water in observation period of offspring Interventions in observation period The control group (Group A, n = 2) Standard diet and water normal control group (NC, n = 20, sex in half) Standard diet and water Water 10 mL/kg bw The LID group (Group B, n = 8) LID and deionized water IDA negative control group (IDANC, n = 20, sex in half) LID and deionized water Deionized water 10 mL/kg bw IDA positive control group (IDAPC 2, n = 20, sex in half) LID and deionized water ferrous sulfate 5.42 mg/kg bw containing iron 2 mg/kg bw low-level group (IDAL, n = 20, sex in half) LID and deionized water ferrous lactate 4.34 mg/kgbw containing iron 1 mg/kg bw mid-level group (IDAM, n = 20, sex in half) LID and deionized water ferrous lactate 8.68 mg/kg bw containing iron 2 mg/kg bw high-level group (IDAH, n = 20, sex in half) LID and deionized water ferrous lactate 26.0 mg/kg bw containing iron 6 mg/kg bw Note. The standard diet was formulated according to AIN-93; LID (low-iron diet) was formulated according to AIN-93 without ferric citrate. Ferrous sulfate and ferrous lactate were dissolved in deionized water. LID: Low-iron diet; sex in half: Half male and half female. Body weights and feed consumption were measured daily. Feed conversion efficiency was estimated as feed consumption/(weight after - weight before). Hematological parameters were tested weekly by collecting retroorbital blood.
Rats with IDA showed low weight, inactivity, and sparse and dim fur compared with rats in the normal control (NC) group before the intervention. After the intervention, growth performance remarkably improved compared with rats in the IDA negative control (IDANC) group, but remained worse than that of the rats in the NC group (Supplementary Figure S1, available in www.besjournal.com). The weight changes and feed conversion efficiencies are presented in Supplementary Figures S1 and S2 (available in www.besjournal.com). The body weights of the rats in the IDA group were significantly lower than those in the NC group (P < 0.05) before intervention; however, the body weights of the low-level (IDAL), mid-level (IDAM), high-level (IDAH), and IDA positive control (IDAPC) groups were higher than those of the IDANC group. It appears that the body weights of the intervention groups were dose-dependent. The feed conversion efficiency of the rats in the IDANC group was higher than that in the other groups at the beginning. This value in the NC group increased and became higher than that of the IDA groups, and the IDA groups were similar to each other in the end. IDA reduced the body weight of rats in our study. Similar results have been reported in other studies, such as those by Wang[4], Yingping[7], Liu[9], and Fu[8]. Although iron treatment had a positive effect on the increasing body weight of rats, it did not reach the level observed in the NC group. This perpetual effect of IDA may result from a series of compromised metabolic processes caused by anemia. Anemia can cause low birth weight in young children and adversely affect their growth and development. Iron supplementation has been shown to increase weight-for-age among primary school children with anemia[1,2]. The results of the rat model are similar to those of a population study. A rat model of anemia can simulate the effect of anemia on body weight.
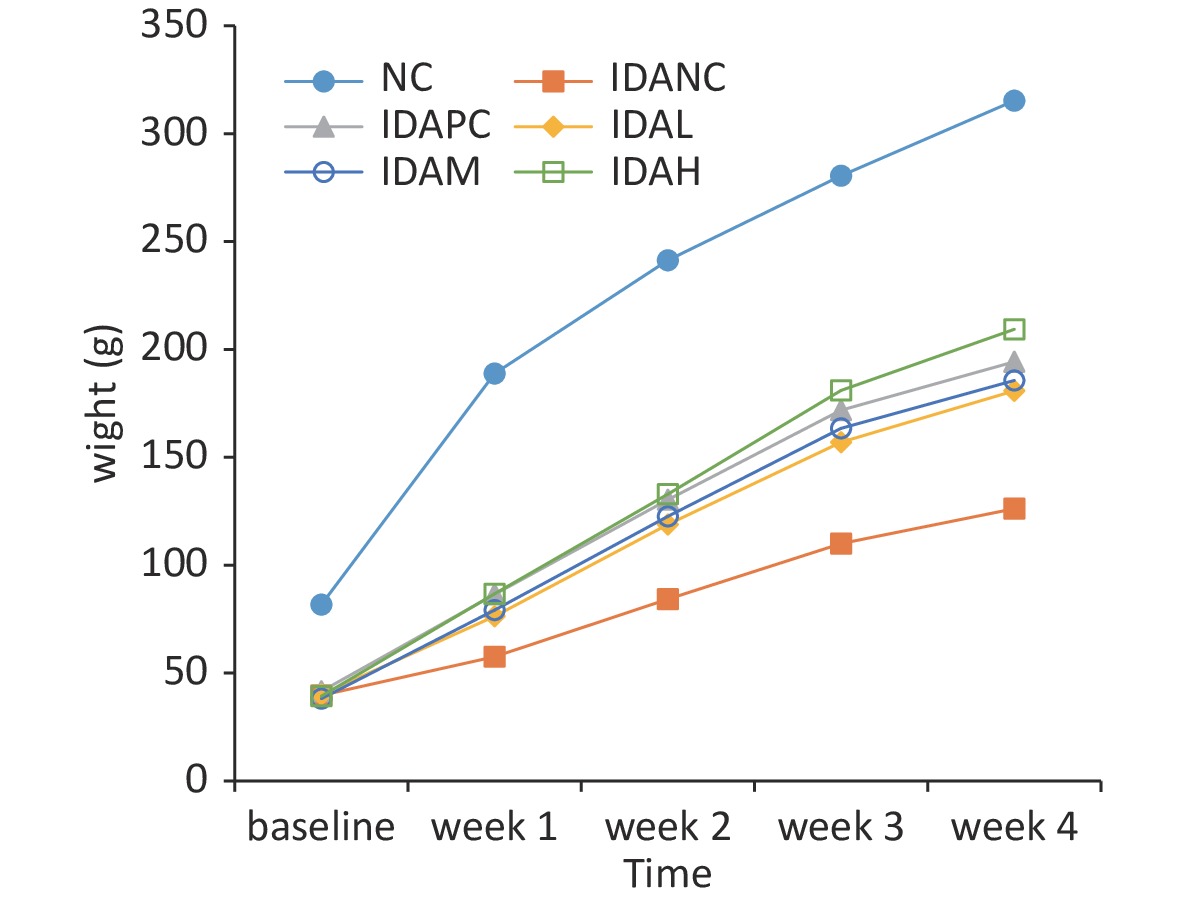
Figure S1. Changes in body weight of rats during this study. NC: normal control group; IDANC: IDA negative control group; IDAPC: IDA positive control group; IDAL: low-level group; IDAM: mid-level group; IDAH: high-level group; IDA: iron deficiency anemia.
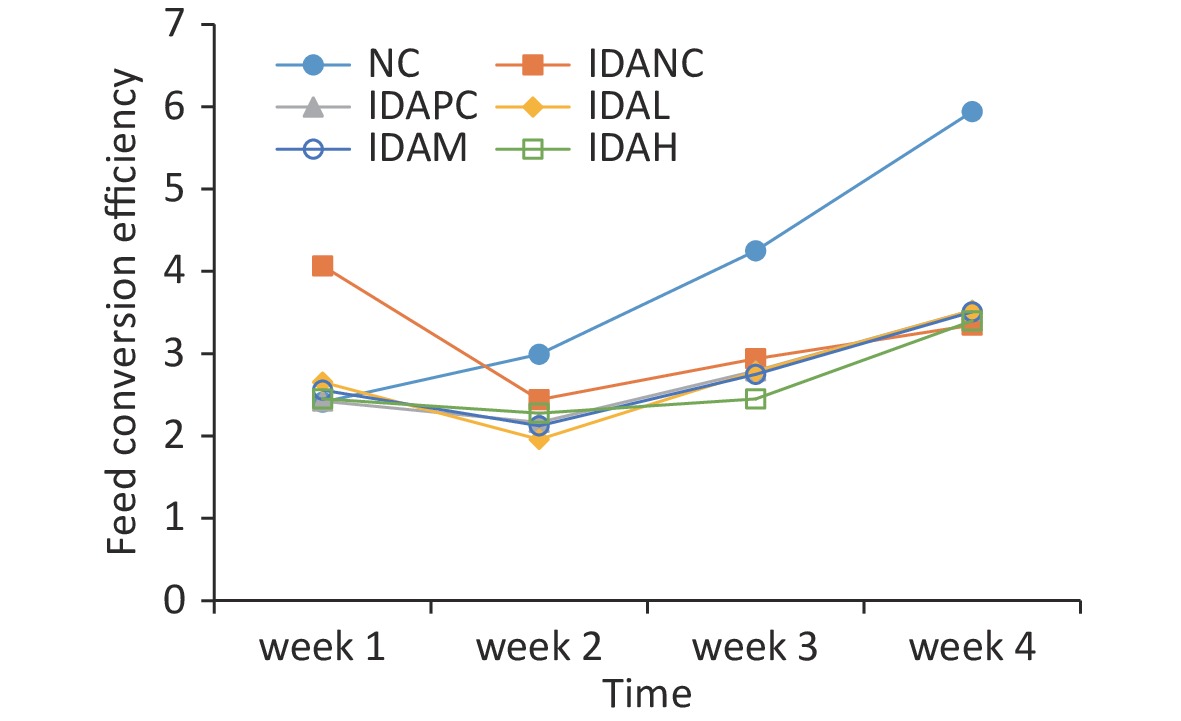
Figure S2. Changes in feed conversion efficiency of rats during this study. NC: normal control group; IDANC: IDA negative control group; IDAPC: IDA positive control group; IDAL: low-level group; IDAM: mid-level group; IDAH: high-level group; IDA: iron deficiency anemia.
Except for inherent differences such as weight, there were no significant differences in other major related data among the sexes. The Hb levels of all offspring in the IDA group were less than 60 g/L on day 21 after birth. This suggests that an iron-deficiency anemia model has been established. The IDA rats modeled in this study showed that Hb and HCT levels of IDA offspring rats was lower than 31.86 g/L–35.00 g/L and 11.33%–12.33% after the 21 days lactation period. This result was consistent with that of Fu’s research[8]. Because anemia is a consequence of LID, it is reasonable to conclude that this method can be used to model rats with IDA. In the other low-iron diet model, the Hb of rats could only be reduced to 100 g/L and not all rats reached this value after 21 days. When the modeling time was proloed to 28 days, the Hb reduced to 57.7 g/L –86.07 g/L[5,4], but the modeling time was still longer and the Hb value was also higher than that in this study. Two studies showed that LID feeding during the whole pregnancy period of rats could induce IDA offspring, but it could result in 19.2% and 48.8% mortality at birth and during lactating period because of severe anemia[9,8]. Xie et al. designed a study to evaluate the effects of goose heme, which has potential applications in fodder[10]. The study suggested that feeding LID to 14 days pregnant rats or in the last seven days of pregnancy could induce IDA in the offspring, without causing death. This suggests that there is a choice to initially feed pregnant rats with LID to produce offspring with a moderate degree of anemia without death. Our results suggest that 14 days after pregnancy is the optimal time to start LID to obtain suitable offspring with IDA.
The Hb levels of rats in the IDA group were significantly lower than those in the NC group (P < 0.05) in baseline observation. The Hb levels increased significantly in the intervention and positive control groups after the intervention. There was a relationship between the Hb levels and iron intervention dosages in the four measurements during the study period (Table 2). A similar trend was observed in the mean corpuscular hemoglobin concentration (MCHC) to Hb at the end of the study; however, the MCHC of the IDA intervention group was remarkably higher than that of the IDANC group at week 3. The RBC count, HCT, mean corpuscular volume (MCV), and mean corpuscular hemoglobin (MCH) of the rats in the IDA group were significantly lower than those in the NC group (P < 0.05), but did not differ from those in the beginning. They also showed a trend similar to that of the Hb levels at the end of the study. The IDAPC and IDAH groups did not differ from the normal control group after the intervention in the expected MCV value. Only IDAH increased to the level observed in the NC group and did not differ significantly (P > 0.05) in MCV. The ferrous lactate levels showed a positive correlation between the parameter values in the rats and the doses administered. Ferrous sulfate showed a better improvement in iron parameters than ferrous lactate in the same dose. The MCV, MCH, and MCHC values in the IDAPC and iron intervention groups increased during the intervention period. The same result has been shown in other models, in which Hb, RBC, MCV, and HCT increased after iron supplementation for 2–8 weeks[3-7]. In studies by Wang, K.P, Wang, and Yinping, Hb did not differ between the IDA and normal groups[6,4,7]. In Oluwasegun's study, improvements in hematological parameters and dosimetry were dose-dependent[5]. A notable phenomenon was that MCV and MCH in the IDAPC and high-dose groups appeared to increase rapidly in the first one or two weeks and then remained stable in the last two weeks. We could speculate that with iron supplements, Hb could quickly synthesize and integrate into reticulocytes and microcytic cells, which account for some of the RBCs in the circulating blood. This might stimulate MCV and MCH to quickly increase in the first two weeks. After the existence of reticulocytes and microcytic cells saturated with Hb and enlarged to a stable volume, the continuous processes of MCV and MCH rely on RBC apoptosis and the synthesis cycle and remain stable. At the end of treatment, the MCV, MCH, and MCHC values of the rats in the IDANC group were still significantly lower than those in the NC group (P < 0.05), but the indices of IDAPC and IDAH were similar to those of NC.
Table 2. Variation in the blood parameter after intervention
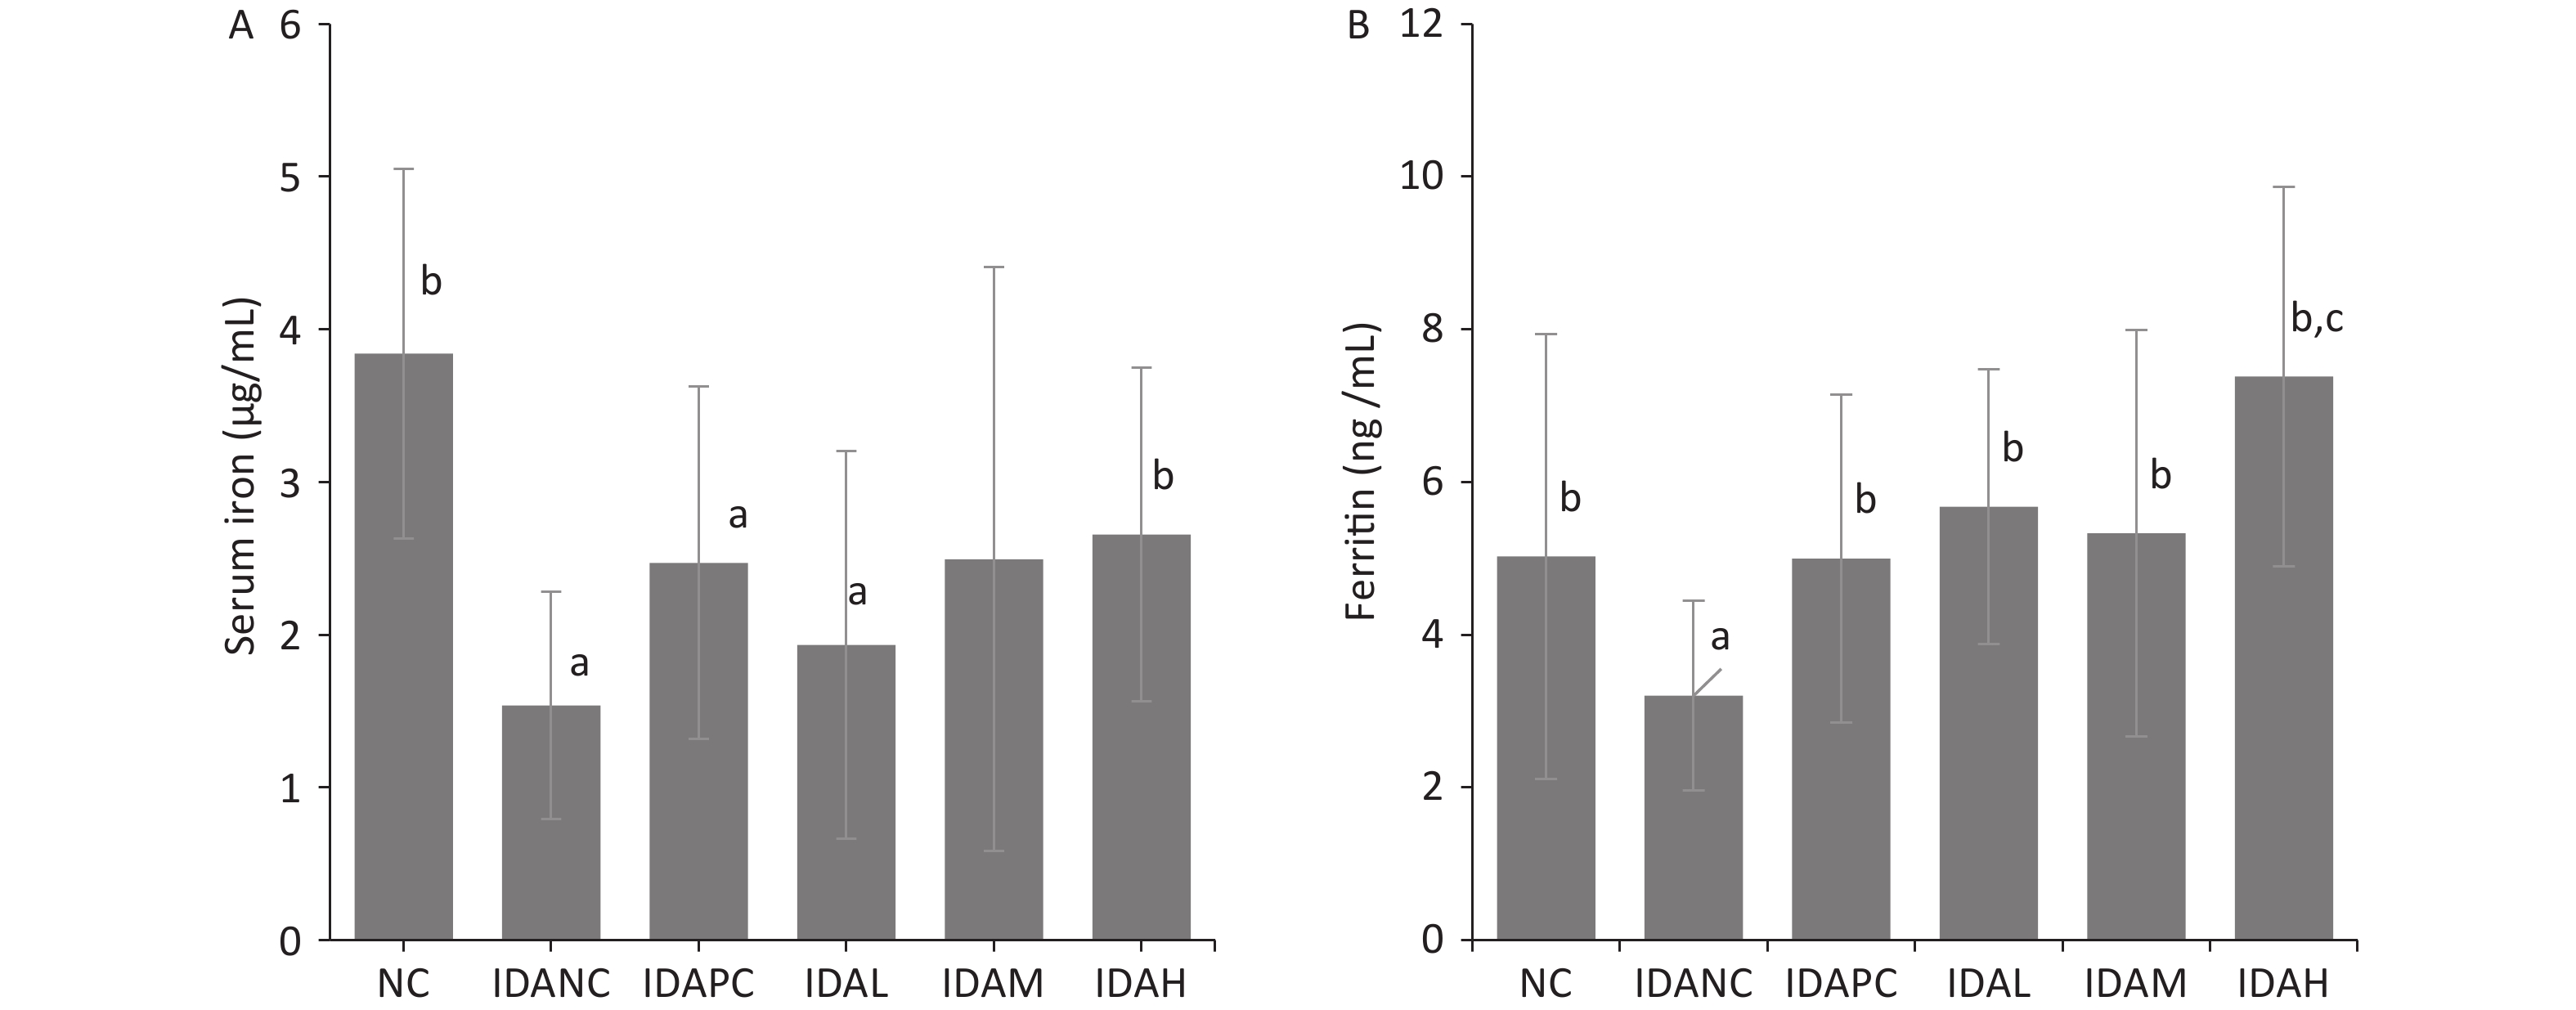
Parameter Group Baseline Week 1 Week 2 Week 3 Week 4 Hb (g/L) NC 121.93 ± 5.51b 139.13 ± 6.39b 158.88 ± 8.62b 157.50 ± 6.35b 145.40 ± 6.48b IDANC 35.00 ± 3.02a 28.86 ± 3.13a 41.15 ± 13.25a 39.93 ± 9.30a 69.50 ± 18.55a IDAPC 35.60 ± 2.67a 59.87 ± 7.05a,b 101.57 ± 10.21a,b 116.93 ± 12.58a,b 139.88 ± 11.34b IDAL 35.45 ± 3.27a 37.77 ± 4.19a,b 58.33 ± 7.10a,b 70.38 ± 9.55a,b 103.17 ± 11.92a,b IDAM 33.08 ± 4.44a 49.88 ± 4.74a,b 81.46 ± 12.6a,b 99.69 ± 15.22a,b 128.37 ± 11.62a,b IDAH 31.86 ± 2.85a 81.69 ± 11.47a,b 119.42 ± 9.52a,b 131.42 ± 8.69a,b 147.13 ± 8.41b HCT (%) NC 38.11 ± 1.48b 42.45 ± 1.71b 47.39 ± 2.65b 47.59 ± 1.68b 43.56 ± 1.48b IDANC 12.65 ± 1.14a 11.36 ± 3.53a 17.39 ± 3.71a 16.86 ± 2.64a 23.04 ± 5.38a,b IDAPC 13.61 ± 1.60a 22.55 ± 2.05a,b 35.90 ± 3.60a,b 38.63 ± 3.91a,b 43.37 ± 3.04b IDAL 13.10 ± 1.31a 15.29 ± 1.45a,b 23.62 ± 1.94a,b 26.19 ± 2.58a,b 34.07 ± 3.14a,b IDAM 11.78 ± 1.54a 19.46 ± 2.15a,b 30.37 ± 3.72a,b 34.34 ± 4.32a,b 40.03 ± 3.39a,b IDAH 11.81 ± 0.58a 28.39 ± 2.53a,b 40.11 ± 2.91a,b 42.35 ± 2.65a,b 45.20 ± 1.99b MCV (fL) NC 68.96 ± 3.17b 69.81 ± 1.90b 64.64 ± 1.69b 63.32 ± 1.30b 60.59 ± 1.31b IDANC 43.62 ± 1.42a 41.63 ± 3.23a 45.97 ± 4.50a 42.74 ± 2.81a 46.55 ± 3.30a IDAPC 43.23 ± 1.80a 51.81 ± 2.57a,b 54.76 ± 2.57a,b 56.64 ± 2.14a,b 55.72 ± 2.19a,b IDAL 42.90 ± 2.63a 48.04 ± 1.63a,b 45.33 ± 2.37a 43.85 ± 1.67a 46.91 ± 3.30a IDAM 43.46 ± 1.55a 50.98 ± 2.56a,b 49.28 ± 3.24a 50.41 ± 4.16a,b 50.30 ± 4.39a IDAH 41.78 ± 1.32a 62.90 ± 5.86a,b 65.75 ± 4.70b 64.95 ± 3.79b 60.67 ± 2.43b MCH (pg) NC 22.05 ± 0.87b 22.87 ± 0.55b 21.67 ± 0.72b 20.94 ± 0.45b 20.15 ± 0.46b IDANC 12.19 ± 1.24a 9.99 ± 1.04a 10.83 ± 2.14a 10.10 ± 1.13a 14.11 ± 2.74a IDAPC 11.40 ± 0.25a 13.76 ± 0.60a,b 15.53 ± 0.76a,b 17.16 ± 0.65a,b 17.95 ± 0.66a,b IDAL 11.66 ± 0.74a 11.93 ± 0.63a,b 11.21 ± 0.84a 11.82 ± 0.95a,b 14.23 ± 1.32a IDAM 12.33 ± 1.41a 13.20 ± 1.40a,b 13.23 ± 1.26a,b 14.65 ± 1.46a,b 16.16 ± 1.56a IDAH 11.33 ± 0.80a 18.08 ± 1.83a,b 19.59 ± 1.36a,b 20.14 ± 1.07b 19.73 ± 0.86b MCHC (g/L) NC 319.93 ± 4.16b 327.73 ± 5.54b 335.41 ± 4.86b 330.83 ± 2.94b 332.35 ± 2.87b IDANC 279.15 ± 23.74a 240.04 ± 21.44a 234.09 ± 27.15a 236.26 ± 24.67a 289.83 ± 24.67a IDAPC 264.30 ± 13.96a 266.07 ± 15.50a,b 283.69 ± 5.77a,b 302.99 ± 6.17a,b 321.99 ± 7.24a,b IDAL 272.58 ± 16.53a 248.17 ± 11.50a 248.63 ± 16.17a 269.03 ± 18.12a,b 303.01 ± 13.27a IDAM 283.15 ± 25.94a 258.75 ± 26.37a,b 271.03 ± 16.70a,b 290.38 ± 11.06a,b 321.31 ± 7.80a,b IDAH 270.97 ± 19.70a 287.40 ± 16.62a,b 297.33 ± 6.61a,b 310.25 ± 6.58a,b 325.46 ± 7.54a,b RBC (1012/L) NC 5.54 ± 0.40b 6.09 ± 0.30b 7.34 ± 0.54b 7.52 ± 0.34b 7.19 ± 0.36b IDANC 2.90 ± 0.27a 2.72 ± 0.82a 3.90 ± 0.76a 3.96 ± 0.72a 4.53 ± 1.50a IDAPC 3.13 ± 0.26a 4.36 ± 0.41a,b 6.49 ± 0.63a,b 6.82 ± 0.65a,b 7.78 ± 0.49c,b IDAL 3.05 ± 0.27a 3.18 ± 0.34a,b 5.24 ± 0.47a,b 5.97 ± 0.53a,b 7.28 ± 0.71b IDAM 2.71 ± 0.40a 3.82 ± 0.43a,b 6.16 ± 0.62a,b 6.81 ± 0.60a,b 7.97 ± 0.48c,b IDAH 2.82 ± 0.15a 4.54 ± 0.56a,b 6.12 ± 0.50a,b 6.53 ± 0.42a,b 7.46 ± 0.38b Note. Hb: hemoglobin; HCT: hematocrit; MCV: mean corpuscular volume; MCH: mean corpuscular hemoglobin; MCHC: mean corpuscular hemoglobin con-centration; RBC: red blood cells; NC: normal control group; IDANC: IDA negative control group; IDAPC: IDA positive control group; IDAL: low-level group; IDAM: mid-level group; IDAH: high-level group; IDA: iron deficiency anemia; a: P < 0.05, compared with group NC; b: P < 0.05, compared with the IDANC group. Ferritin and serum iron were iron status indices, which were measured in the blood of sacrificed rats after the administration of iron. Both the NC and IDA intervention groups had higher ferritin and serum iron levels than the IDANC group (Figure 1), which is consistent with the results of other studies[3,4,7,10]. The data suggest that LID feed during pregnancy and lactation successfully create an anemia model in the offspring rats. The model used for the observation of iron supplementation evaluation showed that Hb and iron status of rats reacted to the administrated iron dosages.

Figure 1. Ferritin and serum iron at the end of intervention. (A) Value of serum iron. (B) Value of ferritin. NC: normal control group; IDANC: IDA negative control group; IDAPC: IDA positive control group; IDAL: low-level group; IDAM: mid-level group; IDAH: high-level group; IDA: iron deficiency anemia; a: P < 0.05, compared with the NC group, b: P < 0.05, compared with the IDA 1 group, c: P < 0.05, compared with the NC group and greater than the NC group.
The ratios of visceral weight to body weight in each group are shown in Supplementary Table S1 (available in www.besjournal.com). The weights of the brain, heart, kidney, and spleen of the observed rats were significantly lower than those of the NC group, whereas the organ/body weight ratio was higher than that of the NC group (P < 0.05). This could be explained by the greater reduction in body weight, suggesting that organ weights are less affected by IDA and the intervention. After iron supplementation, the organ/body weight of treated rats improved, which was lower than that of IDANC (P < 0.05), except for the kidney. Iron intervention showed a dose-dependent relationship with body and organ weights. This revealed that iron supplementation benefited the growth and development of rats treated with IDA. Liver weight and its ratio with body weight were lower than those of the NC group (P < 0.05) and did not differ from those of the IDANC group (P > 0.05). This is uniquely different from other organs, but still awaits further understanding. Iron supplementation supports organ weight restoration to the NC level. Wang’s and Xie’s studies also observed similar results regarding the effect of IDA on the body weight and organ weight of model rats[4,10]. The heart ratio was higher in the model group than in the control group in both studies but differed for the liver, spleen, and kidneys. In Wang’s study, the liver-to-kidney ratio was greater in the IDA group, and no difference was observed in the spleen ratio compared to the control group[4]. In Xie’s study, there was no difference in the ratio of the liver and kidney in IDA and normal rats, but the ratio in the spleen was increased[10]. It can be assumed that an increase in the heart ratio is common in iron deficiency anemia, while the effect in other organs may be influenced by more factors.
Table S1. The ratio of viscera weight to body weight (%)
Group Brain Heart Liver Spleen Kidney NC 0.619 ± 0.12b 0.374 ± 0.03b 4.007 ± 0.24b 0.220 ± 0.03b 0.759 ± 0.04b IDANC 1.349 ± 0.31a 0.791 ± 0.24a 3.166 ± 0.47a 0.393 ± 0.08a 1.029 ± 0.16a IDAPC 0.926 ± 0.11a,b 0.530 ± 0.07a,b 2.978 ± 0.36a 0.229 ± 0.05b 1.038 ± 0.20a IDAL 0.965 ± 0.13a,b 0.624 ± 0.17a 3.076 ± 0.24a 0.268 ± 0.05a,b 0.890 ± 0.21 IDAM 0.955 ± 0.15a,b 0.577 ± 0.07a,b 3.043 ± 0.29a 0.240 ± 0.04b 1.038 ± 0.21a IDAH 0.812 ± 0.18a,b 0.508 ± 0.07a,b 3.203 ± 0.32a 0.260 ± 0.05b 1.058 ± 0.21a Note. a: P < 0.05, compared with group NC, b: P < 0.05, compared with group IDANC. NC: normal control group; IDANC: IDA negative control group; IDAPC: IDA positive control group; IDAL: low-level group; IDAM: mid-level group; IDAH: high-level group; IDA: iron deficiency anemia. The results of this study confirmed that the LID method 14 days after pregnancy and LID in offspring can be used to establish an IDA rat model after lactation. The IDA model showed an expected response to the measured metabolic parameters or indices of iron and anemia in iron intervention for 28 days.
No potential conflicts of interest were disclosed.
CHEN Xi conceived the design. HUO Jun Sheng supervised the study. CHEN Xi, HAN Chao, ZHAO Jin Peng, SHEN Shi, WANG Li Yuan, REN Shuo, MA Yan, and XU Ze Chao performed the animal experiments. CHEN Xi, HAN Chao, ZHAO Jin Peng, Ma Yan, and REN Shuo performed data curation. CHEN Xi and HUO Jun Sheng analyzed the data. CHEN Xi wrote the manuscript. HUO Jun Sheng reviewed the manuscript.
doi: 10.3967/bes2024.022
-
-
S1. Changes in body weight of rats during this study. NC: normal control group; IDANC: IDA negative control group; IDAPC: IDA positive control group; IDAL: low-level group; IDAM: mid-level group; IDAH: high-level group; IDA: iron deficiency anemia.
S2. Changes in feed conversion efficiency of rats during this study. NC: normal control group; IDANC: IDA negative control group; IDAPC: IDA positive control group; IDAL: low-level group; IDAM: mid-level group; IDAH: high-level group; IDA: iron deficiency anemia.
Figure 1. Ferritin and serum iron at the end of intervention. (A) Value of serum iron. (B) Value of ferritin. NC: normal control group; IDANC: IDA negative control group; IDAPC: IDA positive control group; IDAL: low-level group; IDAM: mid-level group; IDAH: high-level group; IDA: iron deficiency anemia; a: P < 0.05, compared with the NC group, b: P < 0.05, compared with the IDA 1 group, c: P < 0.05, compared with the NC group and greater than the NC group.
Table 1. Grouping, diet, water, and supplemental iron dosages during pregnancy, lactating, and observation periods
Pregnant rat groups Diet and water in pregnancy and lactating of pregnant rats The offspring groups Diet and water in observation period of offspring Interventions in observation period The control group (Group A, n = 2) Standard diet and water normal control group (NC, n = 20, sex in half) Standard diet and water Water 10 mL/kg bw The LID group (Group B, n = 8) LID and deionized water IDA negative control group (IDANC, n = 20, sex in half) LID and deionized water Deionized water 10 mL/kg bw IDA positive control group (IDAPC 2, n = 20, sex in half) LID and deionized water ferrous sulfate 5.42 mg/kg bw containing iron 2 mg/kg bw low-level group (IDAL, n = 20, sex in half) LID and deionized water ferrous lactate 4.34 mg/kgbw containing iron 1 mg/kg bw mid-level group (IDAM, n = 20, sex in half) LID and deionized water ferrous lactate 8.68 mg/kg bw containing iron 2 mg/kg bw high-level group (IDAH, n = 20, sex in half) LID and deionized water ferrous lactate 26.0 mg/kg bw containing iron 6 mg/kg bw Note. The standard diet was formulated according to AIN-93; LID (low-iron diet) was formulated according to AIN-93 without ferric citrate. Ferrous sulfate and ferrous lactate were dissolved in deionized water. LID: Low-iron diet; sex in half: Half male and half female.  下载: 导出CSV
Table 2. Variation in the blood parameter after intervention
Parameter Group Baseline Week 1 Week 2 Week 3 Week 4 Hb (g/L) NC 121.93 ± 5.51b 139.13 ± 6.39b 158.88 ± 8.62b 157.50 ± 6.35b 145.40 ± 6.48b IDANC 35.00 ± 3.02a 28.86 ± 3.13a 41.15 ± 13.25a 39.93 ± 9.30a 69.50 ± 18.55a IDAPC 35.60 ± 2.67a 59.87 ± 7.05a,b 101.57 ± 10.21a,b 116.93 ± 12.58a,b 139.88 ± 11.34b IDAL 35.45 ± 3.27a 37.77 ± 4.19a,b 58.33 ± 7.10a,b 70.38 ± 9.55a,b 103.17 ± 11.92a,b IDAM 33.08 ± 4.44a 49.88 ± 4.74a,b 81.46 ± 12.6a,b 99.69 ± 15.22a,b 128.37 ± 11.62a,b IDAH 31.86 ± 2.85a 81.69 ± 11.47a,b 119.42 ± 9.52a,b 131.42 ± 8.69a,b 147.13 ± 8.41b HCT (%) NC 38.11 ± 1.48b 42.45 ± 1.71b 47.39 ± 2.65b 47.59 ± 1.68b 43.56 ± 1.48b IDANC 12.65 ± 1.14a 11.36 ± 3.53a 17.39 ± 3.71a 16.86 ± 2.64a 23.04 ± 5.38a,b IDAPC 13.61 ± 1.60a 22.55 ± 2.05a,b 35.90 ± 3.60a,b 38.63 ± 3.91a,b 43.37 ± 3.04b IDAL 13.10 ± 1.31a 15.29 ± 1.45a,b 23.62 ± 1.94a,b 26.19 ± 2.58a,b 34.07 ± 3.14a,b IDAM 11.78 ± 1.54a 19.46 ± 2.15a,b 30.37 ± 3.72a,b 34.34 ± 4.32a,b 40.03 ± 3.39a,b IDAH 11.81 ± 0.58a 28.39 ± 2.53a,b 40.11 ± 2.91a,b 42.35 ± 2.65a,b 45.20 ± 1.99b MCV (fL) NC 68.96 ± 3.17b 69.81 ± 1.90b 64.64 ± 1.69b 63.32 ± 1.30b 60.59 ± 1.31b IDANC 43.62 ± 1.42a 41.63 ± 3.23a 45.97 ± 4.50a 42.74 ± 2.81a 46.55 ± 3.30a IDAPC 43.23 ± 1.80a 51.81 ± 2.57a,b 54.76 ± 2.57a,b 56.64 ± 2.14a,b 55.72 ± 2.19a,b IDAL 42.90 ± 2.63a 48.04 ± 1.63a,b 45.33 ± 2.37a 43.85 ± 1.67a 46.91 ± 3.30a IDAM 43.46 ± 1.55a 50.98 ± 2.56a,b 49.28 ± 3.24a 50.41 ± 4.16a,b 50.30 ± 4.39a IDAH 41.78 ± 1.32a 62.90 ± 5.86a,b 65.75 ± 4.70b 64.95 ± 3.79b 60.67 ± 2.43b MCH (pg) NC 22.05 ± 0.87b 22.87 ± 0.55b 21.67 ± 0.72b 20.94 ± 0.45b 20.15 ± 0.46b IDANC 12.19 ± 1.24a 9.99 ± 1.04a 10.83 ± 2.14a 10.10 ± 1.13a 14.11 ± 2.74a IDAPC 11.40 ± 0.25a 13.76 ± 0.60a,b 15.53 ± 0.76a,b 17.16 ± 0.65a,b 17.95 ± 0.66a,b IDAL 11.66 ± 0.74a 11.93 ± 0.63a,b 11.21 ± 0.84a 11.82 ± 0.95a,b 14.23 ± 1.32a IDAM 12.33 ± 1.41a 13.20 ± 1.40a,b 13.23 ± 1.26a,b 14.65 ± 1.46a,b 16.16 ± 1.56a IDAH 11.33 ± 0.80a 18.08 ± 1.83a,b 19.59 ± 1.36a,b 20.14 ± 1.07b 19.73 ± 0.86b MCHC (g/L) NC 319.93 ± 4.16b 327.73 ± 5.54b 335.41 ± 4.86b 330.83 ± 2.94b 332.35 ± 2.87b IDANC 279.15 ± 23.74a 240.04 ± 21.44a 234.09 ± 27.15a 236.26 ± 24.67a 289.83 ± 24.67a IDAPC 264.30 ± 13.96a 266.07 ± 15.50a,b 283.69 ± 5.77a,b 302.99 ± 6.17a,b 321.99 ± 7.24a,b IDAL 272.58 ± 16.53a 248.17 ± 11.50a 248.63 ± 16.17a 269.03 ± 18.12a,b 303.01 ± 13.27a IDAM 283.15 ± 25.94a 258.75 ± 26.37a,b 271.03 ± 16.70a,b 290.38 ± 11.06a,b 321.31 ± 7.80a,b IDAH 270.97 ± 19.70a 287.40 ± 16.62a,b 297.33 ± 6.61a,b 310.25 ± 6.58a,b 325.46 ± 7.54a,b RBC (1012/L) NC 5.54 ± 0.40b 6.09 ± 0.30b 7.34 ± 0.54b 7.52 ± 0.34b 7.19 ± 0.36b IDANC 2.90 ± 0.27a 2.72 ± 0.82a 3.90 ± 0.76a 3.96 ± 0.72a 4.53 ± 1.50a IDAPC 3.13 ± 0.26a 4.36 ± 0.41a,b 6.49 ± 0.63a,b 6.82 ± 0.65a,b 7.78 ± 0.49c,b IDAL 3.05 ± 0.27a 3.18 ± 0.34a,b 5.24 ± 0.47a,b 5.97 ± 0.53a,b 7.28 ± 0.71b IDAM 2.71 ± 0.40a 3.82 ± 0.43a,b 6.16 ± 0.62a,b 6.81 ± 0.60a,b 7.97 ± 0.48c,b IDAH 2.82 ± 0.15a 4.54 ± 0.56a,b 6.12 ± 0.50a,b 6.53 ± 0.42a,b 7.46 ± 0.38b Note. Hb: hemoglobin; HCT: hematocrit; MCV: mean corpuscular volume; MCH: mean corpuscular hemoglobin; MCHC: mean corpuscular hemoglobin con-centration; RBC: red blood cells; NC: normal control group; IDANC: IDA negative control group; IDAPC: IDA positive control group; IDAL: low-level group; IDAM: mid-level group; IDAH: high-level group; IDA: iron deficiency anemia; a: P < 0.05, compared with group NC; b: P < 0.05, compared with the IDANC group.
下载: 导出CSV
S1. The ratio of viscera weight to body weight (%)
Group Brain Heart Liver Spleen Kidney NC 0.619 ± 0.12b 0.374 ± 0.03b 4.007 ± 0.24b 0.220 ± 0.03b 0.759 ± 0.04b IDANC 1.349 ± 0.31a 0.791 ± 0.24a 3.166 ± 0.47a 0.393 ± 0.08a 1.029 ± 0.16a IDAPC 0.926 ± 0.11a,b 0.530 ± 0.07a,b 2.978 ± 0.36a 0.229 ± 0.05b 1.038 ± 0.20a IDAL 0.965 ± 0.13a,b 0.624 ± 0.17a 3.076 ± 0.24a 0.268 ± 0.05a,b 0.890 ± 0.21 IDAM 0.955 ± 0.15a,b 0.577 ± 0.07a,b 3.043 ± 0.29a 0.240 ± 0.04b 1.038 ± 0.21a IDAH 0.812 ± 0.18a,b 0.508 ± 0.07a,b 3.203 ± 0.32a 0.260 ± 0.05b 1.058 ± 0.21a Note. a: P < 0.05, compared with group NC, b: P < 0.05, compared with group IDANC. NC: normal control group; IDANC: IDA negative control group; IDAPC: IDA positive control group; IDAL: low-level group; IDAM: mid-level group; IDAH: high-level group; IDA: iron deficiency anemia.
下载: 导出CSV
-
[1] World Health Organization. The global prevalence of anaemia in 2011. https://apps.who.int/iris/handle/10665/177094. [2021-10-11 [2] World Health Organization. Nutritional anaemias: Tools for effective prevention and control. https://apps.who.int/iris/handle/10665/259425. [2021-10-11 [3] Wang XD, Liu S, Xu HB. Effects of recombinant human lactoferrin on improving the iron status of IDA rats. J Hyg Res, 2012; 41, 13−7. (In Chinese [4] Wang FR, Xie ZG, Ye XQ, et al. Effectiveness of treatment of iron deficiency anemia in rats with squid ink melanin-Fe. Food Funct, 2014; 5, 123−8. doi: 10.1039/C3FO60383K [5] Modupe O, Oladiji TA. Optimizing dose of aqueous extract of Mangifera indica L stem bark for treating anaemia and its effect on some disaccharidases activity in iron deficient weanling rats. J Nutr Intermed Metab, 2016; 3, 18−22. doi: 10.1016/j.jnim.2015.12.001 [6] Wang KP. Experimental study of Angelica sinensis polysaccharide-iron complex on rats with iron deficiency anemia. Chin J New Drugs Clin Rem, 2007; 26, 413−6. (In Chinese [7] Li YP, Wang XP, Jiang YC, et al. Structure characterization of low molecular weight sulfate Ulva polysaccharide and the effect of its derivative on iron deficiency anemia. Int J Biol Macromol, 2019; 126, 747−54. doi: 10.1016/j.ijbiomac.2018.12.214 [8] Fu JY, Yang AQ, Liu LG, et al. Effects of low-iron intervention in pregnant rat on hematology parameters of adulthood offspring. J Hyg Res, 2009; 38, 692−5. (In Chinese [9] Liu M, Ma YJ, Cheng J. Effect of iron deficiency duing pregnancy on fetus development in rat. Chin J Public Health, 2009; 25, 500 − 1. (In Chinese [10] Xie C, Wang BW, Ge WH, et al. Effects of goose heme on growth development, iron metabolism and organic tissues element distribution of iron deficiency anemia young rat. Chin J Anim Nutr, 2015; 27, 408−17. (In Chinese -
 23218Supplementary Materials.pdf

-

 点击查看大图

计量
- 文章访问数: 118
- HTML全文浏览量: 53
- PDF下载量: 15
- 被引次数: 0

 Quick Links