

 下载:
下载:

-
Obesity among children and adolescents has become a global public health crisis[1]. The global prevalence of obesity among children and adolescents, aged 5–19 years, has risen dramatically from 0.7% to 5.6% in girls and 0.9% to 7.8% in boys between 1975 and 2016[2]. In China, the prevalence of obesity among children and adolescents, aged 6–17 years, nearly tripled after the millennium, from 2.2% in 2000 to 6.4% in 2014[3]. Obesity is related to a complex range of factors, of which micronutrient status may be an etiological cause and effect[4,5].
Folate and vitamin B12 are vital water-soluble vitamins directly involved in one-carbon metabolism, encompassing processes such as DNA methylation, redox defense, protein and nucleic acid biosynthesis, and other metabolic pathways[6,7]. Deficiency in these vitamins can disrupt one-carbon metabolism, resulting in increased reactive oxidant production and insulin resistance, as well as inhibition of protein synthesis and promotion of lipogenesis[8-11]. Moreover, folate is associated with leptin secretion, gut microbiota composition, and epigenetic gene modifications related to fat and energy metabolism[11,12]. Vitamin B12 plays a significant role in glucose, amino acid, and lipid metabolism through the tricarboxylic acid cycle[7]. A study involving pregnant and postnatal rats revealed that dietary restriction of folate and vitamin B12 results in increased visceral and total body fat, respectively, and altered lipid metabolism in the offsprings[13]. These findings suggest that inadequate folate or vitamin B12 status could be a potential risk factor for obesity.
Several studies have examined the association of serum folate and vitamin B12 levels separately with childhood obesity[14-17]. A study conducted in Austria revealed that serum folate concentrations were inversely associated with body mass index (BMI) and fat mass in children and adolescents with obesity[14]. In another cross-sectional study involving Israeli children and adolescents, obesity was associated with low serum vitamin B12 concentrations[15]. According to findings from the National Health and Nutrition Examination Survey (NHANES) 2001–2004, an inverse association with obesity risk was found only for serum vitamin B12 concentrations but not for serum folate concentrations among Mexican American children and adolescents[16]. In contrast, neither folate nor vitamin B12 levels differed between teenagers with and without obesity in Brazil[17]. These inconsistent findings highlight the need for additional studies to clarify the potential association between B vitamins and obesity. Moreover, folate and vitamin B12, intrinsically related via methionine synthase, are physiologically intertwined in one-carbon metabolism[18]. Epidemiological studies have revealed that an imbalance, characterized by high folate and low vitamin B12 levels during pregnancy, is related to insulin resistance and visceral obesity in newborns[19]. However, whether the balance between these two vitamins is associated with obesity in children and adolescents remains unclear.
To address these research gaps, we examined the associations of serum folate and vitamin B12, separately and in combination, with anthropometric indices and obesity among participants, aged 6–17 years using data from a cross-sectional survey conducted in China.
-
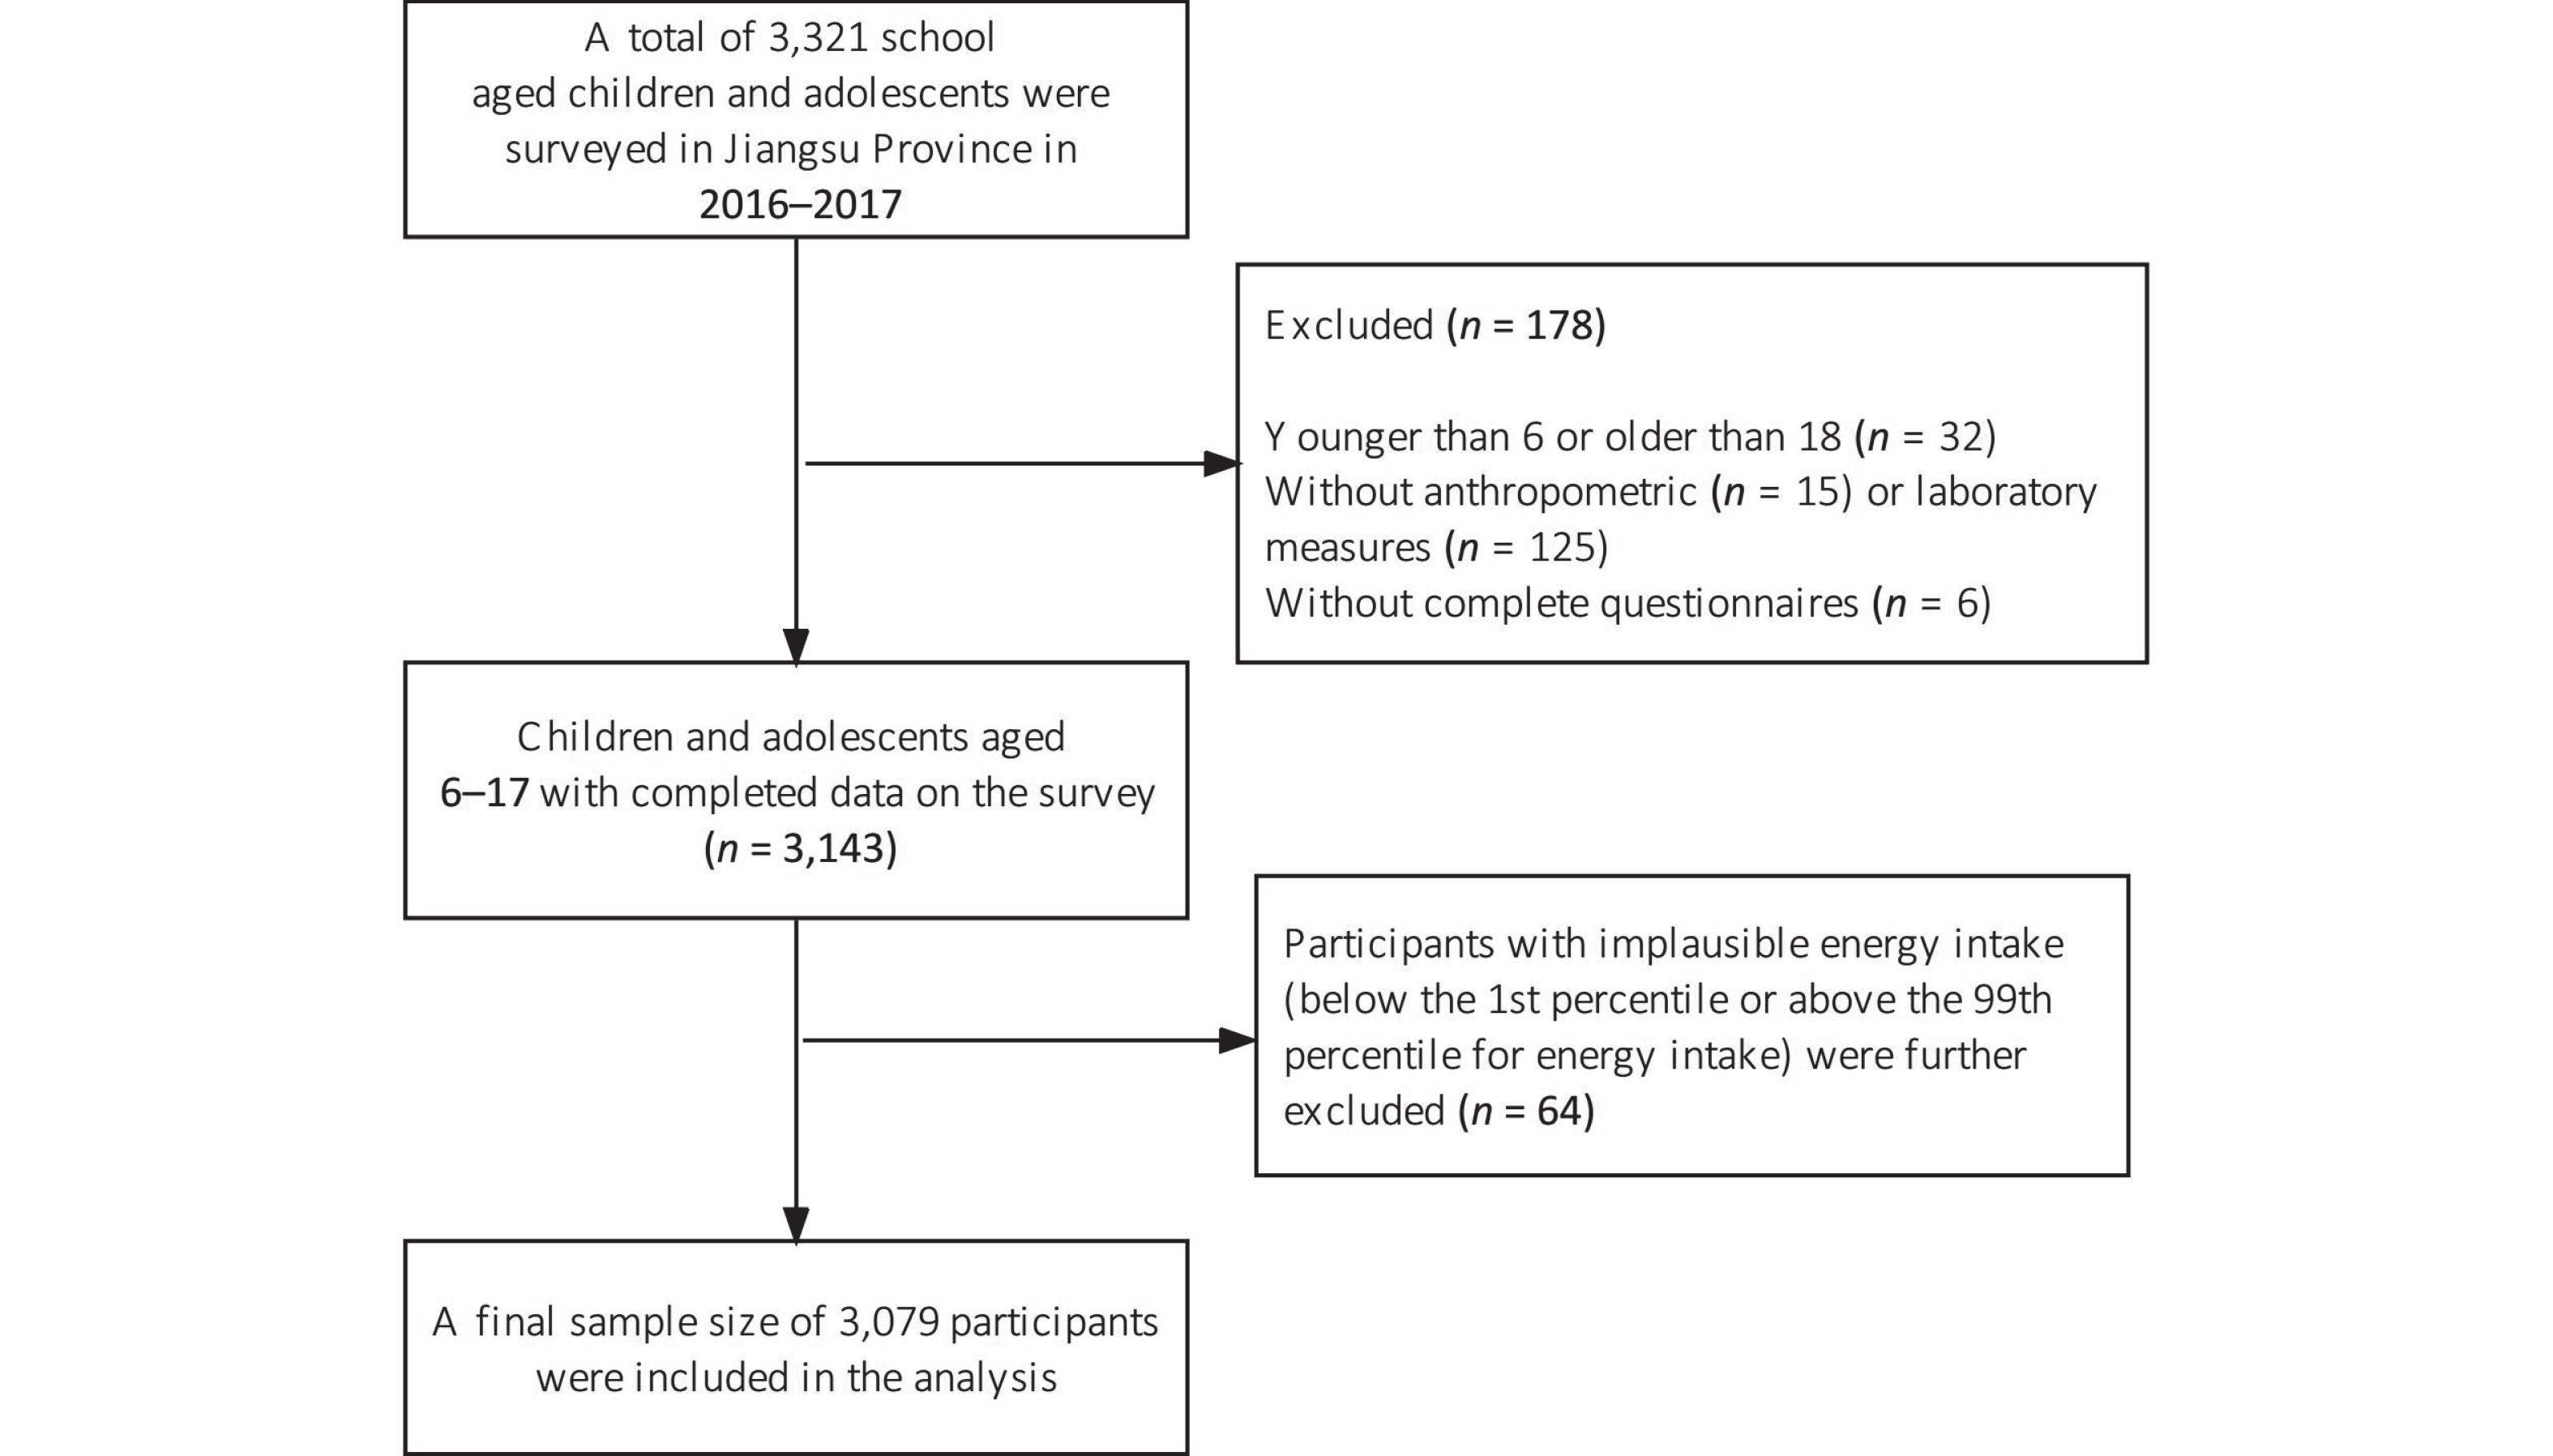
Data were obtained from the 2016–2017 National Nutrition and Health Surveillance for Children and Nursing Mothers in Jiangsu Province, Eastern China. The sample was selected using the methods, including population proportional to size, systematic sampling, and simple random sampling, as detailed elsewhere[20]. After in-house interviews, all participants were asked to undergo anthropometric measurements and provide overnight fasting blood samples. A total of 3,321 school-aged children and adolescents were surveyed. Participants aged < 6 or > 18 years (n = 32), those without anthropometric (n = 15) or laboratory measurements (n = 125), and with incomplete questionnaires (n = 6) were excluded from our analysis. We further excluded 64 participants with implausible energy intake (falling below the 1st percentile or above the 99th percentile for energy intake)[21], resulting in a final sample size of 3,079 participants, as described in Figure 1. The Ethics Committee of the Chinese Center for Disease Control and Prevention authorized all experiments involving human participants (No. 2016-14). Parents or guardians of participants, aged 6–11 years, provided written informed consent for them to participate. Participants, aged 12–17 years, along with their legal guardians, provided written informed consent for participation.
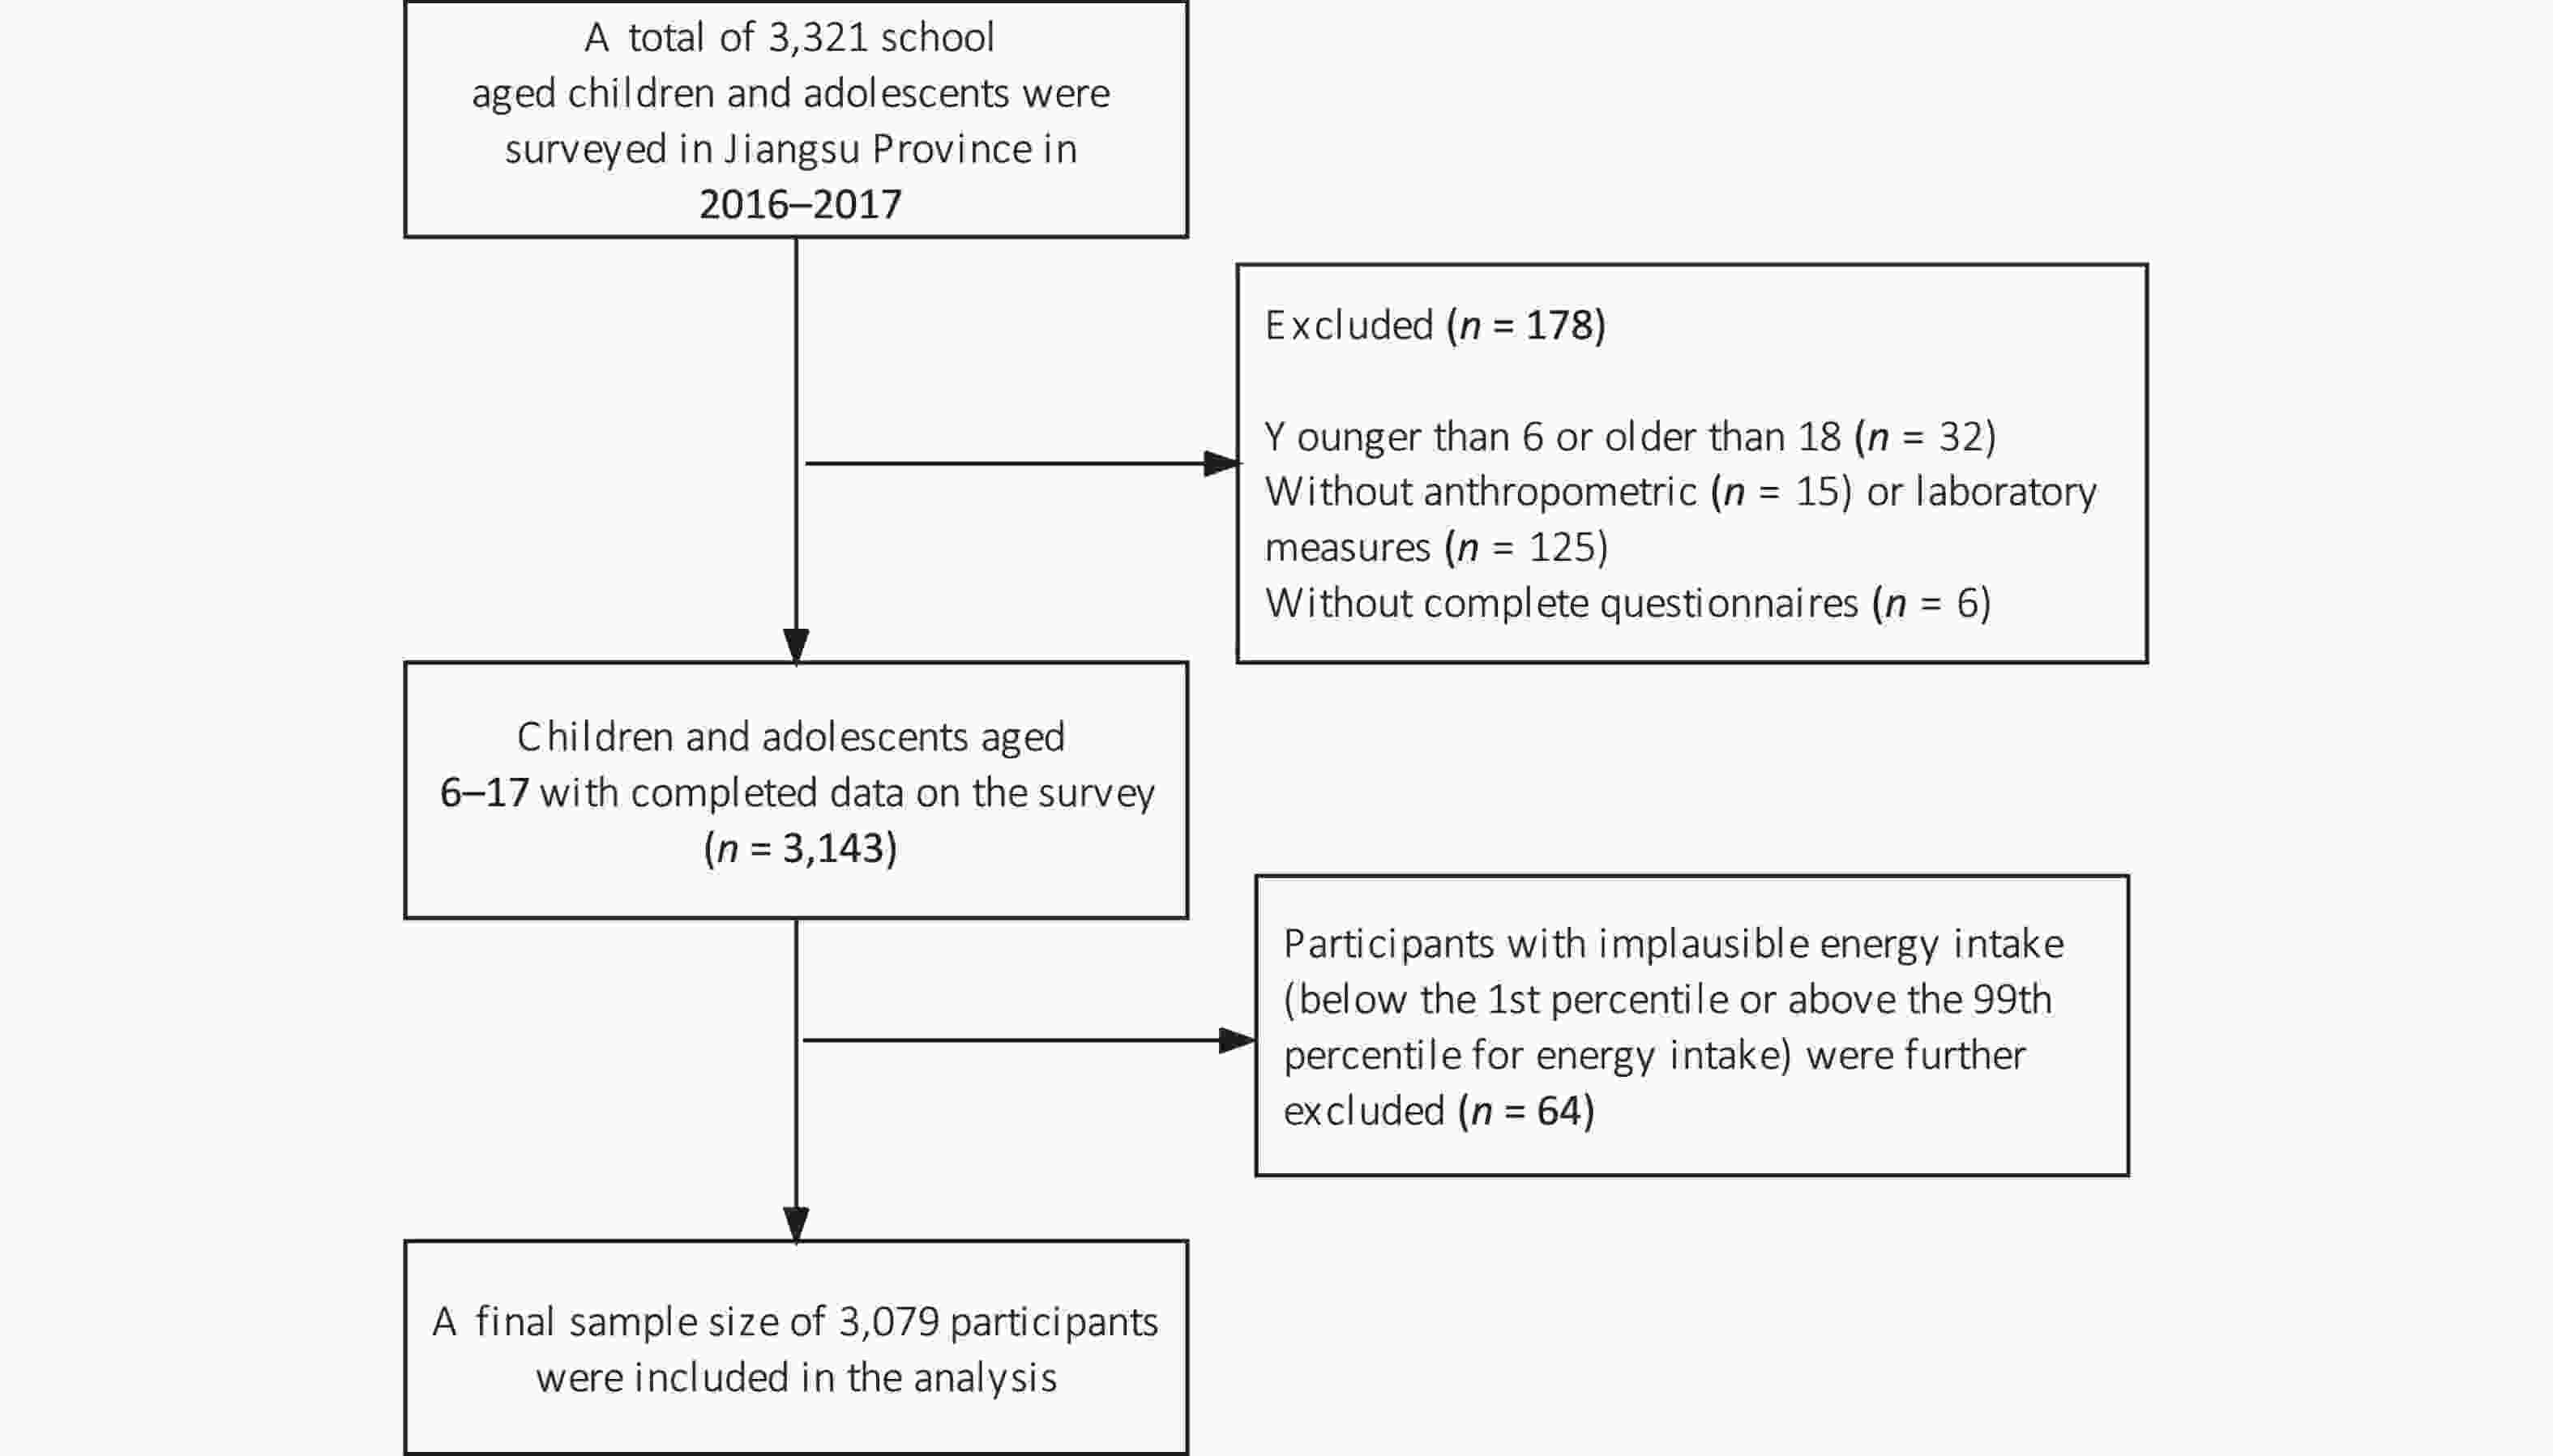
Figure 1. Flow chart of study participants.
-
Trained nurses and physicians obtained anthropometric measurements, including waist circumference (WC), height, and weight, from all the participants before breakfast, who were wearing light clothes and no shoes. Body weight was measured using calibrated electronic digital scales with a 0.01 kg resolution, while height was measured using height measuring bars with a 0.01 cm resolution. BMI was computed as weight (kg)/height (m2) and sex- and age-specific BMI z-scores for Chinese school-aged children and adolescents were determined using reference data[22]. WC was measured using a non-elastic tape in a horizontal plane halfway between the lowest rib edge and iliac crest. The waist-to-height ratio (WHtR) was determined by dividing the WC (cm) by height (cm). General obesity was defined using sex- and age-specific BMI cutoffs for children’s BMI[23], and abdominal obesity was characterized using the Chinese criterion of WHtR ≥ 0.48[24].
-
Venous blood samples were obtained from all participants after an overnight fast between 7:30 and 9:30 am. After a 30-minute standing period, serum was collected after centrifuging the blood at 3,000 rpm and 4 °C for 15 minutes. The samples were the cooled at 4 °C and transported to the laboratory for analysis on the same day. Serum folate and vitamin B12 concentrations were determined using an automatic electrochemical luminescence analyzer (Cobas E602, Roche, Germany). The coefficient of variation for the analytical techniques was 4.27% and 6.89% for serum folate and 2.49% and 3.17% for vitamin B12.
-
The socio-demographic indicators comprised age, sex, region (rural and urban areas), and ethnicity (Han and non-Han groups). Lifestyle variables included total energy intake, multivitamin or B-vitamin supplement use, physical activity, passive smoking, and alcohol consumption. Participants’ dietary intake was evaluated using a semi-quantitative food frequency questionnaire (FFQ) that had been verified for validity and reliability before the survey[25]. Parents or guardians answered food consumption questionnaires for children ˂ 12 years of age; children and adolescents aged 12–17 years answered questions with assistance from their caregivers. The FFQ consists of 57 food and beverage items consumed by Chinese children and adolescents. Daily energy intake of each participant was determined[26]. Multivitamin or B-vitamin supplement use by participants was dichotomized into “used” and “not used” in the month prior to the survey. Physical activity levels were assessed using total moderate-to-vigorous intensity physical activity (MVPA) time, encompassing housework, school and outside physical activity, and active commute time, including walking or biking[27]. Passive smoking status was defined based on exposure to tobacco products and was classified into the following groups: daily, not daily, and never. Alcohol consumption status was categorized as never, former (30 days ago), or current drinker (within the past 30 days). Serum high-sensitive C-reactive protein (hs-CRP) and creatinine concentrations were determined using an automatic modular analyzer (Cobas C701, Roche, Switzerland). The estimated glomerular filtration rate (eGFR) was calculated using the Chronic Kidney Disease Epidemiology Collaboration formula from the serum creatinine values[28].
-
Continuous variables are presented as medians [Interquartile range (IQR)], and categorical variables are presented as numbers (percentages). The Mann–Whitney U-test and chi-square test were used to assess differences in basic features between participants with and without obesity for continuous and categorical variables, respectively. To address non-normal distributions, serum folate and vitamin B12 concentrations were naturally log-transformed before statistical analysis. The results were interpreted as a 1% increase in concentrations of serum folate or vitamin B12, which translated to an increase or decrease in outcome by units (coefficient regression divided by 100). Multiple linear regression models were constructed to explore the association of serum folate and vitamin B12 levels with anthropometric indices, including BMI, BMI-z, WC, and WHtR. Age and sex were included in the models to account for differences in body fat between boys and girls during childhood and adolescence[29] and to account for pubertal stages. Ethnicity, residential area, MVPA time, total energy intake, passive smoking status, and alcohol consumption status were also included in the models to account for the effects of different races, residential environments, and lifestyles on childhood obesity[30-33]. To consider the possible effects of kidney function, inflammation, and multivitamin or B-vitamin supplements use on serum folate and/or vitamin B12 levels, we also included eGFR, hs-CRP, and multivitamin or B-vitamin supplements use in the analysis[5,34,35]. Categorical variables were converted into dummy variables for analysis. Model 1 was adjusted for age and sex. Model 2 was further adjusted for region, ethnicity, total energy intake, MVPA time, passive smoking status, alcohol consumption status, hs-CRP level (log-transformed), eGFR (log-transformed), and multivitamin and B-vitamin supplementation use. In model 3, folate and vitamin B12 levels were mutually adjusted to account for any intercorrelation. Smoothed splines from generalized additive models were used to show potential nonlinear associations among serum folate and vitamin B12 levels, BMI, and WC. Additionally, logistic regression models were used to evaluate the association of serum folate and vitamin B12 levels with the odds of general obesity and abdominal obesity, and 95% confidence intervals (CI) were calculated. Finally, we used the quartiles of serum folate and vitamin B12 levels separately and defined the first quartile as “low”, the fourth quartile as “high”, and the two middle quartiles as “moderate”. A combination of moderate folate and vitamin B12 levels was chosen as the reference group. After adjusting for all covariates, the joint association of serum folate and vitamin B12 levels with general and abdominal obesity was assessed using multivariable logistic regression models. Two-sided P-values were calculated, with significance defined as P < 0.05. All statistical analyses were conducted using R software (version 3.6.3, Auckland, New Zealand).
-
The characteristics of the study population are summarized in Table 1. A total of 3,079 children and adolescents with a median age of 11.4 years (IQR, 8.9–13.8 years) were included in our analysis, among whom 49.1% were girls. The majority of the participants was Han Chinese (97.7%) and lived in urban areas (84.4%). Median serum folate and vitamin B12 concentrations were 6.9 ng/mL (IQR, 4.7–9.7 ng/mL) and 554.4 pg/mL (IQR, 405.8–729.1 pg/mL), respectively. General obesity was observed in 405 participants (13.2%) and abdominal obesity was observed in 607 participants (19.7%). Generally, compared to participants without obesity, those with obesity were more likely to be boys, younger, urban residents, passive smokers, and exhibited higher hs-CRP and eGFR levels but lower vitamin B12 concentrations (Table 1).
Table 1. Characteristics of the participants residing in Jiangsu Province, China from 2016 to 2017
Characteristics Total population
(n = 3,079)General obesity P-value No (n = 2,674, 86.8) Yes (n = 405, 13.2) Age (years) 11.4 (8.9, 13.8) 11.5 (8.9, 13.9) 10.4 (8.6, 13) < 0.001 Sex, n (%) < 0.001 Male 1,567 (50.9) 1,293 (48.4) 274 (67.7) Female 1,512 (49.1) 1,381 (51.6) 131 (32.3) Age group (years), n (%) 0.005 6–11 1,749 (56.8) 1,493 (55.8) 256 (63.2) 12–17 1,330 (43.2) 1,181 (44.2) 149 (36.8) Region, n (%) 0.003 Urban 2,599 (84.4) 2,237 (83.7) 362 (89.4) Rural 480 (15.6) 437 (16.3) 43 (10.6) Ethnicity, n (%) 0.521 Han ethnicity 3,009 (97.7) 2,615 (97.8) 394 (97.3) Ethnicity other than Han 70 (2.3) 59 (2.2) 11 (2.7) Lifestyle Total energy intake (kcal/day) 1,884 (1439.7, 2548.9) 1880.6 (1441.1, 2547.8) 1907.7 (1429.4, 2572.2) 0.949 Multivitamin or B-vitamin
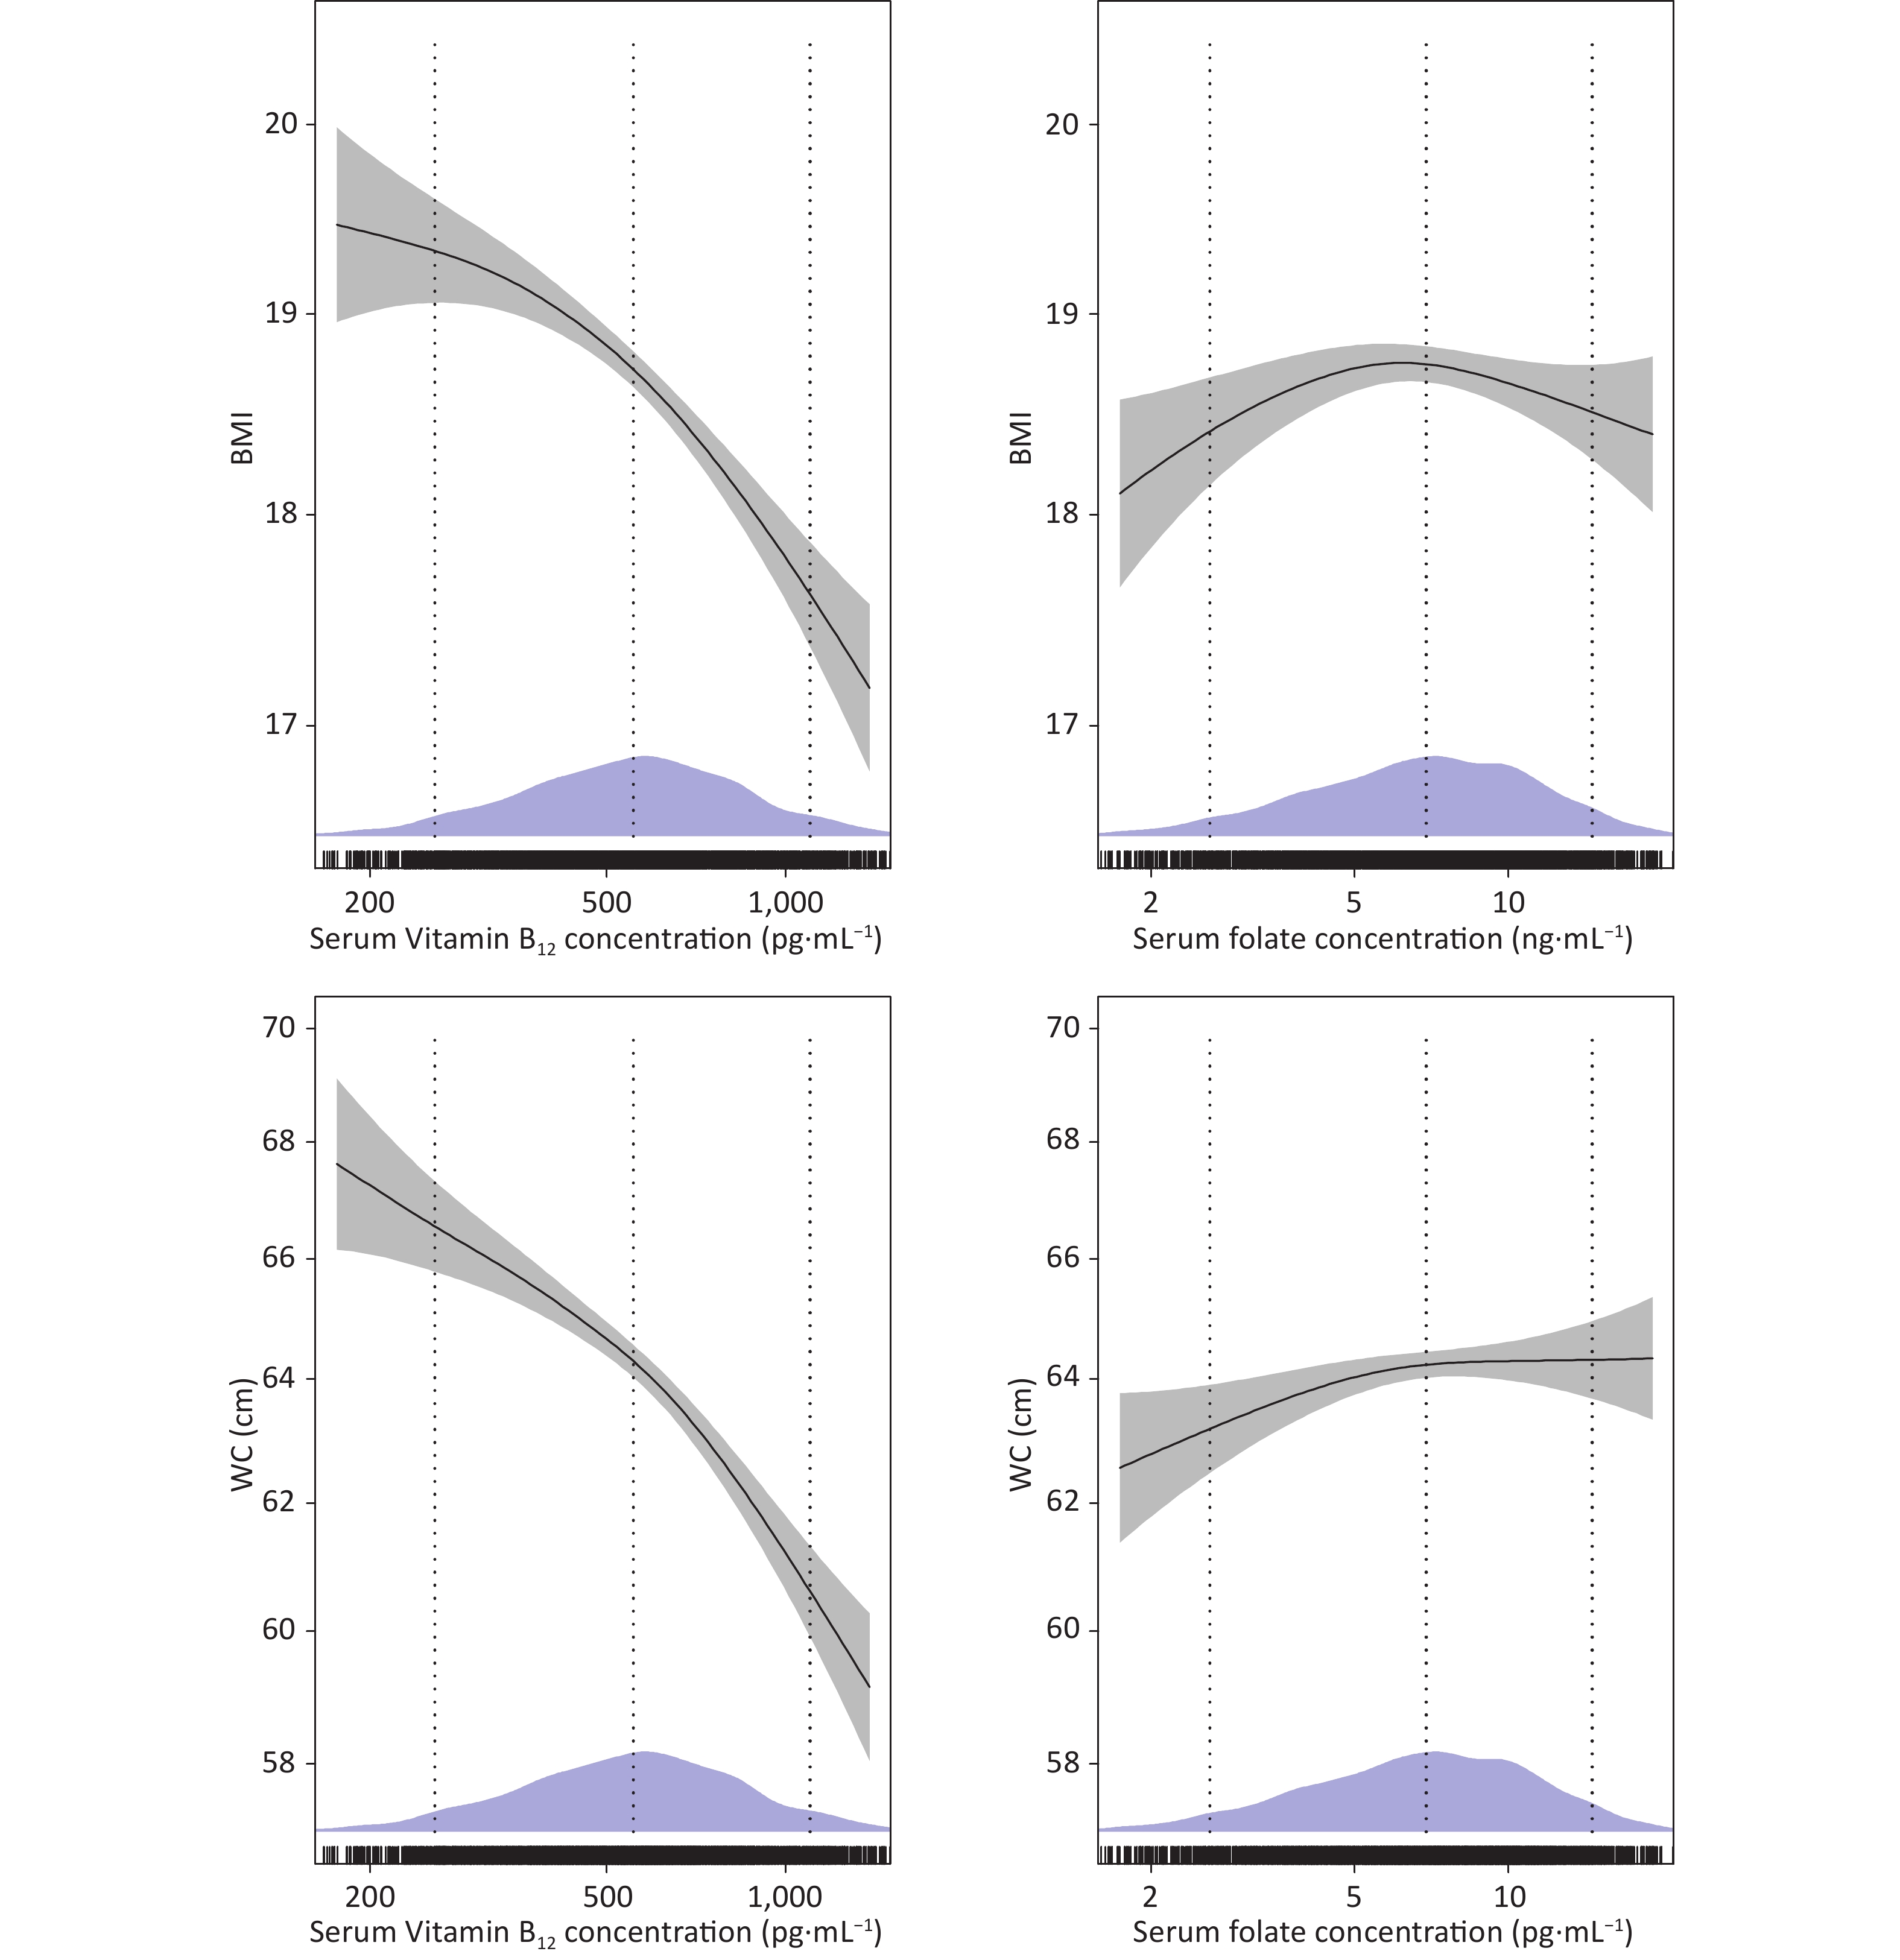
supplements (yes), n (%)23 (0.7) 22 (0.8) 1 (0.2) 0.210 MVPA (minutes/day) 20 (8.6, 40) 20 (8.6, 40) 20 (7.9, 38.6) 0.350 Passive smoking, n (%) 0.046 Never 1,803 (58.6) 1,576 (58.9) 277 (56.0) Not daily 1,023 (33.2) 891 (33.1) 132 (32.6) Every day 253 (8.2) 207 (7.7) 46 (11.4) Alcohol consumption, n (%) 0.425 Never 2,776 (90.2) 2,404 (89.9) 372 (91.9) Former 222 (7.2) 199 (7.4) 23 (5.7) Current 81 (2.6) 71 (2.7) 10 (2.5) Anthropometrics Weight (kg) 42.0 (30.1, 54.5) 40.1 (29.1, 52.4) 56.7 (42, 74) < 0.001 Height (cm) 150.1 (135.2, 162.1) 150 (134.9, 162) 150.5 (137.7, 162.5) 0.160 BMI (kg/m2) 18.3 (16.0, 21.2) 17.6 (15.8, 20.0) 25.0 (22.0, 27.5) < 0.001 BMI-z 0.3 (−0.2, 1.0) 0.1 (−0.3, 0.7) 2.2 (1.8, 2.7) < 0.001 WC (cm) 63.4 (56.6, 71.2) 62.1 (55.8, 68.5) 79.5 (71.6, 88.1) < 0.001 WHtR 0.4 (0.4, 0.5) 0.4 (0.4, 0.5) 0.5 (0.5, 0.6) < 0.001 Abdominal obesity, n (%) 607 (19.7) 252 (9.4) 355 (87.7) < 0.001 Biochemistry Serum folate (ng/mL) 6.9 (4.7, 9.7) 6.9 (4.7, 9.8) 6.9 (5, 9.6) 0.812 Serum vitamin B12 (pg/mL) 554.4 (405.8, 729.1) 560 (408.4, 742.9) 524.7 (394.6, 676.9) 0.026 hs-CRP (mg/L) 0.3 (0.2, 0.8) 0.3 (0.2, 0.7) 0.9 (0.5, 2.2) < 0.001 eGFR (mL/min per 1.73 m2) 148.6 (135.2, 160.0) 148.0 (134.8, 159.3) 153.4 (139.1, 164) < 0.001 Note. Values are presented as median (interquartile range [IQR]) for continuous variables and n (%) for categorical variables. MVPA, total moderate-to-vigorous intensity physical activity; BMI, body mass index; BMI-z, BMI z-score; WC, waist circumference; WHtR, waist-to-height ratio; hs-CRP, high-sensitivity C-reactive protein; eGFR, estimated glomerular filtration rate. P-values were calculated using the Mann-Whitney U-test for continuous variables and the chi-square test for categorical variables. Table 2 shows the linear associations of serum folate and vitamin B12 levels with BMI, BMI-z, WC, and WHtR assessed using linear regression models. Serum vitamin B12 concentrations were inversely associated with BMI (β = −1.34, 95% CI = −1.66, −1.01, P < 0.001), BMI-z (β = −0.38, 95% CI = −0.48, −0.29, P < 0.001), WC (β = −4.50, 95% CI = −5.37, −3.63, P < 0.001) and WHtR (β = −0.023, 95% CI = −0.023, −0.018, P < 0.001) across all models. The generalized additive models demonstrated that the inverse associations of serum vitamin B12 with BMI and WC were almost roughly linear across the distribution of vitamin B12 values (Figure 2). No significant associations of serum folate with BMI, BMI-z, WC, and WHtR were identified in models 1 and 2. After additionally adjusting for serum vitamin B12 concentrations, serum folate was observed to be positively associated with WC (β = 0.80, 95% CI = 0.08, 1.52, P = 0.024) and WHtR (β = 0.004, 95% CI = 0.000, 0.009, P = 0.044). Further, the general additive model revealed a bell-shaped association between serum folate levels and BMI and an almost positive linear association between serum folate levels and WC (Figure 2). Because the association of vitamin B12 and folate with BMI z-scores was similar to that with BMI and the association with WHtR was similar to that with WC, further graphs on BMI z-scores and WHtR was not represented.
Table 2. Associations of serum folate and vitamin B12 concentrations with anthropometric indices among Chinese children and adolescents in Jiangsu Province, 2016–2017 (n = 3,079)
Micronutrient Model 1 Model 2 Model 3 Coefficient 95% Cl Coefficient 95% Cl Coefficient 95% Cl Serum folate (ng/mL) BMI −0.19 −0.45, 0.07 −0.23 −0.49, 0.03 0.09 −0.18, 0.35 BMI-z −0.06 −0.14, 0.01 −0.08 −0.15, 0.01 0.02 −0.06, 0.09 WC 0.39 −0.32, 1.10 −0.26 −0.96, 0.44 0.80 0.08, 1.52 WHtR 0.003 −0.001, 0.007 −0.001 −0.005, 0.003 0.004 0, 0.009 Serum vitamin B12 (pg/mL) BMI −0.83 −1.14, −0.53 −1.31 −1.61, −1.00 −1.34 −1.66, −1.01 BMI-z −0.24 −0.33, −0.15 −0.38 −0.47, −0.29 −0.38 −0.48, −0.29 WC −2.17 −3.00, −1.33 −4.23 −5.06, −3.39 −4.50 −5.37, −3.63 WHtR −0.011 −0.16, −0.006 −0.021 −0.026, −0.016 −0.023 −0.028, −0.018 Note. Model 1: adjusted for age, sex; Model 2: additionally adjusted for region, ethnicity, total energy intake, MVPA time, passive smoking status, alcohol consumption status, hs-CRP (log-transformed), eGFR (log-transformed), and multivitamin or B-vitamin supplement use. Model 3: additionally adjusted for vitamin B12(log-transformed) or serum folate (log-transformed) concentrations. MVPA, total moderate-to-vigorous intensity physical activity; BMI, Body mass index; BMI-z, BMI z-score; WC, waist circumference; WHtR, waist-to-height ratio; hs-CR, high-sensitivity C-reactive protein; eGFR, estimated glomerular filtration rate; CI,confidence interval. Serum folate and vitamin B12 were log-transformed. 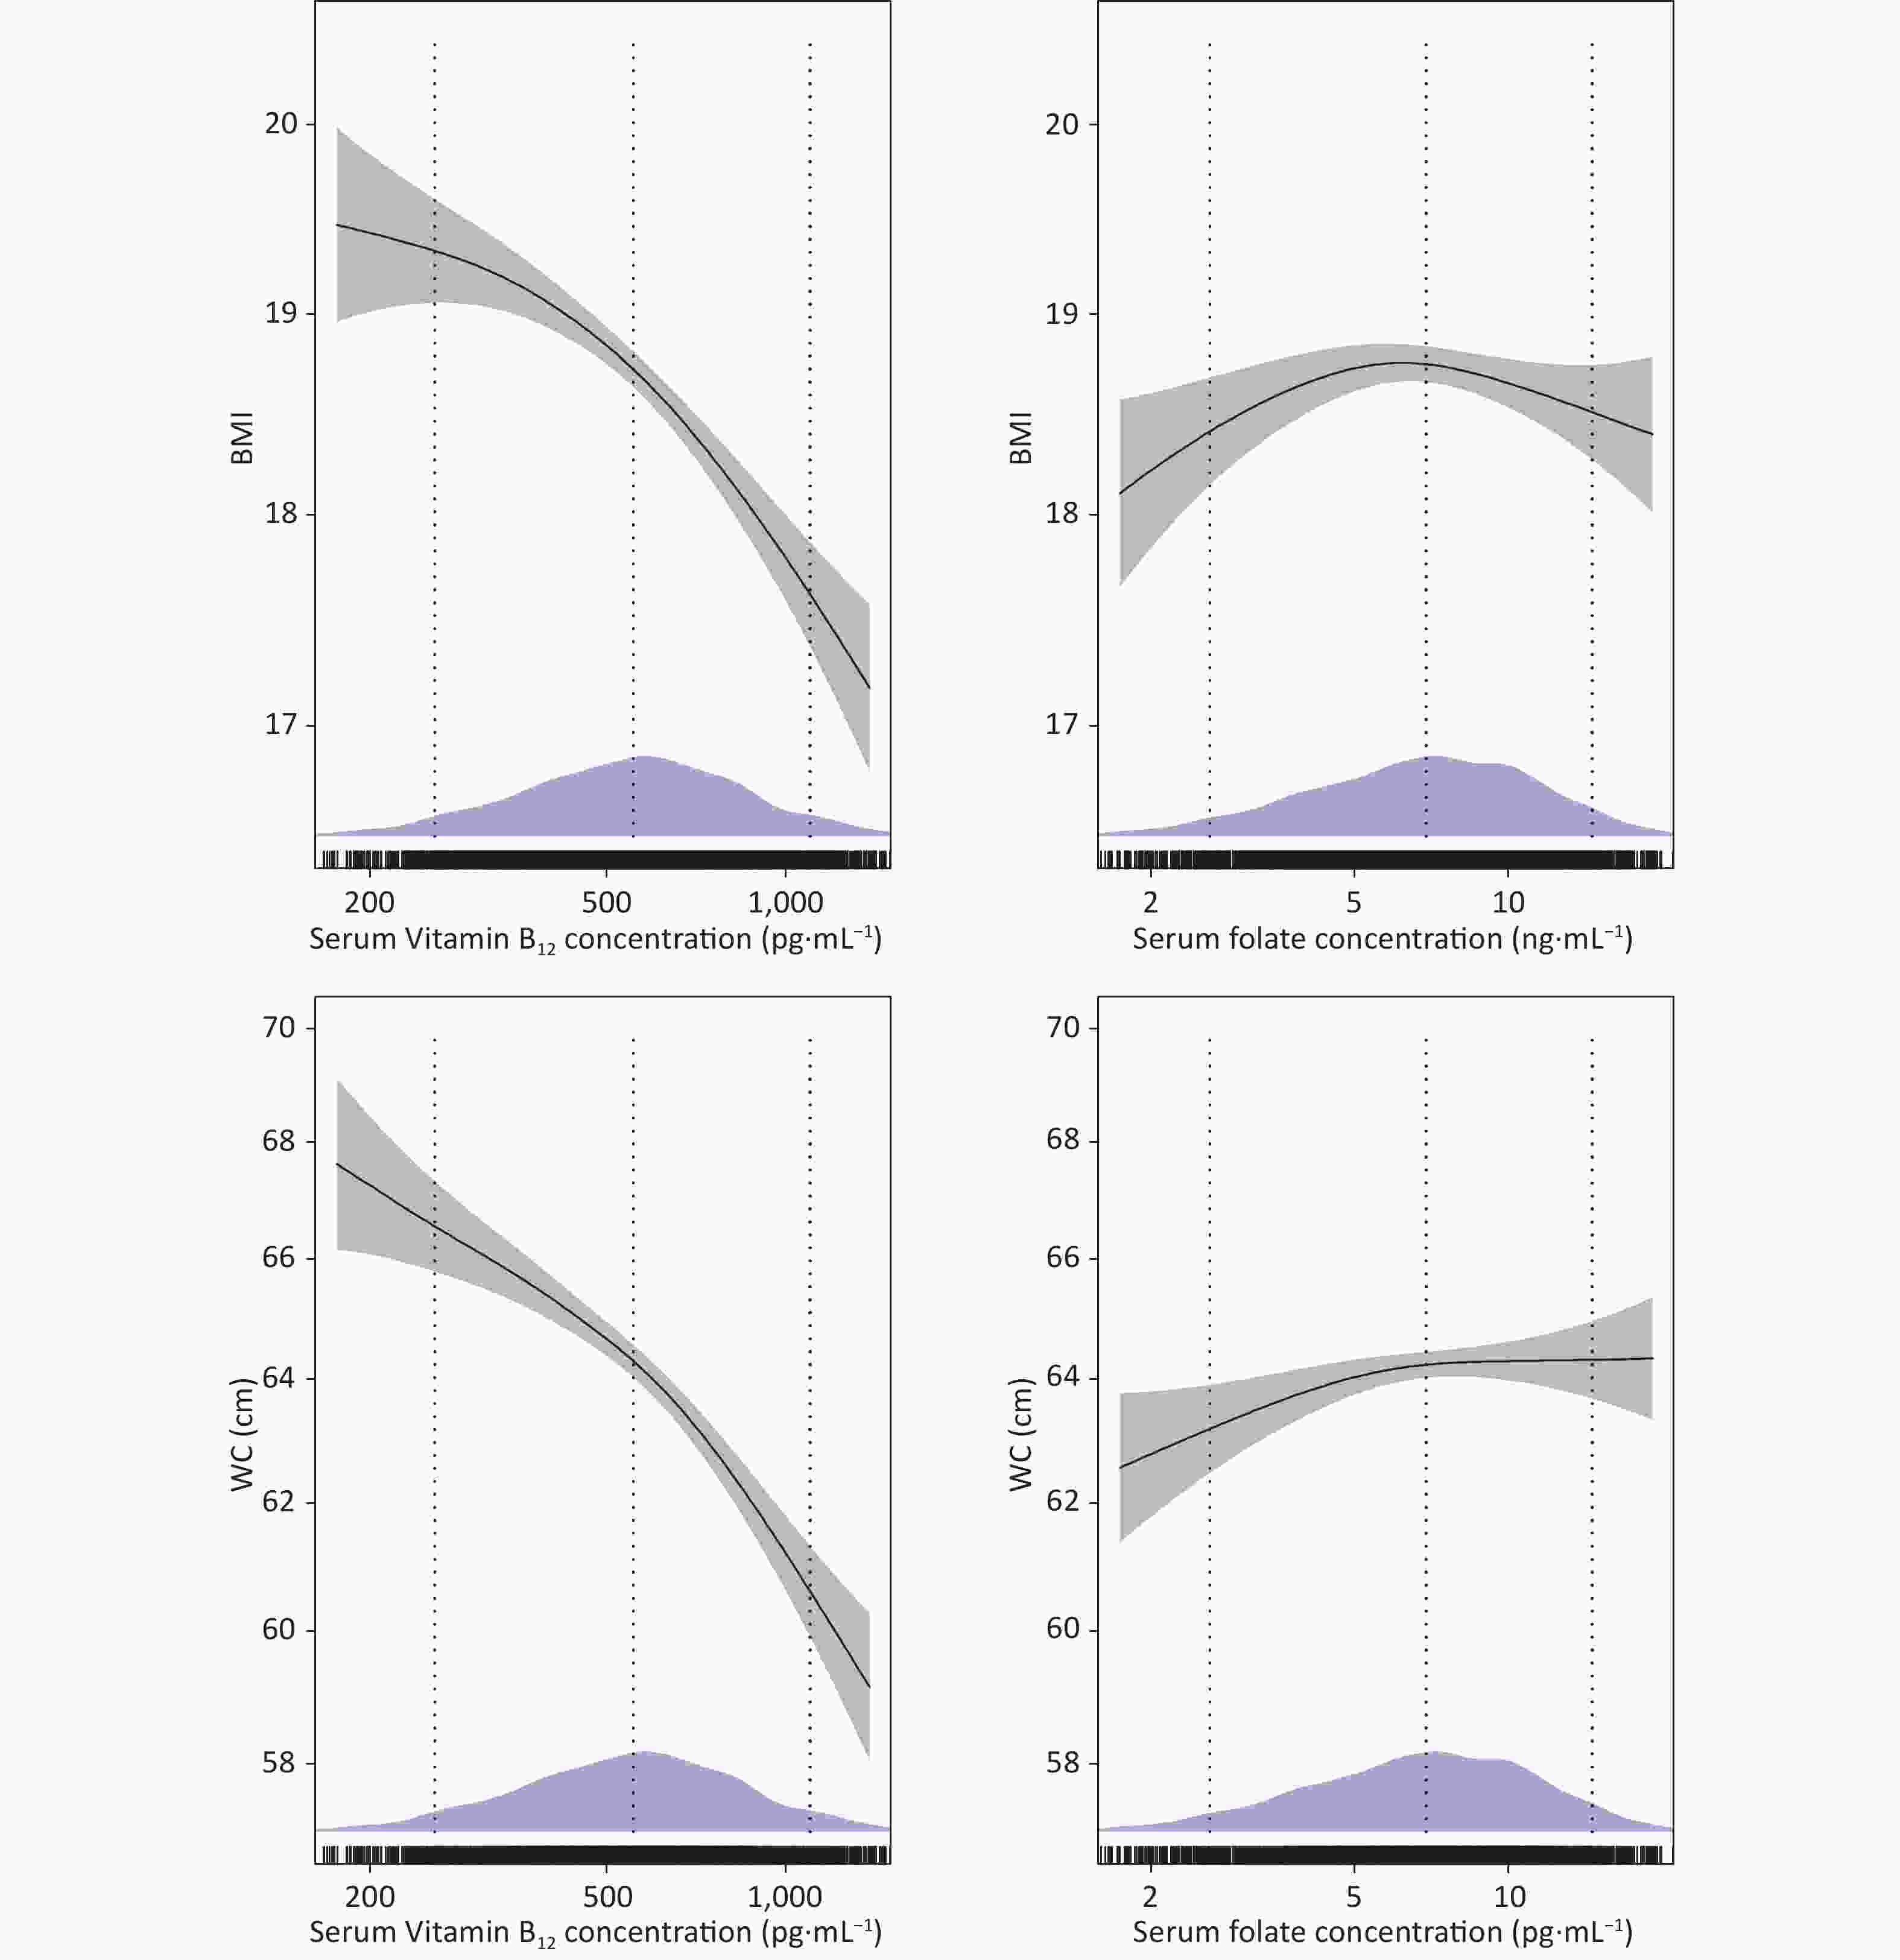
Figure 2. Dose-response curves with 95% confidence intervals (shaded areas) representing the associations of serum folate and vitamin B12 with BMI and WC. Associations were modeled using generalized additive models (n = 3,079). Models were adjusted for age, sex, region, ethnicity, total energy intake, MVPA time, multivitamin or B-vitamin supplements use, hs-CRP (log-transformed), eGFR (log-transformed), passive smoking status, alcohol consumption status, and vitamin B12 (log-transformed) or serum folate (log-transformed) concentrations. Density plots and rug plots indicate the distributions and density of log-transformed serum folate or vitamin B12 levels. Dotted lines denote the 10th, 50th, and 90th percentiles.
As shown in Table 3, serum vitamin B12 levels were inversely associated with general obesity (OR = 0.68, 95% CI = 0.59, 0.78, P < 0.001) and abdominal obesity (OR = 0.68, 95% CI = 0.60, 0.77, P < 0.001) after adjusting for all potential confounding factors. When compared with participants in the lowest quartile, those in the highest quartile of serum vitamin B12 concentration had 71% lower odds of general obesity (OR = 0.29, 95% CI = 0.20, 0.43, P < 0.001) and 64% lower odds of abdominal obesity (OR = 0.36, 95% CI = 0.26, 0.50, P < 0.001). When evaluated as continuous exposure, no associations were observed between serum folate concentration and the odds of general and abdominal obesity. However, when compared with participants in the lowest quartile, those in the second quartile of serum folate concentration exhibited 44% higher odds of general obesity (OR = 1.44, 95% CI = 1.03, 2.00, P = 0.032) after additionally adjusting for serum vitamin B12 concentrations.
Table 3. Multivariable associations of serum folate and vitamin B12 levels with odds of general obesity and abdominal obesity among children and adolescents in Jiangsu Province, from 2016 to 2017 (n = 3,079)
Variables Model 1 Model 2 Model 3 OR (95% CI) OR (95% CI) OR (95% CI) Serum folate General obesity Continuous 0.96 (0.85, 1.08) 0.92 (0.81, 1.05) 1.02 (0.89, 1.17) Q1 1.00 (ref.) 1.00 (ref.) 1.00 (ref.) Q2 1.17 (0.86, 1.60) 1.26 (0.91, 1.72) 1.44 (1.03, 2.00) Q3 1.00 (0.72, 1.39) 1.03 (0.73, 1.46) 1.22 (0.86, 1.74) Q4 0.91 (0.64, 1.28) 0.84 (0.58, 1.21) 1.08 (0.74, 1.59) P-trend 0.348 0.163 0.941 Abdominal obesity Continuous 0.98 (0.88, 1.09) 0.90 (0.81, 1.01) 1.00 (0.89, 1.13) Q1 1.00 (ref.) 1.00 (ref.) 1.00 (ref.) Q2 1.06 (0.82, 1.38) 1.05 (0.80, 1.39) 1.21 (0.91, 1.60) Q3 0.90 (0.68, 1.18) 0.82 (0.61, 1.10) 0.98 (0.72, 1.32) Q4 0.94 (0.71, 1.25) 0.79 (0.58, 1.07) 1.02 (0.74, 1.40) P-trend 0.426 0.047 0.685 Serum vitamin B12 General obesity Continuous 0.82 (0.73, 0.93) 0.68 (0.60, 0.78) 0.68 (0.59, 0.78) Q1 1.00 (ref.) 1.00 (ref.) 1.00 (ref.) Q2 0.90 (0.67, 1.21) 0.72 (0.53, 0.99) 0.72 (0.52, 0.99) Q3 0.79 (0.58, 1.08) 0.61 (0.44, 0.86) 0.61 (0.43, 0.85) Q4 0.46 (0.32, 0.65) 0.29 (0.2, 0.43) 0.29 (0.20, 0.43) P-trend < 0.001 < 0.001 < 0.001 Abdominal obesity Continuous 0.83 (0.75, 0.92) 0.68 (0.61, 0.76) 0.68 (0.60, 0.77) Q1 1.00 (ref.) 1.00 (ref.) 1.00 (ref.) Q2 0.86 (0.67, 1.11) 0.67 (0.51, 0.87) 0.67 (0.51, 0.88) Q3 0.83 (0.64, 1.08) 0.63 (0.47, 0.83) 0.63 (0.47, 0.85) Q4 0.56 (0.42, 0.75) 0.36 (0.26, 0.49) 0.36 (0.26, 0.50) P-trend < 0.001 < 0.001 < 0.001 Note. The quartiles of serum folate concentration were as follows: < 4.7 ng/mL (Q1), 4.7–6.8 (Q2), 6.9–9.6 (Q3), and ≥ 9.7 (Q4). The quartiles of serum vitamin B12 concentrations were as follows: < 405.4 pg/mL (Q1), 405.4–554.1 (Q2), 554.2–728.8 (Q3), and ≥ 728.9 (Q4). Model 1: adjusted for age, sex; Model 2: additionally adjusted for region, ethnicity, total energy intake, MVPA time, passive smoking status and alcohol consumption status, hs-CRP (log-transformed), eGFR (log-transformed) and multivitamin or B-vitamin supplements use; Model 3: additionally adjusted for vitamin B12 (log-transformed) or serum folate (log-transformed) concentrations. MVPA, total moderate-to-vigorous intensity physical activity; hs-CRP, high-sensitivity C-reactive protein; eGFR, estimated glomerular filtration rate; OR, odds ratio; CI, confidence interval. Serum folate and vitamin B12 levels were log-transformed and standardized by subtracting the mean and dividing it by the standard deviation. We further evaluated the potential interaction between serum concentrations of folate and vitamin B12 using logistic regression analysis (Table 4). Participants with high concentrations of both folate and vitamin B12 (the highest quartile for each vitamin) had lower odds of general (OR = 0.31, 95% CI = 0.19, 0.50, P < 0.001) and abdominal obesity (OR = 0.46, 95% CI = 0.31, 0.67, P < 0.001) compared with those with moderate levels of both vitamins. Conversely, low serum vitamin B12 concentrations in combination with high serum folate concentrations were positively associated with higher odds of abdominal obesity (OR = 2.06, 95% CI = 1.09, 3.91, P = 0.026). Higher odds of general obesity were observed only for low serum vitamin B12 concentrations in combination with moderate serum folate concentrations (OR = 1.63, 95% CI = 1.11, 2.40, P = 0.012). Additionally, we observed a trend towards reduced odds of general (P-trend < 0.001) and abdominal obesity (P-trend < 0.001) with increased serum folate and vitamin B12 levels (data not shown). Conversely, a trend toward indicating high odds of abdominal obesity was observed with increased serum folate levels accompanied by low vitamin B12 levels (P-trend = 0.001) (data not shown).
Table 4. Joint association of serum folate and vitamin B12 levels with general obesity and abdominal obesity among Chinese children and adolescents in Jiangsu Province, from 2016 to 2017 (n = 3,079)
Serum folate Serum vitamin B12 Low Moderate High General obesity Low 1.13 (0.74, 1.72) 0.80 (0.53, 1.21) 0.63 (0.27, 1.49) Moderate 1.63 (1.11, 2.40) 1.00 (ref.) 0.51 (0.34, 0.77) High 1.60 (0.75, 3.41) 0.93 (0.65, 1.34) 0.31 (0.19, 0.50) Abdominal obesity Low 1.43 (1.00, 2.03) 0.94 (0.66, 1.33) 0.77 (0.37, 1.59) Moderate 1.50 (1.07, 2.11) 1.00 (ref.) 0.60 (0.42, 0.85) High 2.06 (1.09, 3.91) 0.96 (0.70, 1.32) 0.46 (0.31, 0.67) Note. The categories “low” “moderate” and “high” serum folate levels were based to quartiles and defined as follows: ≤ 4.7 ng/mL (Q1), 4.8–9.7 ng/mL (Q2 and Q3) and > 9.8 ng/mL (Q4), respectively. The categories “low” “moderate” and “high” serum vitamin B12 levels were based to quartiles (Q) and defined as follows: ≤ 405.4 pg/mL (Q1), 405.4–728.7 ng/mL (Q2 and Q3) and > 728.8 ng/mL (Q4), respectively. Model adjusted for age, sex, region, ethnicity, total energy intake, MVPA time, multivitamin or B-vitamin supplement use, hs-CRP level (log-transformed), eGFR (log-transformed), passive smoking status, and alcohol consumption status.MVPA, total moderate-to-vigorous intensity physical activity; hs-CRP, high-sensitivity C-reactive protein; eGFR, estimated glomerular filtration rate. -
In the present study, we found that high concentrations of vitamin B12, but not folate, were independently associated with a reduced likelihood of both general and abdominal obesity. Participants with high serum folate and vitamin B12 levels exhibited lower odds of general and abdominal obesity than those of participants with moderate concentrations of these vitamins. Our findings provide new insights into the relationship of serum folate and vitamin B12 with childhood obesity.
Previous studies have also shown inverse associations among vitamin B12 levels, anthropometric indices, and obesity risk across different populations. The findings of the NHANES 2011–2014 indicated that serum vitamin B12 concentration is inversely and significantly associated with general obesity in a dose-dependent manner among American adults[36]. Several studies from the United Kingdom and India have observed that decreased vitamin B12 concentrations during pregnancy are associated with increased BMI and general obesity risk among pregnant women[37-39]. Identical outcomes have been reported in children and adolescents. The risk of low vitamin B12 status is more than 4-fold higher among children and adolescents with obesity than among normal-weight individuals[15]. Furthermore, findings from the 2001–2004 NHANES indicated that serum vitamin B12 levels are inversely associated with BMI, trunk fat mass, total body fat mass, and the risk of general and abdominal obesity among Mexican American children[16]. Our study represents the first reporting of such inverse associations of serum vitamin B12 levels with anthropometric indices and the odds of obesity among Chinese children and adolescents.
Several mechanisms may explain these results. First, low serum vitamin B12 levels may interfere with one-carbon metabolism, preventing the generation of methionine from homocysteine, thereby reducing protein synthesis and lean tissue deposition[10]. Second, as a critical cofactor for methylmalonyl-coa mutase in the tricarboxylic acid cycle, low vitamin B12 levels may affect caloric expenditure control and energy availability[7]. Conversely, obesity could also decrease the serum vitamin B12 levels through reduced dietary intake or absorption, increased catabolism and sequestration in the adipose tissue[10], or through changes in gut microbiota composition or function that could affect the biosynthesis and metabolism of vitamin B12[31,32]. However, additional studies are required to confirm the associated pathways.
In the present study, serum folate concentrations showed a bell-shaped association with BMI but not with obesity. Our results are partly consistent with those of a recent meta-analysis of 16 studies that demonstrated no inverse association between folate levels and BMI[40]. Moreover, we observed that serum folate concentration was positively associated with WC and WHtR. However, these associations were weak, albeit statistically significant, and were observed only after adjusting for vitamin B12 concentration. Several individual studies have reported that lower serum folate levels are associated with high BMI, overall fat accumulation, and WC among postmenopausal women in the United States and adults in New Zealand and Poland[41-43]. Similarly, serum folate levels demonstrate significant inverse correlation with BMI and fat mass in Austrian children and adolescents with obesity[14]. Our results suggested that the association between serum folate levels and WC could be confounded by serum vitamin B12 levels, which may partly explain the discrepancies between our findings and those of other studies. Because folic acid fortification is not practiced, folate levels in the Chinese population may differ from those in some Western countries, potentially contributing to these inconsistent results[44].
We have further explored the joint association of serum folate and vitamin B12 levels with childhood obesity for the first time. We observed that participants with high serum levels of both folate and vitamin B12 had low odds of developing general and abdominal obesity. However, an increase in serum folate levels in participants with low levels of vitamin B12 increased their probability of experiencing abdominal obesity. Abdominal obesity is strongly associated with insulin resistance. High folate levels may mask and exacerbate the effects of vitamin B12 deficiency, which in turn impairs DNA synthesis, especially of mitochondrial DNA, leading to the development of insulin resistance[37,45]. A study conducted in India reported that newborns of mothers with high folate and low vitamin B12 concentrations exhibited elevated insulin resistant and greater susceptibility to visceral obesity[19]. Another study from France also revealed that consecutive patients with obesity in the highest tertile of red blood cell folate levels and the lowest tertile of plasma B12 levels exhibited high levels of insulin resistance[9]. Therefore, we speculated that insulin resistance might mediate the association between the high folate and low vitamin B12 levels and abdominal obesity. In the current study, we also found that participants in the upper B12 quartile exhibited decreased odds of developing general and abdominal obesity as serum folate levels increased. Folate levels in the body may affect the circulating levels of active vitamin B12 and are related to its availability in the body tissues[46]. We posit that the direct association between folate and obesity is weak and that obesity may be primarily modified by altering the active level and availability of vitamin B12. The mechanism underlying the interaction of folate and vitamin B12 levels with obesity is not yet fully understood and requires further investigation.
Our study has several strengths. First, to the best of our knowledge, this is the largest study conducted to date and the first in China. Second, we explored the joint and independent associations of serum folate and vitamin B12 levels with childhood obesity, offering new insights. Finally, as part of the China National Nutrition and Health Surveillance Program, the study’s standardized methods, data collection processes, training, and stringent quality control for all participants assured the credibility of the findings[47].
This study had several limitations. First, owing to the cross-sectional nature of the study, we could not confirm a causal relationship among serum folate and vitamin B12 levels, anthropometric indices, and obesity. Despite this, our results emphasized the importance of folate and vitamin B12 levels in childhood obesity. Thus, the status of these two vitamins could be potential risk factors for childhood obesity. Moreover, our results suggested a possible risk of vitamin B12 deficiency in children and adolescents with obesity. Second, serum folate levels, the earliest indicator of changes in folate exposure, reflect recent dietary intake, but does not reflect long-term folate status. Therefore, erythrocyte folate levels should be analyzed in future studies. Moreover, serum folate is measured as the sum of the total pool of folate derivatives, and data on individual folate derivatives, such as 5-methyltetrahydrofolate, may provide relevant insights. Finally, this study was limited to Chinese children and adolescents. Thus, extrapolation of the results to other populations should be performed with caution.
-
In summary, we observed that serum vitamin B12, but not folate, was inversely associated with anthropometric indices, including BMI, BMI-z, WC, and WHtR, and the odds of childhood obesity.
Children and adolescents with high levels of vitamin B12 and folate were less likely to be obese. Children and adolescents with obesity may be at a risk of vitamin B12 deficiency.
-
All authors state that there is no conflict of interest to this manuscript. The fundings are no influence of the funders on the design of the investigation, data collection, or analysis, or on the decision to publish or the preparation of the manuscript.
doi: 10.3967/bes2024.028
Association of Serum Folate and Vitamin B12 Concentrations with Obesity in Chinese Children and Adolescents
-
Abstract:
Objective This study aimed to evaluate the associations of serum folate and/or vitamin B12 concentrations with obesity among Chinese children and adolescents. Methods A cross-sectional study was conducted including 3,079 Chinese children and adolescents, aged 6 to 17 years, from Jiangsu, China. Anthropometric indices, such as, children's body mass index (BMI), BMI z-scores, waist circumference, and waist-to-height ratio were utilized. Multivariable linear regression and generalized additive models were used to investigate the associations of serum folate and vitamin B12 levels with anthropometric indices and odds of obesity. Results We observed that serum vitamin B12 concentrations were inversely associated with all anthropometric indices and the odds of general obesity [odds ratio (OR) = 0.68; 95% confidence interval (CI) = 0.59, 0.78] and abdominal obesity (OR = 0.68; 95% CI = 0.60, 0.77). When compared to participants with both serum vitamin levels in the two middle quartiles, those with both serum folate and vitamin B12 levels in the highest quartile were less prone to general (OR = 0.31, 95% CI = 0.19, 0.50) or abdominal obesity (OR = 0.46, 95% CI = 0.31, 0.67). Conversely, participants with vitamin B12 levels in the lowest quartile alongside folate levels in the highest quartile had higher odds of abdominal obesity (OR = 2.06, 95% CI = 1.09, 3.91). Conclusion Higher serum vitamin B12 concentrations, but not serum folate concentrations, were associated with lower odds of childhood obesity. Children and adolescents with high levels of vitamin B12 and folate were less likely to be obese. -
Key words:
- Folate /
- Vitamin B12 /
- Childhood obesity /
- Micronutrient
This study was conducted in accordance with the Declaration of Helsinki and approved by the Ethics Committee of the National Institute for Nutrition and Health, Chinese Center for Disease Control and Prevention (protocol code: 2016-14; date of approval: January 2016). Informed consent was obtained from all the participants involved in the study.
注释:1) AUTHOR CONTRIBUTIONS: 2) Ethics Approval and Consent to Participate: -
Figure 2. Dose-response curves with 95% confidence intervals (shaded areas) representing the associations of serum folate and vitamin B12 with BMI and WC. Associations were modeled using generalized additive models (n = 3,079). Models were adjusted for age, sex, region, ethnicity, total energy intake, MVPA time, multivitamin or B-vitamin supplements use, hs-CRP (log-transformed), eGFR (log-transformed), passive smoking status, alcohol consumption status, and vitamin B12 (log-transformed) or serum folate (log-transformed) concentrations. Density plots and rug plots indicate the distributions and density of log-transformed serum folate or vitamin B12 levels. Dotted lines denote the 10th, 50th, and 90th percentiles.
MVPA, total moderate-to-vigorous intensity physical activity; BMI, body mass index; WC, waist circumference; hs-CRP, high-sensitivity C-reactive protein; eGFR, estimated glomerular filtration rate.
Table 1. Characteristics of the participants residing in Jiangsu Province, China from 2016 to 2017
Characteristics Total population
(n = 3,079)General obesity P-value No (n = 2,674, 86.8) Yes (n = 405, 13.2) Age (years) 11.4 (8.9, 13.8) 11.5 (8.9, 13.9) 10.4 (8.6, 13) < 0.001 Sex, n (%) < 0.001 Male 1,567 (50.9) 1,293 (48.4) 274 (67.7) Female 1,512 (49.1) 1,381 (51.6) 131 (32.3) Age group (years), n (%) 0.005 6–11 1,749 (56.8) 1,493 (55.8) 256 (63.2) 12–17 1,330 (43.2) 1,181 (44.2) 149 (36.8) Region, n (%) 0.003 Urban 2,599 (84.4) 2,237 (83.7) 362 (89.4) Rural 480 (15.6) 437 (16.3) 43 (10.6) Ethnicity, n (%) 0.521 Han ethnicity 3,009 (97.7) 2,615 (97.8) 394 (97.3) Ethnicity other than Han 70 (2.3) 59 (2.2) 11 (2.7) Lifestyle Total energy intake (kcal/day) 1,884 (1439.7, 2548.9) 1880.6 (1441.1, 2547.8) 1907.7 (1429.4, 2572.2) 0.949 Multivitamin or B-vitamin
supplements (yes), n (%)23 (0.7) 22 (0.8) 1 (0.2) 0.210 MVPA (minutes/day) 20 (8.6, 40) 20 (8.6, 40) 20 (7.9, 38.6) 0.350 Passive smoking, n (%) 0.046 Never 1,803 (58.6) 1,576 (58.9) 277 (56.0) Not daily 1,023 (33.2) 891 (33.1) 132 (32.6) Every day 253 (8.2) 207 (7.7) 46 (11.4) Alcohol consumption, n (%) 0.425 Never 2,776 (90.2) 2,404 (89.9) 372 (91.9) Former 222 (7.2) 199 (7.4) 23 (5.7) Current 81 (2.6) 71 (2.7) 10 (2.5) Anthropometrics Weight (kg) 42.0 (30.1, 54.5) 40.1 (29.1, 52.4) 56.7 (42, 74) < 0.001 Height (cm) 150.1 (135.2, 162.1) 150 (134.9, 162) 150.5 (137.7, 162.5) 0.160 BMI (kg/m2) 18.3 (16.0, 21.2) 17.6 (15.8, 20.0) 25.0 (22.0, 27.5) < 0.001 BMI-z 0.3 (−0.2, 1.0) 0.1 (−0.3, 0.7) 2.2 (1.8, 2.7) < 0.001 WC (cm) 63.4 (56.6, 71.2) 62.1 (55.8, 68.5) 79.5 (71.6, 88.1) < 0.001 WHtR 0.4 (0.4, 0.5) 0.4 (0.4, 0.5) 0.5 (0.5, 0.6) < 0.001 Abdominal obesity, n (%) 607 (19.7) 252 (9.4) 355 (87.7) < 0.001 Biochemistry Serum folate (ng/mL) 6.9 (4.7, 9.7) 6.9 (4.7, 9.8) 6.9 (5, 9.6) 0.812 Serum vitamin B12 (pg/mL) 554.4 (405.8, 729.1) 560 (408.4, 742.9) 524.7 (394.6, 676.9) 0.026 hs-CRP (mg/L) 0.3 (0.2, 0.8) 0.3 (0.2, 0.7) 0.9 (0.5, 2.2) < 0.001 eGFR (mL/min per 1.73 m2) 148.6 (135.2, 160.0) 148.0 (134.8, 159.3) 153.4 (139.1, 164) < 0.001 Note. Values are presented as median (interquartile range [IQR]) for continuous variables and n (%) for categorical variables. MVPA, total moderate-to-vigorous intensity physical activity; BMI, body mass index; BMI-z, BMI z-score; WC, waist circumference; WHtR, waist-to-height ratio; hs-CRP, high-sensitivity C-reactive protein; eGFR, estimated glomerular filtration rate. P-values were calculated using the Mann-Whitney U-test for continuous variables and the chi-square test for categorical variables.  下载: 导出CSV
Table 2. Associations of serum folate and vitamin B12 concentrations with anthropometric indices among Chinese children and adolescents in Jiangsu Province, 2016–2017 (n = 3,079)
Micronutrient Model 1 Model 2 Model 3 Coefficient 95% Cl Coefficient 95% Cl Coefficient 95% Cl Serum folate (ng/mL) BMI −0.19 −0.45, 0.07 −0.23 −0.49, 0.03 0.09 −0.18, 0.35 BMI-z −0.06 −0.14, 0.01 −0.08 −0.15, 0.01 0.02 −0.06, 0.09 WC 0.39 −0.32, 1.10 −0.26 −0.96, 0.44 0.80 0.08, 1.52 WHtR 0.003 −0.001, 0.007 −0.001 −0.005, 0.003 0.004 0, 0.009 Serum vitamin B12 (pg/mL) BMI −0.83 −1.14, −0.53 −1.31 −1.61, −1.00 −1.34 −1.66, −1.01 BMI-z −0.24 −0.33, −0.15 −0.38 −0.47, −0.29 −0.38 −0.48, −0.29 WC −2.17 −3.00, −1.33 −4.23 −5.06, −3.39 −4.50 −5.37, −3.63 WHtR −0.011 −0.16, −0.006 −0.021 −0.026, −0.016 −0.023 −0.028, −0.018 Note. Model 1: adjusted for age, sex; Model 2: additionally adjusted for region, ethnicity, total energy intake, MVPA time, passive smoking status, alcohol consumption status, hs-CRP (log-transformed), eGFR (log-transformed), and multivitamin or B-vitamin supplement use. Model 3: additionally adjusted for vitamin B12(log-transformed) or serum folate (log-transformed) concentrations. MVPA, total moderate-to-vigorous intensity physical activity; BMI, Body mass index; BMI-z, BMI z-score; WC, waist circumference; WHtR, waist-to-height ratio; hs-CR, high-sensitivity C-reactive protein; eGFR, estimated glomerular filtration rate; CI,confidence interval. Serum folate and vitamin B12 were log-transformed.
下载: 导出CSV
Table 3. Multivariable associations of serum folate and vitamin B12 levels with odds of general obesity and abdominal obesity among children and adolescents in Jiangsu Province, from 2016 to 2017 (n = 3,079)
Variables Model 1 Model 2 Model 3 OR (95% CI) OR (95% CI) OR (95% CI) Serum folate General obesity Continuous 0.96 (0.85, 1.08) 0.92 (0.81, 1.05) 1.02 (0.89, 1.17) Q1 1.00 (ref.) 1.00 (ref.) 1.00 (ref.) Q2 1.17 (0.86, 1.60) 1.26 (0.91, 1.72) 1.44 (1.03, 2.00) Q3 1.00 (0.72, 1.39) 1.03 (0.73, 1.46) 1.22 (0.86, 1.74) Q4 0.91 (0.64, 1.28) 0.84 (0.58, 1.21) 1.08 (0.74, 1.59) P-trend 0.348 0.163 0.941 Abdominal obesity Continuous 0.98 (0.88, 1.09) 0.90 (0.81, 1.01) 1.00 (0.89, 1.13) Q1 1.00 (ref.) 1.00 (ref.) 1.00 (ref.) Q2 1.06 (0.82, 1.38) 1.05 (0.80, 1.39) 1.21 (0.91, 1.60) Q3 0.90 (0.68, 1.18) 0.82 (0.61, 1.10) 0.98 (0.72, 1.32) Q4 0.94 (0.71, 1.25) 0.79 (0.58, 1.07) 1.02 (0.74, 1.40) P-trend 0.426 0.047 0.685 Serum vitamin B12 General obesity Continuous 0.82 (0.73, 0.93) 0.68 (0.60, 0.78) 0.68 (0.59, 0.78) Q1 1.00 (ref.) 1.00 (ref.) 1.00 (ref.) Q2 0.90 (0.67, 1.21) 0.72 (0.53, 0.99) 0.72 (0.52, 0.99) Q3 0.79 (0.58, 1.08) 0.61 (0.44, 0.86) 0.61 (0.43, 0.85) Q4 0.46 (0.32, 0.65) 0.29 (0.2, 0.43) 0.29 (0.20, 0.43) P-trend < 0.001 < 0.001 < 0.001 Abdominal obesity Continuous 0.83 (0.75, 0.92) 0.68 (0.61, 0.76) 0.68 (0.60, 0.77) Q1 1.00 (ref.) 1.00 (ref.) 1.00 (ref.) Q2 0.86 (0.67, 1.11) 0.67 (0.51, 0.87) 0.67 (0.51, 0.88) Q3 0.83 (0.64, 1.08) 0.63 (0.47, 0.83) 0.63 (0.47, 0.85) Q4 0.56 (0.42, 0.75) 0.36 (0.26, 0.49) 0.36 (0.26, 0.50) P-trend < 0.001 < 0.001 < 0.001 Note. The quartiles of serum folate concentration were as follows: < 4.7 ng/mL (Q1), 4.7–6.8 (Q2), 6.9–9.6 (Q3), and ≥ 9.7 (Q4). The quartiles of serum vitamin B12 concentrations were as follows: < 405.4 pg/mL (Q1), 405.4–554.1 (Q2), 554.2–728.8 (Q3), and ≥ 728.9 (Q4). Model 1: adjusted for age, sex; Model 2: additionally adjusted for region, ethnicity, total energy intake, MVPA time, passive smoking status and alcohol consumption status, hs-CRP (log-transformed), eGFR (log-transformed) and multivitamin or B-vitamin supplements use; Model 3: additionally adjusted for vitamin B12 (log-transformed) or serum folate (log-transformed) concentrations. MVPA, total moderate-to-vigorous intensity physical activity; hs-CRP, high-sensitivity C-reactive protein; eGFR, estimated glomerular filtration rate; OR, odds ratio; CI, confidence interval. Serum folate and vitamin B12 levels were log-transformed and standardized by subtracting the mean and dividing it by the standard deviation.
下载: 导出CSV
Table 4. Joint association of serum folate and vitamin B12 levels with general obesity and abdominal obesity among Chinese children and adolescents in Jiangsu Province, from 2016 to 2017 (n = 3,079)
Serum folate Serum vitamin B12 Low Moderate High General obesity Low 1.13 (0.74, 1.72) 0.80 (0.53, 1.21) 0.63 (0.27, 1.49) Moderate 1.63 (1.11, 2.40) 1.00 (ref.) 0.51 (0.34, 0.77) High 1.60 (0.75, 3.41) 0.93 (0.65, 1.34) 0.31 (0.19, 0.50) Abdominal obesity Low 1.43 (1.00, 2.03) 0.94 (0.66, 1.33) 0.77 (0.37, 1.59) Moderate 1.50 (1.07, 2.11) 1.00 (ref.) 0.60 (0.42, 0.85) High 2.06 (1.09, 3.91) 0.96 (0.70, 1.32) 0.46 (0.31, 0.67) Note. The categories “low” “moderate” and “high” serum folate levels were based to quartiles and defined as follows: ≤ 4.7 ng/mL (Q1), 4.8–9.7 ng/mL (Q2 and Q3) and > 9.8 ng/mL (Q4), respectively. The categories “low” “moderate” and “high” serum vitamin B12 levels were based to quartiles (Q) and defined as follows: ≤ 405.4 pg/mL (Q1), 405.4–728.7 ng/mL (Q2 and Q3) and > 728.8 ng/mL (Q4), respectively. Model adjusted for age, sex, region, ethnicity, total energy intake, MVPA time, multivitamin or B-vitamin supplement use, hs-CRP level (log-transformed), eGFR (log-transformed), passive smoking status, and alcohol consumption status.MVPA, total moderate-to-vigorous intensity physical activity; hs-CRP, high-sensitivity C-reactive protein; eGFR, estimated glomerular filtration rate.
下载: 导出CSV
-
[1] NCD Risk Factor Collaboration (NCD-RisC). Worldwide trends in body-mass index, underweight, overweight, and obesity from 1975 to 2016: a pooled analysis of 2416 population-based measurement studies in 128·9 million children, adolescents, and adults. Lancet, 2017; 390, 2627−42. doi: 10.1016/S0140-6736(17)32129-3 [2] WHO. Obesity and overweight. Geneva: WHO, 2021. https://www.who.int/news-room/fact-sheets/detail/obesity-and-overweight. [2020-4-1]. [3] Dong YH, Lau PWC, Dong B, et al. Trends in physical fitness, growth, and nutritional status of Chinese children and adolescents: a retrospective analysis of 1·5 million students from six successive national surveys between 1985 and 2014. Lancet Child Adolesc Health, 2019; 3, 871−80. doi: 10.1016/S2352-4642(19)30302-5 [4] García OP, Long KZ, Rosado JL. Impact of micronutrient deficiencies on obesity. Nutr Rev, 2009; 67, 559−72. doi: 10.1111/j.1753-4887.2009.00228.x [5] Thomas-Valdés S, Tostes MDGV, Anunciação PC, et al. Association between vitamin deficiency and metabolic disorders related to obesity. Crit Rev Food Sci Nutr, 2017; 57, 3332−43. doi: 10.1080/10408398.2015.1117413 [6] Lyon P, Strippoli V, Fang B, et al. B vitamins and one-carbon metabolism: implications in human health and disease. Nutrients, 2020; 12, 2867. doi: 10.3390/nu12092867 [7] Finer S, Saravanan P, Hitman G, et al. The role of the one-carbon cycle in the developmental origins of type 2 diabetes and obesity. Diabet Med, 2014; 31, 263−72. doi: 10.1111/dme.12390 [8] Ullegaddi R, Powers HJ, Gariballa SE. B-group vitamin supplementation mitigates oxidative damage after acute ischaemic stroke. Clin Sci (Lond), 2004; 107, 477−84. doi: 10.1042/CS20040134 [9] Li Z, Gueant-Rodriguez RM, Quilliot D, et al. Folate and vitamin B12 status is associated with insulin resistance and metabolic syndrome in morbid obesity. Clin Nutr, 2018; 37, 1700−6. doi: 10.1016/j.clnu.2017.07.008 [10] Kaya C, Cengiz SD, Satıroğlu H. Obesity and insulin resistance associated with lower plasma vitamin B12 in PCOS. Reprod Biomed Online, 2009; 19, 721−6. doi: 10.1016/j.rbmo.2009.06.005 [11] Chan CW, Chan PH, Lin BF. Folate deficiency increased lipid accumulation and leptin production of adipocytes. Front Nutr, 2022; 9, 852451. doi: 10.3389/fnut.2022.852451 [12] Chen S, Yang MY, Wang R, et al. Suppression of high-fat-diet-induced obesity in mice by dietary folic acid supplementation is linked to changes in gut microbiota. Eur J Nutr, 2022; 61, 2015−31. doi: 10.1007/s00394-021-02769-9 [13] Kumar KA, Lalitha A, Pavithra D, et al. Maternal dietary folate and/or vitamin B12 restrictions alter body composition (adiposity) and lipid metabolism in Wistar rat offspring. J Nutr Biochem, 2013; 24, 25−31. doi: 10.1016/j.jnutbio.2012.01.004 [14] Gallistl S, Sudi K, Mangge H, et al. Insulin is an independent correlate of plasma homocysteine levels in obese children and adolescents. Diabetes Care, 2000; 23, 1348−52. doi: 10.2337/diacare.23.9.1348 [15] Pinhas-Hamiel O, Doron-Panush N, Reichman B, et al. Obese children and adolescents: a risk group for low vitamin B12 concentration. Arch Pediatr Adolesc Med, 2006; 160, 933−6. [16] Gunanti IR, Marks GC, Al-Mamun A, et al. Low serum vitamin B-12 and folate concentrations and low thiamin and riboflavin intakes are inversely associated with greater adiposity in Mexican American children. J Nutr, 2014; 144, 2027−33. doi: 10.3945/jn.114.201202 [17] Brasileiro RS, Escrivão MA, Taddei JA, et al. Plasma total homocysteine in Brazilian overweight and non-overweight adolescents: a case-control study. Nutr Hosp, 2005; 20, 313−9. [18] Paul L, Selhub J. Interaction between excess folate and low vitamin B12 status. Mol Aspects Med, 2017; 53, 43−7. doi: 10.1016/j.mam.2016.11.004 [19] Yajnik CS, Deshpande SS, Jackson AA, et al. Vitamin B12 and folate concentrations during pregnancy and insulin resistance in the offspring: the Pune Maternal Nutrition Study. Diabetologia, 2008; 51, 29−38. doi: 10.1007/s00125-007-0793-y [20] Zhu QR, Dai Y, Zhang JX, et al. Association between serum zinc concentrations and metabolic risk factors among Chinese children and adolescents. Br J Nutr, 2021; 126, 1529−36. doi: 10.1017/S0007114521000258 [21] Zhang J, Wang DT, Eldridge AL, et al. Urban-rural disparities in energy intake and contribution of fat and animal source foods in Chinese children aged 4-17 years. Nutrients, 2017; 9(5): 526. [22] Li H, Zong XN, Ji CY, et al. Body mass index cut-offs for overweight and obesity in Chinese children and adolescents aged 2-18 years. Article in Chinese. Chin J Epidemiol, 2010; 31, 616−20. (In Chinese [23] National Health and Family Planning Commission of PRC. WS/T 586-2018 Screening for overweight and obesity among school-age children and adolescents. Beijing: Standards Press of China, 2018. (In Chinese [24] Dong B, Wang ZQ, Arnold LW, et al. Simplifying the screening of abdominal adiposity in Chinese children with waist-to-height ratio. Am J Hum Biol, 2016; 28, 945−9. doi: 10.1002/ajhb.22894 [25] Zhao WH, Huang ZP, Zhang X, et al. Reproducibility and validity of a Chinese food frequency questionnaire. Biomed Environ Sci, 2010; 23 Suppl, 1-38. [26] Yang YX, Wang GY, Pan XC. China food composition. 2nd ed. Peking University Medical Press. 2009. (In Chinese [27] Boutelle KN, Rhee KE, Liang JE, et al. Effect of attendance of the child on body weight, energy intake, and physical activity in childhood obesity treatment: a randomized clinical trial. JAMA Pediatr, 2017; 171, 622−8. doi: 10.1001/jamapediatrics.2017.0651 [28] Levey AS, Stevens LA, Schmid CH, et al. A new equation to estimate glomerular filtration rate. Ann Intern Med, 2009; 150, 604−12. doi: 10.7326/0003-4819-150-9-200905050-00006 [29] Cole TJ, Bellizzi MC, Flegal KM, et al. Establishing a standard definition for child overweight and obesity worldwide: international survey. BMJ, 2000; 320, 1240−3. doi: 10.1136/bmj.320.7244.1240 [30] Mei H, Guo SY, Lu HY, et al. Impact of parental weight status on children's body mass index in early life: evidence from a Chinese cohort. BMJ Open, 2018; 8, e018755. doi: 10.1136/bmjopen-2017-018755 [31] Riso EM, Kull M, Mooses K, et al. Physical activity, sedentary time and sleep duration: associations with body composition in 10-12-year-old Estonian schoolchildren. BMC Public Health, 2018; 18, 496. doi: 10.1186/s12889-018-5406-9 [32] Willett WC, Howe GR, Kushi LH. Adjustment for total energy intake in epidemiologic studies. Am J Clin Nutr, 1997; 65, 1220S−8S. doi: 10.1093/ajcn/65.4.1220S [33] Poorolajal J, Sahraei F, Mohamdadi Y, et al. Behavioral factors influencing childhood obesity: a systematic review and meta-analysis. Obes Res Clin Pract, 2020; 14, 109−18. doi: 10.1016/j.orcp.2020.03.002 [34] Samson ME, Yeung LF, Rose CE, et al. Vitamin B-12 malabsorption and renal function are critical considerations in studies of folate and vitamin B-12 interactions in cognitive performance: NHANES 2011-2014. Am J Clin Nutr, 2022; 116, 74−85. doi: 10.1093/ajcn/nqac065 [35] Hinnouho GM, Hampel D, Shahab-Ferdows S, et al. Daily supplementation of a multiple micronutrient powder improves folate but not thiamine, riboflavin, or vitamin B12 status among young Laotian children: a randomized controlled trial. Eur J Nutr, 2022; 61, 3423−35. doi: 10.1007/s00394-022-02890-3 [36] Sun YB, Sun MX, Liu BY, et al. Inverse association between serum vitamin B12 concentration and obesity among adults in the United States. Front Endocrinol (Lausanne), 2019; 10, 414. doi: 10.3389/fendo.2019.00414 [37] Knight BA, Shields BM, Brook A, et al. Lower circulating B12 is associated with higher obesity and insulin resistance during pregnancy in a non-diabetic white British population. PLoS One, 2015; 10, e0135268. doi: 10.1371/journal.pone.0135268 [38] Sukumar N, Venkataraman H, Wilson S, et al. Vitamin B12 status among pregnant women in the UK and its association with obesity and gestational diabetes. Nutrients, 2016; 8, 768. doi: 10.3390/nu8120768 [39] Krishnaveni GV, Hill JC, Veena SR, et al. Low plasma vitamin B12 in pregnancy is associated with gestational 'diabesity' and later diabetes. Diabetologia, 2009; 52, 2350−8. doi: 10.1007/s00125-009-1499-0 [40] Wiebe N, Field CJ, Tonelli M. A systematic review of the vitamin B12, folate and homocysteine triad across body mass index. Obes Rev, 2018; 19, 1608−18. doi: 10.1111/obr.12724 [41] Mahabir S, Ettinger S, Johnson L, et al. Measures of adiposity and body fat distribution in relation to serum folate levels in postmenopausal women in a feeding study. Eur J Clin Nutr, 2008; 62, 644−50. doi: 10.1038/sj.ejcn.1602771 [42] Bradbury KE, Williams SM, Mann JI, et al. Estimation of serum and erythrocyte folate concentrations in the New Zealand adult population within a background of voluntary folic acid fortification. J Nutr, 2014; 144, 68−74. doi: 10.3945/jn.113.182105 [43] Mlodzik-Czyzewska MA, Malinowska AM, Chmurzynska A. Low folate intake and serum levels are associated with higher body mass index and abdominal fat accumulation: a case control study. Nutr J, 2020; 19, 53. doi: 10.1186/s12937-020-00572-6 [44] Kancherla V, Botto LD, Rowe LA, et al. Preventing birth defects, saving lives, and promoting health equity: an urgent call to action for universal mandatory food fortification with folic acid. Lancet Glob Health, 2022; 10, e1053−7. doi: 10.1016/S2214-109X(22)00213-3 [45] Zheng LD, Linarelli LE, Liu LH, et al. Insulin resistance is associated with epigenetic and genetic regulation of mitochondrial DNA in obese humans. Clin Epigenetics, 2015; 7, 60. doi: 10.1186/s13148-015-0093-1 [46] Selhub J, Miller JW, Troen AM, et al. Perspective: the high-folate-low-vitamin B-12 interaction is a novel cause of vitamin B-12 depletion with a specific etiology-a hypothesis. Adv Nutr, 2022; 13, 16−33. doi: 10.1093/advances/nmab106 [47] He YN, Zhao WH, Zhang J, et al. Data resource profile: China national nutrition surveys. Int J Epidemiol, 2019; 48, 368-f. -

 点击查看大图
计量
- 文章访问数: 87
- HTML全文浏览量: 40
- PDF下载量: 21
- 被引次数: 0

 Quick Links