

 下载:
下载:


-
Benzene is a widely recognized environmental pollutant that chronic exposure can induce hematotoxicity, augmenting the risk of aplastic anemia and hematological neoplasms, especially in occupationally exposed populations[1,2]. After entering the body, benzene is metabolized in the liver, lung, and bone marrow, transforming into various metabolites including phenol and hydroquinone (HQ), while an increasing number of studies have demonstrated the pivotal role of these phenolic metabolites in the benzene-induced hematotoxicity[3-9].
Among these metabolites, HQ is a major active metabolite and often serves as a substitute for benzene in vitro experiments. Our previous study identified that, during hemin-induced erythroid differentiation, HQ distinctly inhibited the expression of globin genes and critical transcription factor genes (GATA-1 and NF-E2)[7], while transcription of some erythroid-related genes was down-regulated by HQ-induced DNA methylation[10,11]. Other epigenetic changes, including histone modifications, aberrant expression of ncRNAs, and chromatin remodeling, also involve in HQ-induced hematotoxicity[12,13]. It has been reported that HQ induced the generation of reactive oxygen species (ROS), the phosphorylation of histone γ-H2AX, and the production of the DNA damage-responsive enzyme PARP-1, consequently leading to cell apoptosis via a mitochondria-mediated apoptotic pathway in TK6 cells[14]. Consistently, we have proved that exposure to HQ induced increases in ROS, the activity of caspase-8, the expression of Fas and FasL on the cell surface, and the decrease in the cell surface sialic acid level, which not only affected cell cycles but induced the inhibition of erythroid differentiation and apoptosis as well in K562 cells[15,16]. Recent studies focused on the effects of microRNAs (miRNAs) expression changes in HQ-induced hemotoxicity and leukemogenesis[9,17,18]. Some researchers have proposed that the down-regulation of miRNA-451a and miRNA-486-5p might involve in HQ-induced inhibition of erythroid cell differentiation in CD34+ hematopoietic progenitor cells[9], besides miR-1246 and miR-224 were the potential major regulators in HQ-exposed K562 cells[18].
Proteomics aims to identify and quantify the compositions, expression levels, post-translational modification, interactions, and functions in tissues and cells of all proteins in a given sample[19,20]. Proteins are the final product of gene expression and directly regulate the life activities of organisms. Applying proteomics to environmental toxicology research is conducive to identifying and screening new high-sensitivity protein markers, which will contribute to revealing the toxicological molecular mechanism of exogenous substances more intuitively and deeply[21-23]. Reports on the toxicological mechanism of hematotoxicity of benzene and HQ mostly focus on genomics and transcriptomic analysis[9,17,18,24-26], especially the analysis of miRNA expression[9,17,18,25]. However, there are few relevant reports on proteomic analysis. Although these studies have clarified some important potential mechanisms of benzene and HQ-induced hematotoxicity, they are not as intuitive as proteomic analysis of the final product protein of gene expression and may omit information leading to incomplete analysis.
Based on previous studies, we hypothesized that HQ mainly induces hematotoxicity by inhibiting hematopoietic differentiation, especially erythroid differentiation. Human leukemia K562 cells were derived from a patient with chronic myeloid leukemia and can be induced to red cell differentiation in vitro, which can be served as a good model system for investigating erythroid differentiation[27,28]. Therefore, through label-free proteomic analysis and bioinformatics methods, this study aims to screen HQ-induced differentially expressed proteins (DEPs) in K562 cells and identify their functions and signaling pathways involved in regulation and the networks of protein interactions, especially in erythroid differentiation, so that we can have a deeper understanding of the mechanism of HQ-induced hemotoxicity.
-
Human leukemia K562 cells were purchased from Cell Resource Center, Peking Union Medical College (CRC/PUMC, China), and were cultured in RPMI-1640 culture medium (Invitrogen) supplemented with 10% (V/V) fetal bovine serum (FBS) (HyClone), 100 U/mL penicillin (Sigma-Aldrich), and 100 μg/mL streptomycin (Sigma-Aldrich) in a humidified 5% CO2 incubator at 37 °C. Exponentially growing K562 cells at passages 4–8 after recovery were collected and re-suspended in a fresh culture medium. According to our previous study[7], after K562 cells were treated with 40 μmol/L HQ (Sigma-Aldrich) for 72 h, the cells were harvested for further study.
-
Mass spectrometry (MS) analyses were performed at the Peking University medical and health analytical center using 200 μg protein samples. The protein samples were denatured using 8 mol/L urea, diluted using 10 mmol/L dithiothreitol (DTT), alkylated using 1 mol/L iodoacetamide, washed three times with 50 mmol/L ammonium bicarbonate and digested with trypsin at 37 °C overnight. The digestion was quenched with 50 mmol/L ammonium bicarbonate and dried in a vacuum concentrator.
The desalted peptides were separated by high-pH reversed-phase high-performance liquid chromatography (RP-HPLC). The samples were dissolved in mobile phase A (20 mmol/L ammonium formate, pH = 10), mixed well by vortex shock, and centrifuged at 12,000 ×g for 20 min. The supernatants were desalted on the C18 precolumn (3.5 μm, 4.6 mm × 20 mm, water) and eluted in mobile phase B (20 mmol/L ammonium formate (pH = 10) in 80% (v/v) acetonitrile) on BEH130C18 column (3.5 μm, 2.1 mm × 150 mm column, water). The flow rate of mobile phase B was 230 μL/min with a linear gradient as followed: (1) 0–9 min, 5%–15% B; (2) 9–30 min, 15%–50% B; (3) 30–41 min, 50%–90% B; (4) 41–60 min, 90% B. After elution, 27 fractions were collected, combined into 8 fractions with UV absorption at 214 nm, and then dried in a vacuum concentrator.
The dried fractions were dissolved in mobile phase C [0.1% (v/v) formic acid in water] and analyzed by nano-liquid chromatography-tandem mass spectrometry (LC-MS/MS) consisting of ultimate 3,000 coupled to Q-Exactive HF. The mobile phase D [0.1% (v/v) formic acid in acetonitrile] increased from 5% to 90% in 110 mins. The mass spectrometer was operated in the positive-ion mode at an ion transfer tube temperature of 300 °C with 2.2 kV positive-ion spray voltage. Orbitrap Velos was set up in Data-Dependent Acquisition (DDA) mode. The resolution of full-scan MS (350–2,000 m/z) in the Orbitrap analyzer was 60,000; the 20 most intense ions from the preceding MS were sequentially collected; the Normalized collision energy (NCE) was 27%; dynamic exclusion was set to an exclusion duration of 30 s and a repetition count of 1. The tandem mass spectra were searched against the human UniProt Non-redundant Reference database (2018.05) using Proteome Discoverer 2.2 software. As search parameters, a tolerance of 10 ppm was considered for precursor ions (MS search) and 0.02 Da for fragment ions (MS/MS search); the maximum number of missed cleavages was 2; carbamidomethylation of cysteine was set as a fixed modification; protein N-terminal oxidation of methionine was set as a variable modification. The search results are imported into skyline for data analysis of Data-Independent Acquisition (DIA).
The DIA was performed using the same liquid phase separation gradient as DDA; full scan MS spectra (350–1,200 m/z) is divided into 40 Da precursor isolation windows, and each parent window is sequentially selected, fragmented, and collected. All sub-ion information is used for quantification. The search results are imported into Skyline for data analysis. Protein abundances were calculated using the label-free quantitation algorithm (LFQ). LFQ Intensity was used for protein quantitation. The minimum ratio count of LFQ was set to 2. The false discovery rate (FDR) was set to 0.05.
-
The samples were collected and pretreated in a similar way as Proteomics. The mobile phase D increased from 4% to 90% in 72 mins. The mass range of full-scan MS was 350–1,500 m/z. The resolution, ACG target, and Maximum IT were 30,000 at 200 m/z, 3e6, and 20 ms for the first ion MS, respectively. The ACG target was 1e5 and the maximum IT was 45 ms for the secondary ion MS. Isolation Windows is 1.0 m/z. Skyline software was used to analyze PRM data and differential expression protein data was analyzed with MSstats.
-
Proteins with a P-value < 0.05 were considered differentially expressed. Differentially expressed proteins (DEPs) analysis of two groups (three biological replicates per group) was indicated with the absolute log2 (fold change of HQ/C) values. Gene Ontology (GO) enrichment analysis of DEPs was conducted using PANTHER (http://pantherdb.org/). The pathway analysis of DEPs was carried out using the Kyoto Encyclopedia of Genes and Genomes (KEGG) database (http://www.kegg.jp/). The protein-protein-interaction network was constructed using STRING (http://string-db.org/).
-
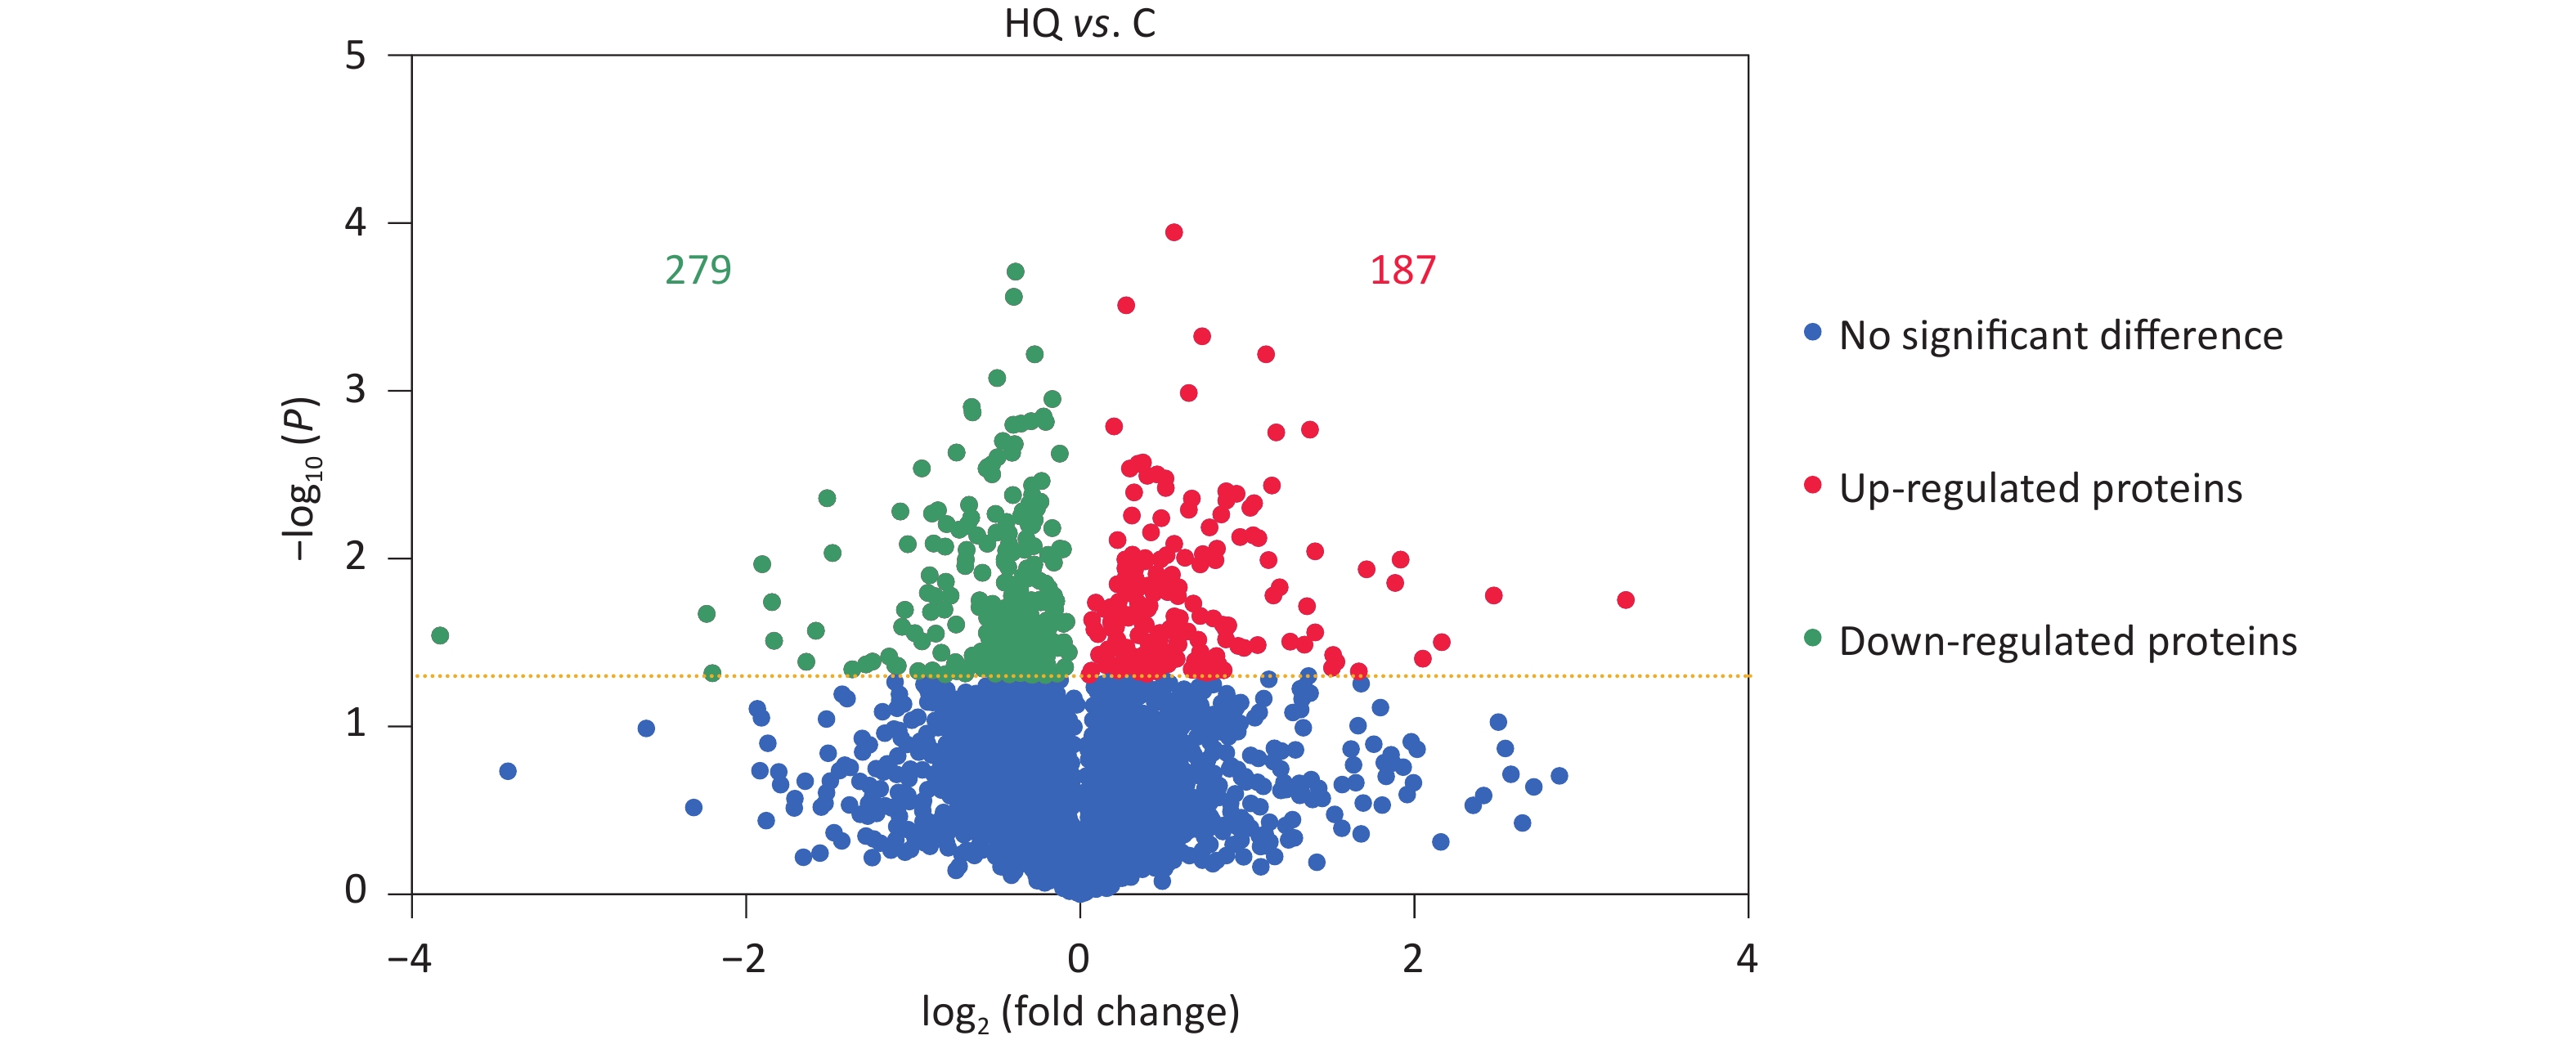
Our previous studies have demonstrated that hemin-induced erythroid differentiation is concentration-dependently and time-dependently inhibited by 0–80 μmol/L hydroquinone in K562 cells[7]. In the present study, the concentration of 40 μmol/L HQ was selected to correspond to no obvious cytotoxicity but markedly inhibiting erythroid differentiation in K562 cells when exposed for 72 h[7,11,16]. Label-free proteomic analysis was applied to analyze the differentially expressed proteins in HQ-induced K562 cells. The DEPs were assessed using a P-value less than 0.05. In Figure 1, the volcano plots summarized the fold change and significance for the protein levels in HQ-induced K562 cells. The results showed that 4,082 proteins were identified and 466 proteins were differentially expressed (P < 0.05) including 187 upregulated proteins and 279 downregulated proteins after HQ exposure. Moreover, there were 121 upregulated DEPs and 154 downregulated DEPs over 1.3-fold change after HQ exposure. Table 1 illustrated the top 10 upregulated DEPs and top 10 downregulated DEPs after HQ exposure for 72 h. ERCC1 increased to 9.62-fold of the control group after HQ exposure, which was the most upregulated DEP. IFITM1 decreased to 0.07-fold of the control group after HQ exposure, which was the most downregulated DEP.
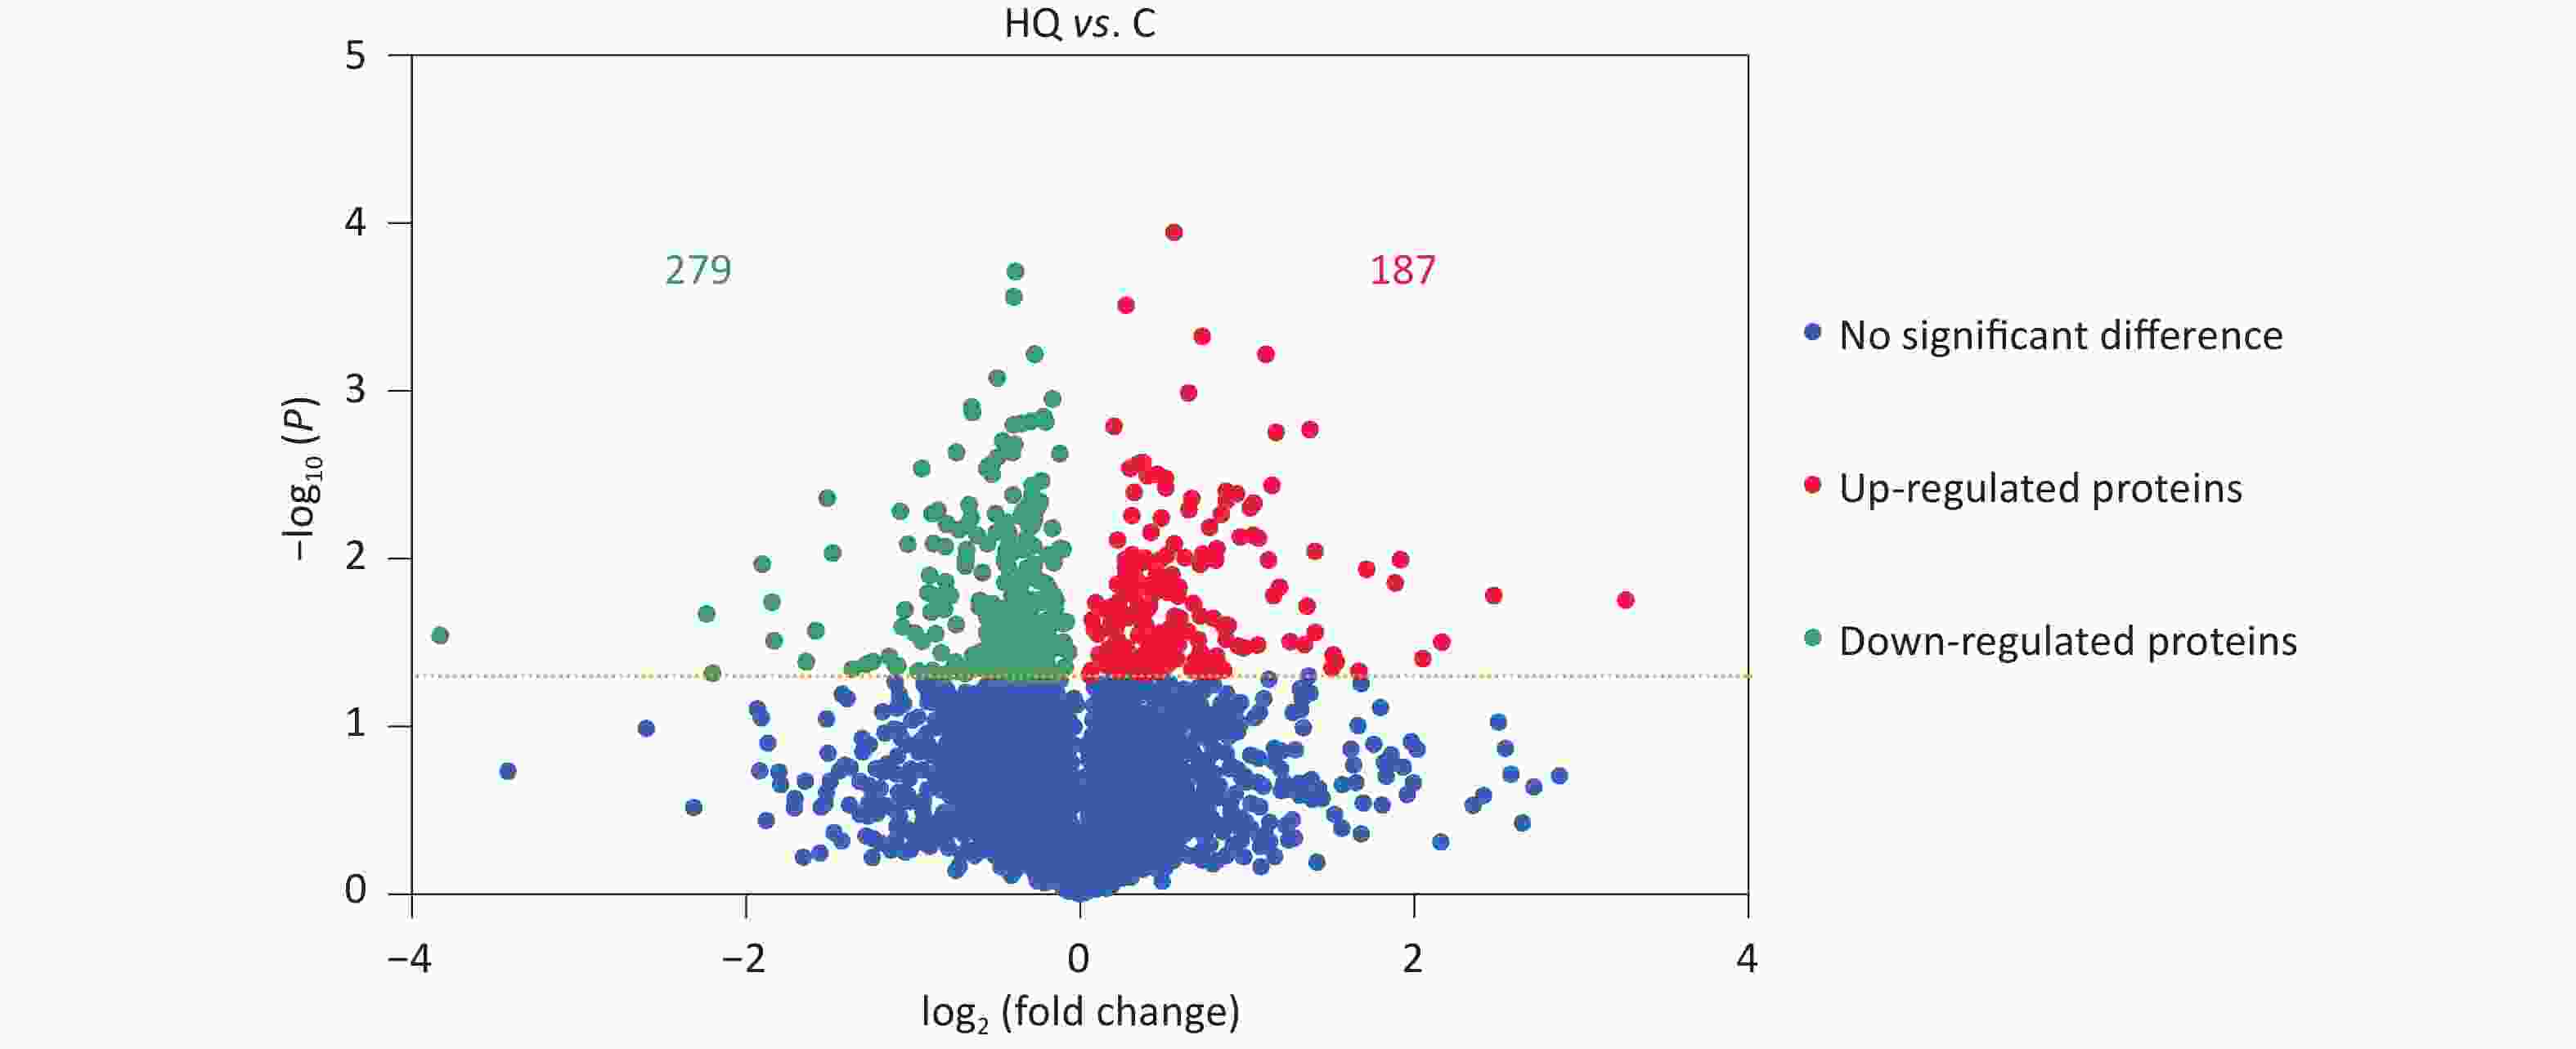
Figure 1. DEPs in HQ-induced K562 cells. K562 cells were induced with 0 and 40 μmol/L HQ for 72 h. The label-free proteomic assay was applied to analyze the DEPs in HQ-induced K562 cells. The volcano plot displays the differences in protein abundance detected between HQ and C groups. Each point represents one of the detected genes. Green points are downregulated DEPs, red points are upregulated DEPs and blue points are proteins without significant changes in HQ-induced K562 cells. Horizontal dotted lines indicate statistical thresholds for a P-value < 0.05 calculated using a two-tailed t-test. Data are representative of three independent experiments. HQ, hydroquinone-induced K562 cells; C, the control group; DEPs, differentially expressed proteins.
Table 1. Top 10 upregulated or downregulated DEPs in HQ-induced K562 cells
Accession Protein name Description Log2 (HQ/C) P-value P07992 ERCC1 ERCC excision repair 1, endonuclease non-catalytic subunit 3.27 0.02 P28799 GRN granulin precursor 2.48 0.02 P13224 GP1BB glycoprotein Ib platelet beta subunit 2.16 0.03 Q86YT6 MIB1 Mind bomb E3 ubiquitin protein ligase 1 2.05 0.04 Q96HR8 NAF1 nuclear assembly factor 1 ribonucleoprotein 1.92 0.01 Q16513 PKN2 protein kinase N2 1.88 0.01 P04004 VTN vitronectin 1.71 0.01 Q96EK4 THAP11 THAP domain containing 11 1.67 0.05 Q04828 AKR1C1 Aldo-keto reductase family 1 member C1 1.53 0.04 P04003 C4BPA complement component 4 binding protein alpha 1.51 0.04 Q16850 CYP51A1 cytochrome P450 family 51 subfamilies A member 1 −1.48 0.01 Q9UDW1 UQCR10 ubiquinol-cytochrome c reductase, complex III subunit X −1.52 0.00 P09972 ALDOC aldolase, fructose-bisphosphate C −1.58 0.03 Q86UE8 TLK2 tousled like kinase 2 −1.64 0.04 Q6GMV3 PTRHD1 peptidyl-tRNA hydrolase domain containing 1 −1.83 0.03 Q16877 PFKFB4 6-phosphofructo-2-kinase/fructose-2,6-biphosphatase 4 −1.85 0.02 A8MPS7 YDJC YdjC homolog (bacterial) −1.90 0.01 P62736 ACTA2 actin, alpha 2, smooth muscle, aorta −2.20 0.05 P16083 NQO2 NAD(P)H quinone dehydrogenase 2 −2.24 0.02 P13164 IFITM1 interferon induced transmembrane protein 1 −3.83 0.03 Note. HQ, hydroquinone; DEPs, differentially expressed proteins. -
PRM is a targeted proteomics strategy that enables simultaneous monitoring of all products of a target peptide under conditions that offer high-resolution and high-mass accuracy[29]. Therefore, it has been widely applied to the validation of proteomics[30,31]. In our research, PRM quantitative analysis was performed. Based on the possible mechanisms suggested in the previous studies of HQ-induced hematotoxicity, including inhibition of erythroid differentiation, intervention of cell cycle and cell apoptosis, epigenetic changes (DNA methylation and histone modification) and signaling pathways, 16 upregulated DEPs and 17 downregulated DEPs were validated with PRM (Table 2). In terms of erythroid differentiation, CD44, ECM1, HBAT, ITA2B, CWC25, HBE, GATA1, HBAZ, and HBA were considerably upregulated, while HBG2 and CD11B were downregulated. In terms of cell cycle and cell apoptosis, CDK4 was upregulated, while IKKB and FADD were downregulated. In terms of DNA methylation and histone modification, TRAM1, NPL4, DNMT1 and HAT1 were significantly upregulated, while H2AZ, KDM1A, HDAC2, H2AY, H12, H31, and H32 were downregulated. In terms of signaling pathways, TGFB1 and BRAT1 were considerably up-regulated, while MTOR, SMAD3, STAT3, BCAT1, STA5B, and GSK3B were down-regulated. The changing trends of these DEPs were consistent with the analysis results of proteomic methods, confirming the reliability of the data.
Table 2. Comparison of DEPs identified by PRO and PRM in HQ-induced K562 cells
Accession Protein name Description PRO Log2 (HQ/C) PRM Log2 (HQ/C) Erythroid differentiation P16070 CD44 CD44 molecule (Indian blood group) 1.13 1.02 Q16610 ECM1 extracellular matrix protein 1 1.32 0.82 P09105 HBAT hemoglobin subunit theta−1 0.71 0.79 P08514 ITA2B integrin alpha-IIb 0.80 0.75 Q9NXE8 CWC25 CWC25 spliceosome associated protein homolog 0.63 0.65 P02100 HBE hemoglobin subunit epsilon 0.48 0.60 P15976 GATA1 GATA binding protein 1; erythroid transcription factor 0.04 0.39 P02008 HBAZ hemoglobin subunit zeta 0.27 0.36 P69905 HBA hemoglobin subunit alpha 0.19 0.17 P69892 HBG2 hemoglobin subunit gamma-2 −0.58 −0.31 P21127 CD11B cyclin-dependent kinase 11B −0.18 −0.03 Cell cycle and cell apoptosis P11802 CDK4 cyclin-dependent kinase 4 0.63 1.08 O14920 IKKB inhibitor of nuclear factor kappa-B kinase subunit beta −0.36 −0.26 Q13158 FADD FAS-associated death domain protein −0.52 −0.32 DNA methylation and histone modification Q15629 TRAM1 translocation chain-associated membrane protein 1 0.36 0.62 Q8TAT6 NPL4 nuclear protein localization protein 4 homolog 0.24 0.47 P26358 DNMT1 DNA (cytosine-5)-methyltransferase 1 0.12 0.45 O14929 HAT1 histone acetyltransferase type B catalytic subunit 0.22 0.15 P0C0S5 H2AZ H2A.Z variant histone −0.72 −0.15 O60341 KDM1A lysine-specific histone demethylase 1A −0.43 −0.18 Q92769 HDAC2 histone deacetylase 2 −0.46 −0.20 O75367 H2AY core histone macro-H2A.1 −0.25 −0.39 P16403 H12 histone H1.2 −0.46 −0.42 P68431 H31 histone H3.1 −0.89 −1.29 Q71DI3 H32 histone H3.2 −1.10 −1.75 Signaling pathways P01137 TGFB1 transforming growth factor beta−1 proprotein 0.23 0.73 P42345 MTOR mechanistic target of rapamycin kinase;
serine/threonine-protein kinase mTOR−0.06 −0.31 P84022 SMAD3 mothers against decapentaplegic homolog 3 −0.43 −0.45 P40763 STAT3 signal transducer and activator of transcription 3 −0.14 −0.74 P54687 BCAT1 branched-chain-amino-acid aminotransferase 1, cytosolic −1.08 −0.81 P51692 STA5B signal transducer and activator of transcription 5B −0.37 −1.12 P49841 GSK3B glycogen synthase kinase-3 beta −0.38 −1.15 Q6PJG6 BRAT1 BRCA1-associated ATM activator 1 0.44 0.35 Note. DEPs, differentially expressed proteins; PRO, proteomics; PRM, parallel reaction monitoring; HQ, hydroquinone. -
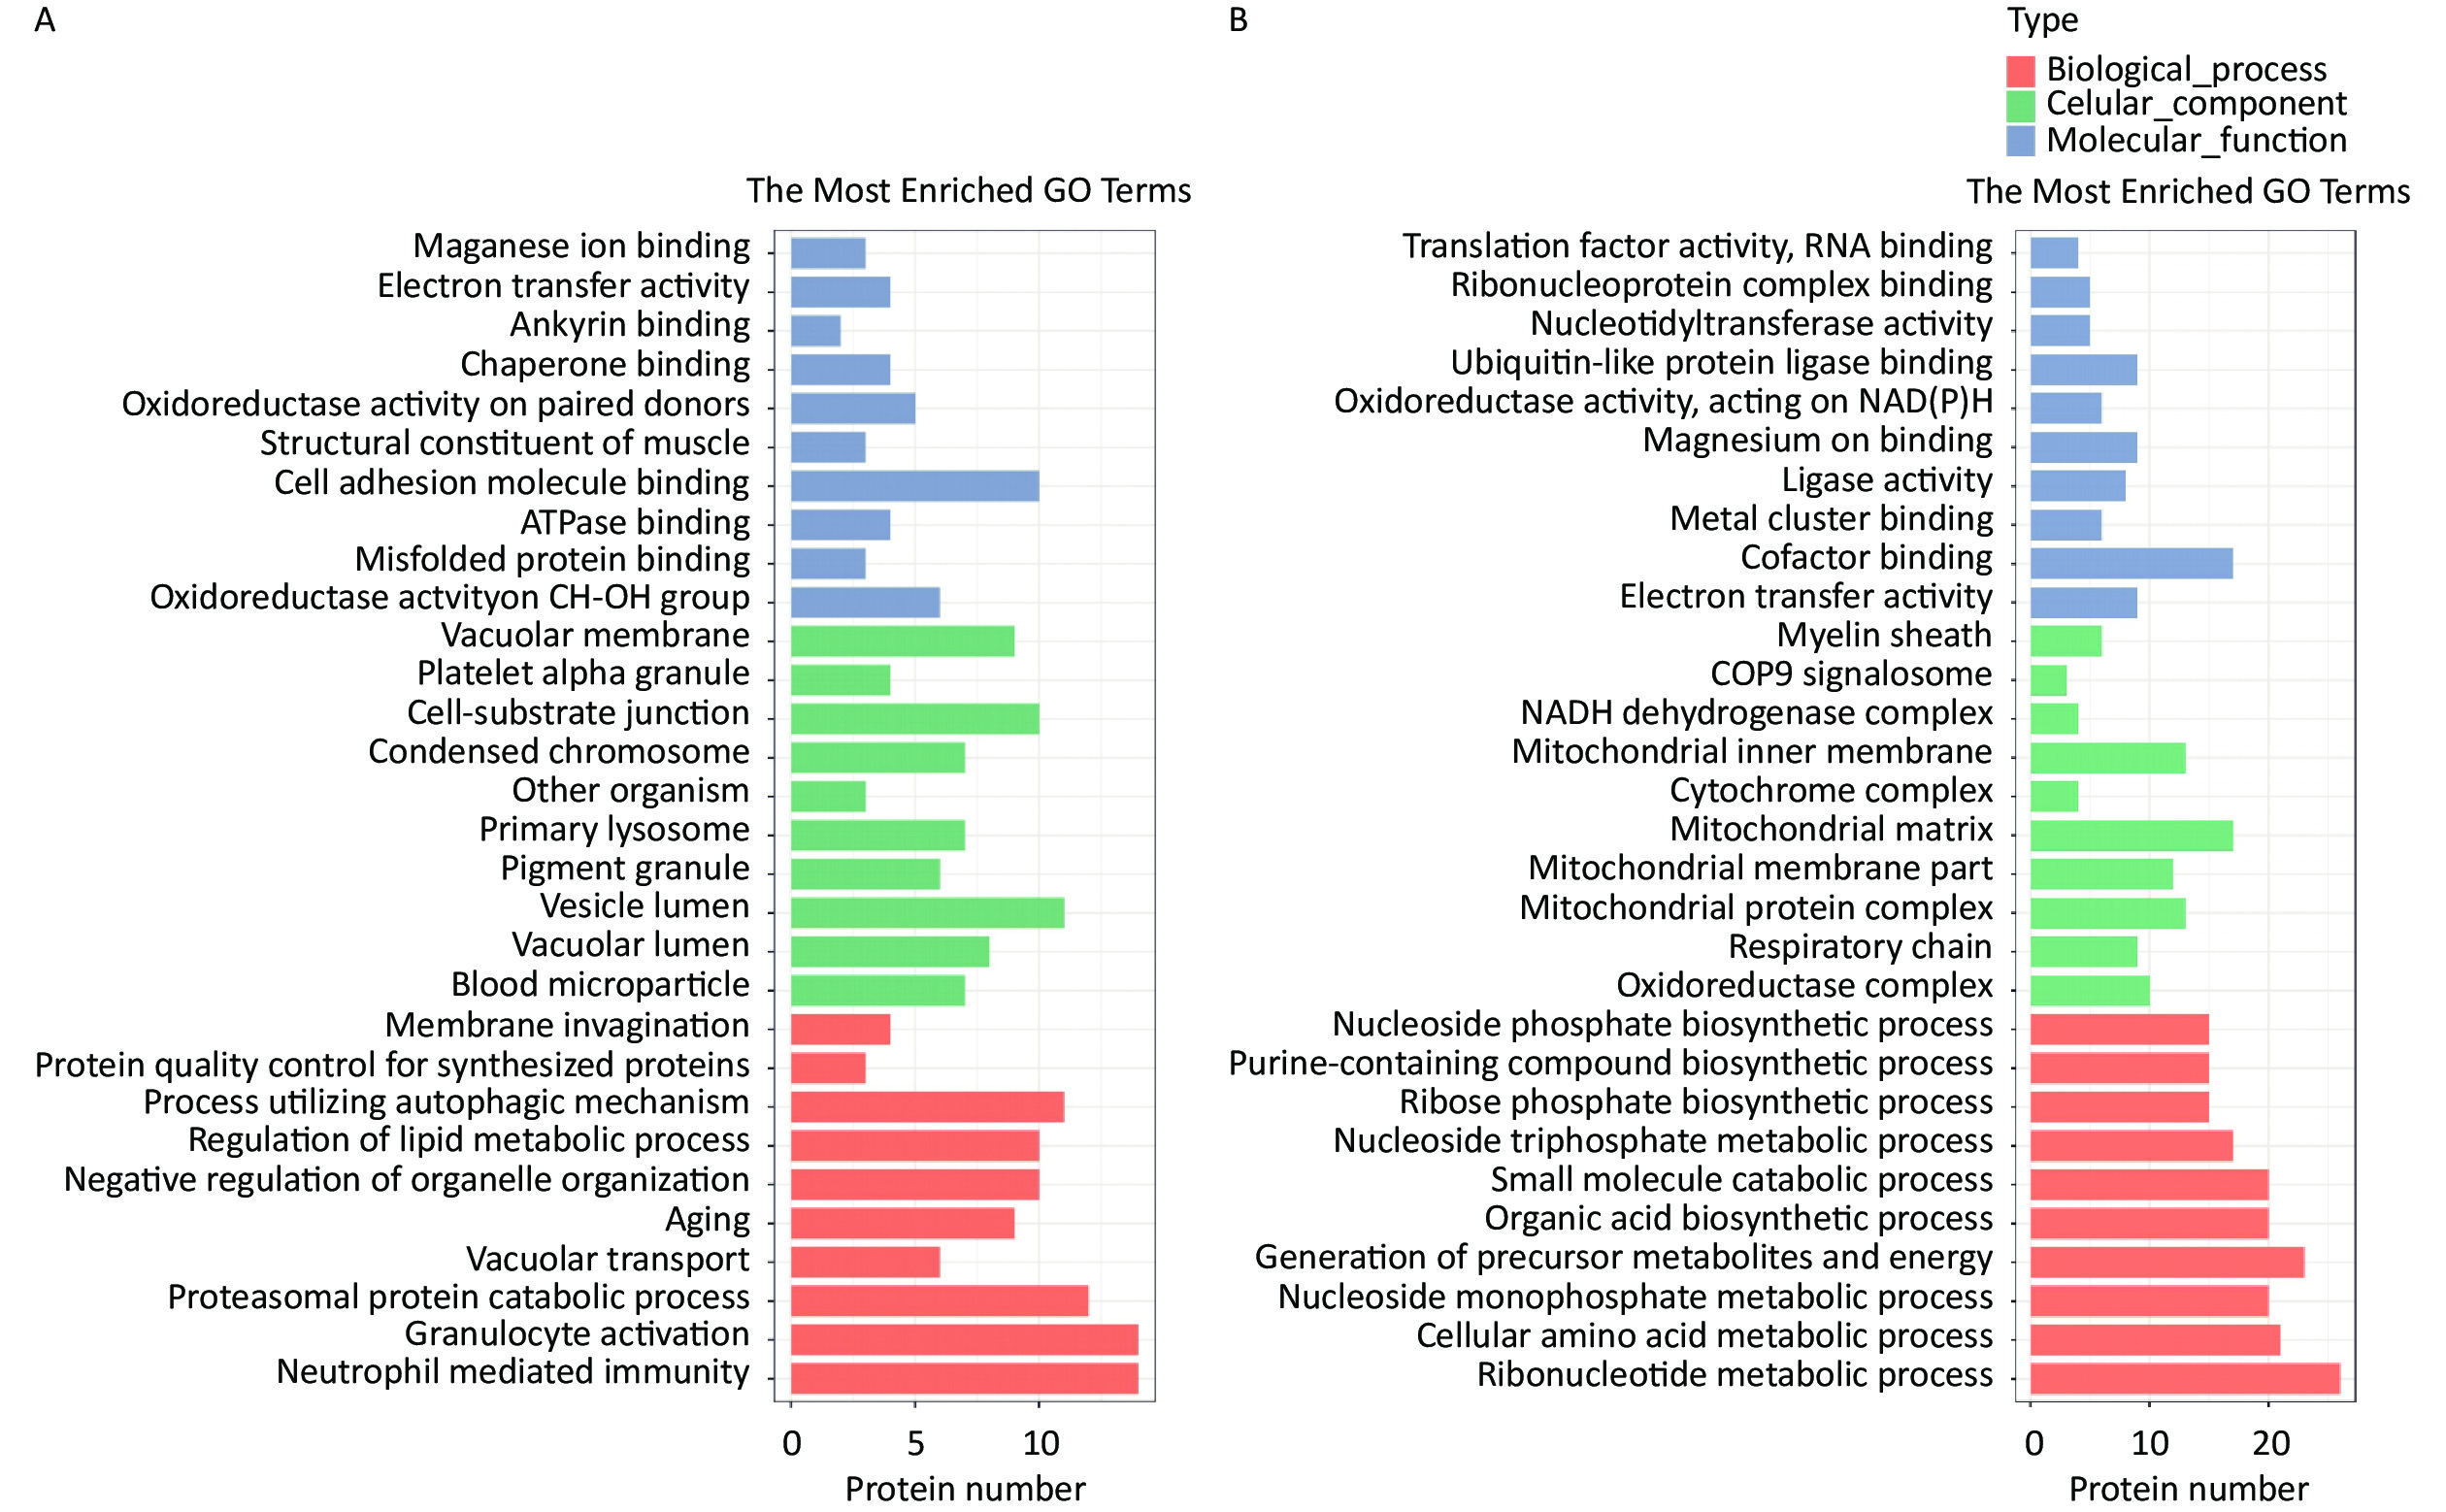
The HQ-upregulated DEPs were annotated with 820 GO annotations according to their biological processes, cellular components, and molecular functions. The top 30 enriched GO terms were shown in Figure 2. GO analysis of HQ-upregulated DEPs showed that the biological processes were enriched in neutrophil mediated immunity, granulocyte activation, proteasomal protein catabolic process, vacuolar transport, and aging; the cellular components were enriched in blood microparticle, vacuolar lumen, vesicle lumen, pigment granule and primary lysosome; the molecular functions were enriched in oxidoreductase activity acting on CH-OH group of donors, misfolded protein binding, ATPase binding, cell adhesion molecule binding and structural constituent of muscle (Figure 2A).
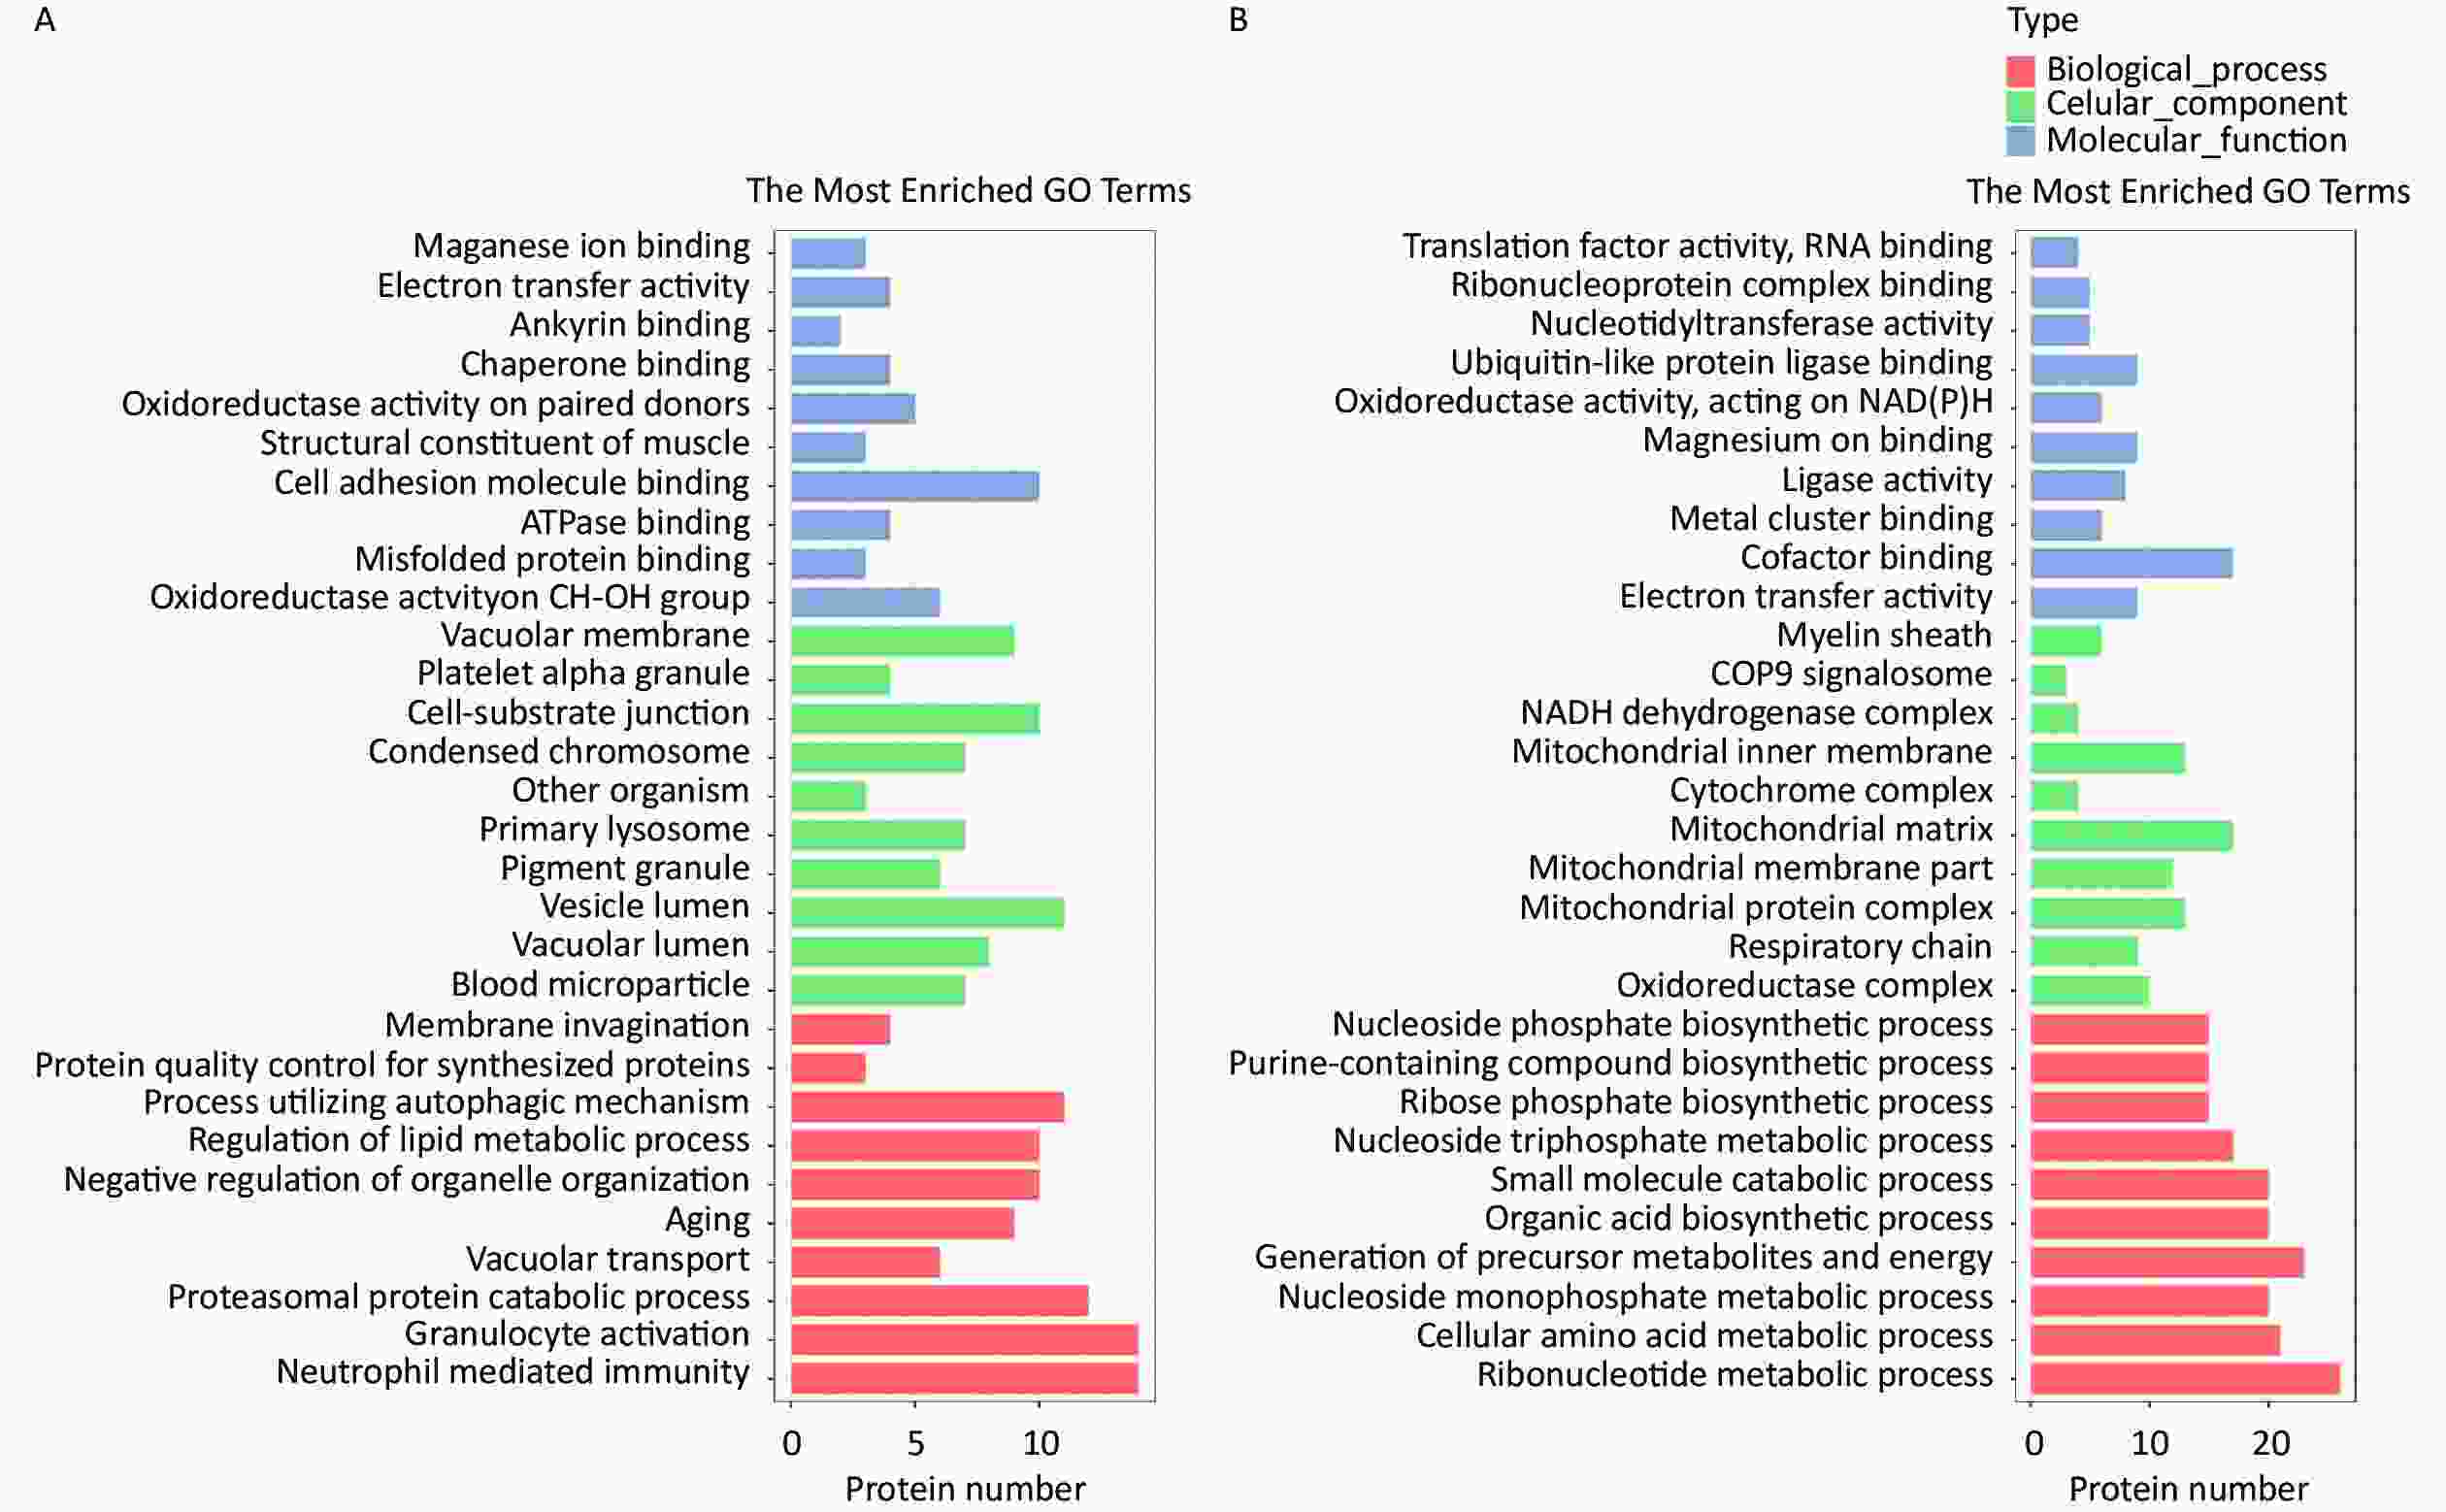
Figure 2. GO analysis of DEPs in HQ-induced K562 cells. (A) GO enrichment histogram of upregulated DEPs. (B) GO enrichment histogram of downregulated DEPs. GO, Gene Ontology; DEPs, differentially expressed proteins; HQ, hydroquinone.
GO analysis of HQ-downregulated DEPs with 806 GO annotations showed that the biological processes were enriched in ribonucleotide metabolic process, cellular amino acid metabolic process, nucleoside monophosphate metabolic process, generation of precursor metabolites and energy and organic acid biosynthetic process; the cellular components were enriched in oxidoreductase complex, respiratory chain, mitochondrial protein complex, mitochondrial membrane part, and mitochondrial matrix; the molecular functions were enriched in electron transfer activity, cofactor binding, metal cluster binding, ligase activity and magnesium ion binding (Figure 2B).
Previous research has shown that HQ considerably inhibits hemin-induced erythroid differentiation in K562 cells[7,15,32,33]. Transcriptomic analysis and proteomic analysis contributed to high-throughput data for HQ-induced DEGs and DEPs in K562 cells. According to GO analysis results, there were a total of 23 DEGs and 5 DEPs in erythroid differentiation-related pathways (Table 3). In the positive regulation of erythrocyte differentiation term, HSPA1A, HSPA1B, PRMT1, and STAT1 were considerably upregulated, meanwhile, ARNT, STAT3, NCKAP1L, STAT5B, and TRIM58 were downregulated. In the primitive erythrocyte differentiation term, VEGFA was significantly downregulated. In the enucleate erythrocyte development term, MAEA and LYAR were considerably upregulated, while DMTN, CITED2, BCL6, and LYAR were considerably downregulated. In the erythrocyte differentiation term, KIT, EPAS1, CASP3, and HSPA9 were significantly upregulated, while ALAS2, THRA, DNASE2, INHA, and SPI1 were significantly downregulated. In the erythrocyte maturation, HBAZ and G6PD were considerably upregulated, while ERCC2 was considerably downregulated. These results confirmed that HQ exposure might contribute to these genes and protein expression changes, affecting erythroid differentiation and maturation.
Table 3. GO analysis of DEGs and DEPs in erythrocyte differentiation-related pathways
Type Name Description C HQ Log2 (HQ/C) P-value GO:0045648 positive regulation of erythrocyte differentiation DEG HSPA1A Heat shock 70 kDa protein 1A 2380.07 3525.29 0.57 3.62 × 10⁻⁴ DEG HSPA1B Heat shock 70 kDa protein 1B 1456.71 2047.15 0.49 2.13 × 10⁻⁴ DEG PRMT1 Protein arginine N-methyltransferase 1 7636.53 10241.65 0.42 2.76 × 10⁻³ DEG ARNT Aryl hydrocarbon receptor nuclear translocator 1239.05 994.57 −0.32 4.42 × 10⁻² DEG STAT3 Signal transducer and activator of transcription 3 7816.59 6107.88 −0.36 8.66 × 10⁻³ DEG NCKAP1L Nck-associated protein 1-like 1588.34 1216.83 −0.38 7.45 × 10⁻³ DEG STAT5B Signal transducer and activator of transcription 5B 7772.78 5916.55 −0.39 2.66 × 10⁻³ DEG TRIM58 E3 ubiquitin-protein ligase TRIM58 1235.03 853.23 −0.53 1.17 × 10⁻⁴ DEP STAT1 Signal transducer and activator of transcription 1 786.12 892.10 0.18 1.95 × 10⁻² GO:0060319 primitive erythrocyte differentiation DEG VEGFA Vascular endothelial growth factor A 6792.45 3236.41 −1.07 5.22 × 10⁻²¹ GO:0048822 enucleate erythrocyte development DEG MAEA E3 ubiquitin-protein transferase MAEA 2162.55 2704.36 0.32 2.68 × 10⁻² DEG LYAR Cell growth-regulating nucleolar protein 753.96 1335.92 0.83 1.24 × 10⁻¹⁰ DEG DMTN Dematin 5445.88 4230.23 −0.36 2.88 × 10⁻² DEG CITED2 Cbp/p300-interacting transactivator 2 8346.68 5983.22 −0.48 1.55 × 10⁻⁴ DEG BCL6 B-cell lymphoma 6 protein 164.91 78.64 −1.07 5.25 × 10⁻⁷ DEP LYAR Cell growth-regulating nucleolar protein 785.46 538.76 −0.54 3.79 × 10⁻² GO:0030218 erythrocyte differentiation DEG KIT Mast/stem cell growth factor receptor 205.96 370.51 0.85 2.74 × 10⁻⁷ DEG EPAS1 Endothelial PAS domain-containing protein 1 222.64 334.54 0.59 1.03 × 10⁻³ DEG CASP3 Caspase-3 378.35 560.44 0.57 4.95 × 10⁻² DEG HSPA9 Stress-70 protein, mitochondrial 3536.24 4928.96 0.48 1.12 × 10⁻³ DEG ALAS2 5-aminolevulinate synthase, erythroid-specific, mitochondrial 2661.41 2008.50 −0.41 3.33 × 10⁻³ DEG THRA Thyroid hormone receptor alpha 2398.39 1705.39 −0.49 2.22 × 10⁻⁴ DEG DNASE2 Deoxyribonuclease 2, lysosomal 377.89 259.76 −0.54 1.96 × 10⁻³ DEG INHA Inhibin alpha chain 589.45 305.50 −0.95 2.95 × 10⁻¹⁰ DEG SPI1 Transcription factor PU.1 1375.22 661.69 −1.06 2.33 × 10⁻⁹ GO:0043249 erythrocyte maturation DEP HBAZ Hemoglobin subunit zeta 1570.60 1893.60 0.27 1.14 × 10⁻² DEP G6PD Glucose-6-phosphate 1-dehydrogenase 1965.05 3121.64 0.67 4.39 × 10⁻³ DEP ERCC2 ERCC excision repair 2, TFIIH core complex helicase subunit 363.34 311.97 −0.22 1.42 × 10⁻³ Note. GO, Gene Ontology; DEGs, differentially expressed genes; DEPs, differentially expressed proteins; HQ, hydroquinone-induced K562 cells; C, the controlgroup. -
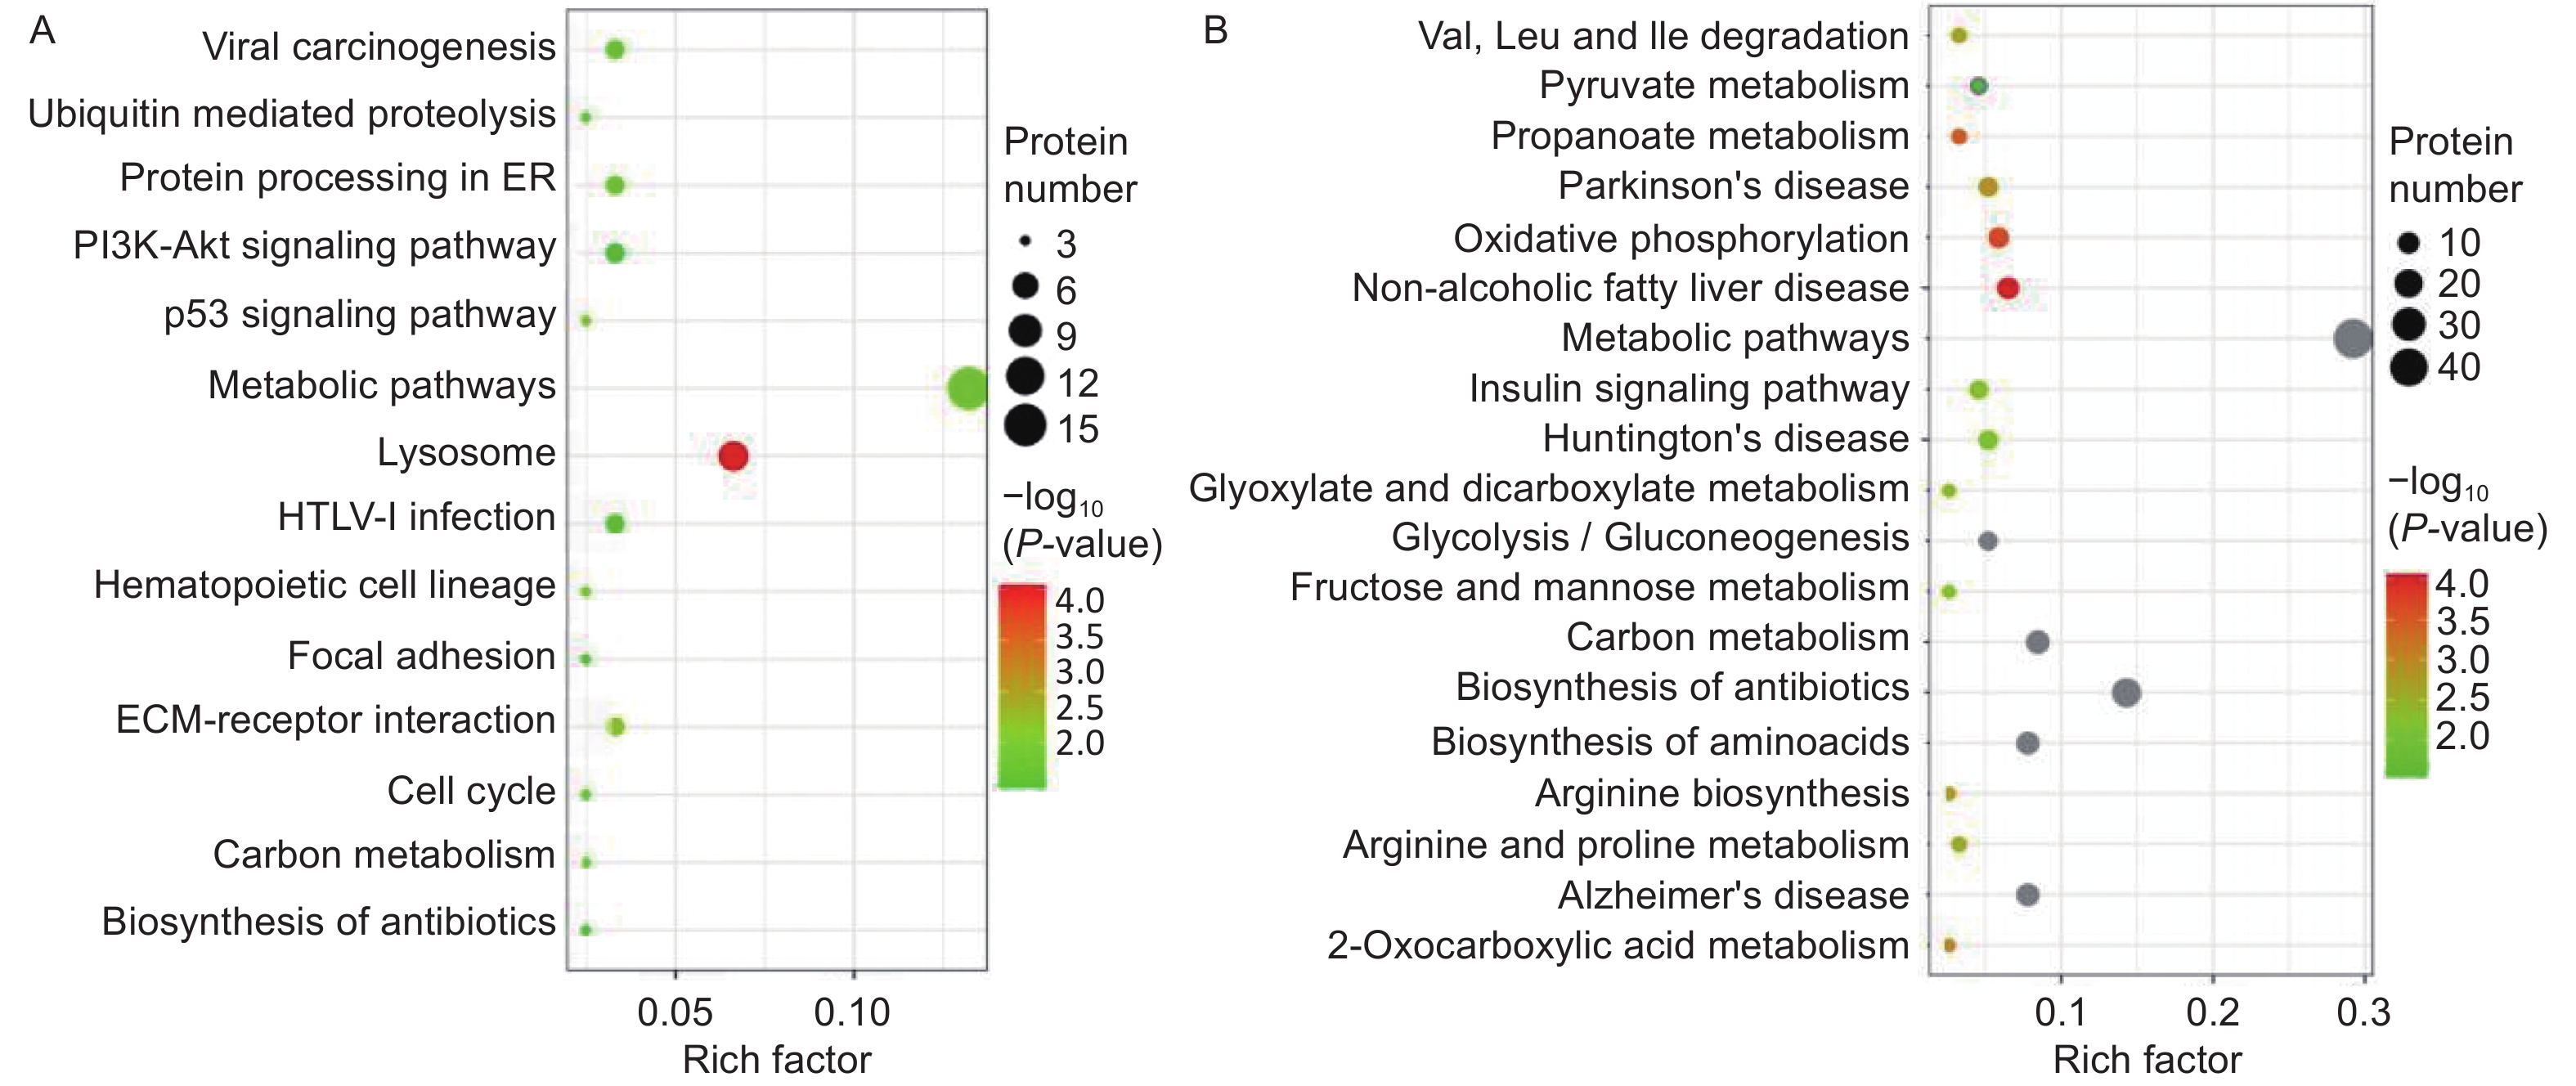
A Kyoto Encyclopedia of Genes and Genomes (KEGG) pathway-based functional enrichment analysis was performed to determine the pathways associated with HQ-induced DEPs. The HQ-upregulated DEPs were annotated with 162 KEGG pathway map identifiers and the downregulated DEPs included 169 KEGG pathway identifiers. The top 14 enriched pathways of upregulated DEPs and the top 19 enriched pathways of downregulated DEPs were shown in Figure 3. KEGG pathway analysis demonstrated that HQ-upregulated DEPs were the most significantly enriched in the lysosome (hsa04142), followed by metabolic pathways (hsa01100), cell cycle (hsa04110), and cellular senescence (hsa04218) (Figure 3A). In addition, the HQ-downregulated DEPs were the most significantly enriched in metabolic pathways, followed by biosynthesis of amino acids (hsa01230), alzheimer disease (hsa05010), and thermogenesis (hsa04714) (Figure 3B).
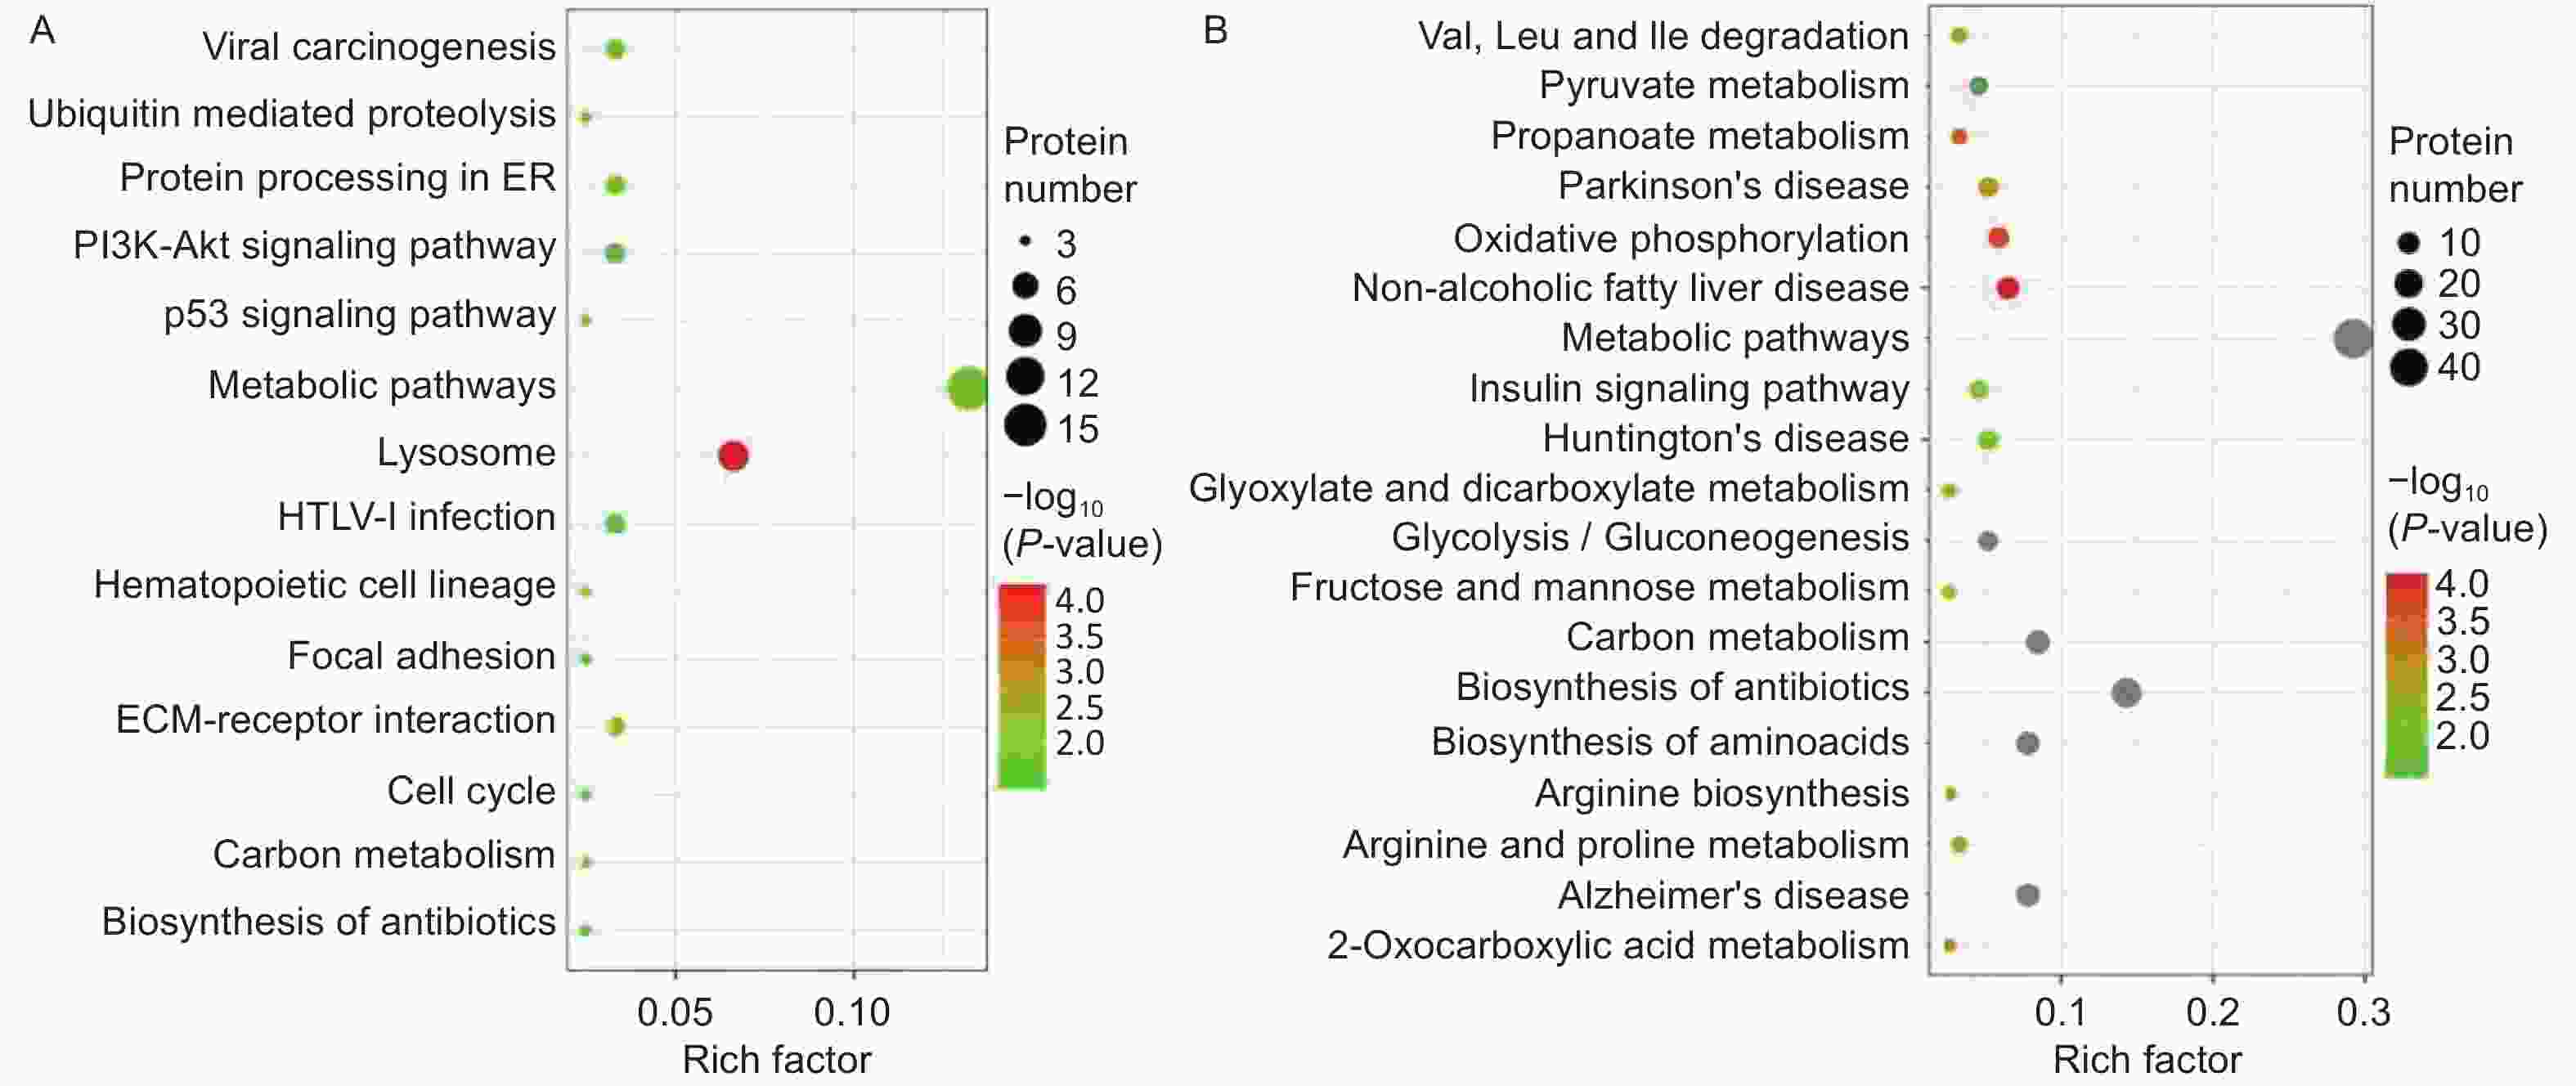
Figure 3. KEGG analysis for DEPs in HQ-induced K562 cells. (A) KEGG pathway enrichment analysis of upregulated DEPs. (B) KEGG pathway enrichment analysis of downregulated DEPs. Rich factor indicates the annotated DEPs number and whole background genes number ratio in the corresponding pathway. The size of each bubble corresponds to the number of annotated DEPs and the color gradient depicts the P-value of enrichment significance. KEGG, Kyoto Encyclopedia of Genes and Genomes; DEPs, differentially expressed proteins; HQ, hydroquinone.
Focusing on potential mechanisms of HQ-induced hematotoxicity revealed in previous research[14-16], there were 3, 6, 5, 4, and 4 DEPs annotated as the KEGG terms of cell cycle, cellular senescence, apoptosis, autophagy–animal, and necroptosis (Table 4). KEGG pathway analysis also showed the potentially related signaling pathways such as mTOR, p53, PI3K-Akt, MAPK, and AMPK signaling pathways (Supplementary Table S1 available in www.besjournal.com). Meanwhile, biological processes like ECM-receptor interaction, protein processing in the endoplasmic reticulum, hematopoietic cell lineage, and nucleotide excision repair were revealed (Supplementary Table S2, available in www.besjournal.com). Input DEPs of these pathways were illustrated in Supplementary Table S3, available in www.besjournal.com. These results suggested that HQ-induced hematotoxicity might be achieved by modulating the expression of these DEPs to affect related pathways.
Table 4. KEGG pathway analysis of DEPs in potential mechanisms of HQ-induced hematotoxicity
KEGG term ID Input number Background number Regulated DEPs Cellular senescence hsa04218 5 160 up SIRT1, NFATC2, CDK4, CAPN2, CHEK1 1 160 down RBBP4 Apoptosis hsa04210 4 136 up SPTAN1, CTSB, CTSD, CAPN2 1 136 down BID Autophagy - animal hsa04140 3 128 up CTSB, CTSD, LAMP2 1 128 down RPS6KB2 Necroptosis hsa04217 2 162 up CHMP4A, CAPN2 2 162 down BID, GLUL Cell cycle hsa04110 3 124 up BUB1B, CDK4, CHEK1 Note. KEGG, Kyoto Encyclopedia of Genes and Genomes; DEPs, differentially expressed proteins; HQ, hydroquinone. -
Focusing on the erythroid differentiation-related pathways in the GO analysis results, the network of the 27 differently expressed proteins and differently expressed genes-related proteins were analyzed using STRING with a medium confidence score threshold of 0.4. After kmeans-clustering these proteins into four categories, an interactome network was built to find out protein-protein interaction and predict functional associations among these significantly altered proteins (Figure 4). By analyzing the predicted protein networks, we determined six differentially expressed genes with the most interactions and they were STAT1, STAT3, CASP3, KIT, STAT5B, and VEGFA. STATs, named signal transducer and transcription activator, were identified as critical transcription factors in mediating virtually all cytokine-driven signaling and are thought to involve in various aspects of hematopoiesis, affecting cell proliferation, differentiation, and cell survival, meaning the dysregulation[34-36]. As shown in the networks, the differential expressions of STAT1, STAT3, and STAT5B significantly impact the entire protein interaction network in HQ-induced K562 cells, which means the dysregulation of these proteins highly demands our attention.
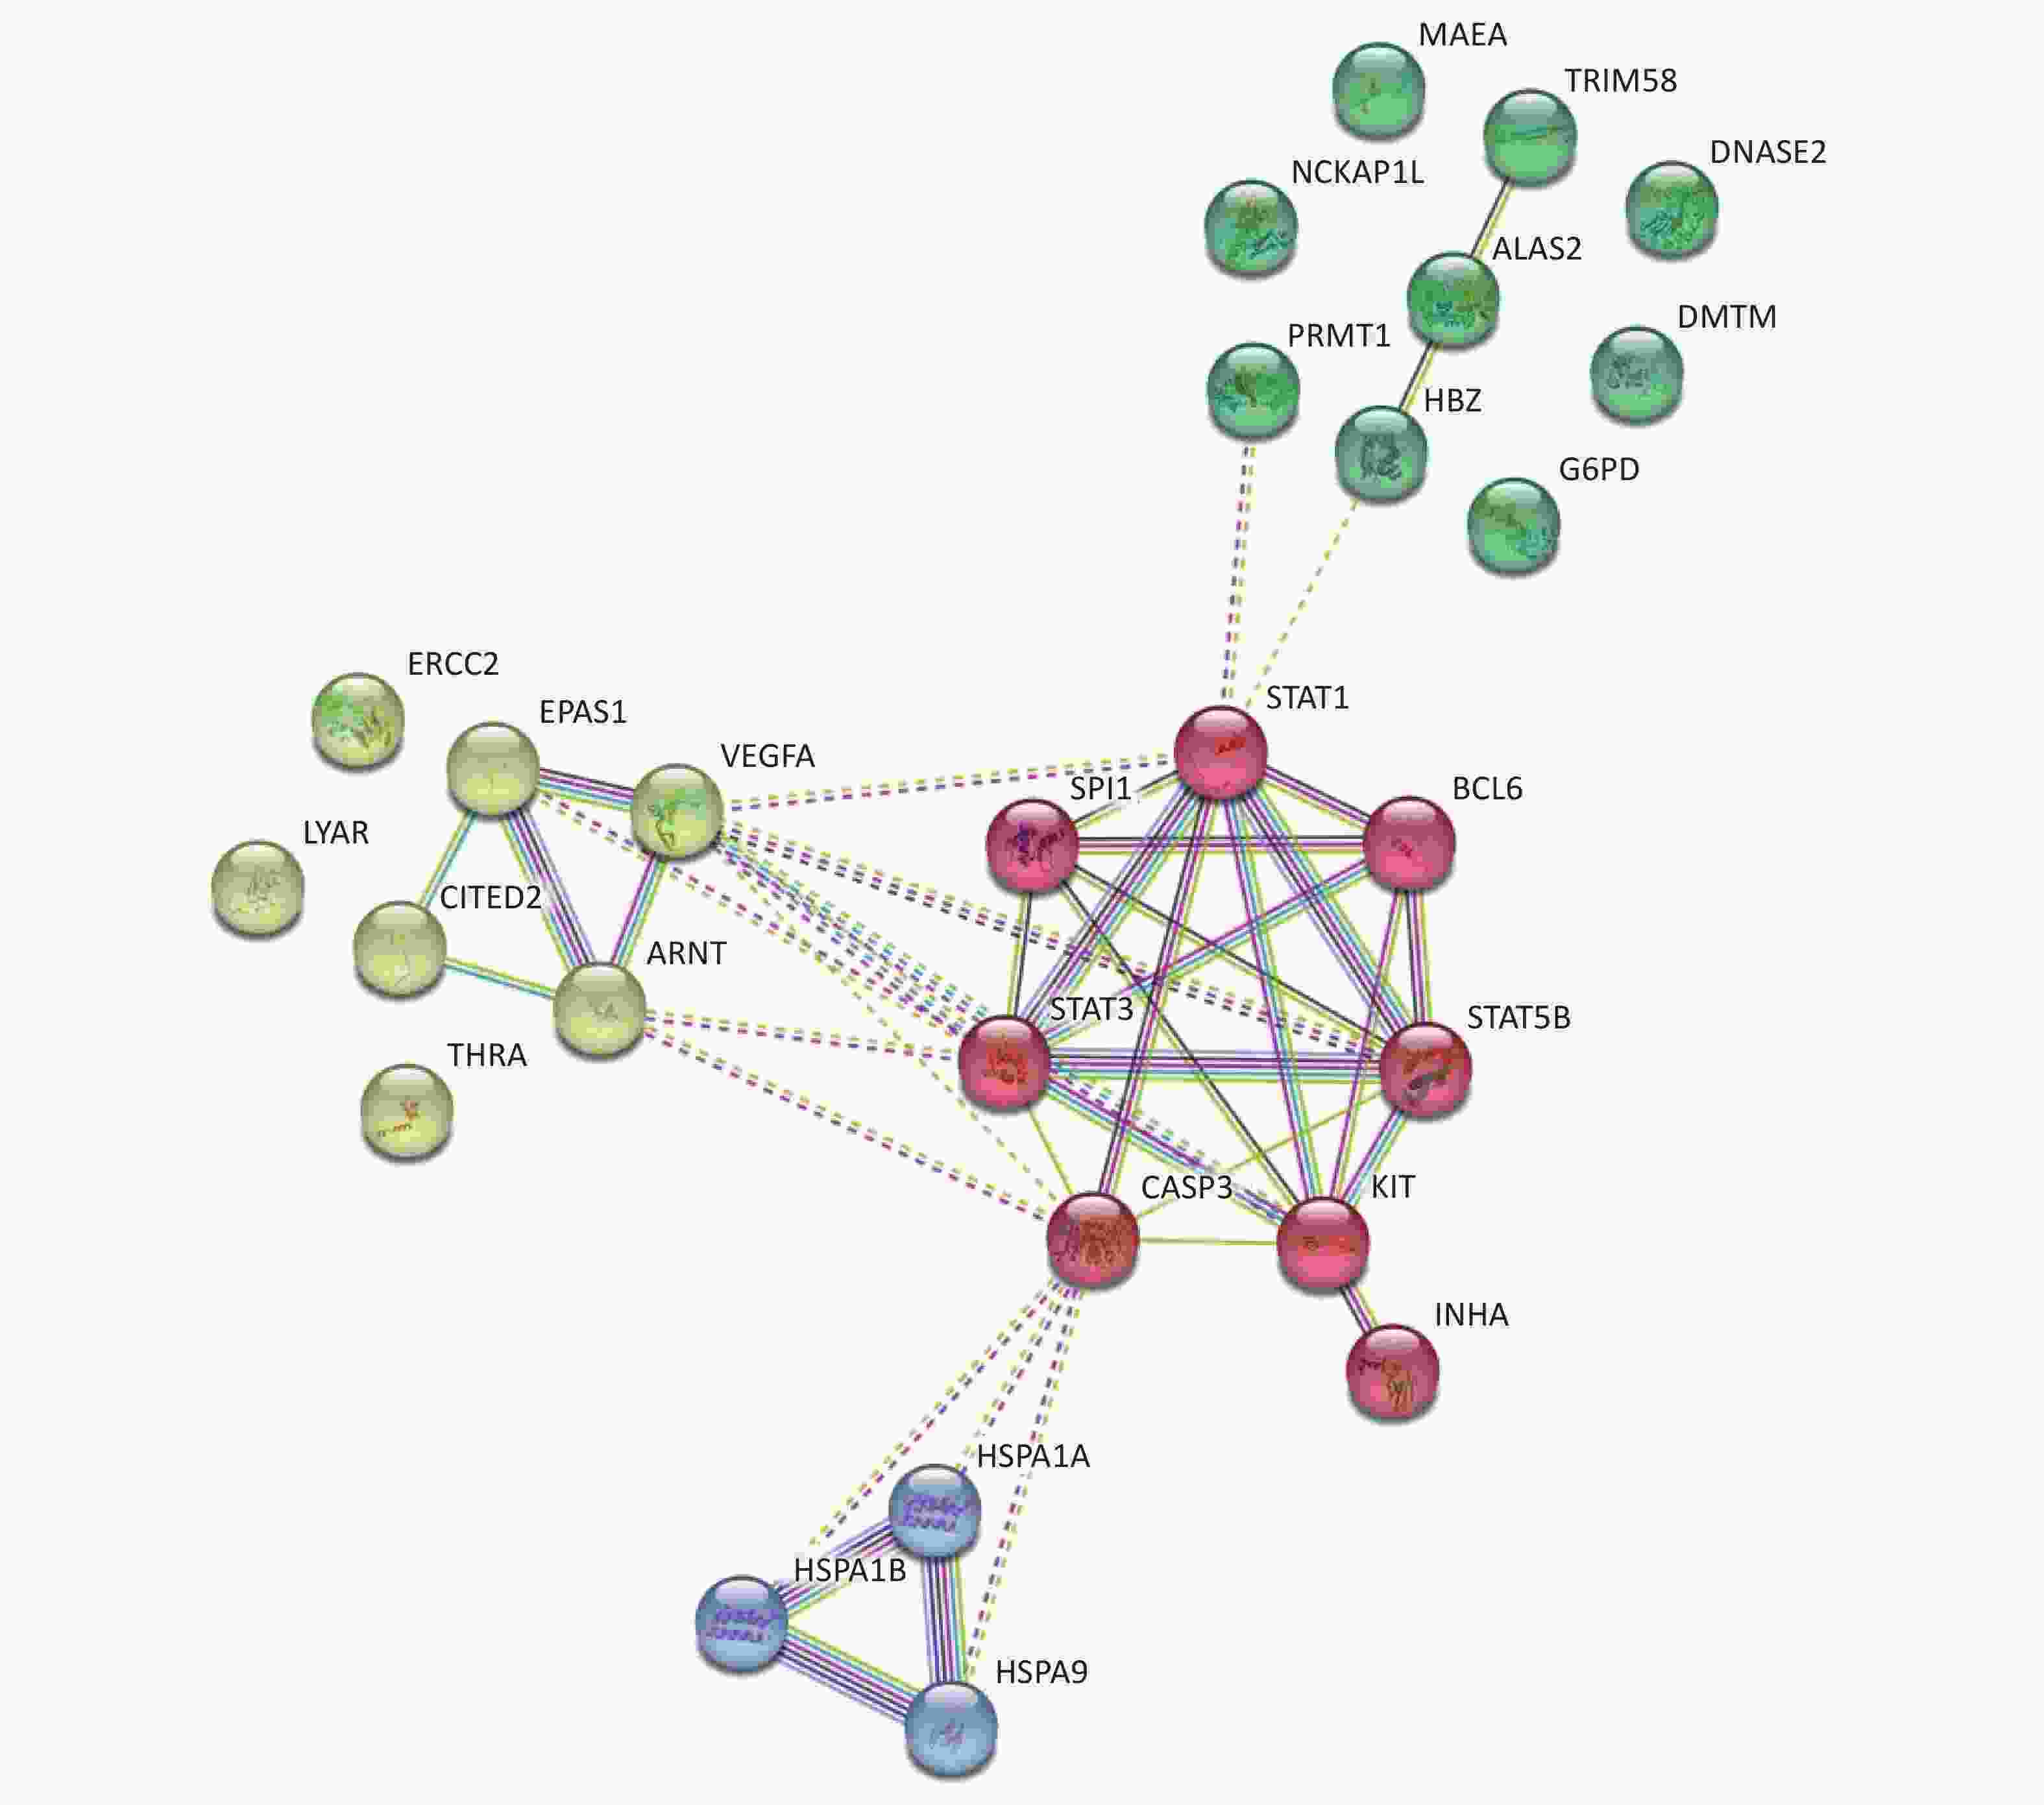
Figure 4. Predicted protein networks associated with the proteins upregulated or downregulated in HQ-exposed K562 cells. Cytoscape networks were constructed using 27 DEPs in erythroid differentiation-related pathways. Four bubbles in different colors indicate four clusters. DEPs, differentially expressed proteins; HQ, hydroquinone.
-
Proteomics is the study of information about all the proteins expressed in an organism at a specific time and place, including the structure, location, and quantities[19,21,23]. Based on the bioinformatics database and bioinformatics analysis, we can further analyze the interaction relationship between DEPs and the signaling pathways and biological processes they affect. Compared with traditional genomics and transcriptomics analysis, proteomics can help us elucidate environmental pollutants’ toxicological mechanisms more clearly and find the biomarkers more directly and precisely.
In this study, on comparing the HQ-induced and control K562 cells, 466 differentially expressed proteins were screened out, of which 187 proteins were upregulated and 279 were downregulated. In our study, Excision repair cross-complementation group 1 (ERCC1), which forms heterodimers with the XPF endonuclease participating in nucleotide excision repair (NER) and genomic instability[37,38], was the most upregulated DEP. Myelodysplastic syndromes (MDS) are characterized by ineffective hemopoiesis leading to blood cytopenias[39]. Previous research implied that ERCC1 promotes the aging process of erythroid cells and the induced ERCC1 expression might reflect the premature aging of the MDS-derived erythroid precursors[40]. Our result enhanced this discovery and showed that the role of ERCC1 and DNA damage repair in HQ-induced hematotoxicity needs further study.
Following the GO classification of DEPs, the HQ upregulated and downregulated DEPs were annotated with GO annotations including neutrophil-mediated immunity, blood microparticle, ribonucleotide metabolic process, cellular amino acid metabolic process, electron transfer activity, and so on, which were associated with the occurrence of hematotoxicity. Since HQ-induced increase in intracellular ROS levels has been shown to be associated with erythroid differentiation and apoptosis in HL-60 promyelocytic leukemia cells, Jurkat T-lymphoblastic leukemia cells, JHP lymphoblastoid cells and K562 cells[12,15,16,41,42], we focused on the GO term of oxidative stress and found there were 9 upregulated DEPs (ERCC1, AGAP3, SIRT1, G6PD, HSPB1, TOR1A, SOD2, CAPN2, NUDT1) and 7 downregulated DEPs (NDUFS8, PRDX2, NDUFS2, OXSR1, ADPRHL2, LDHA, PYCR1) in the response to oxidative stress term (GO:0006979), further indicating the essential roles of HQ-induced oxidative stress in K562 cells. Focusing on cell apoptotic, there were 5 upregulated DEPs (CD44, TAF9, SIRT1, HSPB1, SOD2) in the intrinsic apoptotic signaling pathway term (GO:0097193), 6 upregulated DEPs (CD44, TAF9, SIRT1, GSN, HSPB1, SOD2) in the regulation of apoptotic signaling pathway term (GO:2001233) and 4 downregulated DEPs (HK2, NDUFS1, BID, TIMM50) in the apoptotic mitochondrial changes term (GO:0008637). These results confirmed the HQ-induced apoptotic in K562 cells, human TK6 lymphoblastoid cells, human ARPE-19 retinal pigment epithelial cells, and so on described in previous literature[14-16,43,44], and revealed several potentially related downstream proteins.
Besides HQ-induced oxidative stress and apoptotic, we used KEGG pathway annotations and analysis to find that HQ-upregulated DEPs were the most significantly enriched in the lysosome, metabolic pathways, cell cycle, and cellular senescence. Previously, we found that HQ could induce a significant increase in cell population in the G0/G1 phase and a significant decrease in the S phase[16]. In recent years, it was reported that HQ increased the expressions of E4 transcription factor 1 (E4F1) mRNA and protein in HQ-induced malignant transformed TK6 cells (TK6-HT), and silencing E4F1 could block the G2/M phase of the cell cycle, inhibiting the progress of cell cycle and cell growth[8]. The results of our research and analysis were consistent with these previous findings and elucidated the relevant pathways and specific mechanisms.
In addition, most DEPs were annotated as the metabolic pathways map identifier and played important roles in multiple signaling pathways and various biological processes. Among them, the upregulated CDK4 was annotated as an important participant in the p53 and PI3K-Akt signaling pathway, modulating cellular process and life course including cell cycle and cellular senescence. The uncontrolled proliferation of immature myeloid cells is often associated with cell cycle dysregulation, which might inhibit cell differentiation processes[45,46]. Cyclin-dependent kinases (CDKs) take an important part in cell cycle control, among which CDK4 mediates progression through the G1 metaphase in conjunction with D-type cyclins[47,48]. Therefore, the mutation and abnormal expression of CDK4 have important effects on hematotoxicity and disease progression, meanwhile, researchers are committed to developing CDK4-targeted treatment strategies[47,49].
To further explore the mechanism of HQ-induced hematotoxicity, we focused on the 23 DEGs and 5 DEPs in erythroid differentiation-related pathways in the GO analysis results and constructed the network of protein interactions in K562 cells. We determined 6 DEPs with the most interactions, which were STAT1, STAT3, CASP3, KIT, STAT5B, and VEGFA, and the differential expressions of STAT1, STAT3, and STAT5B make a central impact. Hematopoietic development is highly dependent on cytokine/receptor-initiated signaling pathways[50]. The activation of STATs mediates cellular signal transduction initiated by cytokines and growth factors with cognate receptors, especially the Janus kinase (JAK)-STAT pathway plays important roles in hematopoiesis by affecting the production of mature hematopoietic cells via effects on cellular proliferation, survival, and lineage-specific differentiation[51-53]. STAT1 is a pivotal downstream mediator of interferon (IFN) signaling required for IFN-induced hematopoietic stem cells (HSCs) proliferation[54]. The phosphorylated STAT1 enhanced secretion of TRAIL to induce cell apoptotic in KMS-20 cells through JAK/STAT pathway activation[55], while recent research showed that STAT1 is also critical for hematopoietic stem and progenitor cells (HSPCs) homeostasis maintenance by regulating HSCs self-renewal and intrinsic functions[56]. STAT3 is also an important gene expression regulator in the cell cycle, antiapoptosis, angiogenesis, and invasion/migration[52]. It not only promotes the development of B and T cell subsets but also regulates neutrophil numbers and hematopoietic stem cell self-renewal[57]. Thus STAT3 has been identified as a therapeutic target for a wide range of diseases[52,57,58]. In addition to STAT1 and STAT3, STAT5 also regulates cell proliferation, differentiation, and survival critically[59]. STAT5 deletion can cause significant development defects in both lymphoid and myeloid lineages, and STAT5 is indispensable at later stages for normal granulopoiesis by mechanisms like regulating proliferation and survival genes to direct Granulocyte macrophage-colony stimulating factor (GM-CSF) signaling[60,61]. Therefore, HQ regulates the expression of these DEGs and DEPs associated with hematopoietic cell development, maturation, and differentiation to affect the production of mature erythrocytes and other blood cells with normal physiological functions. Further elucidation of the functions, interactions, and signal transduction involved in them will help us understand HQ-induced hematotoxicity.
-
In summary, this study demonstrated that the benzene metabolite HQ induced various protein expression changes in K562 cells, directly affecting intracellular signaling pathways and metabolic activities and consequently leading to hematotoxicity. Our study showed that STATs may be potential biomarkers of HQ-induced hematotoxicity and deserve attention. The DEP-associated changes shown in this article will shed light on future in-depth studies of the underlying mechanisms of HQ-induced hematotoxicity. Focusing on critical DEPs identified, more research can be carried out to find the intrinsic relationship between DEPs and other HQ-induced changes, such as DNA methylation, ROS increase, miRNAs expression changes, and histone modification. Further research and validation at the molecular level are needed to investigate these DEPs and their associated potential mechanisms. Coupled with cross-omics analysis and animal model studies, the mechanism of HQ-induced hematotoxicity will be presented more clearly and completely.
-
Table S1. KEGG pathway analysis of DEPs in potentially related signaling pathways
KEGG term ID Input number Background number Regulated DEPs PI3K-Akt signaling pathway hsa04151 4 354 up ITGA2B, PKN2, CDK4, VTN 2 354 down GRB2, RPS6KB2 p53 signaling pathway hsa04115 3 72 up CDK4, RRM2, CHEK1 1 72 down BID MAPK signaling pathway hsa04010 2 295 up PPM1B, HSPB1 2 295 down GRB2, CRKL AMPK signaling pathway hsa04152 1 120 up SIRT1 3 120 down ACACA, PFKFB4, RPS6KB2 mTOR signaling pathway hsa04150 3 153 down GRB2, TTI1, RPS6KB2 cAMP signaling pathway hsa04024 1 214 up ATP1A1 2 214 down ATP2B4, ATP2A3 NOD-like receptor signaling pathway hsa04621 2 178 up CTSB, TRPV2 Chemokine signaling pathway hsa04062 2 190 down GRB2, CRKL FoxO signaling pathway hsa04068 1 132 up SIRT1 1 132 down GRB2 Wnt signaling pathway hsa04310 1 160 up NFATC2 1 160 down CACYBP JAK-STAT signaling pathway hsa04630 1 162 down GRB2 TGF-beta signaling pathway hsa04350 1 94 down RPS6KB2 Table S2. KEGG pathway analysis of DEPs in potentially related biological process
KEGG term ID Input number Background number Regulated DEPs MicroRNAs in cancer hsa05206 2 299 up CD44, SIRT1 3 299 down PDCD4, GRB2, CRKL ECM-receptor interaction hsa04512 4 86 up CD44, VTN, GP1BB, ITGA2B Protein processing in endoplasmic reticulum hsa04141 4 165 up STUB1, SVIP, DNAJC1, CAPN2 Hematopoietic cell lineage hsa04640 3 97 up CD44, GP1BB, ITGA2B Fanconi anemia pathway hsa03460 1 54 up ERCC1 Ferroptosis hsa04216 1 40 up ACSL1 Nucleotide excision repair hsa03420 1 47 up ERCC1 Chemical carcinogenesis hsa05204 1 82 up AKR1C2 Table S3. Input DEPs of hematotoxicity-related KEGG pathway in HQ-induced K562 cells
KEGG ID Protein name Description Log2 (HQ/C) P-value hsa2067 ERCC1 ERCC excision repair 1, endonuclease non-catalytic subunit 3.27 0.02 hsa2812 GP1BB glycoprotein Ib platelet beta subunit 2.16 0.03 hsa5586 PKN2 protein kinase N2 1.88 0.01 hsa7448 VTN vitronectin 1.71 0.01 hsa29082 CHMP4A charged multivesicular body protein 4A 1.16 0.02 hsa960 CD44 CD44 molecule (Indian blood group) 1.13 0.01 hsa1646 AKR1C2 aldo-keto reductase family 1 member C2 1.11 0.00 hsa1111 CHEK1 checkpoint kinase 1 0.94 0.03 hsa3674 ITGA2B integrin subunit alpha 2b 0.80 0.02 hsa6241 RRM2 ribonucleotide reductase regulatory subunit M2 0.74 0.04 hsa1509 CTSD cathepsin D 0.73 0.00 hsa51393 TRPV2 transient receptor potential cation channel subfamily V member 2 0.72 0.04 hsa476 ATP1A1 ATPase Na+/K+ transporting subunit alpha 1 0.72 0.01 hsa23411 SIRT1 sirtuin 1 0.72 0.04 hsa1508 CTSB cathepsin B 0.65 0.00 hsa1019 CDK4 cyclin dependent kinase 4 0.63 0.01 hsa5495 PPM1B protein phosphatase, Mg2+/Mn2+ dependent 1B 0.59 0.01 hsa3315 HSPB1 heat shock protein family B (small) member 1 0.58 0.03 hsa4773 NFATC2 nuclear factor of activated T-cells 2 0.58 0.04 hsa64215 DNAJC1 DnaJ heat shock protein family (Hsp40) member C1 0.56 0.01 hsa701 BUB1B BUB1 mitotic checkpoint serine/threonine kinase B 0.52 0.02 hsa10273 STUB1 STIP1 homology and U-box containing protein 1 0.48 0.01 hsa2180 ACSL1 acyl-CoA synthetase long-chain family member 1 0.48 0.04 hsa258010 SVIP small VCP interacting protein 0.47 0.03 hsa824 CAPN2 calpain 2 0.44 0.02 hsa3920 LAMP2 lysosomal associated membrane protein 2 0.44 0.04 hsa6709 SPTAN1 spectrin alpha, non-erythrocytic 1 0.41 0.03 hsa31 ACACA acetyl-CoA carboxylase alpha −0.38 0.02 hsa489 ATP2A3 ATPase sarcoplasmic/endoplasmic reticulum Ca2+ transporting 3 −0.39 0.00 hsa27101 CACYBP calcyclin binding protein −0.40 0.04 hsa2885 GRB2 growth factor receptor bound protein 2 −0.44 0.03 hsa5928 RBBP4 RB binding protein 4, chromatin remodeling factor −0.47 0.03 hsa1399 CRKL CRK like proto-oncogene, adaptor protein −0.48 0.03 hsa493 ATP2B4 ATPase plasma membrane Ca2+ transporting 4 −0.51 0.01 hsa2752 GLUL glutamate-ammonia ligase −0.60 0.02 hsa637 BID BH3 interacting domain death agonist −0.64 0.04 hsa6199 RPS6KB2 ribosomal protein S6 kinase B2 −0.81 0.01 hsa27250 PDCD4 programmed cell death 4 −0.88 0.01 hsa9675 TTI1 TELO2 interacting protein 1 −1.14 0.04 hsa5210 PFKFB4 6-phosphofructo-2-kinase/fructose-2,6-biphosphatase 4 −1.85 0.02
doi: 10.3967/bes2024.039
Proteomics Study of Benzene Metabolite Hydroquinone Induced Hematotoxicity in K562 Cells
-
Abstract:
Objective Hydroquinone (HQ), one of the phenolic metabolites of benzene, is widely recognized as an important participant in benzene-induced hematotoxicity. However, there are few relevant proteomics in HQ-induced hematotoxicity and the mechanism hasn’t been fully understood yet. Methods In this study, we treated K562 cells with 40 μmol/L HQ for 72 h, examined and validated protein expression changes by Label-free proteomic analysis and Parallel reaction monitoring (PRM), and performed bioinformatics analysis to identify interaction networks. Results One hundred and eighty-seven upregulated differentially expressed proteins (DEPs) and 279 downregulated DEPs were identified in HQ-exposed K562 cells, which were involved in neutrophil-mediated immunity, blood microparticle, and other GO terms, as well as the lysosome, metabolic, cell cycle, and cellular senescence-related pathways. Focusing on the 23 DEGs and 5 DEPs in erythroid differentiation-related pathways, we constructed the network of protein interactions and determined 6 DEPs (STAT1, STAT3, CASP3, KIT, STAT5B, and VEGFA) as main hub proteins with the most interactions, among which STATs made a central impact and may be potential biomarkers of HQ-induced hematotoxicity. Conclusion Our work reinforced the use of proteomics and bioinformatic approaches to advance knowledge on molecular mechanisms of HQ-induced hematotoxicity at the protein level and provide a valuable basis for further clarification. -
Key words:
- Hydroquinone /
- Proteomics /
- Hematotoxicity /
- K562 cells
The authors declare that they have no conflict of interest.
&These authors contributed equally to this work.
注释:1) AUTHORS’ CONTRIBUTIONS: 2) COMPETING INTERESTS: -
Figure 1. DEPs in HQ-induced K562 cells. K562 cells were induced with 0 and 40 μmol/L HQ for 72 h. The label-free proteomic assay was applied to analyze the DEPs in HQ-induced K562 cells. The volcano plot displays the differences in protein abundance detected between HQ and C groups. Each point represents one of the detected genes. Green points are downregulated DEPs, red points are upregulated DEPs and blue points are proteins without significant changes in HQ-induced K562 cells. Horizontal dotted lines indicate statistical thresholds for a P-value < 0.05 calculated using a two-tailed t-test. Data are representative of three independent experiments. HQ, hydroquinone-induced K562 cells; C, the control group; DEPs, differentially expressed proteins.
Figure 2. GO analysis of DEPs in HQ-induced K562 cells. (A) GO enrichment histogram of upregulated DEPs. (B) GO enrichment histogram of downregulated DEPs. GO, Gene Ontology; DEPs, differentially expressed proteins; HQ, hydroquinone.
Figure 3. KEGG analysis for DEPs in HQ-induced K562 cells. (A) KEGG pathway enrichment analysis of upregulated DEPs. (B) KEGG pathway enrichment analysis of downregulated DEPs. Rich factor indicates the annotated DEPs number and whole background genes number ratio in the corresponding pathway. The size of each bubble corresponds to the number of annotated DEPs and the color gradient depicts the P-value of enrichment significance. KEGG, Kyoto Encyclopedia of Genes and Genomes; DEPs, differentially expressed proteins; HQ, hydroquinone.
Figure 4. Predicted protein networks associated with the proteins upregulated or downregulated in HQ-exposed K562 cells. Cytoscape networks were constructed using 27 DEPs in erythroid differentiation-related pathways. Four bubbles in different colors indicate four clusters. DEPs, differentially expressed proteins; HQ, hydroquinone.
Table 1. Top 10 upregulated or downregulated DEPs in HQ-induced K562 cells
Accession Protein name Description Log2 (HQ/C) P-value P07992 ERCC1 ERCC excision repair 1, endonuclease non-catalytic subunit 3.27 0.02 P28799 GRN granulin precursor 2.48 0.02 P13224 GP1BB glycoprotein Ib platelet beta subunit 2.16 0.03 Q86YT6 MIB1 Mind bomb E3 ubiquitin protein ligase 1 2.05 0.04 Q96HR8 NAF1 nuclear assembly factor 1 ribonucleoprotein 1.92 0.01 Q16513 PKN2 protein kinase N2 1.88 0.01 P04004 VTN vitronectin 1.71 0.01 Q96EK4 THAP11 THAP domain containing 11 1.67 0.05 Q04828 AKR1C1 Aldo-keto reductase family 1 member C1 1.53 0.04 P04003 C4BPA complement component 4 binding protein alpha 1.51 0.04 Q16850 CYP51A1 cytochrome P450 family 51 subfamilies A member 1 −1.48 0.01 Q9UDW1 UQCR10 ubiquinol-cytochrome c reductase, complex III subunit X −1.52 0.00 P09972 ALDOC aldolase, fructose-bisphosphate C −1.58 0.03 Q86UE8 TLK2 tousled like kinase 2 −1.64 0.04 Q6GMV3 PTRHD1 peptidyl-tRNA hydrolase domain containing 1 −1.83 0.03 Q16877 PFKFB4 6-phosphofructo-2-kinase/fructose-2,6-biphosphatase 4 −1.85 0.02 A8MPS7 YDJC YdjC homolog (bacterial) −1.90 0.01 P62736 ACTA2 actin, alpha 2, smooth muscle, aorta −2.20 0.05 P16083 NQO2 NAD(P)H quinone dehydrogenase 2 −2.24 0.02 P13164 IFITM1 interferon induced transmembrane protein 1 −3.83 0.03 Note. HQ, hydroquinone; DEPs, differentially expressed proteins.  下载: 导出CSV
Table 2. Comparison of DEPs identified by PRO and PRM in HQ-induced K562 cells
Accession Protein name Description PRO Log2 (HQ/C) PRM Log2 (HQ/C) Erythroid differentiation P16070 CD44 CD44 molecule (Indian blood group) 1.13 1.02 Q16610 ECM1 extracellular matrix protein 1 1.32 0.82 P09105 HBAT hemoglobin subunit theta−1 0.71 0.79 P08514 ITA2B integrin alpha-IIb 0.80 0.75 Q9NXE8 CWC25 CWC25 spliceosome associated protein homolog 0.63 0.65 P02100 HBE hemoglobin subunit epsilon 0.48 0.60 P15976 GATA1 GATA binding protein 1; erythroid transcription factor 0.04 0.39 P02008 HBAZ hemoglobin subunit zeta 0.27 0.36 P69905 HBA hemoglobin subunit alpha 0.19 0.17 P69892 HBG2 hemoglobin subunit gamma-2 −0.58 −0.31 P21127 CD11B cyclin-dependent kinase 11B −0.18 −0.03 Cell cycle and cell apoptosis P11802 CDK4 cyclin-dependent kinase 4 0.63 1.08 O14920 IKKB inhibitor of nuclear factor kappa-B kinase subunit beta −0.36 −0.26 Q13158 FADD FAS-associated death domain protein −0.52 −0.32 DNA methylation and histone modification Q15629 TRAM1 translocation chain-associated membrane protein 1 0.36 0.62 Q8TAT6 NPL4 nuclear protein localization protein 4 homolog 0.24 0.47 P26358 DNMT1 DNA (cytosine-5)-methyltransferase 1 0.12 0.45 O14929 HAT1 histone acetyltransferase type B catalytic subunit 0.22 0.15 P0C0S5 H2AZ H2A.Z variant histone −0.72 −0.15 O60341 KDM1A lysine-specific histone demethylase 1A −0.43 −0.18 Q92769 HDAC2 histone deacetylase 2 −0.46 −0.20 O75367 H2AY core histone macro-H2A.1 −0.25 −0.39 P16403 H12 histone H1.2 −0.46 −0.42 P68431 H31 histone H3.1 −0.89 −1.29 Q71DI3 H32 histone H3.2 −1.10 −1.75 Signaling pathways P01137 TGFB1 transforming growth factor beta−1 proprotein 0.23 0.73 P42345 MTOR mechanistic target of rapamycin kinase;
serine/threonine-protein kinase mTOR−0.06 −0.31 P84022 SMAD3 mothers against decapentaplegic homolog 3 −0.43 −0.45 P40763 STAT3 signal transducer and activator of transcription 3 −0.14 −0.74 P54687 BCAT1 branched-chain-amino-acid aminotransferase 1, cytosolic −1.08 −0.81 P51692 STA5B signal transducer and activator of transcription 5B −0.37 −1.12 P49841 GSK3B glycogen synthase kinase-3 beta −0.38 −1.15 Q6PJG6 BRAT1 BRCA1-associated ATM activator 1 0.44 0.35 Note. DEPs, differentially expressed proteins; PRO, proteomics; PRM, parallel reaction monitoring; HQ, hydroquinone.
下载: 导出CSV
Table 3. GO analysis of DEGs and DEPs in erythrocyte differentiation-related pathways
Type Name Description C HQ Log2 (HQ/C) P-value GO:0045648 positive regulation of erythrocyte differentiation DEG HSPA1A Heat shock 70 kDa protein 1A 2380.07 3525.29 0.57 3.62 × 10⁻⁴ DEG HSPA1B Heat shock 70 kDa protein 1B 1456.71 2047.15 0.49 2.13 × 10⁻⁴ DEG PRMT1 Protein arginine N-methyltransferase 1 7636.53 10241.65 0.42 2.76 × 10⁻³ DEG ARNT Aryl hydrocarbon receptor nuclear translocator 1239.05 994.57 −0.32 4.42 × 10⁻² DEG STAT3 Signal transducer and activator of transcription 3 7816.59 6107.88 −0.36 8.66 × 10⁻³ DEG NCKAP1L Nck-associated protein 1-like 1588.34 1216.83 −0.38 7.45 × 10⁻³ DEG STAT5B Signal transducer and activator of transcription 5B 7772.78 5916.55 −0.39 2.66 × 10⁻³ DEG TRIM58 E3 ubiquitin-protein ligase TRIM58 1235.03 853.23 −0.53 1.17 × 10⁻⁴ DEP STAT1 Signal transducer and activator of transcription 1 786.12 892.10 0.18 1.95 × 10⁻² GO:0060319 primitive erythrocyte differentiation DEG VEGFA Vascular endothelial growth factor A 6792.45 3236.41 −1.07 5.22 × 10⁻²¹ GO:0048822 enucleate erythrocyte development DEG MAEA E3 ubiquitin-protein transferase MAEA 2162.55 2704.36 0.32 2.68 × 10⁻² DEG LYAR Cell growth-regulating nucleolar protein 753.96 1335.92 0.83 1.24 × 10⁻¹⁰ DEG DMTN Dematin 5445.88 4230.23 −0.36 2.88 × 10⁻² DEG CITED2 Cbp/p300-interacting transactivator 2 8346.68 5983.22 −0.48 1.55 × 10⁻⁴ DEG BCL6 B-cell lymphoma 6 protein 164.91 78.64 −1.07 5.25 × 10⁻⁷ DEP LYAR Cell growth-regulating nucleolar protein 785.46 538.76 −0.54 3.79 × 10⁻² GO:0030218 erythrocyte differentiation DEG KIT Mast/stem cell growth factor receptor 205.96 370.51 0.85 2.74 × 10⁻⁷ DEG EPAS1 Endothelial PAS domain-containing protein 1 222.64 334.54 0.59 1.03 × 10⁻³ DEG CASP3 Caspase-3 378.35 560.44 0.57 4.95 × 10⁻² DEG HSPA9 Stress-70 protein, mitochondrial 3536.24 4928.96 0.48 1.12 × 10⁻³ DEG ALAS2 5-aminolevulinate synthase, erythroid-specific, mitochondrial 2661.41 2008.50 −0.41 3.33 × 10⁻³ DEG THRA Thyroid hormone receptor alpha 2398.39 1705.39 −0.49 2.22 × 10⁻⁴ DEG DNASE2 Deoxyribonuclease 2, lysosomal 377.89 259.76 −0.54 1.96 × 10⁻³ DEG INHA Inhibin alpha chain 589.45 305.50 −0.95 2.95 × 10⁻¹⁰ DEG SPI1 Transcription factor PU.1 1375.22 661.69 −1.06 2.33 × 10⁻⁹ GO:0043249 erythrocyte maturation DEP HBAZ Hemoglobin subunit zeta 1570.60 1893.60 0.27 1.14 × 10⁻² DEP G6PD Glucose-6-phosphate 1-dehydrogenase 1965.05 3121.64 0.67 4.39 × 10⁻³ DEP ERCC2 ERCC excision repair 2, TFIIH core complex helicase subunit 363.34 311.97 −0.22 1.42 × 10⁻³ Note. GO, Gene Ontology; DEGs, differentially expressed genes; DEPs, differentially expressed proteins; HQ, hydroquinone-induced K562 cells; C, the controlgroup.
下载: 导出CSV
Table 4. KEGG pathway analysis of DEPs in potential mechanisms of HQ-induced hematotoxicity
KEGG term ID Input number Background number Regulated DEPs Cellular senescence hsa04218 5 160 up SIRT1, NFATC2, CDK4, CAPN2, CHEK1 1 160 down RBBP4 Apoptosis hsa04210 4 136 up SPTAN1, CTSB, CTSD, CAPN2 1 136 down BID Autophagy - animal hsa04140 3 128 up CTSB, CTSD, LAMP2 1 128 down RPS6KB2 Necroptosis hsa04217 2 162 up CHMP4A, CAPN2 2 162 down BID, GLUL Cell cycle hsa04110 3 124 up BUB1B, CDK4, CHEK1 Note. KEGG, Kyoto Encyclopedia of Genes and Genomes; DEPs, differentially expressed proteins; HQ, hydroquinone.
下载: 导出CSV
S1. KEGG pathway analysis of DEPs in potentially related signaling pathways
KEGG term ID Input number Background number Regulated DEPs PI3K-Akt signaling pathway hsa04151 4 354 up ITGA2B, PKN2, CDK4, VTN 2 354 down GRB2, RPS6KB2 p53 signaling pathway hsa04115 3 72 up CDK4, RRM2, CHEK1 1 72 down BID MAPK signaling pathway hsa04010 2 295 up PPM1B, HSPB1 2 295 down GRB2, CRKL AMPK signaling pathway hsa04152 1 120 up SIRT1 3 120 down ACACA, PFKFB4, RPS6KB2 mTOR signaling pathway hsa04150 3 153 down GRB2, TTI1, RPS6KB2 cAMP signaling pathway hsa04024 1 214 up ATP1A1 2 214 down ATP2B4, ATP2A3 NOD-like receptor signaling pathway hsa04621 2 178 up CTSB, TRPV2 Chemokine signaling pathway hsa04062 2 190 down GRB2, CRKL FoxO signaling pathway hsa04068 1 132 up SIRT1 1 132 down GRB2 Wnt signaling pathway hsa04310 1 160 up NFATC2 1 160 down CACYBP JAK-STAT signaling pathway hsa04630 1 162 down GRB2 TGF-beta signaling pathway hsa04350 1 94 down RPS6KB2
下载: 导出CSV
S2. KEGG pathway analysis of DEPs in potentially related biological process
KEGG term ID Input number Background number Regulated DEPs MicroRNAs in cancer hsa05206 2 299 up CD44, SIRT1 3 299 down PDCD4, GRB2, CRKL ECM-receptor interaction hsa04512 4 86 up CD44, VTN, GP1BB, ITGA2B Protein processing in endoplasmic reticulum hsa04141 4 165 up STUB1, SVIP, DNAJC1, CAPN2 Hematopoietic cell lineage hsa04640 3 97 up CD44, GP1BB, ITGA2B Fanconi anemia pathway hsa03460 1 54 up ERCC1 Ferroptosis hsa04216 1 40 up ACSL1 Nucleotide excision repair hsa03420 1 47 up ERCC1 Chemical carcinogenesis hsa05204 1 82 up AKR1C2
下载: 导出CSV
S3. Input DEPs of hematotoxicity-related KEGG pathway in HQ-induced K562 cells
KEGG ID Protein name Description Log2 (HQ/C) P-value hsa2067 ERCC1 ERCC excision repair 1, endonuclease non-catalytic subunit 3.27 0.02 hsa2812 GP1BB glycoprotein Ib platelet beta subunit 2.16 0.03 hsa5586 PKN2 protein kinase N2 1.88 0.01 hsa7448 VTN vitronectin 1.71 0.01 hsa29082 CHMP4A charged multivesicular body protein 4A 1.16 0.02 hsa960 CD44 CD44 molecule (Indian blood group) 1.13 0.01 hsa1646 AKR1C2 aldo-keto reductase family 1 member C2 1.11 0.00 hsa1111 CHEK1 checkpoint kinase 1 0.94 0.03 hsa3674 ITGA2B integrin subunit alpha 2b 0.80 0.02 hsa6241 RRM2 ribonucleotide reductase regulatory subunit M2 0.74 0.04 hsa1509 CTSD cathepsin D 0.73 0.00 hsa51393 TRPV2 transient receptor potential cation channel subfamily V member 2 0.72 0.04 hsa476 ATP1A1 ATPase Na+/K+ transporting subunit alpha 1 0.72 0.01 hsa23411 SIRT1 sirtuin 1 0.72 0.04 hsa1508 CTSB cathepsin B 0.65 0.00 hsa1019 CDK4 cyclin dependent kinase 4 0.63 0.01 hsa5495 PPM1B protein phosphatase, Mg2+/Mn2+ dependent 1B 0.59 0.01 hsa3315 HSPB1 heat shock protein family B (small) member 1 0.58 0.03 hsa4773 NFATC2 nuclear factor of activated T-cells 2 0.58 0.04 hsa64215 DNAJC1 DnaJ heat shock protein family (Hsp40) member C1 0.56 0.01 hsa701 BUB1B BUB1 mitotic checkpoint serine/threonine kinase B 0.52 0.02 hsa10273 STUB1 STIP1 homology and U-box containing protein 1 0.48 0.01 hsa2180 ACSL1 acyl-CoA synthetase long-chain family member 1 0.48 0.04 hsa258010 SVIP small VCP interacting protein 0.47 0.03 hsa824 CAPN2 calpain 2 0.44 0.02 hsa3920 LAMP2 lysosomal associated membrane protein 2 0.44 0.04 hsa6709 SPTAN1 spectrin alpha, non-erythrocytic 1 0.41 0.03 hsa31 ACACA acetyl-CoA carboxylase alpha −0.38 0.02 hsa489 ATP2A3 ATPase sarcoplasmic/endoplasmic reticulum Ca2+ transporting 3 −0.39 0.00 hsa27101 CACYBP calcyclin binding protein −0.40 0.04 hsa2885 GRB2 growth factor receptor bound protein 2 −0.44 0.03 hsa5928 RBBP4 RB binding protein 4, chromatin remodeling factor −0.47 0.03 hsa1399 CRKL CRK like proto-oncogene, adaptor protein −0.48 0.03 hsa493 ATP2B4 ATPase plasma membrane Ca2+ transporting 4 −0.51 0.01 hsa2752 GLUL glutamate-ammonia ligase −0.60 0.02 hsa637 BID BH3 interacting domain death agonist −0.64 0.04 hsa6199 RPS6KB2 ribosomal protein S6 kinase B2 −0.81 0.01 hsa27250 PDCD4 programmed cell death 4 −0.88 0.01 hsa9675 TTI1 TELO2 interacting protein 1 −1.14 0.04 hsa5210 PFKFB4 6-phosphofructo-2-kinase/fructose-2,6-biphosphatase 4 −1.85 0.02
下载: 导出CSV
-
[1] Mehlman MA. Dangerous and cancer-causing properties of products and chemicals in the oil refining and petrochemical industries. Part XXX: Causal relationship between chronic myelogenous leukemia and benzene-containing solvents. Ann N Y Acad Sci, 2006; 1076, 110−9. doi: 10.1196/annals.1371.065 [2] Spatari G, Allegra A, Carrieri M, et al. Epigenetic effects of benzene in hematologic neoplasms: the altered gene expression. Cancers (Basel), 2021; 13, 2392. doi: 10.3390/cancers13102392 [3] McDonald TA, Holland NT, Skibola C, et al. Hypothesis: phenol and hydroquinone derived mainly from diet and gastrointestinal flora activity are causal factors in leukemia. Leukemia, 2001; 15, 10−20. doi: 10.1038/sj.leu.2401981 [4] Zhang LP, McHale CM, Rothman N, et al. Systems biology of human benzene exposure. Chem Biol Interact, 2010; 184, 86−93. doi: 10.1016/j.cbi.2009.12.011 [5] Sarma SN, Kim YJ, Ryu JC. Differential gene expression profiles of human leukemia cell lines exposed to benzene and its metabolites. Environ Toxicol Pharmacol, 2011; 32, 285−95. doi: 10.1016/j.etap.2011.06.001 [6] Rubio V, Zhang JW, Valverde M, et al. Essential role of Nrf2 in protection against hydroquinone- and benzoquinone-induced cytotoxicity. Toxicol in Vitro, 2011; 25, 521−9. doi: 10.1016/j.tiv.2010.10.021 [7] Wu XR, Xue M, Li XF, et al. Phenolic metabolites of benzene inhibited the erythroid differentiation of K562 cells. Toxicol Lett, 2011; 203, 190−9. doi: 10.1016/j.toxlet.2011.03.012 [8] Tan Q, Li JY, Peng JM, et al. E4F1 silencing inhibits cell growth through cell‐cycle arrest in malignant transformed cells induced by hydroquinone. J Biochem Mol Toxicol, 2019; 33, e22269. doi: 10.1002/jbt.22269 [9] Liang BX, Chen YC, Yuan WX, et al. Down-regulation of miRNA-451a and miRNA-486-5p involved in benzene-induced inhibition on erythroid cell differentiation in vitro and in vivo. Arch. Toxicol, 2018; 92, 259−72. [10] Li Y, Wu XR, Li XF, et al. Changes in DNA methylation of erythroid-specific genes in K562 cells exposed to phenol and hydroquinone. Toxicology, 2013; 312, 108−14. doi: 10.1016/j.tox.2013.08.007 [11] Tang KY, Yu CH, Jiang L, et al. Long-term exposure of K562 cells to benzene metabolites inhibited erythroid differentiation and elevated methylation in erythroid specific genes. Toxicol Res, 2016; 5, 1284−97. doi: 10.1039/C6TX00143B [12] Ishihama M, Toyooka T, Ibuki Y. Generation of phosphorylated histone H2AX by benzene metabolites. Toxicol in Vitro, 2008; 22, 1861−1868. doi: 10.1016/j.tiv.2008.09.005 [13] Zeng MJ, Chen SP, Zhang K, et al. Epigenetic changes involved in hydroquinone-induced mutations. Toxin Reviews, 2021; 40, 527−34. doi: 10.1080/15569543.2020.1744660 [14] Chen YT, Chen SY, Liang HR, et al. Bcl-2 protects TK6 cells against hydroquinone-induced apoptosis through PARP-1 cytoplasm translocation and stabilizing mitochondrial membrane potential. Environ Mol Mutagen, 2018; 59, 49−59. doi: 10.1002/em.22126 [15] Yu CH, Suriguga, Li Y, et al. The Role of ROS in Hydroquinone-induced Inhibition of K562 Cell Erythroid Differentiation. Biomed Environ Sci, 2014; 27, 212−4. [16] Wang Y, Zhang GY, Han QL, et al. Phenolic metabolites of benzene induced caspase-dependent cytotoxicities to K562 cells accompanied with decrease in cell surface sialic acids. Environ Toxicol, 2014; 29, 1437−51. doi: 10.1002/tox.21874 [17] Mozzoni P, Poli D, Pinelli S, et al. Benzene exposure and MicroRNAs expression: in vitro, in vivo and human findings. Int J Environ Res Public Health, 2023; 20, 1920. doi: 10.3390/ijerph20031920 [18] Yu CH, Yang SQ, Li L, et al. Identification of potential pathways and microRNA-mRNA networks associated with benzene metabolite hydroquinone-induced hematotoxicity in human leukemia K562 cells. BMC Pharmacol Toxicol, 2022; 23, 20. doi: 10.1186/s40360-022-00556-8 [19] Yipel M, İlhan A. Potentiation of toxicology with proteomics: toxicoproteomics. Int J Vet Anim Res, 2022; 5, 36−9. [20] Hansen MS, Rasmussen M, Grauslund J, et al. Proteomic analysis of vitreous humour of eyes with diabetic macular oedema: a systematic review. Acta Ophthalmol, 2022; 100, e1043−51. [21] Hanash S. Disease proteomics. Nature, 2003; 422, 226−32. doi: 10.1038/nature01514 [22] Dowling VA, Sheehan D. Proteomics as a route to identification of toxicity targets in environmental toxicology. Proteomics, 2006; 6, 5597−604. doi: 10.1002/pmic.200600274 [23] Hall DR, Peng H. Characterizing physical protein targets of chemical contaminants with chemical proteomics: Is it time to fill a crucial environmental toxicology knowledge gap? Comparat Biochem Physiol Part D Genom Proteom, 2020; 34, 100655. [24] Hu JJ, Ma HM, Zhang WB, et al. Effects of benzene and its metabolites on global DNA methylation in human normal hepatic l02 cells: effects of benzene and its metabolites on global DNA methylation. Environ Toxicol, 2014; 29, 108−16. doi: 10.1002/tox.20777 [25] Guo JM, Miao Y, Xiao BX, et al. Differential expression of microRNA species in human gastric cancer versus non-tumorous tissues. J Gastroenterol Hepatol, 2009; 24, 652−7. doi: 10.1111/j.1440-1746.2008.05666.x [26] McHale CM, Zhang LP, Lan Q, et al. Global gene expression profiling of a population exposed to a range of benzene levels. Environ Health Perspect, 2011; 119, 628−40. doi: 10.1289/ehp.1002546 [27] Lozzio CB, Lozzio BB. Human chronic Myelogenous leukemia cell-line with positive Philadelphia chromosome. Blood, 1975; 45, 321−34. doi: 10.1182/blood.V45.3.321.321 [28] Andersson LC, Jokinen M, Gahmberg CG. Induction of erythroid differentiation in the human leukaemia cell line K562. Nature, 1979; 278, 364−5. doi: 10.1038/278364a0 [29] Peterson AC, Russell JD, Bailey DJ, et al. Parallel reaction monitoring for high resolution and high mass accuracy quantitative, targeted proteomics. Mol Cell Proteom, 2012; 11, 1475−88. doi: 10.1074/mcp.O112.020131 [30] Van Der Ende EL, Meeter LH, Stingl C, et al. Novel CSF biomarkers in genetic frontotemporal dementia identified by proteomics. Ann Clin Transl Neurol, 2019; 6, 698−707. doi: 10.1002/acn3.745 [31] Di B, Jia HL, Luo OJ, et al. Identification and validation of predictive factors for progression to severe COVID-19 pneumonia by proteomics. Sig Transduct Target Ther, 2020; 5, 217. doi: 10.1038/s41392-020-00333-1 [32] Ma XJ, Zhang X, Luo J, et al. MiR-486-5p-directed MAGI1/Rap1/RASSF5 signaling pathway contributes to hydroquinone-induced inhibition of erythroid differentiation in K562 cells. Toxicol in Vitro, 2020; 66, 104830. doi: 10.1016/j.tiv.2020.104830 [33] Yu CH, Yang SQ, Zhang YJ, et al. The role of GATA switch in benzene metabolite hydroquinone inhibiting erythroid differentiation in K562 cells. Arch Toxicol, 2023; 97, 2169−81. doi: 10.1007/s00204-023-03541-0 [34] Bromberg J, Darnell JE. The role of STATs in transcriptional control and their impact on cellular function. Oncogene, 2000; 19, 2468−73. doi: 10.1038/sj.onc.1203476 [35] Coffer PJ, Koenderman L, de Groot RP. The role of STATs in myeloid differentiation and leukemia. Oncogene, 2000; 19, 2511−22. doi: 10.1038/sj.onc.1203479 [36] Fasouli ES, Katsantoni E. JAK-STAT in early hematopoiesis and leukemia. Front Cell Dev Biol, 2021; 9, 669363. doi: 10.3389/fcell.2021.669363 [37] Faridounnia M, Folkers GE, Boelens R. Function and interactions of ERCC1-XPF in DNA damage response. Molecules, 2018; 23, 3205. doi: 10.3390/molecules23123205 [38] Wang SL, Zhao H, Zhou B, et al. Polymorphisms in ERCC1 and susceptibility to childhood acute lymphoblastic leukemia in a Chinese population. Leuk Res, 2006; 30, 1341−5. doi: 10.1016/j.leukres.2006.03.027 [39] Adès L, Itzykson R, Fenaux P. Myelodysplastic syndromes. Lancet, 2014; 383, 2239−52. doi: 10.1016/S0140-6736(13)61901-7 [40] Huang HJ, Xu CL, Gao J, et al. Severe ineffective erythropoiesis discriminates prognosis in myelodysplastic syndromes: analysis based on 776 patients from a single centre. Blood Cancer J, 2020; 10, 83. doi: 10.1038/s41408-020-00349-4 [41] Kim YJ, Woo HD, Kim BM, et al. Risk assessment of hydroquinone: differential responses of cell growth and lethality correlated to hydroquinone concentration. J Toxicol Environ Health, Part A, 2009; 72, 1272−8. doi: 10.1080/15287390903212279 [42] Yang XH, Li C, Yu GC, et al. Ligand-independent activation of AhR by hydroquinone mediates benzene-induced hematopoietic toxicity. Chem Biol Interact, 2022; 355, 109845. doi: 10.1016/j.cbi.2022.109845 [43] Song SM, Cerella C, Orlikova-Boyer B, et al. Hydroquinone-derivatives induce cell death in chronic Myelogenous leukemia. Proceedings, 2019; 11, 28. [44] Sun ZW, Chen C, Wang L, et al. S-allyl cysteine protects retinal pigment epithelium cells from hydroquinone-induced apoptosis through mitigating cellular response to oxidative stress. Eur Rev Med Pharmacol Sci, 2020; 24, 2120−8. [45] Hanahan D, Weinberg RA. Hallmarks of cancer: the next generation. Cell, 2011; 144, 646−74. doi: 10.1016/j.cell.2011.02.013 [46] Dewi R, Hamid ZA, Rajab N, et al. Genetic, epigenetic, and lineage-directed mechanisms in benzene-induced malignancies and hematotoxicity targeting hematopoietic stem cells niche. Hum Exp Toxicol, 2020; 39, 577−95. doi: 10.1177/0960327119895570 [47] Baker SJ, Reddy EP. CDK4: A key player in the cell cycle, development, and cancer. Genes Cancer, 2012; 3, 658−69. doi: 10.1177/1947601913478972 [48] Piezzo M, Cocco S, Caputo R, et al. Targeting cell cycle in breast cancer: CDK4/6 inhibitors. Int J Mol Sci, 2020; 21, 6479. doi: 10.3390/ijms21186479 [49] Schneeweiss-Gleixner M, Byrgazov K, Stefanzl G, et al. CDK4/CDK6 inhibition as a novel strategy to suppress the growth and survival of BCR-ABL1T315I+ clones in TKI-resistant CML. EBioMedicine, 2019; 50, 111−21. doi: 10.1016/j.ebiom.2019.11.004 [50] Bunting KD. STAT5 signaling in normal and pathologic hematopoiesis. Front Biosci, 2007; 12, 2807−20. doi: 10.2741/2274 [51] Darnell JE. STATs and gene regulation. Science, 1997; 277, 1630−5. doi: 10.1126/science.277.5332.1630 [52] Furtek SL, Backos DS, Matheson CJ, et al. Strategies and approaches of targeting STAT3 for cancer treatment. ACS Chem Biol, 2016; 11, 308−18. doi: 10.1021/acschembio.5b00945 [53] Dorritie KA, McCubrey JA, Johnson DE. STAT transcription factors in hematopoiesis and leukemogenesis: opportunities for therapeutic intervention. Leukemia, 2014; 28, 248−57. doi: 10.1038/leu.2013.192 [54] Darnell JE Jr, Kerr IM, Stark GR. Jak-STAT pathways and transcriptional activation in response to IFNs and other extracellular signaling proteins. Science, 1994; 264, 1415−21. doi: 10.1126/science.8197455 [55] Miura Y, Tsujioka T, Nishimura Y, et al. TRAIL expression up-regulated by interferon-γ via phosphorylation of STAT1 induces myeloma cell death. Anticancer Res, 2006; 26, 4115−24. [56] Li J, Williams MJ, Park HJ, et al. STAT1 is essential for HSC function and maintains MHCIIhi stem cells that resist myeloablation and neoplastic expansion. Blood, 2022; 140, 1592−606. [57] Hankey PA. Regulation of hematopoietic cell development and function by Stat3. Front Biosci, 2009; 14, 5273−90. doi: 10.2741/3597 [58] Chong PSY, Chng WJ, De Mel S. STAT3: A promising therapeutic target in multiple myeloma. Cancers (Basel), 2019; 11, 731. doi: 10.3390/cancers11050731 [59] Rani A, Murphy JJ. STAT5 in Cancer and Immunity. J Interferon Cytokine Res, 2016; 36, 226−37. doi: 10.1089/jir.2015.0054 [60] Kimura A, Rieger MA, Simone JM, et al. The transcription factors STAT5A/B regulate GM-CSF-mediated granulopoiesis. Blood, 2009; 114, 4721−8. [61] Wang ZQ, Bunting KD. STAT5 in hematopoietic stem cell biology and transplantation. JAK-STAT, 2013; 2, e27159. doi: 10.4161/jkst.27159 -
 23223+Supplementary Materials.pdf

-

 点击查看大图
计量
- 文章访问数: 70
- HTML全文浏览量: 35
- PDF下载量: 7
- 被引次数: 0

 Quick Links