HTML
-
Iodine plays an important role in the synthesis of thyroid hormones. Lack of iodine causes goiter and thyroid dysfunction, and is the main preventable cause of mental retardation. Pregnant and lactating women, and young children are particularly susceptible to iodine deficiency, which may cause intellectual impairment, and increase pregnancy loss and infant mortality. Surveys in some countries have shown that pregnant women are iodine deficient, despite iodine sufficiency in school children[1-2]. Iodine deficiency disorders (IDD) have long been a significant public health problem in China. The introduction of mandatory universal salt iodization (USI) by the Chinese government in 1994 led to enormous progress, and the program is now a model for similar programs in many other countries. While the prevalence of IDD has decreased nationally, there have been cases of iodine excess. Excess iodine intake may result in thyroid diseases, such as nodular goiter, hyperthyroidism, and Hashimoto's thyroiditis[3-4]. Excess iodine in drinking water has caused endemic goiter and thyroidal dysfunction in vulnerable populations within some provinces and municipalities of China. Shen et al. mapped the geographic distribution of excess iodine in the drinking water in China in 2011[5]. To understand the current situation regarding national prevention and control of IDD in high-risk endemic areas and to evaluate the prevalence of goiter and iodine nutritional status in areas with elevated levels of water iodine, the Endemic Disease Center of China implemented the 'High-Risk Endemic Survey' and 'High Water Iodine Survey' from 2012-2014. Herein, we present the survey results.
-
The 'High-Risk Endemic Survey' investigated counties with historical cretinism and counties with low iodized-salt coverage rates ( < 80% in the year of investigation). Two primary schools were randomly selected from 3 towns in each survey county. We obtained information from 40 children aged 8-10 years in each primary school selected. In total, we included 9052 children from 42 counties in Fujian, Guangdong, Guangxi, Hainan, Hebei, Jiangxi, Ningxia, Tibet, Xinjiang, and Zhejiang; 8646 children from 36 counties in Fujian, Guangdong, Guangxi, Hainan, Qinghai, Tibet, Xinjiang, and Zhejiang; and 7973 children from 32 counties in Fujian, Guangdong, Guangxi, Henan, Qinghai, Xinjiang, and Zhejiang from 2012 to 2014.
For the 'High Water Iodine Survey', children were enrolled from 8 provinces and municipalities (Anhui, Hebei, Henan, Jiangsu, Shandong, Shanxi, Shaanxi, and Tianjin) with excessive iodine ( > 150 μg/L) in the drinking water. The number of these counties was half the total number of counties with high iodine concentrations in the water. Each village was analyzed as a unit. One-hundred children aged 8-10 years were selected to undergo ultrasonographic examination for goiter, and 30 of those children were randomly selected for urine iodine (UI) detection. In total, 4893 children from 63 villages in 2012, 5120 children from 76 monitoring points in 2013, and 5185 children from 68 monitoring points in 2014, were enrolled in our study.
-
Thyroid volume was determined by ultrasonography performed by experienced examiners working in the provincial and municipal centers for disease control, using a 7.5-MHz transducer. We measured the length (l), width (w), and depth (d) of each thyroid lobe and calculated its volume by using the following formula: V (mL)=0.479 × d × w × l (mm) × 0.001. Thyroid gland volume was calculated as the sum of the volume of both lobes. Normal volumes for children aged 8, 9, and 10 years are less than 4.5, 5.0, and 6.0 mL, respectively, according to the Chinese national standard[6].
-
Mid-stream spot urine samples were collected in dry, clean plastic tubes, tightly sealed, and stored in a refrigerator at 4 ℃. UI measurements were performed within one month of sample collection, using the national standard method of China's Ministry of Health[7]. External reference samples were provided by the National Laboratory of Iodine Deficient Disorders in China. Assessment of iodine nutrition status was based on median urinary iodine (MUI) concentrations for school-aged children, and samples were assessed as insufficient (MUI < 100 μg/L), adequate (MUI 100-199 μg/L), more-than-adequate (MUI 200-299 μg/L), or excessive (MUI > 300 μg/L)[8].
-
We collected 5 water samples from villages without central water supplies (east, south, west, north, and middle), and 2 tap water samples from villages with a central supply. The National Laboratory of Iodine Deficiency Disorders Reference testing method was used to measure iodine levels in the water samples[9]. We only collected water samples from areas with excessive water iodine.
-
We used SPSS release 13.0 (Stats Data Mining Co. Ltd. Beijing, China) for statistical analyses. The Shapiro-Wilk method was used to test the normality of data distribution. UI values were not normally distributed. Therefore, these variables were assessed by Kruskal-Wallis one-way analysis of variance (ANOVA) in groups, and pairwise comparisons were performed using the Mann-Whitney rank sum test. Pearson's χ2 test was used to compare disease prevalence. P < 0.05 was considered statistically significant.
-
The ethical review board of Harbin Medical University approved this research, and we obtained informed consent from the primary caregiver of every child.
Survey Scope and Sampling Methods
Thyroid Ultrasonography
Urine Sample Collection and Analysis
Water Sample Collection and Analysis
Statistical Methods
Ethics Statement
-
Table 1 lists the MUI values, which ranged from 92.4-305.1 μg/L in the 12 high-risk IDD provinces over the 3 years. Table 2 shows the distribution of UI in high-risk areas, where UI values ranging from 100-200 μg/L accounted for 36.9%, 37.8%, and 35.3% of all measurements in 2012, 2013, and 2014, respectively. The MUI of the children from the 8 provinces and municipalities with excessive water iodine ranged from 251.1-977.5 μg/L, as presented in Table 3. UI concentrations ranging from 500-1000 μg/L accounted for 31.3% and 25.3% of all measurements in 2012 and 2014, while UI values ranging from 300-500 μg/L made up the largest percentage (29.1%) in 2013 (Table 4).
Province Year Urine Samples Ultrasound Samples n MUI (μg/L) n GP (%) Fujian 2012 480 136.7 480 2.7 2013 481 124.7 483 1.2 2014 305 106.2 308 1.6 Guangdong 2012 480 124.0 480 1.0 2013 480 92.4 480 2.3 2014 480 157.6 480 5.6 Guangxi 2012 1200 115.2 1200 0.6 2013 1200 146.1 1200 0.0 2014 1200 118.5 1200 0.3 Hainan 2012 478 169.8 475 0.0 2013 475 116.5 473 0.2 Henan 2014 240 305.1 2400 7.1 Hebei 2012 240 256.7 240 4.2 Jiangxi 2012 239 192.0 240 0.8 Ningxia 2012 240 185.0 240 2.1 Qinghai 2013 490 147.3 493 0.4 2014 757 168.8 768 0.0 Tibet 2012 1179 142.3 575 4.7 2013 393 166.5 362 0.8 Xinjiang 2012 4102 186.3 4110 1.7 2013 4097 191.1 4127 1.6 2014 4195 174.4 4191 1.2 Zhejiang 2012 243 178.4 247 4.5 2013 995 119.5 995 0.0 2014 782 160.6 782 5.0 Note. MUI, median urine iodine; GP, goiter prevalence. Table 1. Evaluation of the Iodine Nutrition Status of Children in High-risk Areas
Item/Year 2012 2013 2014 n 8881 8611 7959 MUI (μg/L) 163.8 153.9 162.6 Frequency distribution of UI (%) < 50 μg/L 8.1 7.5 8.2 50-μg/L 17.6 19.6 18.3 100-μg/L 36.9 37.8 35.3 200-μg/L 22.5 22.3 21.6 ≥300 μg/L 14.9 12.8 16.6 Note. MUI, median urine iodine; UI, urine iodine. Table 2. Distribution of Urine Iodine Concentrations in 8-10-year-old Children in High-risk Areas
Province Year Water Iodine Concentrations Urine Iodine Concentrations Ultrasound n MWI (μg/L) n MUI (μg/L) n GP (%) Anhui 2012 2 323.7 57 884.1 153 3.9 2013 2 253.2 60 558.1 213 4.7 2014 3 252.0 61 668.0 205 11.7 Hebei 2012 27 222.4 886 434.5 1422 4.1 2013 33 225.3 982 370.7 1475 5.3 2014 24 266.0 944 261.5 1462 7.9 Henan 2012 10 222.5 291 351.1 727 6.6 2013 10 184.5 670 282.8 850 3.5 2014 10 211.1 905 251.1 937 3.3 Jiangsu 2012 3 410.9 79 702.5 184 0.5 2013 3 394.5 88 799.4 214 1.4 2014 3 385.4 150 977.5 244 2.9 Shandong 2012 16 144.4 564 403.3 1818 9.5 2013 19 334.4 1723 470.6 1739 5.0 2014 19 274.7 1520 407.2 1539 18.9 Shanxi 2012 3 222.7 188 375.5 384 6.3 2013 7 257.1 265 463.3 422 5.9 2014 7 371.9 188 482.5 482 7.5 Shaanxi 2012 1 98.8 100 293.6 100 1.0 2013 1 92.8 100 271.7 101 5.0 2014 1 90.6 92 281.4 213 1.9 Tianjin 2012 1 394.0 105 707.1 105 10.5 2013 1 399.0 38 647.3 106 10.4 2014 1 303.0 100 477.2 100 10.0 Note. MWI, median water iodine; MUI, median urine iodine; GP, goiter prevalence. Table 3. Sample Size and Iodine Status of Areas with Iodine Excess
Item/Year 2012 2013 2014 n 2270 3926 3960 MUI (μg/L) 426.6 399.7 377.5 Frequency distribution of UI (%): < 100 μg/L 3.9 4.4 9.4 100-μg/L 12.6 14.1 15.8 200-μg/L 13.2 16.7 15.0 300-μg/L 29.4 29.1 23.0 500-μg/L 31.3 28.2 25.3 ≥1000 μg/L 9.6 7.5 11.5 Note. MUI, median urine iodine; UI, urine iodine. Table 4. Distribution of Urine Iodine in Children Aged 8-10 years in Areas with High Iodine
-
We collected 63, 76, and 68 water samples in provinces with excessive iodine in 2012, 2013, and 2014, respectively. Table 3 shows that the median concentration of iodine in water from the 8 provinces with excessive iodine (except for Shandong in 2012 and Shaanxi for all 3 years) ranged from 90.6-410.9 μg/L, higher than the Chinese national limit of 150 μg/L[10].
-
In the areas at high risk of IDD, goiter prevalence was lower than the national standard for IDD elimination (5%)[11], except in Henan and Guangdong provinces in 2014 (Table 1). The prevalence of goiter in children in Henan (2012), Shandong (2012, 2014), Shanxi (2012-2014), Tianjin (2012-2014), Hebei (2013, 2014), Anhui (2014) provinces and municipalities with excessive iodine were above 5% from 2012 to 2014, as shown in Table 3.
-
As shown in Table 5, we collected 2270 urine samples in 2012 from children in areas with high iodine. The overall UI for those samples measured 426.6 μg/L, much higher than that of high-risk endemic areas (UI, 163.8 μg/L; Z=-50.666; P < 0.001). We obtained similar results in 2013 (Z=-59.762; P < 0.001) and 2014 (Z=-48.758; P < 0.001). The prevalence of goiter among children from areas with high iodine in 2012 was 6.6%, much higher than that for children from high-risk endemic areas (1.8%; χ2=202.789; P < 0.001). We obtained similar results in 2013 (χ2=192.726; P < 0.001) and 2014 (χ2=445.932; P < 0.001).
Survey Area 2012 2013 2014 HR HI HR HI HR HI na 8881 2270 8611 3926 7959 3960 MUI (μg/L) 163.8 426.6 153.9 399.7 162.6 377.5 UI, mean±SD (μg/L) 188.1±138.0 526.8±424.0 180.0±132.8 472.7±336.7 188.6±133.1 499.6±442.2 nb 8287 4893 8613 5120 7969 5182 GP (%) 1.8 6.6 1.1 4.9 1.8 10.0 Note. MUI, median urine iodine; GP, goiter prevalence; HR, high-risk endemic areas; HI, areas with high iodine; na, sample size of urine iodine; nb, sample size of thyroid ultrasonography. Table 5. Comparisons of UI and GP in Children between Areas with High Iodine and High-risk Endemias
-
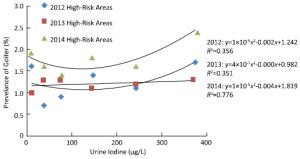
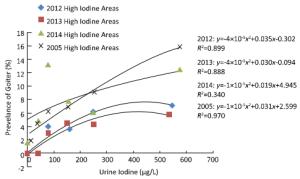
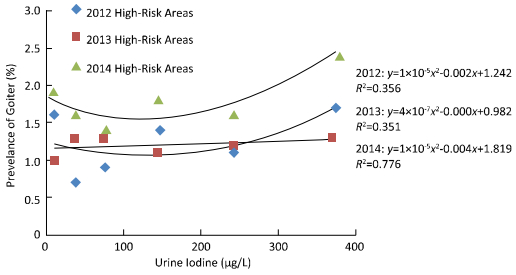
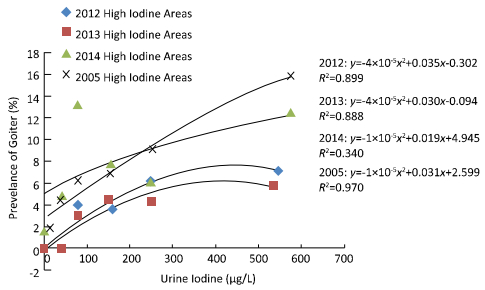
We observed a weak correlation between UI and thyroid volume in both high-risk areas and areas with high iodine. Therefore, we grouped children by UI level according to the World Health Organization (WHO) standard, and analyzed the relationship between MUI and goiter prevalence. We found a U-shaped relationship in high-risk endemic areas (Figure 1) and a parabolic relationship in areas with iodine excess (Figure 2). From the figures, we can see that goiter prevalence, for the same level of UI, was much higher in 2014 than in 2012 and 2013, because the sentinels selected in each year were not same, GP exhibited the above difference. For the high risk areas in 2014, goiter prevalence of Guangdong and Henan provinces were above 5%, MUI of Guangdong (157.6 μg/L) was appropriate, but MUI of Henan (305.1 μg/L) was excessive, the possible reason is that some places of excess iodine water was nearby, so water iodine detection should be added.

Figure 1. The relationship between median urine iodine concentration and the prevalence of goiter in children from high-risk IDD areas, over a 3-year period. We divided the UI levels into 6 groups: < 20, 20-49.9, 50-99.9, 100-199.9, 200-299, and > 300 μg/L. Goiter prevalence initially decreased, but subsequently increased with increasing median urine iodine concentrations, forming a U-shaped curve.

Figure 2. The relationship between median urine iodine concentration and the prevalence of goiter in children from areas with high iodine levels in 2005 and 2012-2014. We divided the UI levels into 6 groups: < 20, 20-49.9, 50-99.9, 100-199.9, 200-299, and > 300 μg/L. Goiter prevalence increased with increases in median urine iodine concentration, forming a parabolic curve.
Median Urinary Iodine
Results of the Water Iodine Survey
Goiter Prevalence
Comparison of UI Concentration and Goiter Prevalence between Children from High-risk Areas and Children from Areas with High Iodine Levels
The Relationship between Median UI and Goiter Prevalence
-
As a basic component of thyroid hormones, iodine concentrations must be maintained at safe levels because both deficiency and excess are harmful to the thyroid gland. From 2003-2011, the number of countries with common iodine deficiency, based on UI level, decreased from 54 to 32[12]. Over the last 2 decades, there was a major effort in China to introduce salt iodization as a safe, sustainable, and cost-effective strategy to ensure sufficient intake of iodine in iodine-deficient areas. For example, a survey in 2007 in high-risk areas identified 40 counties as high risk, found 249 new cases of cretinism, and estimated the prevalence of goiter to be > 5%. Subsequently, central government and local governments implemented iodized-salt subsidies for high-risk groups in Qinghai, Xinjiang, and Tibet, which significantly increased iodized-salt coverage. By the end of 2010, 28 provinces and 97.7% of counties in China had eliminated IDD.
Although UI data cannot provide direct information to evaluate thyroid function, both low and high UI values suggest a higher risk of developing thyroid disorders. Data from our research showed the UI of school children measured above 100 μg/L in high-risk provinces, indicating that-except for children in Guangdong (92.4 μg/L) in 2013-most children had sufficient iodine intake. The UI level in high-risk areas was close to 80-150 μg/day, which is the adult dietary requirement, according to the 2011 WHO recommendations[13]. In our study, the goiter prevalence for each UI level from 2012-2014 high-risk surveys was much lower than that reported in 2010 by Liu in the high-risk survey[14]. Other reports have also shown that goiterprevalence in Jiangsu and Zhejiang provinces decreased with routine salt iodization, and that thyroid volume decreased along with UI increases[15-16]. China's IDD control and prevention programs have indeed made enormous progress.
Iodide goiter occurs at all ages. Wolff reviewed iodide goiter and the pharmacologic effects of excess iodide in 1969[17]. Newborns presented with goiter due to placental transfer of iodine from mothers being treated with iodides. Adult iodide goiter was found mostly in patients treated with drugs containing iodine, and a large subset of people experienced endemic iodide goiter. The first report of excess water iodine-induced goiter in China was of high goiter prevalence among fishermen in Hebei[18]. In 2005, an investigation identified high water iodine in 109 counties in 9 provinces. These areas of iodine excess mostly lie in the flood plains of the Yellow River, and are often 'embedded' in areas with inadequate or deficient water levels of iodine. A survey from 2011-2012 defined water iodine levels exceeding 150 μg/L as being excessive and showed that iodine excess in women living in areas with excessive water iodine increased the occurrence of thyroid disease[19]. A study by Du et al. showed that thyroid nodules and subclinical hypothyroidism were more likely to occur in areas with excess iodine intake[20]. In our 'High Iodine Survey', the prevalence of goiter for each UI level in 2012 and 2013 were much lower than that reported by Liu et al. in the 2005 iodine excess survey. The survey conducted in 2005 found a goiter prevalence of 11.6% in the 300-500 μg/L UI group, 13.7% in the 500-800 μg/L UI group, 16.9% in the 800-1000 μg/L UI group, 17.8%in the≥1000 μg/L UI group[14] inareas with high iodine level in drinking water (Figure 2). The government stopped the sale of iodized salt in these areas in 2009, which contributed to the declining of goiter rate. Nevertheless, there were still provinces (Anhui, Hebei, Henan, Shandong, Shanxi, and Tianjin) where goiter prevalence was > 5%. According to the WHO/UNICEF/ICCIDD criteria, goiter prevalence exceeding 5% may pose a threat to public health[8]. Further, UI values from 300-500 μg/L accounted for 29.4%, 29.1%, and 23.0%, UI values from 500-1000 μg/L accounted for 31.3%, 28.2%, and 25.3%, and UI values > 1000 μg/L accounted for 9.6%, 7.5%, and 11.5% of measurements for each of the respective 3 years. As many children with high UI levels live in areas with excessive iodine, the increased risk of adverse health consequences cannot be ignored.
With respect to thyroid gland pathology, excessive iodine intake increasing the synthesis of thyroid hormone (T4) and altering antigenicity of thyroglobulin, which led to colloid retention in follicles and flattened thyroid follicular epithelial cells[21-22]. Therefore, a follicular colloid retention goiter is a typical pathological finding in thyroid glands exposed to high levels of iodine. Animal experiments also found marked accumulation of peroxisome and secondary lysosomes in iodine-treated NOD.H-2h4 mice, their thyroid epithelial cells exhibited apoptosis and necrosis, while lymphocytic infiltration and damage of thyroid follicles were also observed, the oxidative injury to the thyroid epithelial cells induced by iodine excess might be a prerequisite for the development of autoimmune thyroiditis[23]. In general, people living in areas with endemic goiter and chronic iodine deficiency are at high risk of developing follicular thyroid cancer, whereas chronic excessive iodine intake may increase the risk of papillary thyroid cancer[24].
In an epidemiological study on the adverse health consequences of high urine iodine, Teng et al. compared thyroid disease development in 2 Chinese populations exposed to different iodine levels (Rongxing, MUI 261 μg/L; Chengshan, MUI 145 μg/L) and showed that the prevalence of subclinical hypothyroidism, anti-thyroid peroxidase antibody (TPOAb) positivity, and anti-thyroglobulin antibody (TgAb) positivity were significantly higher in patients in Rongxing than in Chengshan[25]. Another study showed an MUI of 331.33 μg/L for patients with benign thyroid nodules and 466.23 μg/L for patients with papillary thyroid cancer, both of which were higher than the control group (MUI 174.30 μg/L). Additionally, a strong association was demonstrated between high UI and thyroid nodules, papillary thyroid cancer, and aggressive cancer features, suggesting that high UI is a risk factor for thyroid cancer[26]. In addition, Song et al. found a U-shaped relationship between UI concentration and the prevalence of thyroid nodules in the general population of Shanghai; the risk of thyroid nodules increased at UI concentrations < 140 μg/L and > 400 μg/L[27]. Because high iodine intake may lead to iodine-induced thyroid disorders in susceptible groups with the introduction of iodized salt, China implemented new standards for salt iodization to prevent potential side effects in March 2012. The national standards of salt iodine content have been changed from 35±15 mg/kg to (20-30)±30% mg/kg, both lowering the iodine content in the salt and narrowing the range of iodine content allowed. The median iodine content in household iodized salt dropped from 42.3 mg/kg in 1999 to 30.5 mg/kg in 2011 and to 25.0 mg/kg in 2014. This led to a significant decrease in the MUI concentration and median thyroid volume of children improved the symmetry of the thyroid volume distribution[28].
In 1978, researchers observed iodine-induced goiter caused by drinking deep-well water in China. The fact that both iodine deficiency and excess can cause goiter suggests a relationship between iodine nutritional status and goiter prevalence. Our results are similar to those of Yu Zhi Heng in 1984, who proposed the 'U-curve' relationship between UI and goiter prevalence, and revealed that goiter prevalence was lowest when urinary iodine concentrations measured 50-400 μg/g creatinine[29]. The 'classification of areas with high water iodine and the endemic areas of iodine excess goiter' classified areas with water iodine concentrations > 150 μg/L as high iodine water areas[10]. That criterion is now under revision, and high iodine water areas will be used to describe areas with concentrations > 100 μg/L, with levels of 50-100 μg/L being regarded as optimal[30]. In 2010, Liu tested and enriched the theory of the U-curve relationship between UI and goiter prevalence[14]. In our study, we also found that the U-shaped relationship varied in different areas. In addition, we found a parabolic relationship between goiter prevalence and UI in areas with high iodine. Among residents in high-risk areas, the prevalence of goiter was higher in people with low UI concentrations who suffered from iodine deficiency; the high UI concentration subgroup, who suffered from excessive iodine, developed iodine excess goiters. However, in high iodine areas, those in the low UI concentration subgroup, people escape from iodine-excess-induced goiter for low iodine intake in a few of population, formulated the low goiter prevalence at the head of the curve; after the peak of the curve, as the UI concentration increases so the thyroid volume decreases, with the thyroid gland gradually becoming atrophic, formulated the lower goiter rate at the tail of the curve. Hence, most goiters in high iodine areas were induced by iodine excess rather than iodine deficiency.
There were several limitations in our study. For instance, the investigation points in each province varied in each of the 3 years. The high water iodine survey did not cover all villages with high iodine concentrations. The UI and water iodine were measured by the local Center for Disease Control and Prevention. All data concerning thyroid goiter was in relation to diffuse goiters, not nodular goiters. Despite these limitations, this investigation of areas with high water iodine and areas at high risk for iodine deficiency could provide scientific evidence to prevent goiter in different areas.
The exemplary USI program will continue to scientifically supply sufficient iodine to vulnerable populations in China. Meanwhile, the government will also continue to stop the sale of iodized salt in areas of iodine excess, to provide water with appropriate concentrations of iodine, and monitor goiter occurrence and iodine concentrations in the drinking water every year.
-
We are grateful for the assistance of the Centers for Disease Control in the 18 provinces (autonomous regions and municipalities).
-
CUI Si Lu performed the data analyses and wrote the manuscript; LIU Peng helped in data collection and performed the analysis with constructive discussions; SU Xiao Hui contributed significantly to analysis and manuscript preparation; LIU Shou Jun contributed to the conception of the study.


 Quick Links
 DownLoad:
