


HTML
-
Exposure to ultraviolet (UV) irradiance is a major etiological factor associated with skin cancer[1-4]. One of the worst consequences of the increased levels of UV irradiance on the Earth's surface resulting from the depletion of the stratospheric ozone is an increase in the incidence of skin cancer[5-11]. An approximate 1% decrease in ozone levels corresponds to a 1%-2% increase in the mortality caused by melanoma[12]. Likewise, a 10% decrease in the ozone levels will cause 300, 000 new non-melanoma and 4, 500 new melanoma skin cancer cases, according to the World Health Organization (WHO)[13]. Reasonable protection from UV irradiance can decrease both the face's exposure to UV irradiance and the incidence of skin cancer. Therefore, studying the distribution of UV irradiance is imperative for guiding reasonable public precautions.
The worldwide incidence of skin cancer has continued to increase. Strong epidemiological evidence demonstrates that sun exposure causes cutaneous melanoma and non-melanocytic skin cancer, and 90% of all skin cancer cases are non-melanoma[14]. The incidence of this disease is lower in darker-skinned individuals living in the same geographical area. The most common anatomical site of non-melanoma skin cancer is the face, which receives the most UV radiation. Moreover, facial skin is two to four times more sensitive than the skin on the limbs[15-17]. Previous studies have measured UV radiation from the horizontal, vertical, and angled planes to accurately determine the exposure at an anatomical site[18]. Other studies have also measured UV radiation using either human participants who wore instruments, i.e., electronic UV radiation (UVR) monitors, biological dosimeters, Bacillus subtilis spore film dosimeters and UVR-sensitive polysulfone film, located at the specific anatomical sites[19-24] or manikins to simulate exposure at specific anatomical sites[25-27]. However, many factors, including the solar elevation angle (SEA), altitude, ground reflection, total ozone, air pollutants, facial anatomy[28-36], and rotation angles relative to the sun, influence exposure to UV irradiation. The UV exposure level at an anatomical site provides the most direct evidence of the carcinogenicity of UV radiation in humans. Therefore, accurately measuring the UV radiation exposure at an anatomical site, particularly the face, using a manikin is significant.
Based on outdoor exposure, this study selected the cheek, nose, and forehead as representative facial sites for performing UV irradiance measurements using a rotating manikin and a spectroradiometer. UV-induced biological effects depend on the radiation wavelengths and the precision and accuracy of the relevant action spectra. We used the 300-400 nm non-melanoma action spectra proposed by CIE 2006[37] to calculate the skin exposure to biologically effective non-melanoma UV irradiance (UVBEnon-mel, in μW·cm-2·nm-1). The results of this study are important for increasing public awareness of exposure to UV radiation and the need to wear appropriate sun protection.
-
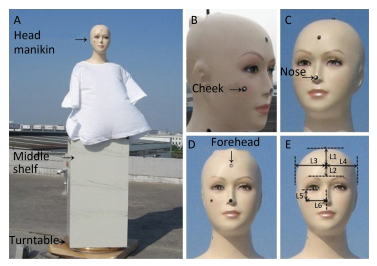
The experimental materials included a head manikin, a middle shelf, and a turntable base that rotated clockwise at a constant speed (6°·s-1; Figure 1A). The total height of the experimental manikin was 170 cm, and the distances between the ground and the cheek, nose and forehead of the manikin were approximately 155 cm, 155 cm, and 165 cm, respectively. A computer and a computer-controlled fiber-optic (FO) spectrometer with two detectors were placed on the shelf to measure the UV spectral irradiance intensity (in μW·cm-2·nm-1). One detector was placed at the top of the manikin's head, and its receiving surface was horizontally oriented to measure the ambient UV radiation levels. The other detector was placed tangential to one of the anatomical measurement sites, i.e., the cheek (Figure 1B), nose (Figure 1C), or forehead (Figure 1D), at its most anterior point. The measurement site of the cheek was 2.10 cm below the lower eyelid of the manikin (Figure 1E-L5) and 4.53 cm from the nasal septum (Figure 1E-L6). The precise measurement site of the nose was its tip. The measurement site of the forehead was 5.20 cm from the vertex of the manikin (Figure 1E-L1), 2.54 cm from the middle of the two eyebrow ridges (Figure 1E-L2) and 7.50 cm from the right and left sides of the manikin (Figure 1E-L3, L4). The detectors simultaneously recorded the UV radiation levels at the anatomical measurement sites and the corresponding horizontal ambient UV levels.
Figure 1. Experimental manikin (A) and the anatomical measurement sites on the head manikin: cheek (B), nose (C), and forehead (D).
-
The spectrometer and equipment calibration methods have been previously described by us previously[27].
-
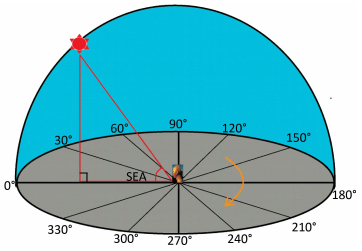
Before performing the measurements for the experiment, the measurement mode of the spectrometer was adjusted so that the detector collected data once per second and the duration of each measurement progression was 1 min. As Figure 2 shows, the rotating manikin was placed in a vertical standing position, and the initial position always faced the sun. The turntable base rotated clockwise at a constant speed (6°·s-1) to ensure that the manikin rotated 360° in 1 min. Sixty sets of cheek, nose and forehead exposure data and the corresponding horizontal ambient UV measurements were collected per manikin revolution to simulate actual UV exposures in 60 directions. The time between measurements was 15 min; we recorded the SEAs corresponding to the measurement time points. We defined the angle when the manikin was facing the sun as 0° and the angle when the manikin's back was to the sun as 180°.

Figure 2. UV measurements at various rotation angles. 0° represents the point at which the rotating manikin was facing the sun; the rotation angles increased as the manikin was rotated clockwise. The SEA is the angle complementary to the solar zenith angle (i.e., the angle between the line from the sun to the manikin and the line vertical to the ground).
-
The current studies were conducted in Dou Men in Zhejiang, China. The measurements were taken on near Shao Xing (30.09° N, 120.60° E, altitude 553 m) the roof of a hospital using an experimental apparatus with an unobstructed field of view. The measurements were performed only during periods with clear skies. Because of inopportune weather conditions, the cheek and horizontal ambient irradiance measurements were recorded on May 27, 2010, from 06:00 to 16:00, and the nose, forehead and corresponding horizontal ambient irradiance measurements were recorded on May 30, 2010, from 07:00 to 18:00 China Standard Time (CST). Solar noon occurred at approximately 12:00 CST, and the midday maximum SEAs on the measurement days were 82°. The total column ozone amounts on May 27 and 30, 2010, were 276 Dobson Units (DU) and 326 DU, respectively (according to the National Aeronautics and Space Administration, NASA; http://ozoneaq.gsfc.nasa.gov/ozone_overhead_current_v8.md). The mean air pollution index (API) was 62 on both measurement days.
-
The UVBE irradiance (in μW·cm-2·nm-1) was calculated using the following Equation (1):
$$ {\rm{UVBE}} = {\rm{ }}{\smallint _{{\rm{UV}}}}{\rm{S}}\left( \lambda \right){\rm{A}}\left( \lambda \right){\rm{d}}\left( \lambda \right) $$ (1) where S (λ) is the measured spectral irradiance (in μW·cm-2·nm-1 and 1 nm intervals), A (λ) is the action spectrum provided by CIE, and d (λ) is the wavelength increment (1 nm in this case). The S (λ) and the UVBE in 1 nm intervals were integrated using Origin Pro 8.0 to calculate the waveband UV radiation. In this study, UV radiation ranges of 300-320 nm (UVB) and 320-400 nm (UVA) were used, and we calculated the UVBEnon-mel interval as 1 nm and the integral summation from 300 to 400 nm.
The UV radiant exposure (H in J cm-2) for the specific time intervals was calculated according to the following Equation (2):
$$ {\rm{H}} = {\rm{ }}{\smallint _{\rm{T}}}{\rm{EdT}} $$ (2) where E is the UV irradiance [unweighted UV and UVBEnon-mel were used tocalculate H and the biologically effective UV radiant exposure (HBEnon-mel), respectively] and dT is the exposure time interval, which was used to calculate the UV radiant exposures H and HBEnon-mel.
Experimental Materials
Spectrometer and Equipment Calibration
Experimental Methods
UV Irradiance
Data Analyses
-
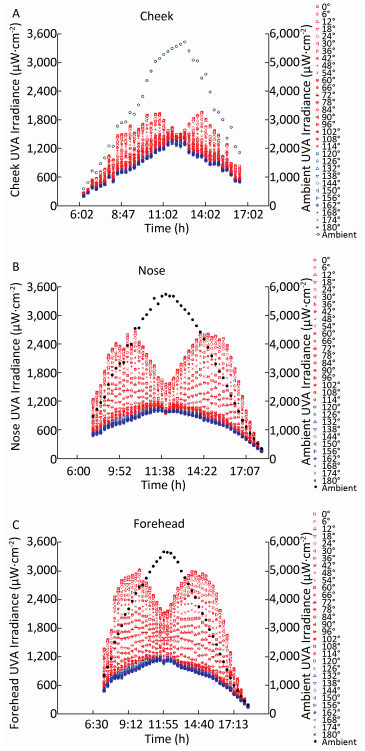
Figures 3A-C and 4A-C show the diurnal distribu-tions of UVA and UVB radiation exposure and the ambient UVA and UVB radiation at various rotation angles for the cheek, nose and forehead. The diurnal distribution trends for ambient UVA and UVB were normal, showing unimodal distribution with peaks at 12:00 CST, and the intensity values of the ambient UVA and UVB irradiance were approximately the same on May 27 and 30, 2010. The maximum ambient UVA and UVB intensities at 12:00 CST were 5724.18 and 323.63 μW·cm-2 on May 27, 2010, and 5747.92 and 337.85 μW·cm-2on May 30, 2010, respectively. In contrast, the diurnal distributions of UVA and UVB at the 0°-90° rotation angles and the three anatomical sites differed from those of the ambient, which exhibited bimodal distributions. The UVA irradiance at the cheek peaked at 10:15 and 13:30 CST, whereas the UVA irradiance peaks at both the nose and forehead occurred at 9:50 and 14:00 CST. At the 0° rotation angle, the UVA peaks at the cheek, nose and forehead were 1923.23, 2662.31, and 3030.46 μW·cm-2 in the morning, respectively, and 1894.54, 2614.58, and 2996.41 μW·cm-2 in the afternoon, respectively. The UVB peaks at the cheek, nose and forehead were 78.45, 117.55, and 136.82 μW·cm-2 in the morning, respectively, and 78.72, 112.38, and 121.34 μW·cm-2 in the afternoon, respectively. At the 96°-180° rotation angles, the diurnal distribution of the UVA and UVB irradiance at the three anatomical sites exhibited unimodal distributions with peaks at 12:00 CST that were similar to those associated with the ambient UV. However, the cheek, nose and forehead UVA peaks were 1417.29, 1022.94, and 1476.17 μW·cm-2, respectively, whereas the UVB peaks were 67.50, 53.58, and 77.71 μW·cm-2, respectively, and these values are markedly lower than those of the other rotation angles in the morning and afternoon.
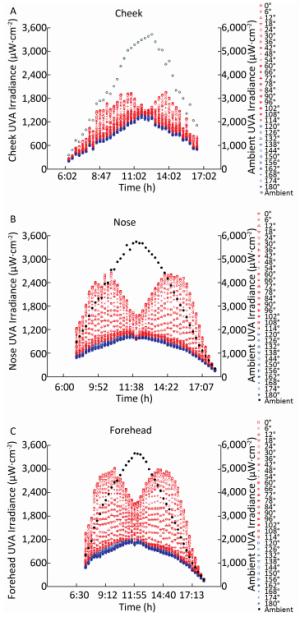
Figure 3. Diurnal distribution of UVA at various rotation angles for the (A) cheek, (B) nose, and (C) forehead. This figure is shown with two ordinates. The left and right ordinates show the three anatomical measurement sites (cheek, nose and forehead) and the ambient UVA irradiance, respectively. The hollow and solid circle icons show the ambient UVA irradiance on May 27 and 30, 2010, respectively.
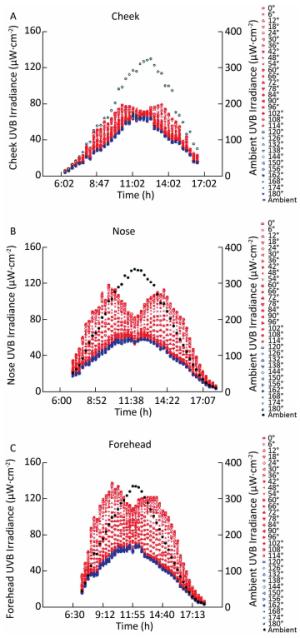
Figure 4. Diurnal distribution of UVB at various rotation angles: (A) cheek, (B) nose and (C) forehead. This figure is shown with two ordinates. The left and right ordinates show the three anatomical measurement sites (cheek, nose and forehead) and the ambient UVB irradiance, respectively. The hollow and solid circle icons show the ambient UVB irradiance on May 27 and 30, 2010, respectively.
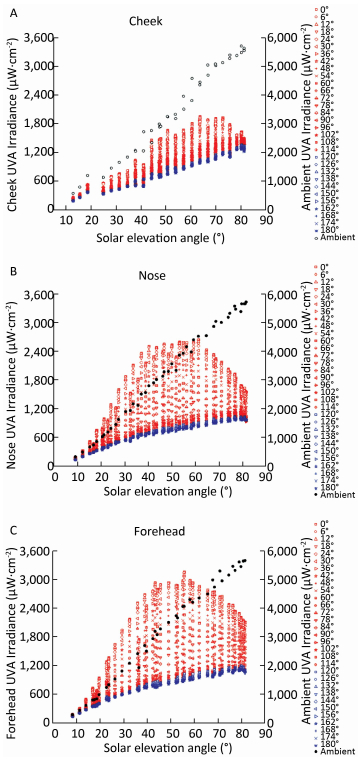
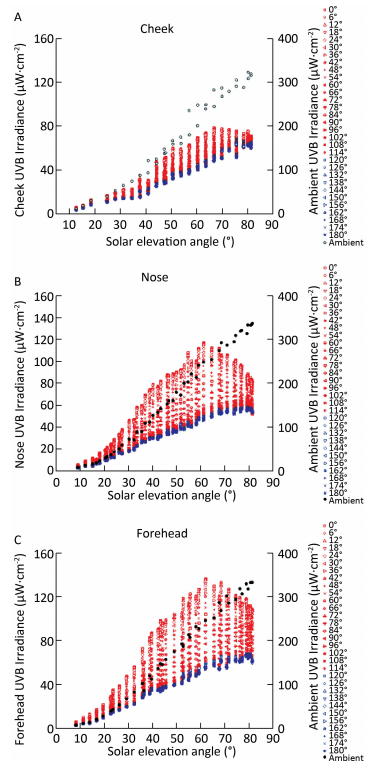
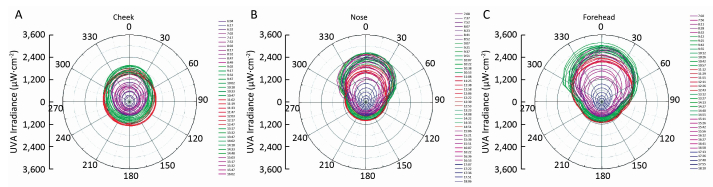
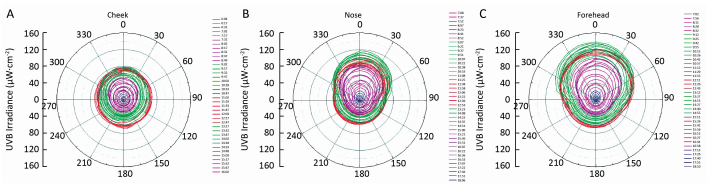
Figures 5 and 6 show the distributions of the cheek, nose and forehead UVA and UVB irradiances based on the SEA. At the rotation angles of 0°-90°, the UVA and UVB irradiance peaks at the cheek occurred at 65° SEA, whereas the nose and forehead exposure peaks occurred at 60° SEA. At higher rotation angles (96°-180°), the UVA and UVB irradiances at the three anatomical sites did not show much variation and were relatively low. Although the UVA and UVB irradiances at the rotation angles of 96°-180° increased as the SEA increased across the three anatomical sites, the maximum UVA and UVB exposure values were markedly lower than those of the 0°-90° rotation angles.
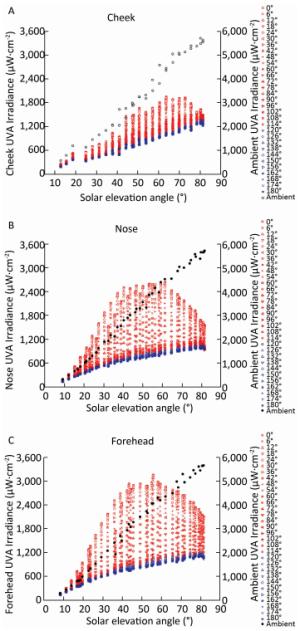
Figure 5. UVA changes with SEA at various rotation angles: (A) cheek, (B) nose, and (C) forehead. This figure is shown with two ordinates. The left and right ordinates show the three anatomical measurement sites (cheek, nose and forehead) and the ambient UVA irradiance, respectively. The hollow and solid circle icons show the ambient UVA irradiance on May 27 and 30, 2010, respectively.
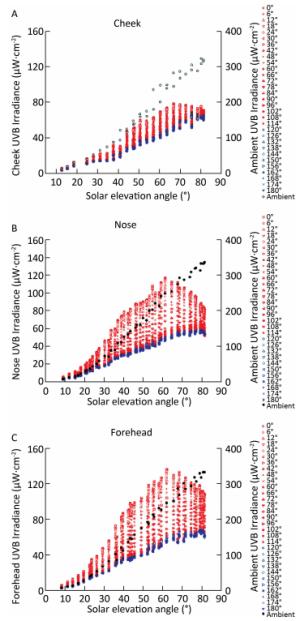
Figure 6. UVB changes with SEA at various rotation angles: (A) cheek, (B) nose, and (C) forehead. This figure is shown with two ordinates. The left and right ordinates show the three anatomical measurement sites (cheek, nose and forehead) and the ambient UVB irradiance, respectively. The hollow and solid circle icons show the ambient UVB irradiance on May 27 and 30, 2010, respectively.
-
Table 1 shows the exposure ratio of the three anatomical sites UVA and UVB radiant exposure to the ambient UVA and UVB radiant in 1-h intervals at the various rotation angles. We found that the ratio of UVA irradiance was significantly higher than the ratio for the UVB band over the same period, rotation angles and monitored anatomical sites. The ratios of the three anatomical sites for the same period and rotation angles for the UVA and UVB bands were, in increasing order, the cheek, nose and forehead. In descending order, the ratios for the rotation angles were from 0° to 180° for the same period and anatomical sites; these ratios were relatively lower and slightly different from both the UVA and UVB bands. At 11:00-13:00 CST (73-82° SEA), the ratios at the various rotation angles were relatively stable, ranging from 0.22 to 0.30, 0.18 to 0.32 and 0.20 to 0.42 at the cheek, nose and forehead for the UVA band, respectively, and from 0.18 to 0.24, 0.17 to 0.29, and 0.19 to 0.36 at the cheek, nose and forehead for the UVB band, respectively. However, before and after 12:00 CST, the ratios at the various rotation angles differed significantly, ranging from 0.21 to 0.51, 0.18 to 0.97 and 0.20 to 1.05 at the cheek, nose and forehead for the UVA band, respectively, and from 0.17 to 0.42, 0.18 to 0.68 and 0.19 to 0.80 at the cheek, nose and forehead for the UVB band, respectively. The maximum ratios occurred at SEA < 50°.
Site SEA (°) and Period (ST) 11-24 6:00-7:00 24-37 7:00-8:00 37-50 8:00-9:00 50-63 9:00-10:00 63-75 10:00-11:00 75-82 11:00-12:00 82-73 12:00-13:00 73-61 13:00-14:00 61-48 14:00-15:00 48-35 15:00-16:00 35-22 16:00-17:00 22-10 17:00-18:00 Cheek 0° 0.46 0.48 0.51 0.46 0.38 0.29 0.3 0.38 0.43 0.41 - - 30° 0.42 0.44 0.46 0.44 0.35 0.28 0.28 0.34 0.38 0.37 - - 60° 0.38 0.38 0.37 0.36 0.29 0.27 0.26 0.28 0.31 0.32 - - 90° 0.34 0.32 0.3 0.29 0.26 0.25 0.24 0.24 0.27 0.29 - - 120° 0.32 0.29 0.26 0.26 0.23 0.24 0.22 0.22 0.25 0.27 - - 150° 0.31 0.28 0.24 0.24 0.22 0.23 0.22 0.21 0.24 0.26 - - 180° 0.31 0.28 0.24 0.24 0.22 0.23 0.22 0.21 0.24 0.26 - - UVA Nose 0° - 0.82 0.77 0.62 0.46 0.31 0.32 0.47 0.64 0.85 0.97 0.83 30° - 0.75 0.7 0.57 0.42 0.28 0.3 0.44 0.58 0.77 0.85 0.73 60° - 0.59 0.53 0.44 0.33 0.23 0.23 0.35 0.42 0.54 0.59 0.56 90° - 0.39 0.33 0.27 0.23 0.19 0.19 0.22 0.25 0.3 0.35 0.42 120° - 0.32 0.26 0.22 0.2 0.19 0.18 0.2 0.21 0.26 0.31 0.39 150° - 0.3 0.24 0.2 0.19 0.18 0.18 0.19 0.2 0.24 0.3 0.39 180° - 0.29 0.23 0.2 0.19 0.18 0.18 0.18 0.2 0.24 0.3 0.39 Forehead 0° - 0.95 0.91 0.76 0.57 0.41 0.42 0.52 0.7 0.94 1.05 0.89 30° - 0.83 0.82 0.7 0.52 0.39 0.4 0.49 0.63 0.84 0.93 0.8 60° - 0.66 0.64 0.55 0.43 0.34 0.34 0.39 0.48 0.62 0.67 0.63 90° - 0.47 0.41 0.35 0.3 0.28 0.26 0.26 0.28 0.35 0.43 0.52 120° - 0.4 0.3 0.26 0.24 0.22 0.21 0.21 0.23 0.28 0.35 0.45 150° - 0.36 0.27 0.23 0.22 0.21 0.2 0.2 0.22 0.27 0.34 0.43 180° - 0.35 0.26 0.23 0.21 0.2 0.2 0.2 0.21 0.26 0.33 0.43 Cheek 0° 0.42 0.37 0.37 0.35 0.29 0.24 0.24 0.28 0.3 0.29 - - 30° 0.4 0.34 0.33 0.33 0.27 0.23 0.22 0.25 0.27 0.26 - - 60° 0.35 0.29 0.28 0.28 0.25 0.22 0.21 0.21 0.23 0.23 - - 90° 0.31 0.26 0.23 0.24 0.23 0.21 0.2 0.19 0.2 0.21 - - 120° 0.29 0.24 0.21 0.22 0.21 0.21 0.19 0.18 0.19 0.2 - - 150° 0.28 0.23 0.2 0.21 0.21 0.2 0.18 0.17 0.19 0.2 - - 180° 0.28 0.23 0.2 0.21 0.21 0.21 0.19 0.17 0.19 0.2 - - UVB Nose 0° - 0.66 0.58 0.5 0.39 0.27 0.29 0.38 0.47 0.59 0.64 0.68 30° - 0.61 0.54 0.46 0.36 0.25 0.27 0.36 0.42 0.53 0.57 0.58 60° - 0.5 0.43 0.37 0.29 0.21 0.22 0.29 0.32 0.39 0.42 0.43 90° - 0.36 0.29 0.25 0.22 0.18 0.19 0.21 0.22 0.26 0.29 0.33 120° - 0.31 0.25 0.22 0.2 0.18 0.18 0.19 0.2 0.23 0.27 0.31 150° - 0.29 0.23 0.2 0.19 0.17 0.17 0.19 0.19 0.23 0.26 0.31 180° - 0.29 0.23 0.2 0.18 0.17 0.18 0.19 0.19 0.23 0.27 0.31 Forehead 0° - 0.74 0.69 0.6 0.47 0.35 0.36 0.41 0.51 0.66 0.7 0.8 30° - 0.66 0.63 0.56 0.44 0.34 0.34 0.39 0.46 0.59 0.62 0.63 60° - 0.55 0.51 0.45 0.37 0.3 0.31 0.33 0.36 0.45 0.47 0.5 90° - 0.43 0.36 0.32 0.29 0.25 0.25 0.24 0.24 0.29 0.34 0.39 120° - 0.38 0.29 0.25 0.24 0.21 0.2 0.2 0.21 0.26 0.3 0.35 150° - 0.35 0.27 0.23 0.22 0.2 0.19 0.19 0.21 0.25 0.29 0.35 180° - 0.34 0.26 0.23 0.22 0.2 0.2 0.19 0.21 0.25 0.29 0.35 Note. 0°, 30°, 60°, 90°, 120°, 150°, 180°: typical rotation angles; '-': missing data. Table 1. Exposure Ratios of UVA and UVB to Ambient UVA and UVB at the Three Anatomical Sites at Typical Rotation Angles
-
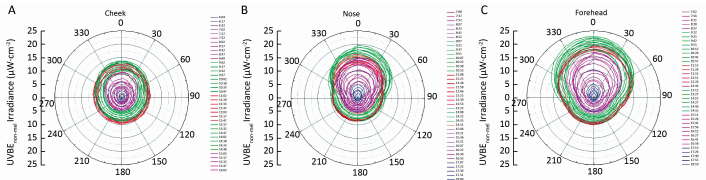
The distribution of the UVA and UVB exposures at the cheek, nose and forehead across various rotation angles differed from those of the ambient UVA and UVB exposures, which did not change with the rotation angle. Figures 7-9 show the cheek, nose and forehead UVA, UVB and UVBEnon-meldistributions by rotation angle, all of which decreased as the manikin rotated away from 0°; the maximum intensity occurred at 0°, and the minimum intensity occurred at 180°. The decreases in UVA, UVB, and UVBEnon-mel irradiance at the cheek did not significantly differ by rotation angles; the maximum decrease was only 42.39%. However, a significant decrease was found for the nose when the manikin was rotated from 0° to 90° and for the forehead when the manikin was rotated from 0° to 108°. The maximum decrease was 73.26% and 74.15% at the nose and forehead, respectively. The distributions of UVA, UVB and UVBEnon-mel were relatively low and stable between 90° and 270° at the cheek and nose and between 108° and 252° at the forehead. Higher levels of UVA, UVB, and UVBEnon-mel did not occur at midday (11:00-13:00 CST, 73°-82° SEA), which is shown in red; rather, they occurred in the morning (9:00-11:00 CST, 50°-75° SEA) and afternoon (13:00-15:00 CST, 48°-73° SEA), which are shown in green.
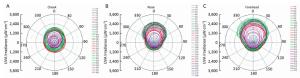
Figure 7. UVA changes with rotation angle: (A) cheek, (B) nose, and (C) forehead. The UVA irradiance levels at 11:00-13:00 CST are shown in red; those at 9:00-11:00 and 13:00-15:00 CST are shown in green; those at 7:00-9:00 and 15:00-17:00 CST are shown in magenta; and those before 7:00 CST and after 17:00 CST are shown in blue.
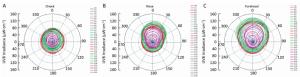
Figure 8. UVB changes with rotation angle: (A) cheek, (B) nose, and (C) forehead. The UVB irradiance levels at 11:00-13:00 CST are shown in red; those at 9:00-11:00 and 13:00-15:00 CST are shown in green; those at 7:00-9:00 and 15:00-17:00 CST are shown in magenta; and those before 7:00 CST and after 17:00 CST are shown in blue.
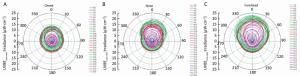
Figure 9. UVBEnon-mel changes with rotation angle: (A) cheek, (B) nose, and (C) forehead. The UVBEnon-mel irradiance levels at 11:00-13:00 CST are shown in red; those at 9:00-11:00 and 13:00-15:00 CST are shown in green; those at 7:00-9:00 and 15:00-17:00 CST are shown in magenta; and those before 7:00 CST and after 17:00 CST are shown in blue.
Table 2 shows the ratio of the cumulative the cheek, nose and forehead UVA, UVB, and UVBEnon-mel radiation exposure during a 2-h midday period to the exposure during a 2-h morning and afternoon period at typical rotation angles. The R1 and R2 based on rotation angles increased from 0° to 180°, typical rotation angles for all anatomical sites and wavebands. The R1 and R2 decreased in the order of the cheek, nose and forehead for all wavebands and typical rotation angles. For the cheek, the R1 and R2 of UVA, UVB and UVBEnon-mel were lower than 1 at the 0° typical rotation angles and higher than 1 at the other typical rotation angles. For the nose, the R1 and R2 of UVA, UVB, and UVBEnon-mel were lower than 1 at the 0°, 30°, and 60° typical rotation angles and higher than 1 at other typical rotation angles. For the forehead, the R1 and R2 of UVA, UVB and UVBEnon-mel were all lower than 1 from the 0° to 180° typical rotation angles.
Anatomical Site Waveband Ratio 0° 30° 60° 90° 120° 150° 180° Cheek UVA R1 0.92 1.00 1.05 1.17 1.24 1.26 1.26 UVA R2 0.94 1.01 1.15 1.25 1.29 1.29 1.29 UVB R1 0.96 1.05 1.13 1.21 1.25 1.27 1.28 UVB R2 0.98 1.15 1.29 1.38 1.42 1.42 1.44 UVBE R1 0.94 1.01 1.03 1.12 1.17 1.20 1.22 UVBE R2 0.99 1.07 1.23 1.33 1.35 1.36 1.38 Nose UVA R1 0.73 0.74 0.75 1.01 1.08 1.13 1.15 UVA R2 0.71 0.72 0.75 1.04 1.12 1.15 1.15 UVB R1 0.83 0.85 0.87 1.04 1.12 1.17 1.19 UVB R2 0.85 0.88 0.92 1.14 1.20 1.21 1.20 UVBE R1 0.79 0.80 0.81 1.05 1.06 1.12 1.13 UVBE R2 0.83 0.87 0.91 1.08 1.12 1.13 1.12 Forehead UVA R1 0.65 0.67 0.73 0.85 0.89 0.93 0.95 UVA R2 0.70 0.73 0.82 0.90 0.96 0.91 0.93 UVB R1 0.74 0.77 0.83 0.93 0.93 0.97 0.98 UVB R2 0.83 0.86 0.90 0.96 0.95 0.97 0.99 UVBE R1 0.72 0.74 0.81 0.91 0.90 0.93 0.95 UVBE R2 0.82 0.84 0.90 0.94 0.97 0.98 0.99 Note. R1: 2-h midday (11:00-13:00 CST) to 2-h morning (9:00-11:00 CST) cumulative radiation exposure; R2: 2-h noon (11:00-13:00 CST) to 2-h afternoon (13:00-15:00 CST) cumulative radiation exposure; 0°, 30°, 60°, 90°, 120°, 150°, 180°: typical rotation angles; R1 and R2 < 1: indicate that the higher risk periods were the 2-h morning and afternoon periods; R1 and R2 > 1: indicate that the higher risk period was the 2-h midday period; R1 and R2=1: indicate that the 2-h midday period had the same risk as the 2-h morning and afternoon periods. Table 2. The Ratio of the 2-h Midday Cumulative UVA, UVB and UVBEnon-mel Radiation Exposure to 2-h Morning and Afternoon Cumulative UVA, UVB, and UVBEnon-mel Radiation Exposure at the Three Anatomical Sites at Typical Rotation Angles (%)
-
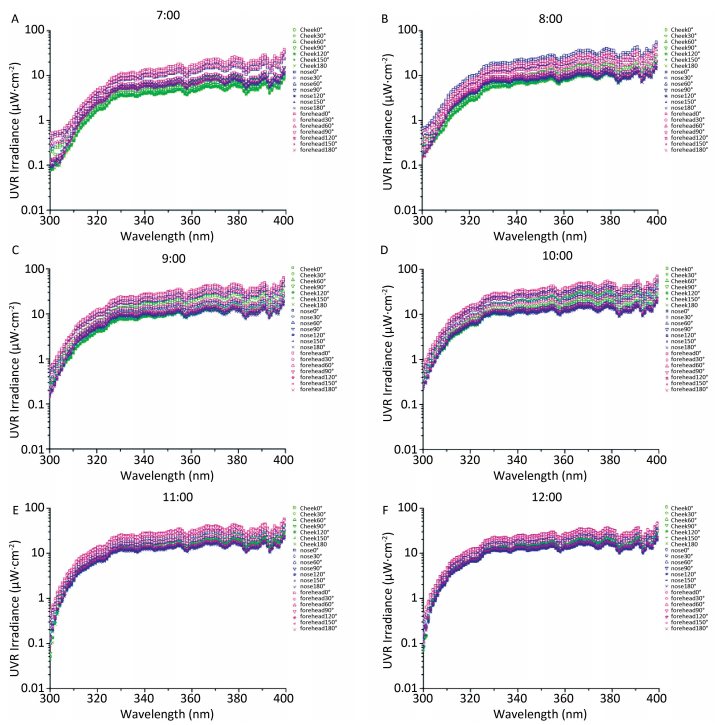
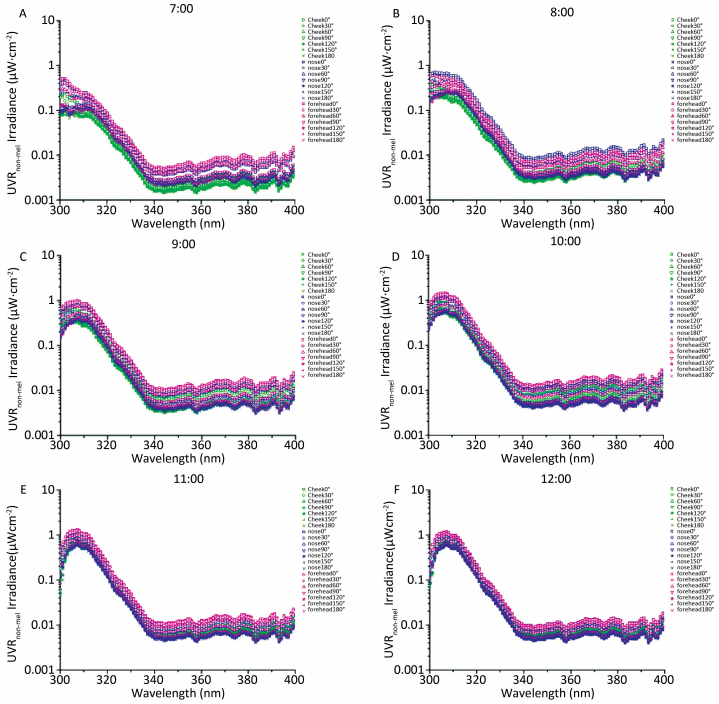
Figures 10A-F show that the cheek, nose, and forehead UVR irradiance distribution increased with increasing wavelengths at all the time points and all the typical rotation angles; significant increases were observed from 300 to 330 nm, and slight increases were observed from 330 to 400 nm.
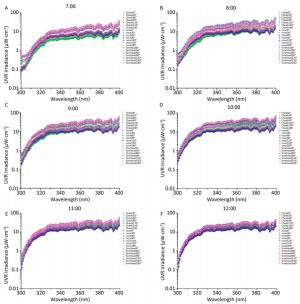
Figure 10. Spectral irradiance of the cheek, nose and forehead UVR at typical rotation angles across six time points.
Figures 11A-F show the cheek, nose, and forehead UVBEnon-mel irradiance distributions for all the time points and all the typical rotation angles. Between 7:00 and 8:00 CST, the cheek, nose, and forehead UVBEnon-mel irradiance decreased as the wavelength increased from 300-340 nm at the 0°, 30°, and 60° typical rotation angles. At the 90°, 120°, 150° and 180° typical rotation angles, the cheek, nose, and forehead UVBEnon-mel values increased slightly as the wavelength increased from 300-310 nm and decreased significantly as the wavelength increased from 310-340 nm. At 9:00, 10:00, 11:00, and 12:00 CST, the cheek, nose and forehead UVBEnon-mel irradiance values increased as the wavelength increased from 300-307 nm at all typical rotation angles and decreased significantly as the wavelength increased from 307-340 nm. The cheek, nose and forehead UVBEnon-mel irradiance distributions slightly increased as the wavelength increased at all the time points and all the typical rotation angles from 340 to 400 nm.
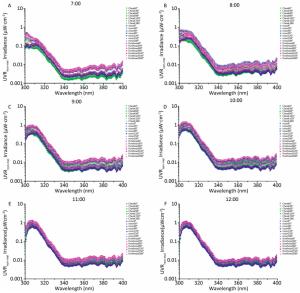
Figure 11. Spectral irradiance of the cheek, nose, and forehead UVBEnon-mel at typical rotation angles across six time points.
-
In this study, each spectrometer detector collected data once per second for the duration of each measurement progression (60 positions per rotation). Therefore, the average exposure of 360° (AVE 360°) was based on the UVBEnon-mel exposure at the three anatomical sites at all rotation angles (i.e., a full 360°), and the UVBEnon-mel exposure at 0° was considered the maximum exposure. The decreasing percentages of 1-h accumulated UVBEnon-mel radiant exposure for 0° compared with AVE 360° and the other five rotation angles (%) are shown in Table 3. The decreasing percentages based on rotation angles increased in the following order: 30° < 60° < AVE 360° < 90° < 120° < 150° < 180° for all periods and anatomical sites, and the percentages of decrease were relatively higher and slightly different. The minimum decreases in the percentage of UVBEnon-melradiant exposure from 0° to 30° can were 2.98, 6.76, and 5.1% for the cheek, nose, and forehead, respectively. The maximum decreases in the percentages of UVBEnon-mel radiant exposure from 0° to 180° can reach 48.41%, 69.48%, and 71.71% for the cheek, nose, and forehead, respectively.
Sites SEA (°) and Period (ST) 11-24 6:00-7:00 24-37 7:00-8:00 37-50 8:00-9:00 50-63 9:00-10:00 63-75 10:00-11:00 75-82 11:00-12:00 82-73 12:00-13:00 73-61 13:00-14:00 61-48 14:00-15:00 48-35 15:00-16:00 35-22 16:00-17:00 22-10 17:00-18:00 Cheek AVE 360° 30.1 28.36 31.39 26.16 22.32 9.14 15.91 26.77 27.65 24.95 30° 6.57 7.15 7.94 4.1 2.98 5.49 8.33 11.03 7.75 9.9 - - 60° 20.51 22.13 25.59 18.5 15.7 13.57 13.66 25.79 24.85 23.98 - - 90° 35.91 35.72 39.54 31.03 25.38 17.29 21.29 35.27 35.2 34.34 - - 120° 40.37 40.64 45.89 38.08 32.04 22.47 24.94 39.07 39.85 39.56 - - 150° 45.47 43.33 48.44 41.21 34.67 24.57 26.26 40.69 42.14 39.05 - - 180° 44.55 43.99 48.41 41.19 35.22 24.16 24.21 40.12 42.25 38.25 - - Nose AVE 360° - 43.72 44.47 42.4 37.05 28.51 29.69 37.41 42.18 45.08 48.1 51.06 30° - 10.55 9.67 7.66 7.12 8.64 8.55 6.76 10.29 11.05 13.88 19.18 60° - 31.42 30.47 27.48 25.33 26.2 27.7 25.75 32.86 36.46 41.06 46.24 90° - 53.93 54.08 52.17 45.51 36.52 38.45 48.3 56.26 60.48 64.22 66.61 120° - 60.24 61.17 58.78 50.91 39.43 42.57 52.9 59.95 64.57 67.22 68.93 150° - 62.58 63.81 61.91 53.84 41.06 42.62 53.86 61.39 65.45 67.76 68.48 180° - 63.84 64.95 62.92 54.74 42.16 42.86 54.13 61.45 65.33 67.31 69.48 Forehead AVE 360° - 40.78 45.1 41.66 36.01 29.21 30.89 38.14 41.37 45.21 46.61 53.87 30° - 14.8 9.49 8.47 7.81 5.69 5.1 6.71 9.85 11.99 12.54 27.1 60° - 31.6 28.22 26.62 23.28 16.27 15.96 22.83 30.83 35.05 36.65 48.63 90° - 50.77 51.82 50.45 42.33 32.5 33.29 45.33 55.64 60.69 59.5 65.97 120° - 57.32 62.13 60.97 53.27 45.82 48.08 56.39 61.13 64.96 66.89 71.48 150° - 61.03 64.99 64.26 56.07 47.92 49.9 58.53 62.76 66.19 67.64 71.62 180° - 62.44 66 65.07 56.93 48.28 49.54 58.24 62.39 66.06 67.73 71.71 Note. AVE 360°: the average UV irradiance of all the rotation angles; 30°, 60°, 90°, 120°, 150°, 180°: typical rotation angles; '-': missing data. Table 3. Decreasing Percentages of the 1-h Accumulated UVBEnon-mel Radiant Exposure for 0° to AVE 360° and Typical Rotation Angles (%)
Distribution of UVA and UVB at Various Rotation Angles
Exposure Ratios of UVA and UVB to Ambient UVA and UVB at the Three Monitored Anatomical Sites
UVA, UVB, and UVBEnon-mel Change with Rotation Angle
Spectral Irradiance of UVR and UVBE at Typical Rotation Angles
Decreasing Percentages of UVBEnon-mel Radiant Exposure for 0° to Other Rotation Angles (%)
-
In this study, a rotating manikin and a spectroradiometer were used to simultaneously measure the ambient UV spectrum irradiance and exposure at three selected anatomical sites on the face, namely the cheek, nose and forehead. The manikin could be rotated clockwise at a constant speed (6°·s-1) based on a turntable base; the spectrometer collected data automatically once per second, and the duration of each measurement progression was 1 min. Thus, sixty sets of data from the monitored anatomical sites and horizontal ambient UV irradiance measurements were collected per manikin revolution. This study showed that the diurnal distributions of ambient UVA and UVB were normal, with peaks occurring at 12:00 CST, and the intensities of the ambient UVA and UVB irradiance were approximately the same on both measurement days. The total column ozone amounts on both measurement days (May 27 and 30, 2010) were 276 and 326 DU, respectively. Common sense would suggest that lower total column ozone levels would correspond to higher UV radiation levels; however, the total ozone values in our research were obtained from NASA (http://ozoneaq.gsfc.nasa.gov/ozone_overhead_current_v8.md), which monitors ozone using satellites, while our measurements were performed near the ground, at the bottom of the troposphere. The average troposphere in the mid-latitudes is 10 to 12 km, which includes some factors that influence the UV near the ground. Therefore, in this study, the ambient UV radiation was not inverse to the total column ozone. However, on both measurement days, the mean API was approximately 62, and the skies were clear. Previous studies have shown that air pollutants can reduce the surface levels of UV radiation[38] because a greater API is associated with lower levels of UV radiation. Therefore, the results on both days show that the distribution of UV radiation intensities was related to air quality.
The relative orientation of an individual's anatomical sites to the sun can be random and are constantly changing during outdoor activities. The results of this study show that the maximum and minimum UV radiant exposures at the three selected anatomical sites occurred when the sites faced the sun and when they faced away from the sun, respectively. At rotation angles of 0°-90° for SEA, the UVA and UVB irradiance peaks at the cheek occurred at 65° SEA, whereas the UVA and UVB irradiance peaks at the nose and forehead both occurred at 60° SEA. At rotation angles of 96°-180°, the UVA and UVB irradiance values of the three anatomical sites were relatively low, showed little variation according to rotation angle and peaked at the highest SEA. These results were obtained because at rotation angles of 0°-90°, the anatomical sites received direct UV radiation as well as scattered and ground-reflected UV when the SEA was lower than its critical value, and the total UV exposure increased with increasing SEAs. When the SEA was higher than its critical value, the direct UV radiation was blocked, and the anatomical sites received only scattered and ground-reflected UV; therefore, the total UV exposure was reduced. However, at rotation angles of 96°-180°, the anatomical sites received only scattered and ground-reflected UV at all SEA ranges. In addition, the current study clarified the influence of various rotation angles: UVA, UVB and UVBE exposure decreased when the manikin was turned away from the sun. The maximum decreases were approximately 42.39% and 73.26% between 0° and 90° at the cheek and nose, respectively, and 74.15% between 0° and 108° at the forehead at a lower SEA. The results of this research indicate that the higher risk period for cheek, nose, and forehead differed for different rotation angles. The high-risk periods were the 2-h morning and afternoon periods at 0° typical rotation angles for the cheek; 0°, 30°, and 60° typical rotation angles for the nose; and all typical rotation angles for forehead. Based on the above results, we recommend that individuals pay attention to specific orientations of the anatomical site relative to the sun and the rotation angles relative to the sun's position, and we recommend that individuals take appropriate protective measures to reduce skin UV injury, in addition to noon (11:00-13:00 CST), morning (9:00-11:00 CST) and afternoon (13:00-15:00 CST) protection should pay more attention.
For many years, UV exposure ratios have been used to assess individual UV exposure[26, 39-44]. This study shows the exposure ratios of the cheek, nose and forehead UVA and UVB radiant exposures to ambient UVA and UVB at 1-h intervals and throughout the day at various rotation angles. A considerable number of studies have been performed using manikins[26, 39-44], particularly upper body units, to research the exposure ratio when facing the sun, which corresponds to a rotation angle of 0°. The UV exposure ratios at the nose for a rotation angle of 0° are not comparable to previously published data for several reasons, including the UV exposure measurement techniques used in other studies. The UV exposure ratio at the cheek and forehead at a rotation angle of 0° obtained in this study is higher than that measured by Airey[39], Gies[40], Holman[41]. Our data are lower than those reported by Diffey[42-43], Wong et al.[44], and Hu et al.[26]. These discrepancies might be mainly due to differences in the type of UV measurement instrument and the instrument placement method (i.e., in this study, the UV detector was placed tangentially on the anatomical measurement sites, whereas other studies placed the solar UV sensor on the surface areas of the measurement sites) or by geographical positions and the timing of measurements. The measurement locations at the forehead and cheek of the manikin used in the aforementioned studies were not standardized, which could also explain the differences in UV exposure values.
It is known that the UV-induced biological effects depend on the wavelengths of the radiation and the distribution of biologically effective UV irradiance (UVBE), which constitutes the basis for risk assessment. The unweighted UVR irradiance distribution increased as the wavelength increased at all time points and for all typical rotation angles. The biological damage to human bodies caused by UV irradiance depends on the UVBE irradiance. In this study, the UVBEnon-mel irradiance distribution differed from that of the unweighted UVR. The wavelength corresponding to the peak UVBEnon-mel irradiance differed across various time points and typical rotation angles. At 7:00 and 8:00 CST ( < 40° SEA), the UVBEnon-mel irradiance decreased as the wavelength increased from 300 to 340 nm at the 0°, 30°, and 60° typical rotation angles; from 90° to 180°, the peak UVBEnon-mel was 310 nm. From 9:00 to 12:00 CST (40°-81° SEA), the peak UVBEnon-mel was 307 nm at all typical rotation angles.
People can reduce their UV exposure by facing away from the sun. This study showed the degree to which the accumulated UVBEnon-mel radiant exposure decreases by facing away from the sun. For all periods and anatomical sites, the percentages of decrease in the 1-h accumulated UVBEnon-mel radiant exposure for 0° compared with AVE 360° and the other five rotation angles (%) increased in the following order: 30° < 60° < AVE 360° < 90° < 120° < 150° < 180°. We can deduce that the UVBEnon-mel radiant exposure decreases in the order 30° > 60° > AVE 360° > 90° > 120° > 150° > 180°. In theory, the probability of individual exposure to different rotation angles is equal, so the radiant exposure for the AVE 360° is a basic exposure level. Therefore, individuals should avoid 60° rotation angles facing away from the sun to reduce UV exposure.
This study demonstrated that the diurnal distribution of SEAs ranged from 10° to 81°. The ground surface was an asphalt-covered concrete roof, the selected anatomical sites of the manikin were fixed, and the measurements were performed under clear skies. The results might differ under different conditions, including climate, geography, weather, API and surface albedo. Furthermore, additional research should be conducted. However, the current study provides important data that can help the public recognize the danger of facial exposure to UV radiation at various rotation angles outdoors under clear skies.
-
WANG Fang: UV radiance measurement and write thesis; YU Jia Ming: graphing; YANG De Qi calculated the UV radiance exposure; GAO Qian: UV radiance measurement; HUA Hui: data Processing; LIU Yang: design this experimental.
-
Authors declare there are not any competing financial interests in relation to the work described.
Program for Liaoning Innovative Research Team in University LT2015028
National Natural Science Foundation of China 81273034

 Quick Links
 DownLoad: