


HTML
-
Arsenic is a ubiquitous trace element that is widely distributed in the environment. Groundwater used for drinking in many countries of the world is contaminated by naturally occurring arsenic[1-2]. The toxicity of arsenic in drinking groundwater has become a major problem worldwide[3]. Epidemiological studies have suggested that long-term exposure to arsenic in drinking water is associated with skin lesions, peripheral vascular disease, hypertension, black foot disease, and a high risk of cancer including skin, lung, bladder, liver, and possibly kidney cancer[4-16].
In general, the toxicity of arsenic depends on the chemical forms in which it is present in the environment and in the organism[17]. Arsenic-related health effects are correlated with arsenic exposure dose and exposure duration, arsenic compounds, arsenic metabolism, and arsenic methylation capacity. Steinmaus et al. (2010) reported that inter-individual differences in arsenic metabolism played an important role in arsenic-related disease[18]. Ahsan et al. (2007) suggested that arsenic metabolism and differences in urinary arsenic metabolites and their joint distributions usually affected arsenic toxicity[19]. Higher MMA% (monomethylated arsenic), lower DMA% (dimethylated arsenic), or lower DMA/MMA in urine was correlated with skin lesions, skin cancer, bladder cancer, peripheral vascular disease, muscle cramps, and structural chromosomal aberrations in peripheral lymphocytes[20]. A negative relationship between arsenic metabolism efficiency and the risk of skin lesion has been observed[21]. Higher MMA% in urine carries a greater risk of skin lesions[22]. Yang et al. (2015) suggested that MMA may have a greater toxic effect on hyperkeratosis, whereas DMA and iAs (inorganic arsenic, including AsⅢ and AsⅤ) may have a greater toxic effect on depigmentation or pigmentation[23]. Subjects with skin lesions may have lower arsenic methylation capacity than those without skin lesions[24].
In recent years, a few studies have been conducted to investigate chronic arsenic toxicity via drinking water consumption associated with hypertension. The results supported a role of environmental arsenic exposure in hypertension[25-27]. The risk of hypertension was usually influenced by arsenic exposure, arsenic methylation capacity, and the profile of arsenic metabolites in the urine. Positive correlations between long-term arsenic exposure and increasing blood pressure (BP) were observed[28-29]. Cumulative arsenic exposure (CAE) was positively associated with the prevalence of hypertension. Meanwhile, higher MMA concentra-tions in the urine may increase susceptibility to hypertension. Lower DMA% may be correlated with increasing hypertension[30]. Li et al. (2015) suggested that inefficient arsenic methylation capacity was associated with hypertension[31]. Osorio-Yáñez et al. (2015) also revealed that early-life exposure to iAs was significantly associated with higher BP[32]. However, Islam et al. (2012) indicated an association between higher levels of arsenic in drinking water or duration of exposure and pulse pressure (PP), but not hypertension[33]. More evidence should be provided to support the relationship between arsenic exposure and hypertension.
Therefore, the relationships between arsenic exposure, arsenic metabolism, arsenic methylation capacity, and BP were investigated for a cohort from Inner Mongolia, China. The main objective of the present study was to analyze the BP associated with CAE. The risk factors of abnormal BP were also investigated.
-
The study was conducted in Hanghou County of Inner Mongolia, China. Populations living in this area mainly rely on groundwater for drinking and domestic use. Arseniasis caused by consumption of drinking groundwater containing high levels of naturally occurring arsenic has been reported[34]. The lowest prevalence of skin lesions in females and males were 8.1% and 15.6%, observed in the < 20-year age group. This value increased to 59.3% in the 51-60-year age group of for males[23]. In the present study, the highest arsenic concentration in groundwater was 824.70 μg/L.
The study setting was home-based. Residents who had lived in the study area for more than 10 years were considered as eligible subjects. Residents who had consumed seafood in the past week and who were taking anti-hypertensive drugs were excluded. Pregnant and breastfeeding women were also excluded. Finally, 560 residents, including 399 (71.25%) females and 161 (28.75%) males, were selected as study subjects. The demographic characteristics of the study subjects are listed in Table 1. Informed consent was read and signed by all subjects before performing a detailed interview. Information about demographic characteristics, socioeconomic status, cigarette smoking and alcohol consumption history, dietary habits, type of work, medical history, and education level attained were obtained by well-trained interviewers using a structured questionnaire. The measurement of standing height and body weight were conducted by trained physicians. Body mass index (BMI) was computed as weight in kilograms divided by height in square meters. The results are represented in Table 1. The present study was conducted according to the Declaration of Helsinki Ethical Principles for Medical Research Involving Human Subjects.
Variables The arsenic levels in drinking water ≤ 10 μg/L 10-100 μg/L 100-300 μg/L > 300 μg/L Age 38.24 39.60 34.69 39.21 Gender Female (n = 399) 79 (69.91%) 127 (83.01%) 115 (64.97%) 78 (66.67) Male (n = 161) 34 (30.09%) 26 (16.99%) 62 (35.03%) 39 (33.33) Smoking Smoker 39 (34.51%) 39 (25.49%) 61 (34.46%) 43 (36.75%) Non-smoker 74 (65.49%) 114 (74.51%) 116 (65.54%) 74 (63.25%) Alcohol Drinker 8 (7.08%) 13 (8.50%) 29 (16.38%) 21 (17.95%) Non-drinker 105 (92.92%) 140 (91.50%) 148 (83.62%) 96 (82.05%) BMI < 18.5 8 (7.08%) 4 (2.62%) 8 (4.52%) 9 (7.69%) 18.5-25 72 (63.72%) 109 (71.24%) 130 (73.45%) 63 (53.85%) > 25 33 (29.20%) 40 (26.14%) 39 (22.03%) 45 (38.46%) Table 1. The Characteristics of the Study Subjects
-
Approximately 50 mL first-morning void urine was obtained from each subject in 100 mL polypropylene tubes. A total of 560 urine samples were collected. The collected urine samples were immediately kept in an icebox. Within 8 h, all the urine samples were transferred to the Inner Mongolia Center for Endemic Disease Control and Research in Hohhot and stored at -20 ℃ in a low-temperature refrigerator. Then, the urine samples were kept in an icebox and transported to the Laboratory of Arsenic Analysis in the Institute of Geographic Sciences and Natural Resources Research, CAS (Beijing, China), and stored in a low-temperature refrigerator for further analysis. Similarly, 50 mL of groundwater from tube wells used for drinking were collected from each of the studied households. Each family had their own well. Tube well water was pumped for approximately 5 min to collect water at the tip of the tap, and samples were then collected. The water samples were stored in clean 100-mL bottles at -20 ℃ in a low-temperature refrigerator.
-
BP was measured by trained clinicians using the standard protocol recommended by the World Health rganization[35]. Each subject's BP was measured three times with a mercury sphygmomanometer in a sitting position after rest for at least 15 min. Systolic blood pressure (SBP) and diastolic blood pressure (DBP) were defined at the first and fifth Korotkoff sounds, respectively. The average value of the three measurements was taken as the proper value. An abnormal BP was defined as an average SBP ≥ 140 mmHg, or an average DBP ≥ 90 mmHg. PP was calculated by deducting DBP from SBP. A PP (pulse pressure) ≥ 55 mmHg was considered abnormal[36].
-
A high-performance liquid chromatography/ hydride generator (HPLC) was used to separate arsenic species in urine[37]. The concentrations of iAs, MMA, and DMA in urine samples were determined by inductively coupled plasma mass spectrometry (ICP-MS). Total arsenic content in drinking water was determined by HPLC and ICP-MS. The detection limit of this method for arsenic species was 1 ng. A standard reference material containing 1000 mg/L iAs, MMA, and DMA (National Center for Standard Reference Materials) was used to check the validity of urinary arsenic species measurement. The reliability of arsenic species determination was evaluated in terms of the analytical recovery rate for added arsenic species. The recovery rate was 83%-94% for iAs, 91%-97% for MMA, and 90%-102% for DMA.
-
CAE was assessed for each subject according their detailed water consumption history, exposure duration (years), and the number of days each subject stayed at home in each year. Lifetime CAE was defined as C × W × Y × D/1000 mg/L, where C is the arsenic concentration (μg/L) in the drinking water, W is the daily water consumption, Y is the exposure duration (years), and D is the number of days each subject stayed in the local home in each year.
Total arsenic concentration in urine (TAs) was the sum of arsenic metabolites, i.e., iAs + MMA + DMA. The arsenic methylation indices were defined as the percentages of respective arsenic species in urine. Therefore, the primary methylation index (PMI) was calculated as the ratio between MMA + DMA and TAs, and the secondary methylation index (SMI) was calculated as the ratio between DMA and MMA + DMA[38].
The Student's t-test and ANOVA were applied to evaluate the differences in urinary arsenic metabolites between the groups. A linear regression model was performed to analyze the relationships between BP (SBP, DBP, and PP) and CAE. Logistic regression models were further applied to estimate the multivariate-adjusted odds ratios (ORs) and their 95% confidence intervals (CIs) for the risk of abnormal BP. The models were constructed by the various arsenic metrics individually tested with adjustment for age, sex, BMI, etc.
In this study, all statistical analyses were performed using SPSS 18.0 software and Microsoft Excel 2007.
Study Area and Subjects
Sample Collection
Blood Pressure (BP) Measurement
Sample Procedure
Statistical Methods
-
The BP, including SBP, DBP, and PP, is listed in Table 2. It can be seen that the DBP, SBP, and PP were significantly different among the age groups. The values usually increased with age. The SBP and DBP varied slightly between males and females, whereas males had obviously higher PP than females. The SBP, DBP, and PP were significantly increased with the BMI of the study subjects. The DBP was considerably higher for smokers than for non-smokers, and the values of SBP and PP were slightly higher for smokers. The DBP, SBP, and PP varied slightly between drinkers and non-drinkers. Moreover, the DBP, SBP, and PP were usually higher in subjects with skin lesions than in those without skin lesions. Among subjects exposed to different levels of arsenic in drinking water, the DBP and SBP varied greatly, while the PP varied slightly. Subjects who were exposed to arsenic levels in the range of 10-100 μg/L in drinking water had the highest DBP and SBP.
Items DBP SD SBP SD PP SD Age < 30 76.82 7.67 120.32 9.99 43.52 5.56 30-50 84.91 11.35 129.07 16.06 44.16 8.19 > 50 89.93 14.57 137.64 22.40 48.09 10.93 P (ANOVA) < 0.0001 < 0.0001 < 0.0001 Gender Male 83.49 12.52 128.65 18.22 45.17 8.96 Female 83.66 11.06 127.12 14.28 43.73 6.46 P (t-test) 0.879 0.292 0.034 BMI < 18.5 75.75 9.54 118.82 12.22 43.09 5.26 18.5-25 82.45 11.64 126.74 16.67 44.41 8.21 > 25 89.01 11.83 135.17 17.50 46.19 9.36 P (ANOVA) < 0.0001 < 0.0001 0.025 Smoking Y 85.44 10.90 129.99 15.71 44.79 8.23 N 82.79 12.49 127.51 17.69 44.74 8.38 P (t-test) 0.020 0.126 0.951 Alcohol Y 84.84 9.21 129.10 13.20 44.19 6.90 N 83.37 12.43 128.10 17.63 44.83 8.50 P (t -test) 0.364 0.664 0.568 Skin lesion With 85.28 11.83 129.99 17.75 44.91 9.12 Without 82.75 12.17 127.41 16.88 44.69 7.97 P (t-test) 0.022 0.100 0.773 As content (μg/L) < 10 84.32 11.46 129.12 16.30 44.86 8.02 10-100 85.29 13.35 130.37 18.81 45.09 9.31 100-300 81.51 10.63 125.14 14.26 43.60 6.54 > 300 83.55 12.81 129.14 19.27 45.97 9.51 P (ANOVA) 0.034 0.033 0.105 Table 2. Blood pressure for the study subject
-
The concentrations and proportions of arsenic metabolites and the arsenic methylation capacity index are displayed in Table 3. The concentrations of iAs, MMA, DMA, and TAs in the urine of subjects with DBP higher than 90 mmHg were 59.32, 52.44, 228.08, and 339.44 μg/L, respectively, whereas the values for subjects with DBP lower than 90 mmHg were 49.97, 44.17, 187.55, and 281.09 μg/L, respectively. Similarly, subjects with SBP higher than 140 mmHg had higher urinary contents of iAs, MMA, DMA, and TAs than subjects with SBP lower than 140 mmHg. In addition, higher urinary concentrations of iAs, MMA, DMA, and TAs were observed for subjects with PP higher than 55 mmHg.
Variables DBP SBP PP > 90 mmHg < 90 mmHg P > 140 mmHg < 140 mmHg P > 55 mmHg < 55 mmHg P iAs 59.32 49.97 0.195 54.80 51.50 0.668 56.48 51.60 0.612 MMA 52.44 44.17 0.210 49.95 45.17 0.472 45.65 46.16 0.950 DMA 228.08 187.55 0.075 221.47 191.04 0.274 208.00 195.56 0.683 TAs 339.44 281.09 0.091 325.76 287.11 0.350 310.12 292.67 0.705 iAs% 15.81 15.74 0.933 14.78 16.00 0.163 14.78 15.88 0.313 MMA% 13.89 14.13 0.613 13.57 14.19 0.214 13.91 14.09 0.781 DMA% 70.30 70.13 0.867 71.65 69.81 0.088 71.30 70.03 0.399 PMI 0.84 0.83 0.933 0.85 0.84 0.193 0.85 0.84 0.313 SMI 0.83 0.83 0.527 0.84 0.83 0.092 0.84 0.83 0.512 Table 3. Urinary arsenic metabolites and methyllation capacity index of the subjects
The table also shows that the iAs%, MMA%, and DMA% in urine varied slightly between subjects with abnormal BP (DBP and SBP higher than 90 and 140 mmHg, respectively) and with normal BP (DBP and SBP lower than 90 and 140 mmHg, respectively). Moreover, the iAs%, MMA%, and DMA% in urine were similar between subjects with normal and abnormal PP. The primary and secondary arsenic methylation capacity were slightly higher in subjects with abnormal PP than in those with normal PP, according to the PMI and SMI.
-
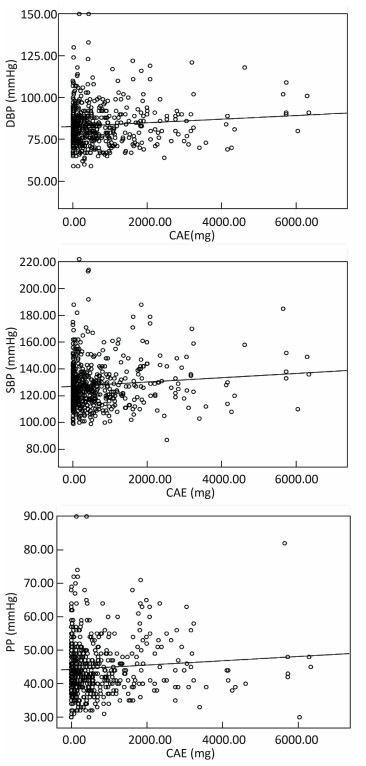
Figure 1 represents the relationships between blood pressure and cumulative arsenic exposure. The results indicated that positive correlations were observed between CAE and DBP, CAE and SBP, and CAE and PP.
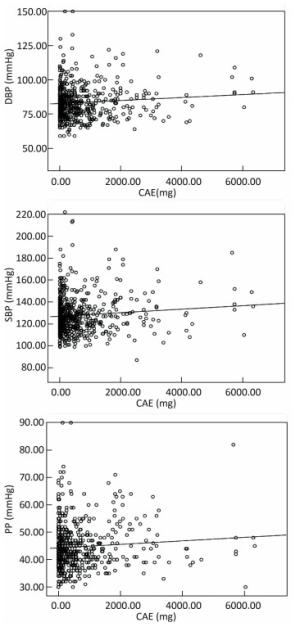
Figure 1. The relationships between blood pressure and cumulative arsenic exposure.
-
The ORs for abnormal DBP, SBP, and PP for the concentrations and proportions of urinary arsenic speciation, arsenic methylation capacity, and skin lesion status are listed in Tables 4-6.
Variables Crude ORs Adjusted ORs OR 95% CI P OR 95% CI P Gender 1.247 0.816, 1.906 0.307 2.316 1.225, 4.379 0.010 Age 1.075 1.055, 1.095 0.000 1.077 1.054, 1.100 0.000 Smoke 0.665 0.437, 1.013 0.058 1.642 0.916, 2.945 0.096 Alcohol 0.874 0.478, 1.601 0.663 1.430 0.662, 3.088 0.362 BMI 1.162 1.104, 1.223 0.000 1.110 1.054, 1.169 0.000 Skin lesions 1.630 1.082, 2.455 0.019 0.881 0.553, 1.403 0.594 iAs 1.002 0.999, 1.004 0.197 1.002 0.999, 1.005 0.216 MMA 1.002 0.999, 1.005 0.187 1.001 0.997, 1.004 0.761 DMA 1.001 1.000, 1.002 0.077 1.000 0.999, 1.001 0.437 TAs 1.000 1.000, 1.001 0.093 1.000 1.000, 1.001 0.410 iAs% 1.001 0.977, 1.025 0.933 1.033 1.003, 1.064 0.033 MMA% 0.989 0.949, 1.031 0.612 0.960 0.917, 1.006 0.087 DMA% 1.002 0.982, 1.022 0.865 0.989 0.966, 1.013 0.378 PMI 0.999 0.975, 1.023 0.933 0.968 0.940, 0.997 0.030 SMI 1.011 0.979, 1.043 0.516 1.023 0.986, 1.061 0.226 Table 4. The relationship between urinary as levels and DBP in study subjects
Variables Crude ORs Adjusted ORs OR 95% CI P OR 95% CI P Gender 0.607 0.367, 1.002 0.051 0.727 0.346, 0.971 0.400 Age 1.105 1.079, 1.131 0.000 1.107 1.079, 1.136 0.000 Smoke 0.744 0.474, 1.166 0.197 1.328 0.712, 2.477 0.372 Alcohol 1.161 0.584, 2.308 0.096 0.918 0.368, 2.289 0.854 BMI 1.169 1.108, 1.234 0.000 1.117 1.058, 1.179 0.000 Skin lesions 1.774 1.151, 2.735 0.009 0.931 0.563, 1.541 0.781 iAs 1.001 0.998, 1.003 0.668 1.002 0.998, 1.005 0.340 MMA 1.001 0.998, 1.004 0.472 1.000 0.997, 1.004 0.813 DMA 1.001 1.000, 1.001 0.211 1.000 0.999, 1.001 0.724 TAs 1.000 1.000, 1.001 0.295 1.000 1.000, 1.001 0.640 iAs% 0.980 0.953, 1.008 0.164 1.026 0.992, 1.062 0.129 MMA% 0.972 0.930, 1.016 0.214 0.955 0.907, 1.005 0.955 DMA% 1.020 0.997, 1.042 0.085 0.996 0.970, 1.023 0.758 PMI 1.020 0.992, 1.050 0.164 0.974 0.942, 1.008 0.129 SMI 1.030 0.995, 1.067 0.094 1.029 0.988, 1.072 0.167 Table 5. The relationship between urinary as levels and SBP in study subjects
Variables Crude ORs Adjusted ORs OR 95% CI P OR 95% CI P Gender 0.327 0.152, 0.703 0.004 0.367 0.139, 0.971 0.044 Age 1.089 1.060, 1.118 0.000 1.084 1.054, 1.116 0.000 Smoke 0.753 0.431, 1.319 0.322 0.824 0.404, 1.679 0.594 Alcohol 2.746 0.835, 9.031 0.096 1.691 0.418, 6.838 0.461 BMI 1.079 1.025, 1.136 0.004 1.039 0.979, 1.104 0.208 Skin lesions 1.046 0.595, 1.837 0.876 0.626 0.334, 1.173 0.144 iAs 1.001 0.997, 1.004 0.612 1.003 0.999, 1.006 0.152 MMA 1.000 0.996, 1.004 0.950 1.000 0.996, 1.005 0.935 DMA 1.000 0.999, 1.001 0.682 1.000 0.999, 1.001 0.964 TAs 1.000 0.999, 1.001 0.705 1.000 1.000, 1.001 0.741 iAs% 0.982 0.947, 1.017 0.313 1.027 0.990, 1.067 0.156 MMA% 0.992 0.938, 1.049 0.781 0.998 0.938, 1.061 0.946 DMA% 0.992 0.938, 1.049 0.781 0.982 0.952, 1.013 0.251 PMI 1.019 0.983, 1.056 0.313 0.973 0.937, 1.010 0.182 SMI 1.014 0.972, 1.059 0.512 0.993 0.946, 1.044 0.793 Table 6. The relationship between urinary as levels and PP in study subjects
Table 4 shows that subjects with skin lesions had a higher risk of abnormal DBP than those without skin lesions (OR: 1.630, 95% CI: 1.082, 2.455). After adjusting for gender, age, smoking, alcohol consumption and BMI, the OR was 0.881 (95% CI: 0.553, 1.403). The crude ORs (95% CI) of urinary concentrations of iAs, MMA, DMA, and TAs for the risk of abnormal DBP were 1.002 (0.999, 1.004), 1.002 (0.999, 1.005), 1.001 (1.000, 1.002), and 1.000 (1.000, 1.001), respectively. The P values of the trend were 0.1997, 0.187, 0.077, and 0.093. However, the adjusted ORs were 1.002 (0.999, 1.005), 1.001 (0.997, 1.004), 1.000 (0.997, 1.001), and 1.000 (1.000, 1.001), respectively. Moreover, the risk of abnormal DBP was positively related to iAs% (crude OR: 1.001, adjusted OR: 1.033), DMA% (crude OR: 1.002, adjusted OR: 0.989), and SMI (crude OR: 1.011, adjusted OR: 1.023).
Table 5 presents the ORs of arsenic metabolites for the risk of SBP. The table indicates that positive correlations were observed between SBP and skin lesions (crude OR: 1.774, 95% CI: 1.151, 2.735; adjusted OR: 0.931, 95% CI: 0.563, 1.541), iAs (crude OR: 1.001, 95% CI: 0.998, 1.003; adjusted OR: 1.002, 95% CI: 0.998, 1.005), iAs% (crude OR: 0.980, 95% CI: 0.953, 1.008; adjusted OR: 1.026, 95% CI: 0.996, 1.062), DMA% (crude OR: 1.020, 95% CI: 0.997, 1.042; adjusted OR: 0.996, 95% CI: 0.970, 1.023), PMI (crude OR: 1.020, 95% CI: 0.992, 1.050; adjusted OR: 0.974, 95% CI: 0.942, 1.008), and SMI (crude OR: 1.030, 95% CI: 0.995, 1.067; adjusted OR: 1.029, 95% CI: 0.988, 1.072).
The associations between PP and arsenic metabolites are listed in Table 6. The crude ORs for skin lesions, iAs, iAs%, PMI, and SMI were 1.046 (95% CI: 0.595, 1.837), 1.001 (95% CI: 0.997, 1.004), 0.982 (95% CI: 0.947, 1.017), 1.046 (95% CI: 0.595, 1.837), 1.019 (95% CI: 0.983, 1.056) and 1.014 (95% CI: 0.972, 1.059), while their adjusted ORs were 0.626 (95% CI: 0.334, 1.173), 1.003 (95% CI: 0.999, 1.006), 1.027 (95% CI: 0.990, 1.067), 0.973 (95% CI: 0.595, 1.837), and 0.993 (95% CI: 0.946, 1.044), respectively.
Blood Pressure
Arsenic Metabolites and Methylation
Relationships between Blood Pressure and Cumulative Arsenic Exposure
ORs Estimates of Hypertension
-
In this study, relationships between chronic arsenic exposure and BP were demonstrated. Subjects' BP was significantly elevated with increasing age and BMI. Subjects with skin lesions had higher SBP and DBP than those without skin lesions, indicating that SBP and DBP may be positively related to skin lesions. Therefore, subjects who suffer from skin lesions may have a higher risk of abnormal BP.
No positive relationships between SBP, DBP, and arsenic concentration in drinking water were found. However, the results of linear regression showed that the SBP, DBP, and PP were positively associated with CAE from drinking water. Higher CAE usually increased the SBP, DBP, and PP. Jiang et al. (2015) suggested that long-term arsenic exposure may accelerate the age-related increase in BP[29]. High CAE was positively associated with the prevalence of abnormal BP[30]. Osorio-Yañez et al. (2015) also revealed that long-term arsenic exposure significantly increased DBP and SBP. Long-term arsenic exposure implied a higher level of CAE[32]. The results of the present study were consistent with previous studies.
DBP > 90 mmHg and SBP > 140 mmHg were defined as abnormal BP. PP > 55 mmHg was also considered as abnormal PP. The arsenic methylation capacity, arsenic concentrations, and percentages of arsenic metabolites in the urine of abnormal and normal BP subjects were compared. Higher urinary contents of iAs, MMA, and DMA were observed in subjects with abnormal BP, indicating that the subjects ingested higher amounts of arsenic. Total arsenic concentration in the urine was positively associated with DBP and SBP[32]. Subjects with abnormal BP usually had higher DMA%, whereas subjects with normal BP had higher iAs% and MMA%. Meanwhile, the PMI and SMI suggested that the arsenic methylation capacity of subjects with abnormal BP was slightly lower than that of subjects with normal BP. Huang et al. (2007) found that subjects with hypertension had higher MMA% in urine and lower SMI than those without hypertension, indicating that arsenic exposure dose and arsenic methylation capacity impacts on the risk of hypertension[39]. Li et al. (2013) indicated that lower DMA% in urine may increase the risk of arsenic-induced hypertension[32]. In addition, Wang et al. (2011) revealed that arsenic methylation capacity may influence the incidence of hypertension[40]. However, Abhyankar et al. (2012) suggested that additional evidence should be obtained to evaluate the dose-response relationship between environmental exposure to arsenic and hypertension[25]. The evidence regarding the relationship between arsenic exposure and hypertension was limited in previous studies.
According to the results of logistic regression, positive correlations were observed between gender, age, smoking, alcohol consumption, BMI, and DBP. The results suggested that the risk of abnormal DBP was usually affected by gender, age, smoking, alcohol consumption, BMI, and DBP. Males had a higher risk of DBP than females. Higher contents of iAs and MMA in urine were associated with slightly increased DBP. iAs% and SMI were associated with DBP. Moreover, a negative correlation was found between PMI and DBP, whereas a positive relation was observed between DBP and SMI. The results indicated that lower primary arsenic methylation capacity may elevate the risk of high DBP.
The adjusted ORs suggested that gender was negatively associated with SBP. This indicated that males may have higher SBP than females. Smokers usually had a higher risk of high SBP than non-smokers and non-alcohol consumers. Age and BMI were positively correlated with SBP. Similarly, the concentration and percentage of iAs in urine were positively associated with SBP, indicating that a higher content of iAs and iAs% in urine increased the risk of high SBP.
The relationships between contents and percentages of arsenic in urine and abnormal PP were analyzed. The results suggested that the risk of abnormal PP was significantly higher for females than for males. Alcohol consumers usually had a higher risk of abnormal PP. BMI and age were positively correlated with the risk of abnormal PP. Moreover, higher iAs and iAs% in urine, as well as lower PMI and SMI, elevated the risk of abnormal PP, indicating that lower arsenic methylation capacity may increase the risk of abnormal PP.
In summary, age, gender, smoking, alcohol consumption, and higher BMI were usually associated with the risk of abnormal DBP, SBP, and PP. In terms of gender, males may have a higher risk of abnormal DBP, whereas females have a higher risk of abnormal SBP and PP. Higher iAs and iAs% in urine increased the risk of abnormal DBP, SBP, and PP. It appeared that iAs had a greater toxic effect on abnormal BP than MMA and DMA. Lower PMI was negatively related to higher DBP, SBP, and PP, suggesting that lower primary arsenic methylation capacity may elevate BP. In addition, a positive correlation was observed between SMI and DBP, and SMI and SBP, whereas a negative correlation was found between SMI and PP. This may indicate that higher secondary arsenic methylation capacity increases the risk of abnormal DBP and SBP, whereas lower secondary arsenic methylation capacity elevated the risk of abnormal PP.
-
Correlations among BP, arsenic exposure, and arsenic metabolism were investigated. The results revealed that BP was significantly influenced by gender, age, BMI, smoking, alcohol consumption, and BMI. DBP, SBP, and PP were positively correlated with CAE. Males may have a higher risk of abnormal DBP, whereas females may have a higher risk of abnormal SBP and PP. It seemed that iAs may have higher toxicity to abnormal BP than MMA and DMA. Lower primary arsenic methylation capacity may elevate BP. However, higher secondary arsenic methylation capacity may increase the risk of abnormal BP and SBP, whereas lower secondary arsenic methylation capacity may elevate the risk of PP.
the State Key Program of National Natural Science foundation of China 41230749
the National Natural Science foundation of China 41601559

 Quick Links
 DownLoad: