HTML
-
A wealth of epidemiological and biological evidence has consistently suggested causal links between long-term exposure to ambient fine particulate matter (PM2.5) and increased risks of mortality and morbidity of respiratory disease and lung cancer[1-5]. In 2016, outdoor air pollution and particulate matter from outdoor air pollution were classified as Group 1 carcinogens by the International Agency for Research on Cancer (IARC)[6]. Among the particles, PM2.5 is particularly harmful because it can penetrate deep into the lungs[7].
The rapid economic and industrial growth during the last decades in China has caused increasing air pollution[8-9]. In 2013, the annual average concentration of PM2.5 in China reached 72 μg/m3[9], which was the highest in the world and has exceeded the WHO air quality guideline (i.e., 10 μg/m3) by more than 6 times[10]. It has also far exceeded the China National Ambient Air Quality Standard (No. GB3095-2012) Grade Ⅱ (i.e., 35 μg/m3), which defines the upper limit in residential areas[11]. The concentrations of PM2.5 vary greatly across different areas. Northern China has higher pollutant concentration than southern China. For example, the PM2.5 concentration in Beijing, one of the cities in the North China, reached 81 μg/m3 in 2015[12], whereas the concentration in Fujian, a province in the South China, was only 13.3 μg/m3during the same year[12].
Because the impact on health due to air pollution has attracted attention, many studies in China started examining the disease burden due to air pollution[13-16]. However, their findings should be interpreted with caution because of the following potential limitations. First, most of these studies estimated either the attributed deaths or the incidence rather than considering both outcomes comprehensively[9, 13-17]. Second, most of the studies were focused on northern China[14, 18-20], where the pollution is known to be severe. Few studies were conducted in southern China, where, although pollution is less severe, still the average concentration of PM2.5 has far exceeded the WHO threshold. Moreover, the components of PM2.5 in northern and southern China have been shown to be different[21], and thus, direct comparison of the findings between studies from northern and southern China is challenging. Third, as most of the previous studies in China were cross-sectional, information on the trends of air pollution and disease burden was not available.
Because Guangzhou is the most economically developed and the largest city with more than eight million residents located in southern China, and lung cancer is the leading cause of deaths in both southern and northern China[22], we hereby investigated the lung cancer burden due to PM2.5 pollution in Guangzhou from 2005 to 2013. Our results may provide important information from an understudied region in China regarding accurate risk estimation.
-
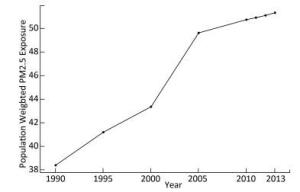
The annual average fine particle concentration at 0.1° ×0.1° spatial resolution was obtained from the 'Ambient air pollution exposure estimation for the Global Burden of Disease 2013' dataset[8]. The globally annual average PM2.5 at 0.1° ×0.1° spatial resolution in this dataset was estimated by combining satellite-based estimates, chemical transport model simulations, and ground measurements from 79 different countries[8]. We extracted the concentration of PM2.5 at 0.1° ×0.1° spatial resolution in Guangzhou city by matching the latitude and longitude from the dataset. The population-weighted PM2.5 exposure concentration was calculated based on the population density at 0.1° ×0.1° spatial resolution original from 'Gridded Population of the World, version 3, GPWv3'[23] in the same dataset. To explore the trend of PM2.5 concentration in Guangzhou, the annual population-weighted average concentrations for five-year intervals from 1990 to 2010 and the years of 2011 and 2012 were also calculated based on the same dataset through the process displayed above.
-
Information of the sex-and age-specific lung cancer mortality and incidence, and population data were derived from the Annual Report of Guangzhou Cancer Registry. In China, cancer surveillance is a routine work of each local Center for Disease Control and Prevention (CDC) guided by the national CDC. The cancer surveillance program was started in 2004 in Guangzhou with elaborate design and quality control procedures. As the surveillance program covers all districts in Guangzhou, surveillance data from this program are likely city-wide representative and credible. Based on the surveillance data, we calculated the disability-adjusted life years (DALYs) using the same method in the Global Burden of Disease (GBD)[24-25]. The details of the calculation are provided below.
First, we estimated the years of life lost (YLL) using the following Equation 1:
$$YLL = \sum {d_x} \times L$$ (1) x is the onset age of death, dx is the number of deaths at age x, L is the life expectancy at age x. In the current study, the standard life table employed was the same as that of the GBD study, which was based on the lowest observed death rate for each age group in countries with a population of more than 5 million[25]. Second, the years lived with disability (YLD) were estimated based on the Equation 2, as follows:
$$YLD = I \times DW \times L$$ (2) I is the incidence of disease within a certain period, DW is disability weight implying the severity of a certain disease status which was derived from the GBD disability weight study[26], and L is the average duration of a certain disease estimated by the DisMod-Ⅱ, a computer program developed specifically for the GBD study[27]. Therefore, we used incidence, mortality, remission rate (for lung cancer, we assumed the remission rate was zero) as inputs to get L for each age group. Finally, we estimated the DALY using the following Equation 3:
$$DALY = YLL + YLD$$ (3) -
Comparative risk analysis (CRA) was used to estimate the attributed disease burden of lung cancer due to PM2.5[28]. CRA is defined as the systematic evaluation of the changes in population health that result from modifying the population distribution of exposure to a risk factor towards counterfactual exposure rather than the difference between 'exposed' and 'unexposed' status[28]. The key of this method is to estimate the population attributable fraction (PAF), which indicates the proportion of disease burden attributed to a specific risk. The formula for calculating PAF in our study was the following Equation 4:
$$PAF = \frac{{\sum\limits_{i = 1}^n {{P_i}(R{R_i}} - 1)}}{{\sum\limits_{i = 1}^n {{P_i}(R{R_i} - 1) + 1} }}$$ (4) Pi is the fraction of population in exposure level i, RRiis the relative risk for exposure level i[29]. In our study, all populations were assumed to be exposed to the population-weighted average PM2.5 concentration estimated through the procedure displayed above because the individual exposure level data cannot be obtained. To use the same methods as the GBD studies, we adopted the feasible minimum risk distribution as counterfactual exposure because there was no consensus for a theoretical minimum exposure level, which is a uniform distribution between 5.8 μg/m3 and 8.8 μg/m3[30]. The RR of exposure to the factual level of PM2.5 compared with the counterfactual exposure was derived from the integrated exposure-response (IER) function introduced by Richard T Burnett[30]. The IER function was shown as following Equation 5, where z is the factual exposure level and zcf is the counterfactual exposure level. α, γ, and δ are parameters. For very large z, RR approximates 1 + α. δ is included to predict risk over a very large range of concentrations. γ can be interpreted as the ratio of the RR at low-to-high exposures[30].
$$\begin{array}{*{20}{l}} {Z < {Z_{cf}}}\\ {RR\left( z \right) = 1}\\ {Z \ge {Z_{cf}}}\\ {RR\left( z \right) = 1 + \alpha \left\{ {1 - {\rm{exp}}\left[ { - \gamma {{\left( {Z - {Z_{cf}}} \right)}^\delta }} \right]} \right\}} \end{array}$$ (5) The lung cancer burden attributed to PM2.5 pollution was calculated using DALYs of lung cancer multiply by PAF. Monte Carlo simulation-modelling techniques were used to estimate uncertainty ranges around point estimates reflecting the main sources of uncertainty in the calculations[25]. Suggested disease diagnostic uncertainty and coding uncertainty for each age, sex and year were considered when calculating YLL and YLD, in which ±7 percent uncertainty for non-communicable diseases was suggested by the GBD study[31]. In addition, the uncertainty of disability weight[26] was aggregated for YLD estimation, and the uncertainty from RR[30] was taken into the calculation of attributed burden of PM2.5. Uncertainty of YLL, YLD, and DALY has been captured by taking 1, 000 draws for each uncertainty of corresponding inputs. The 95% uncertainty interval (UI) around each quantity of interest is presented as the 2.5th and 97.5th centile values[25].
This study was based on official cancer surveillance aggregate data in Guangzhou, which did not contain any identifiable information. Analyses were conducted at the aggregate level and no confidential information was involved. The study was conducted in accordance with the Declaration of Helsinki.
Evaluation of Ambient Fine Particulate Matter Exposure
Calculation of Burden of Disease Due to Lung Cancer
Estimation of PM2.5 Attributed Disease Burden in Lung Cancer
-
Table 1 and Table 2 show the age-, and sex-specific incidence rate and mortality rate of lung cancer reported by the Annual Report of Guangzhou Cancer Registry in 2005 and 2013. The incidence rate of lung cancer in 2005 was 52.07 per 100, 000 (66.26 per 100, 000 for males and 37.14 per 100, 000 for females), which increased to 52.54 per 100, 000 (68.29 per 100, 000 for males and 36.49 per 100, 000 for females) in 2013. In addition, the mortality rate of lung cancer increased more sharply than the incidence rate, from 33.03 per 100, 000 (43.38 per 100, 000 for males and 58.88 per 100, 000 for females) to 43.47 per 100, 000 (22.18 per 100, 000 for males and 27.76 per 100, 000 for females) from 2005 to 2013. Both the incidence and mortality rates were increased consistently with the increase of age. Moreover, the incidence and mortality rates among males for each age group were approximately double compared to those among females.
Age 2005 2013 Total Male Female Total Male Female 0- 0.28 0.10 0.47 0.06 0.11 0.00 20- 0.56 0.46 0.67 0.69 0.81 0.57 30- 1.11 1.46 0.75 4.11 3.48 4.72 40- 3.69 4.38 2.94 21.16 27.11 15.17 50- 10.93 13.92 7.93 72.83 95.31 49.77 60- 38.04 48.88 27.24 168.58 237.51 102.91 70- 104.06 148.63 64.94 303.94 433.71 189.10 80- 506.97 902.19 281.52 349.95 512.74 237.83 Total 52.07 66.26 37.14 52.54 68.29 36.49 Table 1. Age-, Sex-specific Incidence Rate (Per 100, 000) of Lung Cancer in 2005 and 2013 in Guangzhou, China
Age 2005 2013 Total Male Female Total Male Female 0- 0.00 0.00 0.00 0.06 0.11 0.00 20- 0.20 0.30 0.08 0.41 0.40 0.42 30- 0.53 0.98 0.08 2.32 2.27 2.36 40- 2.40 2.23 2.59 15.04 19.65 10.40 50- 6.27 7.91 4.64 54.34 78.27 29.79 60- 24.99 35.13 14.88 121.61 181.93 64.15 70- 66.16 103.06 33.78 268.43 401.98 150.25 80- 339.46 645.54 164.85 373.03 536.99 260.10 Total 33.03 43.38 22.18 43.47 58.88 27.76 Table 2. Age-, Sex-specific Mortality Rate (Per 100, 000) of Lung Cancer in 2005 and 2013 in Guangzhou, China
-
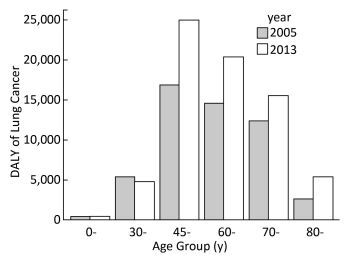
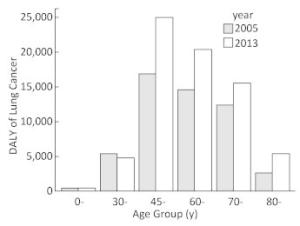
Table 3 shows the lung cancer burden from 2005 to 2013 indicated by YLL, YLD, and DALY. There were increasing trends of DALY among both males and females. The DALYs for both males and females were higher in 2013 (48930.6 and 22522.9, respectively) than 2005 (35451.0 and 17004.0, respectively). The total DALYs have increased by 34.6% from 2005 to 2013. The increasing trends of YLL in males and females were similar with DALYs. While total YLD from 2005 to 2013 did not change apparently, YLD decreased slightly among males and slightly increased among females. To eliminate the impact of population increase, the rates of the three measurements were calculated. The DALY rates among both males and females also appeared to be raised, and the total DALY rate increased from 7.08 per 1, 000 to 8.61 per 1, 000. The number of DALYs among males was approximately double compared to that among females (Table 3) in both years. This pattern was similar for lung cancer incidence and mortality rates in males and females (Table 1 and Table 2). Figure 1 shows that, from 2005 to 2013, the disease burden increased consistently in each age group except the 30-age group and sharply increased after age 45 in both years. The age-standardized DALY rates of lung cancer were 6.27 per 1, 000 and 6.52 per 1, 000 in 2005 and 2013 respectively.
Item 2005 2013 Total Male Female Total Male Female YLL 47527.0
(46491.7, 48507.1)32456.0
(31560.6, 33282.8)15071.0
(14670.7, 15474.9)66486.1
(65057.2, 67892.8)46540.8
(45272.9, 47791.3)19945.4
(19419.2, 204458)YLD 4928.0
(3939.6, 5975.1)2995.0
(2229.1, 3847.3)1933.0
(1424.9, 2453.4)4967.4
(4020.3, 6048.5)2389.8
(1779.4, 3069.1)2577.6
(1920.3, 3309.4)DALY 52455.0
(50888.4, 54047.3)35451.0
(34004.2, 36919.3)17004.0
(16191.1, 17799.1)71453.5
(69679.2, 73226.3)48930.6
(47289.5, 50533.3)22522.9
(21470.6, 23557.8)YLL
Rate6.42
(6.28, 6.55)8.60
(8.32, 8.78)4.20
(4.06, 4.28)8.01
(7.84, 8.18)11.11
(10.81, 11.41)4.85
(4.72, 4.97)YLD
Rate0.67
(0.53, 0.81)0.80
(0.59, 1.01)0.50
(0.39, 0.68)0.60
(0.48, 0.73)0.57
(0.42, 0.73)0.63
(0.47, 0.81)DALY
Rate7.08
(6.87, 7.30)9.40
(8.97, 9.74)4.70
(4.48, 4.92)8.61
(8.40, 8.82)11.68
(11.29, 12.07)5.48
(5.22, 5.73)Table 3. Years of Life Lost (YLL), Years Lived with Disability (YLD), Disability-adjusted Life Years (DALYs) and the Corresponding Rates (per 1, 000) with 95% Uncertainty Interval for Lung Cancer in 2005 and 2013 in Guangzhou, China
-
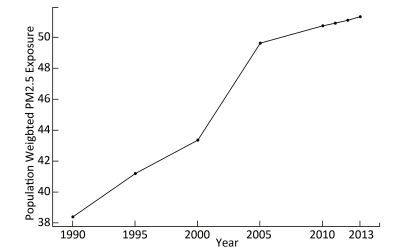
The annual population-weighted average PM2.5 concentrations from 1990 to 2013 with five-year intervals are shown in Figure 2. The population-weighted average concentration of PM2.5 increased from 38.37 μg/m3in 1990 to 51.31 μg/m3 in 2013, indicating an increase of 34.6%. The PM2.5 concentration increased monotonously during the past decades, with a sharp rise between 2000 and 2005. While the increasing trend has declined during the recent years, the PAF increased consistently from 18.7% in 1990 to 23.1% in 2013. The average estimated PAF from 1990 to 2013 was 21.8% (from 18.7% to 23.1%), indicating that 21.8% of the total disease burden due to lung cancer was attributable to the PM2.5 pollution.
-
Table 4 shows that the attributed DALYs for both males and females increased from 2005 to 2013. The attributed DALYs were 12105.0 (8181.0 for males and 3924.0 for females) in 2005 and 16489.3 (11291.7 for males and 5197.6 for females) in 2011. Meanwhile, the same pattern was observed when we used the DALY rate, which was increased from 1.63 per 1, 000 (2.17 per 1, 000 for males and 1.08 per 1, 000 for females) in 2005 to 1.99 per 1, 000 (2.70 per 1, 000 for males and 1.26 per 1, 000 for females) in 2013. The standardized DALY rates of lung cancer were 1.45 per 1, 000 and 1.50 per 1, 000 in 2005 and 2013 respectively.
Item 2005 2013 Total Male Female Total Male Female YLL 10967.8
(7229.5, 13964.7)7489.8
(4910.3, 9519.8)3477.9
(2282.6, 4425.9)15342.9
(10116.6, 19542.0)10740.2
(7072.4, 13791.2)4602.8
(3021.1, 5851.5)YLD 1137.2
(707.8, 1600.1)691.2
(416.4, 1016.8)446.1
(266.1, 648.4)1146.3
(720.0, 1620.5)551.5
(658.0, 1468.2)594.8
(358.6, 874.6)DALY 12105.0
(7980.2, 15626.1)8181.0
(5398.3, 10560.3)3924.0
(2579.2, 5080.3)16489.3
(10902.8, 21228.8)11291.7
(7413.5, 14552.3)5197.6
(3418.4, 6725.8)YLL
Rate1.48
(0.98, 1.89)1.98
(1.30, 2.51)0.97
(0.63, 1.22)1.85
(1.22, 2.35)2.56
(1.69, 3.29)1.12
(0.74, 1.42)YLD
Rate0.15
(0.10, 0.22)0.18
(0.11, 0.27)0.12
(0.07, 0.18)0.14
(0.09, 0.20)0.13
(0.16, 0.35)0.15
(0.09, 0.21)DALY
Rate1.63
(1.08, 2.11)2.17
(1.42, 2.78)1.08
(0.71, 1.40)1.99
(1.31, 2.56)2.70
(1.77, 3.47)1.26
(0.83, 1.64)Table 4. Years of Life Lost (YLL), Years Lived With Disability (YLD), and Disability-adjusted Life Years (DALYs) with 95% Uncertainty Intervals for Lung Cancer Attributed to PM2.5 in 2013 in Guangzhou, China
Incidence Rate and Mortality Rate of Lung Cancer
Burden of Disease Due to Lung Cancer
PM2.5 Exposure
Burden of Lung Cancer Attributable to PM2.5
-
Based on epidemic and PM2.5 exposure data, our study showed that about 23.1% of the lung cancer burden was attributed to PM2.5 pollution in Guangzhou in 2013. We also found that the lung cancer burden due to PM2.5 in Guangzhou increased from 2005 to 2013, with 12105.0 DALYs in 2005 and 16489.3 DALYs in 2013, and that the DALY rates also increased from 1.63 per 1, 000 in 2005 to 1.99 per 1, 000 in 2013. Taking advantage of the high-resolution air pollution estimation dataset and cancer surveillance network, our study has provided useful information not only for the accurate estimation of disease burden but also for the estimation of lung cancer risks attributable to PM2.5.
Our study showed that the PM2.5 exposure has increased during the past two decades in Guangzhou, ranging from 38.4 μg/m3in 1990 to 51.3 μg/m3in 2013. With the control and technical improvement of coal combustion in China, the corresponded coal-combustion related pollution, such as SO2 and NOx pollution, seems to decline gradually[9]. However, due to urbanization and anthropogenic activities, the PM2.5 becomes the dominant air pollutant and the situation becomes more severe[9]. As observed in our study, the PM2.5 concentration increased consistently in Guangzhou, and it increased sharply from 2000 to 2005, while this increase declined during recent years. According to WHO air quality guidelines (AQG) the limit for PM2.5 in the air is 10 μg/m3[10]. Moreover, three interim targets (ITs) were also defined based on exposure-response studies, which are useful for countries to gauge progress over time in the difficult task to consistently reduce population exposure to PM2.5[10]. Mean PM2.5 concentrations of 35 μg/m3, 25 μg/m3, and 15 μg/m3 were defined as IT1, IT2, and IT3, respectively[10]. In China, the same limit of PM2.5 as the IT1 (i.e., 35 μg/m3) was used as the China National Ambient Air Quality Standard (CNAAQS) Grade Ⅱ (No. GB3095-2012), and was applied in residential areas[11]. Although the concentration of PM2.5 was the lowest in 1990 over the past decades in Guangzhou, it still exceeded both the WHO IT1 and the CNAAQS Grade Ⅱ standards. In China, the PM2.5 concentration in Guangzhou was lower than that in many other cities, especially those in northern China. The PM2.5 concentration in northern cities of China reached an annual average level from 90 μg/m3 to 130 μg/m3, which may be due primarily to coal-combustion and industrial-oriental pollution, especially in winter, when the pollution was more severe because of the collective heating using coal[32]. However, in Guangzhou, the pollution was mainly induced by traffic-related sources and solid waste incineration[33]. A previous study provided population-weighted estimates of the exposure to PM2.5 globally and showed that the highest concentrations of PM2.5 were evident in northern Africa, the Middle East, South and East Asia, especially in northern India and eastern China[8]. Moreover, in 2013, the highest annual average PM2.5 world-wide was 194 μg/m3 in Shijiazhuang, the capital of Hebei Province in China, while the lowest was < 1 μg/m3 in Soldotna, Alaska[8]. In addition to the outdoor air pollution, household air pollution including the PM2.5 is also a leading risk factor associated with morbidity of lung cancer in China[22]. China is the largest consumer of coal in the world[34], and coal is used extensively in China for heating and cooking in rural areas[35]. However, China experiences rapid urbanization during the past decades, which contributed to the decrease of household air pollution and the reduction of disease burden of lung cancer[21]. It was reported that the DALYs associated with household air pollution from solid fuels were decreased from 42, 767 in 1990 to 21, 292 in 2010 in China[22]. The population-weighted exposure (PWE) of household PM2.5 was reduced by 52 μg/m3 over the decade, and approximately 60% of the reduction was linked with urbanization[36]. For example, poor ventilation and cooking with biomass fuel in Yunyan (in Guangdong province) led to higher indoor pollution levels than in urban households in Guangzhou (in Guangdong province), where clean fuels and electricity were used[21]. Children and women are more frequently exposed to high levels of household air pollution, which warrants specific interventions in these at-risk groups, especially in rural area in China. In brief, as both the indoor and outdoor pollution conditions varied greatly around the world as well as within China, local data would be more useful and informative in terms of estimating health impact related to PM2.5.
One of the strengths of our study includes the use of a comprehensive measurement, DALY, to estimate the disease burden and the use of local neoplasm surveillance data, which may have provided more accurate information than using simulation data based on sparse datasets[37-38]. In our study, lung cancer burden in Guangzhou increased from 52455.0 in 2005 to 71453.5 in 2013, suggesting a 36.2% increase. As reported in the GBD study in 2013, there is a world-wide increase of disease burden due to lung cancer by 12.9% from 2005 to 2013[39]. Therefore, the increasing trend of DALY due to lung cancer in Guangzhou appeared to be faster than the average increasing rate in the world. Moreover, in 2013, the standardized DALY rate of lung cancer in Guangzhou was 6.52 per 1, 000, while the average DALY rate around the world was 4.70 per 1, 000, suggesting that the population in Guangzhou may suffer heavier burden of lung cancer than the global average level[25]. Furthermore, this standardized DALY rate of lung cancer was lower than that of China in 2010 (7.60 per 1, 000), indicating that the lung cancer burden in Guangzhou was lower than the national average level[22].
Our study showed an increasing trend in lung cancer burden due to PM2.5 pollution. The age-standardized attributed DALY rate in Guangzhou in 2013 (1.50 per 1, 000) was higher than the global average age-standardized rate (0.91 per 1, 000) in 2015[40], indicating that although Guangzhou suffered less severe PM2.5 pollution compared with the average pollution level in China, the lung cancer burden attributable to PM2.5 in Guangzhou was heavier than the global level. Moreover, PM2.5 accounted for approximately one out of five (ranging from 18.7% to 23.1%) of the lung cancer DALYs in the past decade in Guangzhou, while the average PAF globally was 17.0% in 2015[40-41]. Another study reported that PM2.5 in 2015 contributed to 23.9% of lung cancer deaths in China[17]. A previous study suggested that 13.7% of lung cancer deaths were attributed to PM2.5 in 2005 in China[15]. Although the increasing trend of PM2.5 concentration is declining during the recent years in Guangzhou, the attributed burden is increasing. The reason is that the number of population is increasing, which suggests that the number of people exposed to the PM2.5 pollution is increasing, therefore the absolute number of DALY is increasing too. One of the strengths of our study is that we used the local surveillance data, and not multisource data to build a statistical model to estimate the epidemic data, similarly to GBD studies. Unfortunately, the lack of results regarding lung cancer burden due to PM2.5 from GBD studies prohibited direct comparison with our results; however, there were data from the Guangdong province. It was reported that 33% of lung cancer burden was associated with PM2.5, which was higher than that we estimated for Guangzhou city[42]. Both the PM2.5 concentration and the exposure-response function we used were similar to the GBD study. The higher PAF reported by the GBD study may be due to the underestimation of lung cancer burden by using model-based epidemic data, which suggested that using local data to conduct national or subnational disease burden study may facilitate more accurate estimation of the disease burden. Our study provided updated information regarding both mortality and morbidity of lung cancer due to PM2.5 and the findings call for more attention to take effective and sustainable actions to combat air pollution and protect population health.
The level of disease burden, as indicated by both DALY and DALY rate, among males was almost double compared to that among females. It was reported that the number of lung cancer deaths in men was also more than double compared to those of women in China in 2013 (396, 104 for males and 150, 156 for females for all ages)[43], which was similar in Guangzhou city. The higher lung cancer burden in males may be due to the much higher smoking prevalence in men than in women in China[44]. The age-specific DALY showed that the middle-and old-age people, especially individuals between 45 and 60 suffered the largest disease burden. Although the incidence and mortality rates increased with age, these two indicators only focus on the count, rather than the loss of life years or disability years. While the DALY was composed of YLL and YLD, which measure the burden not only concern the number of people suffered from disease, but also concern the age of onset and death. Therefore, the loss of life years and disability duration among younger individuals were longer than that among older individuals. Therefore, considering both the count and loss of health, the disease burden among people aged between 45 and 60 years was the highest, as shown in Figure 1. It is suggested that middle-aged individuals should be focused on when considering prevention or health care policies.
We estimated the attributed DALYs using CRA framework and IER function. Previous studies in China estimating disease burden due to air pollution using just mortality, but not both mortality and morbidity as study outcomes, may inevitably have led to an underestimation of the true disease burden. We hypothesized that the use of CRA considering both DALY and DALY rate would, to some extent, improve the accuracy of the estimation. It should be noted that in CRA framework, the exposure-response functions for evaluating RRs were generally derived from large-scale population-based cohort studies[1-3, 45], such as the American Cancer Society Cancer Prevention Study Ⅱ (CPS-Ⅱ)[1, 46]. Some previous studies used the exposure-response function from the CPS-Ⅱ to estimate RRs in their own setting[47-49]. However, because these exposure-response functions were estimated in the US or other developed countries (i.e., Canada, the European countries), where air pollution level was relatively low, it may be challenging to directly apply them into the less developed but more pollutant countries[30]. However, to date, no large-scale population-based study has been conducted to estimate the association of long-term exposure to direct measurements of PM2.5 with lung cancer mortality or incidence in populations with high ambient exposures[30]. To overcome this, we derived the RRs from IER model, which was developed based on information from different combustion types that generate emissions of particulate matter and covered the global range of exposure level.
There were several limitations of our study. First, we used the annual average population exposure of PM2.5 concentrations rather than the individual-level exposure (although the latter was often not available in practice). However, within Guangzhou the PM2.5 concentration does not vary much, which might also partly counteract the divergence. Second, while the PM2.5 concentration data can be calculated starting from 1990, the cancer surveillance work was started in recent decades; thus, we can only estimate the disease burden due to lung cancer attributed to PM2.5 since 2005 rather than explore the trend during a wider time span. However, we have used the air pollution data and risk model to estimate the PAF from 1990 to 2013, which can provide more information. Third, although the IER model was employed, different components of PM2.5 may have played different roles in health. However, no study on the exposure-response function of different sources PM2.5 pollution was reported. Further studies using more in-depth analysis and advanced techniques to distinguish exposure-response function of PM2.5 from different major sources are warranted.
-
In conclusion, with the increasing number of big city residents due to urbanization, more individuals are exposed to severe pollution. Ambient fine particulate matter has caused serious but under-appreciated public health burden in Guangzhou, China and the trend is deteriorating. Effective strategies are needed to tackle this major public health problem and to decrease the attributable disease burden.
-
This work was supported by the Centre for Health Statistics Information, National Health and Family Planning Commission of the People's Republic of China. We would like to thank Cancer Center in Sun Yat-sen University and Guangzhou Center for Disease Control and Prevention for providing cancer surveillance data.
-
LIAO Yu, HAO Yuan Tao conceptualized and designed the study. LIAO Yu and LIN Xiao carried out the study. LIAO Yu conducted the data analysis and wrote the first manuscript. XU Lin critically revised the manuscript for important intellectual content. All coauthors contributed to writing, reviewing and/or editing the manuscript. All coauthors agree with the contents of the paper.
-
No conflict of interest to declare.






 Quick Links
 DownLoad:
