


HTML
-
A number of epidemiological studies have investigated an association of self-reported sleep duration and risk of diabetes[1-2], hypertension[3-4], myocardial infarction[5-6], stroke[7-8], and mortality[9-10]. With increasing life expectancy in many societies, cognitive impairment or neurodegenerative disease has become a growing problem. Esposito and Carotenuto found that sleep was associated with cognition processes, particularly in cognitive borderline dysfunction[11-12]. Moreover, more and more researchers have begun to explore the association between night sleep duration and cognitive impairment, and a commonly reported finding is that both short and long sleep duration is associated with cognitive impairment[13-19]. However, the evidence is mixed and inconsistent regarding the association of sleep duration with the risk of cognitive impairment. Different cross-sectional studies have suggested that only long night sleep duration[15-16, 20], only short night sleep duration[17, 19, 21], or both short and long sleep duration (U-shaped relationship or V-shaped relationship)[13, 18, 22] was associated with an increased risk of cognitive impairment. In addition, a small number of longitudinal studies have begun to examine whether habitual short or long night sleep duration increases the risk for cognitive decline[23-25] in the elderly, but the results were also mixed. Recently, a cross-sectional study from southern China showed that short or long night sleep duration was an important sleep-related factor independently associated with memory impairment in older people (50-85 years of age)[13]. It is evident that lifestyle, living conditions, and food intake differs between southern and northern Chinese populations. And in their study[13], carotid plaque, a very important factor with respect to cognitive impairment[26], was not considered a confounding factor. It is still unknown whether there is an association between night sleep duration and cognitive impairment in people in northern China. Therefore, we used data from the Kailuan Study to explore whether night sleep duration is associated with cognitive impairment.
-
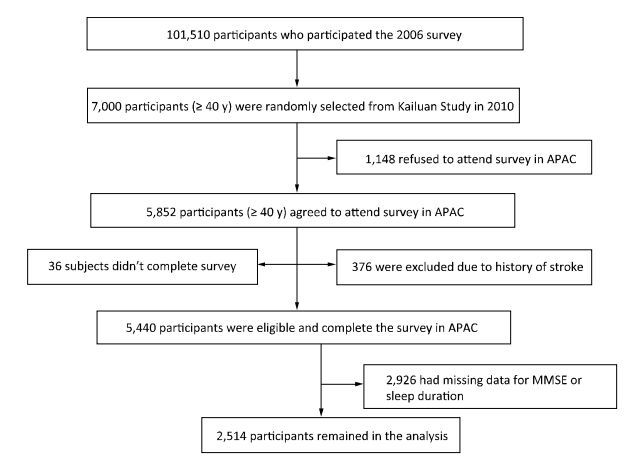
We conducted a cross-sectional analysis of baseline data in the Asymptomatic Polyvascular Abnormalities Community (APAC) Study. The APAC Study is a community-based, ongoing observational study that aims to investigate asymptomatic polyvascular abnormalities in Chinese adults[27]. From June 2010 to June 2011, 7, 000 eligible adults over 40 years of age (stratified by age and sex) were randomly sampled from a reference population of 101, 510 participants (20, 400 women and 81, 110 men, aged 18-98 years) who had been participating in a long-term follow-up study (Kailuan Study[28]) since 2006 in the Kailuan Coal Group in Tangshan, a modern coastal city in northern China. The sample size was calculated based on detection of a 7% event rate with 0.7% precision and an α value of 0.05. The response rate was assumed to be > 80%. A total of 5, 852 individuals agreed to participate in the APAC Study and 5, 816 people eventually completed the baseline data collection. Among these 5, 816 individuals, 376 subjects did not meet the following inclusion criteria: (1) no history of stroke, transient ischemic attack, or coronary disease at baseline as assessed by a validated questionnaire; and (2) absence of neurologic deficits for stroke as estimated by experienced doctors. Finally, 5, 440 participants were eligible and included in the APAC Study[29]. After excluding individuals with missing data for the Mini-Mental State Examination (MMSE) or sleep duration (n = 2, 926), 2, 514 participants remained in the analysis (1, 172 women and 1, 342 men) (Figure 1). The study was approved by the Ethics Committee of Kailuan General Hospital, following the guidelines outlined by the Helsinki Declaration. All participants agreed to participate in this study and provided written informed consent.
Figure 1. Study flow chart.
-
Night sleep duration was obtained through a self-reported answer to the question, 'How many hours of sleep did you have on an average night in the preceding 3 months?' Based on participants' responses, sleep duration was categorized into five groups: ≤ 5, 6, 7, 8, and ≥ 9 h[30].
-
Cognitive function was measured using the MMSE in 2012. The MMSE is a measure of general cognitive function and includes orientation to time and place, attention and calculation, language, and memory[31]. Higher scores indicate greater cognitive function. Cognitive impairment was defined as a score of < 24.
-
All participants underwent a clinical examination and a standardized interview. The information on physical activity, smoking, and drinking status was evaluated as detailed previously[30]. Education level was categorized as illiteracy or primary, middle school, and high school or above. The family per-member monthly income was categorized as < ¥1, 000, ¥1, 000-3, 000, or ≥ ¥3, 000. Anthropomorphic parameters such as body height and weight and waist circumference were measured. Body weight (kg) was divided by the square of height (m2) to determine the body mass index (BMI). Fasting blood glucose, high-density lipoprotein (HDL), low-density lipoprotein (LDL), triglyceride, and total cholesterol levels were evaluated. Diabetes mellitus was defined as a self-reported history or current treatment with insulin or oral hypoglycemic agents. Hyperlipidemia was defined as a history of hyperlipidemia, total blood cholesterol level ≥ 220 mg/dL, triglyceride level ≥ 150 mg/dL, or use of antihyperlipidemic medications. Hypertension was defined as a history of hypertension, a systolic blood pressure (SBP) ≥ 140 mmHg, a diastolic blood pressure ≥ 90 mmHg, or use of antihypertensive medications[32].
-
High-resolution B-mode ultrasounds (Philips iU-22 ultrasound system, Philips Medical Systems, Bothell, WA) with a 5-to 12 MHz linear array transducer was used to detect plaques bilaterally on three segments: the common carotid artery, the bifurcation, and the internal carotid artery. Atherosclerotic plaque was defined as a focal structure encroaching into the arterial lumen of at least 0.5 mm or a thickness > 1.5 mm as measured from the media-adventitia interface to the intima-lumen interface[33].
-
Data are presented as means ± standard deviations for continuous variables and frequencies and percentages for categorical variables. One-way analysis of variance was used for unpaired samples of normally distributed parameters and the Kruskal-Wallis test for non-parametric variables. The χ2 test was applied to compare categorical variables. A multivariate analysis was performed using three models. Model 1 was adjusted for age and sex, and model 2 for age, sex, BMI, family per-member monthly income, education level, smoking status, drinking status, physical activity, and snoring. In addition to the independent parameters analyzed in model 2, model 3 also included history of hypertension, diabetes mellitus, hyperlipidemia, stroke, and carotid plaque. We used a logistic regression model to calculate the odds ratios and 95% confidence intervals (CI) of cognitive impairment (the group reporting 7-h night sleep duration was used as the reference category). All interactions were analyzed by multiplicative logistic regression modeling. The level for statistical significance was set at P ≤ 0.05 (two-tailed). Statistical analysis was performed using SAS version 9.3 statistical software (SAS Institute Inc., Cary, NC, USA).
Study Design and Participants
Assessment of Night Sleep Duration
Neuropsychological Evaluation
Assessment of Potential Covariates
Ultrasound Examination
Statistical Analysis
-
In total, 2, 514 participants (1, 342 men and 1, 172 women) were enrolled in this study (mean age, 52.37 ± 9.40 years). Among the study population, 122 (4.85%) patients were diagnosed with cognitive impairment, defined as an MMSE score < 24. Table 1 summarizes the characteristics of participants and non-participants. Compared with the group of nonparticipants, the group of study participants was significantly younger; had a higher proportion of women, higher BMI, and a higher prevalence of married family status and high-school graduation; and had a lower reported income, SBP, and fasting blood glucose concentration and a lower proportion of participants with a carotid plaque (Table 1).
Variable Overall Participants Non-participants P Value No. 5, 440 2, 514 2, 926 Age (y) 57.7 ± 11.2 55.8 ± 9.5 59.6 ± 12.5 < 0.001 Men, n (%) 3, 257 (59.9) 1, 342 (53.4) 1, 915 (65.4) < 0.001 Marital status (married), n (%) 4, 165 (76. 6) 2, 466 (98.1) 1, 699 (58.1) < 0.001 Body mass index (kg/m) 24.9 ± 3.2 25.0 ± 3.3 24.8 ± 3.2 0.090 Systolic blood pressure (mmHg) 130.9 ± 19.6 128.6 ± 18.6 133.4 ± 20.4 < 0.001 Diastolic blood pressure (mmHg) 82.8 ± 10.9 82.4 ± 10.5 83.1 ± 11.3 0.180 Fasting blood glucose (mmol/L) 5.8 ± 1.9 5.7 ± 1.7 5.8 ± 2.3 < 0.010 Education, n (%) < 0.001 Illiteracy/primary school 1, 104 (21.9) 149 (5.9) 955 (37.6) Middle school 2, 657 (52.6) 1, 544 (61.4) 1, 113 (43.9) High-school graduate 1, 290 (25.5) 821 (32.7) 469 (18.5) Family per-member monthly income ≥ ¥3, 000, n (%) 1, 074 (21.3) 447 (17.8) 627 (24.7) < 0.001 Physical activity > 4 times/week, n (%) 846 (16.8) 311 (12.4) 535 (21.1) < 0.001 Current smoker, n (%) 1, 600 (31.7) 838 (33.3) 762 (30.0) 0.050 Current alcohol drinker, n (%) 1, 444 (28.6) 802 (31.9) 642 (25.3) < 0.001 History of disease Hypertension, n (%) 2, 529 (50.1) 1, 225 (48.7) 1, 304 (51.4) 0.060 Diabetes mellitus, n (%) 703 (13.9) 353 (14.0) 350 (13.8) 0.800 Hyperlipidemia, n (%) 2, 251 (44.6) 1, 281 (50.9) 970 (38.2) < 0.001 Stroke, n (%) 71 (1.3) 24 (1.0) 47 (1.6) < 0.050 Carotid plaque, n (%) 1, 886 (46.6) 1, 053 (42.3) 833 (53.6) < 0.001 Snoring, n (%) 410 (9.6) 273 (10.9) 137 (7.8) < 0.010 Night sleep duration, n (%) ≤ 5 h 684 (12.6) 282 (11.2) 402 (13.7) 6 h 1, 511 (27.8) 675 (26.8) 836 (28.6) 7 h 2, 300 (42.3) 1, 165 (46.3) 1, 135 (38.8) 8 h 881 (16.2) 367 (14.6) 514 (17.6) ≥ 9 h 64 (1.2) 25 (1.0) 39 (1.3) Table 1. Comparison of Demographic and other Characteristics of Participants and Non-participants
Table 2 presents the characteristics of patients with good cognition and cognitive impairment. Age, sex, marital status, SBP, education, income level, alcohol use, and history of hypertension and carotid plaque were associated with cognitive impairment (P < 0.05). Compared with patients with good cognition, patients with cognitive impairment had a higher proportion of participants with a night sleep duration of ≥ 9 h (4.10% vs. 0.84%, P < 0.001).
Variable Overall Cognitively Intact
(MMSE ≥ 24)Cognitively Impaired
(MMSE < 24)P Value No. 2, 514 2, 392 122 Age (y) 55.8 ± 9.5 55.3 ± 9.1 65.3 ± 11.9 < 0.001 Men, n (%) 1, 342 (53.4) 1, 260 (52.7) 82 (67.2) < 0.001 Marital status (married), n (%) 2, 466 (98.1) 2, 352 (98.3) 114 (93.4) < 0.001 Body mass index (kg/m) 25.0 ± 3.3 25.0 ± 3.3 24.9 ± 3.5 0.850 Systolic blood pressure (mmHg) 128.6 ± 18.6 128.2 ± 18.4 137.4 ± 20.1 < 0.001 Diastolic blood pressure (mmHg) 82.4 ± 10.5 82.4 ± 10.4 84.2 ± 11.1 0.080 Fasting blood glucose (mmol/L) 5.7 ± 1.7 5.7 ± 1.6 6.1 ± 2.4 0.080 Education, n (%) < 0.001 Illiteracy/primary school 149 (5.9) 121 (5.1) 28 (23.0) Middle school 1, 544 (61.4) 1, 458 (61.0) 86 (70.5) High-school graduate 821 (32.7) 813 (33.9) 8 (6.6) Family per-member monthly income ≥ ¥3, 000, n (%) 447 (17.8) 432 (18.1) 15 (12.3) < 0.050 Physical activity > 4 times/week, n (%) 311 (12.4) 299 (12.5) 12 (9.8) 0.120 Current smoker, n (%) 838 (33.3) 790 (33.0) 48 (39.3) 0.240 Current alcohol drinker, n (%) 802 (31.9) 764 (31.9) 38 (31.2) < 0.001 History of disease Hypertension, n (%) 1, 225 (48.7) 1, 145 (47.9) 80 (65.6) < 0.001 Diabetes mellitus, n (%) 353 (14.0) 330 (13.8) 23 (18.9) 0.140 Hyperlipidemia, n (%) 1, 281 (50.9) 1, 227 (51.3) 54 (44.3) 0.130 Stroke, n (%) 24 (1.0) 20 (0.8) 4 (3.3) < 0.050 Carotid plaque, n (%) 1, 053 (42.3) 982 (41.4) 71 (59.2) < 0.001 Snoring, n (%) 273 (10.9) 255 (10.7) 18 (14.8) 0.370 Night sleep duration, n (%) < 0.001 ≤ 5 h 282 (11.2) 255 (10.7) 27 (22.1) 6 h 675 (26.8) 643 (26.9) 32 (26.2) 7 h 1, 165 (46.3) 1, 125 (47.0) 40 (32.8) 8 h 367 (14.6) 349 (14.6) 18 (14.8) ≥ 9 h 25 (1.0) 20 (0.8) 5 (4.1) Note.MMSE: mini-mental state examination. Table 2. Comparisons between Patients with and without Cognitive Impairment in the Kailuan Study
Table 3 shows the baseline characteristics of participants according to mean night sleep duration. The baseline characteristics of the participants varied significantly between sleep categories except marital status (P = 0.22), BMI (P = 0.30), and history of hyperlipidemia (P = 0.11). In particular, most of the short-duration sleepers or long-duration sleepers were older and male participants, and they had a greater likelihood of having hypertension, diabetes mellitus, snoring, and carotid plaque.
Variable Night Sleep Duration ≤ 5 h 6 h 7 h 8 h ≥ 9 h P No. 282 675 1, 165 367 25 Age (y) 58.0 ± 10.9 56.3 ± 9.6 55.4 ± 9.0 54.1 ± 8.8 58.1 ± 11.4 < 0.001 Men, n (%) 175 (62.1) 385 (57.0) 593 (50.9) 173 (47.1) 16 (64.0) < 0.001 Marital status (married), n (%) 274 (97.2) 657 (97.3) 1, 149 (98.6) 361 (98.4) 25 (100) 0.220 Body mass index (kg/m2) 25.2 ± 3.4 25.1 ± 3.3 24.8 ± 3.3 25.1 ± 3.2 25.7 ± 3.9 0.300 Systolic blood pressure (mmHg) 130.4 ± 19.6 129.9 ± 18.2 127.7 ± 18.4 127.6 ± 18.8 133.6 ± 18.8 < 0.050 Diastolic blood pressure (mmHg) 82.8 ± 10.8 83.3 ± 10.1 81.9 ± 10.5 82.0 ± 10.5 85.9 ± 11.3 < 0.050 Fasting blood glucose (mmol/L) 5.8 ± 1.7 5.8 ± 1.7 5.6 ± 1.6 5.7 ± 1.7 6.9 ± 3.8 < 0.050 Education, n (%) < 0.001 Illiteracy/primary school 22 (7.8) 39 (5.8) 58 (5.0) 29 (7.9) 1 (4.0) Middle school 194 (68.8) 438 (64.9) 670 (57.5) 221 (60.2) 21 (84.0) High-school graduate 66 (23.4) 198 (29.3) 437 (37.5) 117 (31.9) 3 (12.0) Family per-member monthly income ≥ ¥3, 000, n (%) 40 (14.2) 112 (16.6) 232 (19.9) 60 (16.4) 3 (12.0) < 0.001 Physical activity > 4 times/week, n (%) 52 (18.4) 97 (14.4) 121 (10.4) 38 (10.4) 3 (12.0) < 0.001 Current smoker, n (%) 110 (39.0) 246 (36.4) 370 (31.8) 105 (28.6) 7 (28.0) < 0.050 Current alcohol drinker, n (%) 111 (39.4) 241 (35.7) 343 (29.4) 99 (26.9) 8 (32.0) < 0.050 History of disease Hypertension, n (%) 151 (53.6) 349 (51.7) 553 (47.5) 158 (43.1) 14 (56.0) < 0.050 Diabetes mellitus, n (%) 37 (13.1) 107 (15.8) 148 (12.7) 53 (14.4) 8 (32.0) < 0.050 Hyperlipidemia, n (%) 148 (52.5) 372 (55.1) 569 (48.8) 180 (49.1) 12 (48.0) 0.110 Stroke, n (%) 2 (0.7) 12 (1.8) 8 (0.7) 1 (0.3) 1 (4.0) < 0.050 Carotid plaque, n (%) 154 (55.0) 292 (43.9) 461 (39.8) 135 (37.1) 11 (44.0) < 0.001 Snoring, n (%) 64 (22.7) 86 (12.7) 88 (7.6) 32 (8.7) 3 (12.0) < 0.001 Table 3. Characteristics (2012) according to Night Sleep Duration
A multivariate regression analysis was performed to investigate the association between night sleep duration and cognitive function (Table 4). After adjusting for age, sex, family per-member monthly income, education level, marital status, smoking status, drinking status, physical activity, BMI, history of diabetes, hypertension, hyperlipidemia, stroke, and carotid plaque, compared with the participants sleeping 7 h, the multivariable adjusted odds ratios (in model 3) of cognitive impairment among participants were 2.14 (95% CI, 1.20-3.83) for ≤ 5 h, 1.13 (95% CI, 0.67-1.89) for 6 h, 1.51 (95% CI, 0.82-2.79) for 8 h, and 5.37 (95% CI, 1.62-17.80) for ≥ 9 h sleep duration.
Items 95% CI (according to Night Sleep Duration) ≤ 5 h 6 h 7 h 8 h ≥ 9 h Cases, n (%) 27 (9.57) 32 (4.74) 40 (3.43) 18 (4.90) 5 (20.00) Model 1† 2.27 (1.34-3.86) 1.26 (0.78-2.06) Reference 1.65 (0.92-2.96) 5.54 (1.78-17.28) Model 2‡ 2.12 (1.20-3.77) 1.18 (0.71-1.95) Reference 1.46 (0.79-2.68) 5.86 (1.83-18.72) Model 3§ 2.14 (1.20-3.83) 1.13 (0.67-1.89) Reference 1.51 (0.82-2.79) 5.37 (1.62-17.80) Note.CI, confidence interval; †Model 1 was adjusted for age and sex; ‡Model 2 was adjusted for age, sex, family per-member monthly income, education level, marital status, smoking status, drinking status, physical activity, and body mass index; §Model 3 was adjusted for the variables in model 2 plus history of diabetes, hypertension, hyperlipidemia, stroke, and carotid plaque. Table 4. Odds Ratios (95% CI) for Cognitive Impairment according to Night Sleep Duration
We also analyzed the interactions between night sleep duration and sex/age for cognitive impairment and no significant interactions were observed (P= 0.32/0.95).
-
In this large cross-sectional study, we observed a U-shaped association between night sleep duration and cognitive impairment assessed by MMSE score among 2, 514 participants. This association was sustained after taking into account potential confounders, including age, sex, BMI, education level, smoking status, drinking status, physical activity, hypertension, diabetes mellitus, hyperlipidemia, and carotid plaque. Our data suggest that night sleep duration is associated with cognitive impairment and may be used as an additional clinical indicator in assessing increased risk of cognitive impairment.
Previous studies have examined cross-sectional associations between sleep problems and cognitive function[13, 15-22]. Among them, one study conducted in a population sample of individuals aged 50 and over in southern China demonstrated a U-shaped association between sleep duration and cognitive impairment in older people[13]. The prevalence of cognitive impairment was 12.9% in southern China, which was higher than the 4.85% observed in our study. The difference in prevalence may be due to the different methods used to evaluate cognitive impairment. Although the prevalence of cognitive impairment, lifestyle, living conditions, and food intake differ between south and north China, we also found an association between night sleep duration and cognitive impairment in northern China. The overall association between night sleep duration and all cognitive impairment was U-shaped, with the lowest scores consistently associated with short and long sleep duration. On the other hand, Blackwell et al.[34] did not find a cross-sectional association between night sleep duration and cognitive impairment in older women. In a study of 3, 212 Spanish people aged > 60 years, the risk of cognitive impairment increased across night sleep duration groups from 7 to ≥ 11 h, whereas no association was found between short sleep duration and cognitive impairment[18]. Tworoger et al. observed that sleeping < 5 h was associated with poorer results on various cognitive tests administered to 1, 852 women in the United States. However, the association was no longer observed after 2 years of prospective follow-up[21]. These differences may arise from differences in the ethnicities of study participants. Participants in the present study are mainly Han-ethnic Chinese, who probably have different sleep patterns, such as Chinese naptime, and lifestyles compared with other ethnic populations.
The exact pathophysiological explanations underlying the association of night sleep duration with cognitive impairment has not yet been clarified. First, one important biological pathway is through inflammation, as both short sleep duration[35-36] and long sleep duration[37-38] have been associated with an increased level of inflammatory biomarkers. Elevated inflammatory cytokine levels increase the risk of cognitive decline[39-41] and have been associated with increased white matter hyperintensity[42] as well as reduced gray matter volume[42-43]. Second, sleep restriction causes fatigue and daytime sleepiness, which translates to poorer cognitive performance[17]. Third, sleep fragmentation, which can result in poor quality sleep, depression, and underlying disease processes, such as cardiopulmonary disorders, appear to be relevant to the association between sleep duration and cognitive function[44]. Further prospective research is needed to corroborate these mechanisms that underlie these associations.
The strengths of our study include a large sample size, Asian ethnicity of the participants, and a broad spectrum of potential confounding parameters, especially carotid plaque. However, potential limitations of our study should also be mentioned. First, a high number of participants were excluded owing to the lack of MMSE and sleep data, which may generate bias in the results of the statistical analysis. After comparing participants and non-participants, we found that the majority of the non-participants were older, had higher SBP, fasting blood glucose concentrations, and prevalence of carotid plaque, and had lower education level, which are risk factors of cognitive impairment. Second, our study did not exclude participants with obstructive sleep apnea syndrome (OSAS) or parasomnias. OSAS was associated with cognitive decline in a 15-year follow-up study among 966 participants with an average age of 61 years[45]. Third, depression has been shown to be associated with poor sleep, including long sleeping duration[46], and with cognitive function in a previous cohort[47]. However, in our study, we did not collect data on depression, which may generate bias in the results. Fourth, we collected information only on night sleep duration using self-reported questionnaires, and data with respect to midday napping and sleep quality were not collected. Thus, nocturnal sleep duration may be different from the duration of sleep during the entire day, especially in China where napping and poor sleep quality are not unusual. Finally, this was a cross-sectional study, which limits our ability to conclude a cause-and-effect association between night sleep duration and cognitive impairment. Furthermore, all participants were employees of the Kailuan Coal Company, and their health insurance policies were covered by the Kailuan Medical Group; therefore, they cannot be viewed as a representative sample of the Chinese general population. However, studying such a geographically confined and controlled population greatly reduces residual confounding due to diverse socioeconomic factors and lifestyle patterns.
-
In summary, our study indicates that both short sleep duration and long night sleep duration are asso-ciated with an increased risk of cognitive impairment. The underlying neurobiology and mechanistic media-tors linking habitual sleep duration with increased risk of cognitive impairment need to be investigated.
-
Conceived and designed the experiments: WANG Xi Zhu and WU Shou Ling. Performed the experiments and collected data: HU Wan Ning, LIU Xiao Xue, ZHOU Wen Hua, HAN Xiao Chen, and LU Ai Dong. Analyzed the data and wrote the paper: SONG Qiao Feng and LIU Xiao Xue. Reviewed manuscript: SONG Qiao Feng, LIU Xiao Xue, HU Wan Ning, HAN Xiao Chen, LIU Ai Dong, WANG Xi Zhu, and WU Shou Ling. Edited manuscript: LIU Xiao Xue.
-
We thank all study participants, their relatives, the members of the survey teams at the 11 regional hospitals of the Kailuan Medical Group, and the project development and management teams at the Beijing Tiantan Hospital and the Kailuan Group.
-
No conflict of interest to declare.

 Quick Links
 DownLoad: