


HTML
-
Disease patterns have changed rapidly in China over the past three decades. Specifically, the occurrence of noncommunicable diseases (NCDs) has increased[1-2]. Shifts in people's dietary patterns may have contributed to this change[3]. The adequate consumption of vegetables and fruits (VF) is necessary for a healthy lifestyle. VF consumption is associated with the low risk of chronic diseases[4], and high VF consumption is related with the low risk of mortality from all causes[5]. The 2015 Global Burden of Disease study showed that worldwide, the total number of deaths attributable to low VF consumption was 2.0 million and 2.9 million, respectively. The global disability adjusted of life years (DALYs) attributed to low vegetable consumption was 44.6 million and that to low fruit consumption was 72.6 million. In China, low fruit consumption ranked ninth among the 15 leading level-3 risk factors for DALYs[2].
The dietary guidelines of different countries recommend a certain level of VF consumption. VF consumption was a key target of some nationwide health-promotion programs, including that in China. The Chinese Dietary Guidelines for adults recommend consuming 200-400 g/day of fruits and 300-500 g/day of vegetables[6]. The Korean recommendation was 80-240 g/day for fruits and 400-560 g/day for vegetables in accordance with age-sex groups[7]. The US Healthy People 2010 program aimed to increase the proportion of Americans who eat ≥ 160 g of fruit per day to 75% and those who eat ≥ 240 g of vegetables per day to 50%. The France Programme National Nutrition Santé for 2001-2010 aimed to reduce the low French VF consumption rate (< 280 g/day) by 25%[8]. The WHO recommended total VF consumption of at least 400 g/day for an adult.
Given the importance of adequate VF consumption in maintaining a healthy diet, we used nationally representative data to examine VF consumption among Chinese adults and the disparities in VF consumption across Chinese subpopulations. We also identified the association of factors, such as meal frequency and physical activity, with VF consumption.
-
Data were originally collected in the 2013 China Chronic Disease and Risk Factors Surveillance survey, which included 298 survey sites (districts/counties) in all 31 provinces, autonomous regions, and municipalities of mainland China. The surveillance was administered by the National Center for Chronic and Non-communicable Disease Control and Prevention, Chinese Center for Disease Control and Prevention. Previous research had demonstrated that the surveillance was nationally representative[9].
Participants were selected from each study site using a multistage sampling design. In the first stage, four townships were selected from each study site using the method of probability proportional to size. Then, three villages were selected from each sampled township by the same method used in the previous stage. All households were listed within each selected village, from which 50 households were randomly selected. Finally, an adult aged 18 years or older was randomly selected from each household using the Kish grid method[10]. If a sampled individual refused to participate, the household was replaced by a neighboring family with a similar member structure. This replacement strategy guaranteed a sufficient sample size for each survey area.
Data were collected by trained interviewers using a questionnaire, which included demographic information, food consumption frequency, and lifestyle-related factors. Height and weight were measured with standardized tools. All data collectors were trained to follow standardized study protocols, and only qualified staff performed data collection. Data were double-entered and double-checked.
A total of 177, 305 participants completed the interviews. The replacement families were selected from the same residential area, and the overall replacement rate was 6.3%. A subsample of 565 observations from one survey site was deleted given data quality concerns, and 5, 893 observations were excluded because of missing VF consumption data. The final analysis for estimating VF consumption and for studying factors associated with VF consumption included 170, 847 and 160, 897 individuals with complete data, respectively.
-
The quantity and frequency of VF consumption were measured with the food consumption frequency questionnaire. To assess fruit consumption, each respondent was asked: 'In the last 12 months, did you eat fruit?' If he/she responded yes, the respondent was further asked 'How often do you eat fruit?' and 'How many liang (1 liang = 50 grams) do you eat each time on average?' Vegetable consumption was assessed using a set of similar questions. Average daily VF consumption for each respondent was determined separately on the basis of responses to the aforementioned questions. The combined consumption of fruit and vegetables was also calculated. Low VF consumption was defined as a daily VF intake of < 400 g on the basis of WHO recommendations. Low vegetable consumption was defined as < 300 g and low fruit consumption was defined < 200 g on the basis of the Chinese Dietary Recommendation[6].
-
Independent variables included demographic characteristics; socioeconomic status; body mass index (BMI); times of breakfast, lunch, and supper in a typical week; leisure-time physical activity (LTPA); health literacy; and geographic variables (urban/rural residency and region).
Household income per capita was categorized into quartiles: 1 ≤ $1045.3; 2 = $1045.3-1881.6; 3 = $1881.6-3658.6; 4 = ≥ $3658.6; 5 = don't know or refuse to answer. BMI was calculated as weight (kg)/height (m)2 and was categorized into four groups: underweight (BMI < 18.50), normal (BMI of 18.50-23.99), overweight (BMI of 24.00-27.99), or obese (BMI ≥ 28.00)[11].
Individuals who usually had breakfast, lunch, and supper every day in a typical week were defined as the regular meal group and individuals with different meal patterns as the irregular meal group. LTPA was measured using the Global Physical Activity Questionnaire, and metabolic equivalents (METs) were calculated[12]. Vigorous-and moderate-intensity physical activities were merged as a continuous variable LTPA through conversion into metabolic equivalent per individual per week. The weight for vigorous-intensity physical activity was 8.0 and that for moderate-intensity physical activity was 4.0. Physical activity was categorized into three groups on the basis of METs (MET-mins/week): No leisure-time activity, moderate level (METs ≤ 1, 200), and high level (METs ≥ 1, 200).
Health literacy was not systematically measured in the survey. Health literacy was assessed using a proxy indicator with questions about the respondent's knowledge of and attitude toward salt consumption: 1) 'Do you know the recommended salt consumption per day for adults by Chinese Dietary Guidelines?' 2) 'Which of the following diseases do you think could be caused by eating too much salt?' (multiple choice) and 3) 'If you know eating too much salt could harm your health, are you willing to cut down on salt?' Participants who responded 'yes' to the first question and selected 'hypertension' for the second question were defined as health literate; those who responded 'yes' to the first question and did not choose 'hypertension' for the second question were defined as health semiliterate; and those who responded 'no' to the first question were defined as health illiterate. Participants who selected 'willing' for the third question were defined as health positive and those who chose 'unwilling, don't care, and don't know' were defined as health negative. The final categories for health literacy were: 1 = literate and positive; 2 = semiliterate and positive; 3 = illiterate and positive; and 4 = negative[13].
Provinces were nested within seven regions: South (Guangdong, Guangxi, and Hainan), North (Beijing, Tianjin, Hebei, Shanxi, and Inner Mongolia), East (Shanghai, Shandong, Jiangsu, Anhui, Jiangxi, Zhejiang, and Fujian), Central (Hubei, Hunan, and Henan), Southwest (Chongqing, Sichuan, Guizhou, Yunnan, and Tibet), Northwest (Shaanxi, Gansu, Ningxia, Xinjiang, and Qinghai), and Northeast (Heilongjiang, Jilin, and Liaoning)[13].
-
All data were analyzed using SAS version 9.4 (SAS Institute Inc., Cary, NC, USA). The weight for each observation was computed to obtain nationally representative estimates. It was constructed by multiplying a sampling weight (reciprocal of sampling probability for each respondent) and a post-stratified weight (a factor to harmonize the age-sex structure of the sample with the standard population) in accordance with the 2010 census population. This standard population was also used to standardize VF consumption between different years in China. The Taylor linearization method was used to estimate standard errors accounting for the complex survey design. Differences in the prevalence of low VF consumption by groups were tested using the Rao-Scott χ2 test. Linear regression analysis was conducted to test trends across age or educational levels and to compare daily VF consumption across different ages, genders, ethnicities, educational levels, urban/rural residence, geographic locations, marital status, and family income groups. Logistic regression was conducted to test trends for the prevalence of adequate or low VF consumption between different age groups or educational levels. Multivariate logistic regression models were fitted to test the association between low VF consumption and independent variables, such as education level, dining frequency, LTPA, health literacy, age, sex, ethnicity, urban/rural residence, income, BMI, and region. Statistical significance was set at P < 0.05.
Data Source and Survey
Dependent Variables
Independent Variables
Statistical Analyses
-
Table 1 showed the demographic data of all the respondents. Among the 170, 847 participants, 73, 030 (42.7%) were males and 97, 817 (57.3%) were females. The average age of the male and female respondents was 51.6 ± 14.7 and 51.5 ± 13.9 years, respectively. The average age of all respondents was 51.5 ± 14.2 years. With regard to residence location, 32, 070 (40.8%) male and 46, 609 (59.2%) female respondents lived in urban areas, and 40, 960 (44.4%) male and 51, 208 (55.6%) female respondents lived in rural areas.
Characteristics Male Female n % n % Total 73, 030 42.7 97, 817 57.3 Age (years) 18-24 3, 072 50.8 2, 974 49.2 25-34 7, 807 44.9 9, 596 55.1 35-44 13, 119 41.3 18, 653 58.7 45-54 17, 031 39.5 26, 134 60.5 55-64 18, 290 43.1 24, 183 56.9 65 13, 711 45.7 16, 277 54.3 Ethnicity Han nationality 64, 241 42.5 86, 834 57.5 Other 8, 789 44.5 10, 983 55.6 Education Illiterate or some primary school 13, 935 28.9 34, 302 71.1 Primary school graduate 15, 095 44.4 18, 910 55.6 Junior high school graduate 26, 423 49.5 26, 948 50.5 Senior high school graduate or above 17, 577 49.9 17, 657 50.1 Urban/rural residence Urban 32, 070 40.8 46, 609 59.2 Rural 40, 960 44.4 51, 208 55.6 Geographic location South 8, 717 40.9 12, 587 59.1 North 10, 138 41.1 14, 523 58.9 Northeast 9, 562 44.3 12, 047 55.8 East 9, 651 43.3 12, 659 56.7 Central 17, 169 44.3 21, 572 55.7 Southwest 7, 377 42.8 9, 861 57.2 Northwest 10, 416 41.7 14, 568 58.3 Marital status Single 4, 810 64.2 2, 683 35.8 Married or cohabitating 62, 992 43.0 83, 634 57.0 Other 5, 228 31.3 11, 500 68.8 Family income* ≤ $1045.3 15, 677 44.5 19, 586 55.5 $1045.3-1881.6 10, 483 43.5 13, 633 56.5 $1881.6-3658.6 16, 487 42.5 22, 341 57.5 ≥ $3658.6 14, 231 43.8 18, 294 56.3 Unknown 16, 152 40.3 23, 963 59.7 Note. *Household income per capita per year. Table 1. Characteristics of Participants in the 2013 China Chronic Disease and Risk Factor Surveillance (n = 170, 847)
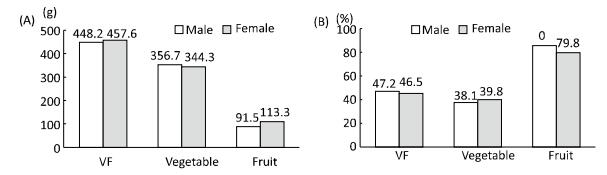
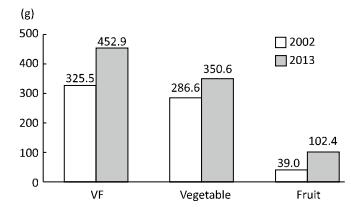
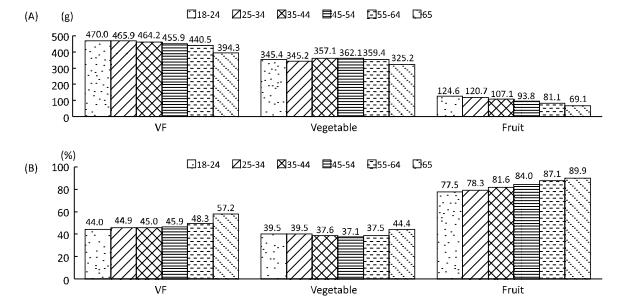
Table 2 showed VF consumption by the overall population, as well as by subpopulation (Figure 1A and Figure 2A). The average fruit consumption was 102.3 g/day (95% CI: 97.0-107.6); the average vegetable consumption was 350.6 g/day (95% CI: 339.3-361.8); and the average combined VF consumption was 452.9 g/day (95% CI: 439.4-466.3). Individuals aged ≥ 65 years and from other ethnicities had significantly lower vegetable consumption than other age groups and those with Han ethnicity [others 312.4 g/day 95% CI: (293.0-331.7) vs. Han 354.2 g/day (95% CI: 342.6-365.8)]. Fruit consumption was significantly lowest among those aged ≥ 65 years, men [91.5 g/day (95% CI: 86.6-96.3) vs. women 113.3 g/day (95% CI: 107.0-119.6)], and rural residents [87.0 g/day (95% CI: 80.7-93.3) vs. urban 120.3 g/day (95% CI: 113.5-127.2)]. Fruit consumption increased with higher educational levels (P for trend < 0.01). Total VF consumption increased with education (P for trend < 0.01). Individuals who live in rural areas reported lower VF consumption than those who live in urban areas [437.0 g/day (95% CI: 418.8-455.1) vs. urban 471.6 g/day (95% CI: 457.4-485.9)]. Figure 3 showed age-standardized VF consumption in 2002 and 2013. Vegetable and fruit consumption was 350.6 and 102.4 g, respectively, in 2013. These values are both higher than those reported in 2002.
Characteristics Fruit Vegetable Fruit and Vegetable % (95% CI)* All 102.3 (97.0-107.6) 350.6 (339.3-361.8) 452.9 (439.4-466.3) 53.2 (50.9-55.4) Age (years) 18-24 124.6 (115.9-133.3) 345.4 (329.6-361.2) 470.0 (450.4-489.6) 56.0 (53.2-58.9) 25-34 120.7 (114.4-127.0) 345.2 (334.2-356.3) 465.9 (452.7-479.2) 55.1 (52.9-57.4) 35-44 107.1 (101.1-113.2) 357.1 (345.5-368.6) 464.2 (449.7-478.7) 55.0 (52.6-57.3) 45-54 93.8 (88.3-99.2) 362.1 (349.8-374.5) 455.9 (441.8-460.0) 54.1 (51.5-56.7) 55-64 81.1 (76.0-86.3) 359.4 (347.4-371.4) 440.5 (426.6-454.4) 51.7 (49.2-54.1) 65- 69.1 (63.3-75.0) 325.2 (310.3-340.1) 394.3 (376.9-411.8) 42.8 (39.6-45.9) P for trend < 0.01 0.22 < 0.01 < 0.01 Gender Male 91.5 (86.6-96.3) 356.7 (345.3-368.1) 448.2 (435.1-461.4) 52.8 (50.6-55.1) Female 113.3 (107.0-119.6) 344.3 (332.7-356.0) 457.6 (442.9-472.3) 53.5 (51.1-56.0) P for difference < 0.01 < 0.01 < 0.01 - Ethnicity Han nationality 103.3 (97.8-108.9) 354.2 (342.6-365.8) 457.5 (443.9-471.2) 54.1 (51.9-56.3) Others 91.3 (77.1-105.6) 312.4 (293.0-331.7) 403.7 (373.4-434.0) 43.6 (37.9-49.4) P for difference < 0.01 < 0.01 < 0.01 - Education Illiterate or some primary school 62.1 (56.7-67.5) 335.4 (321.2-349.6) 397.5 (380.8-414.3) 44.4 (41.5-47.3) Primary school graduate 83.8 (78.1-89.5) 351.2 (336.9-365.4) 435.0 (418.3-451.6) 50.3 (47.3-53.2) Junior high school graduate 104.7 (99.1-110.2) 355.7 (343.4-367.9) 460.3 (445.8-474.8) 54.5 (52.0-57.0) Senior high school graduate or above 138.1 (131.1-145.2) 353.9 (342.1-365.7) 492.1 (477.4-506.7) 59.3 (57.2-61.4) P for trend < 0.01 0.01 < 0.01 < 0.01 Urban/rural residence Urban 120.3 (113.5-127.2) 351.3 (340.0-362.5) 471.6 (457.4-485.9) 56.0 (53.7-58.3) Rural 87.0 (80.7-93.3) 350.0 (334.8-365.1) 437.0 (418.8-455.1) 50.8 (47.8-53.8) P for difference < 0.01 < 0.01 < 0.01 - Geographic location South 85.4 (75.4-95.4) 376.5 (342.9-410.0) 461.9 (429.9-493.9) 56.8 (51.6-62.0) North 111.7 (95.7-127.7) 331.7 (293.7-369.7) 443.4 (393.6-493.2) 50.8 (40.9-60.7) Northeast 122.4 (103.8-141.1) 333.9 (309.9-357.9) 456.3 (422.6-490.1) 51.1 (46.3-55.9) East 111.6 (96.6-126.7) 332.2 (304.6-359.8) 443.8 (408.1-479.5) 52.0 (45.9-58.0) Central 115.4 (103.8-126.9) 348.6 (325.0-372.2) 464.0 (434.9-493.0) 53.8 (49.7-57.8) Southwest 85.2 (69.7-100.7) 339.6 (315.4-363.8) 424.8 (391.5-458.1) 51.1 (45.1-57.0) Northwest 82.4 (70.1-94.6) 374.6 (352.7-396.6) 457.0 (428.7-485.3) 53.9 (48.9-58.8) P for difference < 0.01 < 0.01 < 0.01 - Marriage Single 121.4 (113.1-129.6) 343.5 (328.7-358.2) 464.8 (447.3-482.3) 55.1 (52.2-57.9) Married or cohabitating 101.4 (96.1-106.7) 353.4 (342.3-364.6) 454.9 (441.3-468.4) 53.5 (51.2-55.8) Other 72.2 (65.4-78.9) 323.8 (309.4-338.2) 396.0 (378.3-413.6) 44.3 (41.2-47.4) P for difference < 0.01 < 0.01 < 0.01 - Family income ≤ $1045.3 84.9 (77.9-91.9) 345.3 (329.9-360.8) 430.2 (412.1-448.4) 49.2 (46.1-52.2) $1045.3-1881.6 96.7 (90.2-103.2) 351.5 (338.2-364.8) 448.2 (431.8-464.6) 52.5 (49.9-55.1) %1881.6-3658.6 109.4 (102.9-115.9) 357.3 (344.9-369.6) 466.7 (451.2-482.2) 55.7 (53.1-58.2) ≥ $3658.6 127.2 (118.6-135.9) 358.4 (344.8-372.7) 485.6 (468.0-503.3) 57.3 (54.9-59.7) Unknown 95.4 (86.7-104.2) 342.2 (325.5-358.9) 437.6 (417.3-458.0) 51.6 (47.9-55.3) P for difference < 0.01 < 0.01 < 0.01 - Note. *Statistical difference for the prevalence of adequate VF consumption among different groups was equal with that for the prevalence of low VF consumption shown in Table 3. Table 2. Average and prevalence of adequate VF consumption (g/day) based on the WHO recommendation among Chinese Adults by demographic characteristics: The 2013 China Chronic Disease and Risk Factor Surveillance [n = 170, 847, mean (95% CI)]
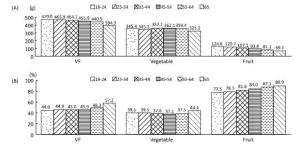
Figure 1. VF consumption (A) and the prevalence of low VF consumption (B) by age.
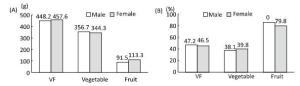
Figure 2. VF consumption (A) and the prevalence of low VF consumption (B) by sex.
-
Table 3 showed that the prevalence of overall low VF consumption rate is 46.8% (95% CI: 44.6%-49.1%). VF consumption rate marked varied by age, ethnicity, educational level, urban/rural residence, marital status, and family income. The highest prevalence of low VF consumption was observed among those aged ≥ 65 years (57.2%, 95% CI: 54.1%-60.4%) and those who are illiterate or have an educational attainment of primary school (55.6%, 95% CI: 52.7%-58.5%). Nearly half [47.2% (95% CI: 44.9%-49.4%)] of men and 46.5% (95% CI: 44.1%-48.9%) of women did not consume sufficient VF.
Variable Low VF* Low Vegetable† Low Fruit† % (95% CI) χ2 P % (95% CI) χ2 P % (95% CI) χ2 P All 46.8 (44.6-49.1) 38.9 (36.7-41.2) 82.4 (81.0-83.8) Age groups (years) 167.9 < 0.01 43.8 < 0.01 307.3 < 0.01 18-24 44.0 (41.1-46.8) 39.5 (36.0-42.9) 77.5 (75.2-79.8) 25-34 44.9 (42.6-47.1) 39.5 (37.2-41.8) 78.3 (76.5-80.1) 35-44 45.0 (42.7-47.4) 37.6 (35.4-39.9) 81.6 (79.9-83.3) 45-54 45.9 (43.3-48.5) 37.1 (34.7-39.6) 84.0 (82.5-85.6) 55-64 48.3 (45.9-50.8) 37.5 (35.0-40.0) 87.1 (85.8-88.5) 65- 57.2 (54.1-60.4) 44.4 (41.1-47.6) 89.9 (88.5-91.3) Gender 1.2 0.27 10.0 < 0.01 102.9 < 0.01 Males 47.2 (44.9-49.4) 38.1 (35.9-40.3) 85.0 (83.7-86.2) Females 46.5 (44.1-48.9) 39.8 (37.3-42.2) 79.8 (78.1-81.6) Ethnicity 14.3 < 0.01 2.0 0.15 2.1 0.15 the Han nationality 45.9 (43.8-48.1) 38.7 (36.3-41.0) 82.2 (80.7-83.7) Others 56.4 (50.6-62.1) 41.9 (37.8-46.0) 84.9 (81.8-88.0) Education 198.5 < 0.01 11.1 0.01 546.1 < 0.01 Illiterate or some primary school 55.6 (52.7-58.5) 41.4 (38.6-44.2) 91.7 (90.5-92.8) Primary school graduate 49.7 (46.8-52.7) 38.6 (35.7-41.6) 86.9 (85.5-88.4) Junior high school graduate 45.5 (43.0-48.0) 37.6 (35.2-40.1) 82.2 (80.7-83.6) Senior high school graduate or above 40.7 (38.6-42.8) 39.1 (36.6-41.7) 73.7 (71.4-76.0) Urban/rural residence 10.8 < 0.01 0.5 0.50 51.4 < 0.01 Urban 44.0 (41.7-46.3) 39.5 (36.9-42.2) 77.9 (75.9-80.0) Rural 49.2 (46.2-52.2) 38.4 (35.6-41.2) 86.2 (84.7-87.8) Geographic location 2.8 0.83 16.2 0.01 30.4 < 0.01 North 49.2 (39.3-59.1) 32.3 (27.2-37.5) 86.2 (83.9-88.6) South 43.2 (38.0-48.4) 43.5 (35.2-51.7) 79.9 (75.8-84.0) Northeast 48.9 (44.1-53.7) 44.4 (39.9-48.9) 77.6 (73.5-81.8) East 48.0 (42.0-54.1) 42.4 (36.2-48.6) 79.6 (75.1-84.2) Central 46.3 (42.2-50.3) 41.8 (37.3-46.3) 79.5 (76.2-82.9) Southwest 49.0 (43.0-54.9) 37.1 (29.8-44.5) 87.4 (85.0-89.8) Northwest 46.1 (41.2-51.1) 32.4 (28.1-36.7) 87.2 (84.2-90.3) Marital status 45.1 < 0.01 16.0 < 0.01 56.7 < 0.01 Single 45.0 (42.2-47.8) 40.2 (36.7-43.6) 77.9 (75.3-80.4) Married or cohabitating 46.5 (44.2-48.8) 38.4 (36.1-40.6) 82.7 (81.3-84.1) Others 44.3 (52.6-58.8) 44.7 (41.6-47.8) 88.3 (86.4-90.2) Family income 31.3 < 0.01 1.5 0.83 83.8 < 0.01 ≤ $1045.3 50.8 (47.8-53.9) 39.2 (35.9-42.5) 86.7 (85.1-88.3) $1045.3-1881.6 47.5 (44.9-50.1) 38.8 (36.1-41.5) 84.5 (82.9-86.1) $1881.6-3658.6 44.3 (41.8-46.9) 37.8 (35.3-40.3) 80.5 (78.6-82.4) ≥ $3658.6 42.7 (40.3-45.1) 39.5 (36.7-42.3) 76.2 (73.7-78.6) unknown 48.4 (40.3-45.1) 39.5 (35.9-43.2) 84.0 (81.6-86.3) Note. *Recommendation of WHO (VF ≥ 400 g/day); †Chinese Dietary Guidelines (≥ 200 g/day for fruits and ≥ 300 g/day for vegetables). Table 3. Prevalence (%) of Low Vegetable and Fruit (VF) Consumption, Low Vegetable Consumption, and Low Fruit Consumption Among Chinese Adults in 2013 (n = 170, 847). Rates were Based on the WHO Recommendation and Chinese Dietary Guidelines
The prevalence of low VF consumption among urban residents was lower than that among rural residents [44.0% (95% CI: 41.7%-46.3%) vs. 49.2% (95% CI: 46.2%-52.2%), P = 0.01]. Low VF consumption was associated with old age (P for trend < 0.01) but inversely related with education (P for trend < 0.01). The prevalence of low fruit consumption was 82.4% (95% CI: 81.0%-83.8%) and that of low vegetable consumption was 38.9% (95% CI: 36.7%-41.2%).
-
Table 4 showed that age, gender, ethnicity, educational level, marital status, family income, BMI, health literacy, breakfast frequency, lunch frequency, and LTPA are significantly associated with low VF consumption rate (P < 0.05). The effect of urban/rural residence was trivial (OR = 1.04, 95% CI: 0.93-1.16). Compared with individuals with normal weight, underweight individuals were 1.17 times (95% CI: 1.03-1.33) more likely to have low VF consumption, whereas obese individuals had lower odds (OR = 0.90, 95% CI: 0.84-0.97). Individuals with higher educational attainment were more likely to consume adequate VF by approximately 14%-27% than those without. Health literacy is also associated with low VF consumption rate. Compared with those without LTPA, active individuals were less likely to have low VF consumption rate by approximately 12%-26%. Compared with their counterparts, irregular breakfast (OR = 1.20, 95% CI: 1.04-1.38) or irregular lunch (OR = 1.58, 95% CI: 1.26-1.99) frequencies were associated with lower VF intake. Dinner regularity, however, was not associated with low VF consumption.
Covariates OR 95% CI P Intercept 0.80 0.24 Age (years) 1.01 1.00, 1.01 < 0.01 Gender Male (ref) Female 0.93 0.88, 0.97 < 0.01 Ethnicity Han nationality (ref) Others 1.41 1.15, 1.74 < 0.01 Education Illiterate or some primary school (ref) Primary school graduate 0.86 0.81, 0.93 < 0.01 Junior high school graduate 0.79 0.73, 0.85 < 0.01 Senior high school graduate or above 0.73 0.66, 0.81 < 0.01 Urban/rural residence Urban (ref) Rural 1.04 0.93, 1.16 0.49 Marital status Married or cohabitating (ref) Single 1.20 1.08, 1.33 < 0.01 Others 1.15 1.06, 1.24 < 0.01 Income ≤ $1045.3 (ref) $1045.3-1881.6 0.94 0.86, 1.03 0.16 $1881.6-3658.6 0.88 0.79, 0.98 0.02 ≥ $3658.6 0.90 0.78, 1.02 0.10 Unknown 0.99 0.87, 1.13 0.88 Weight (BMI) status Normal (ref) (18.50-23.99) Underweight (< 18.50) 1.17 1.03, 1.33 0.02 Overweight (24.00-27.99) 1.00 0.95, 1.05 0.97 Obesity(≥ 28) 0.90 0.84, 0.97 < 0.01 Health literacy Literate and positive (ref) Semiliterate and positive 0.90 0.80, 1.01 0.07 Illiterate and positive 1.32 1.15, 1.52 < 0.01 Negative 1.29 1.06, 1.57 0.01 Breakfast frequency Regular (ref) Irregular 1.20 1.04, 1.38 0.01 Lunch frequency Regular (ref) Irregular 1.58 1.26, 1.99 < 0.01 Dinner frequency Regular (ref) Irregular 0.97 0.72, 1.31 0.85 Leisure-time physical activity No (ref) Low (METs ≤ 1200) 0.88 0.80, 0.98 0.02 High (METs ≥ 1200) 0.74 0.66, 0.83 < 0.01 Note. *Geographic locations were also included in the model but had no significant associations (P > 0.05). Thus, the results for geographic locations were not reported. Table 4. Associations (OR and 95% CI) between covariates and low vegetable and fruit consumption rate among Chinese adults based on weighted logistic regression analysis (n = 160, 897)*
VF Consumption
Prevalence of Low VF Consumption
Factors Associated with Low VF Consumption Rate
-
We used nationally representative survey data to examine recent VF consumption patterns in China. We found that the average VF consumption Chinese adults was 452.9 g/day and nearly half of Chinese adults (46.8%) failed to meet the VF consumption rated recommended by the WHO. Large differences in VF consumption existed across groups, especially between adults from rural vs. urban areas. Educational attainment, BMI, breakfast frequency, physical activity, and health literacy were associated with VF consumption.
As shown in Figure 3, VF consumption, especially fruit consumption, in 2013 was higher than that in 2002. The increases in family income and public health education over the last decade might have contributed to the increases in VF consumption. The national survey data showed that among the Chinese population, age-standardized daily average vegetable consumption for the years of 1992 and 2002 was 310.3 and 276.1 g, respectively, and the standard daily average fruit consumption was 49.2 g and 45.0 g, respectively[14-15].
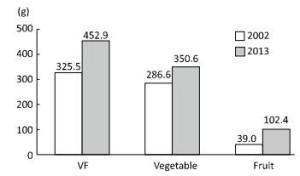
Figure 3. Standard VF consumption among the adult Chinese population in 2002 and 2013.
Vegetables have always been an important ingredient of Chinese cuisine. However, the importance of fruit consumption has not been recognized until recently. Over the past two decades, the prevalence of obesity/overweight and other lifestyle-related NCDs, such as hypertension, type 2 diabetes, and dyslipidemia, have increased rapidly in China[16-17]. The increase in these NCDs may have been partially caused by the shifts in dietary patterns. In recent years, efforts have been made in China to promote VF consumption. A previous study showed that between 1991 and 2011, the average daily VF consumption of Chinese adults aged 18-44 years increased from 352.7 g to 411.7 g, and the prevalence of adequate vegetable and fruit consumption based on Chinese Dietary Guidelines changed from 53.0% to 50.2% and 1.3% to 17.4%, respectively[18]. The 2011 results were similar to ours.
Other researchers reported on VF consumption in other countries, such as South Korea (289 and 160 g, respectively), Thailand (142 and 117 g, respectively), and Iran (106 and 101 g, respectively)[7, 19-20]. The proportion of adequate VF consumption according to WHO recommendation was 20.9% in South Korea[7], 26.6% in Thailand (25.4% for males and 27.7% for females)[19], and 12.5% in Iran (11.6% for males and 13.4% for females)[20]. In the US, the 2009 Behavioral Risk Factor Surveillance System of the Centers for Disease Control and Prevention reported that 32.5% of American adults met the US recommendation for fruit consumption (≥ 160 g/per day) and 26.3% met the recommendation for vegetable consumption (≥ 240 g)[21]. A France SU.VI.MAX cohort study reported that 54% of males and 53% of females metmeet the recommended consumption rate for fruit or vegetables (≥ 400 g/day)[8]. The difference in diet culture might explain the disparities between China and other countries. In traditional Chinese cuisine, vegetables were necessary ingredients and important food sources given their affordability. Moreover, due to increased health consciousness, Chinese people were attaching additional importance to healthy diets that include vegetables.
Although VF consumption is relatively high, fruit consumption remains low in China. The average VF consumption is higher than the WHO recommendation but the average fruit consumption is far less than the Chinese recommendation[6]. This result can be attributed to the following: In China, fruit is usually consumed as snacks and not a necessary dietary component. In addition, fruit is generally more expensive than vegetables. Although average fruit consumption remains relatively low, it has increased rapidly over time, e.g., during 1991-2011, fruit consumption increased from 10.7 g/day to 90.1 g/day[18].
VF consumption and the prevalence of adequate VF consumption are higher among urban residents than rural residents. Specifically, vegetable consumption was similar between urban and rural residents, whereas fruit consumption rate significantly differ between urban and rural residents. The notable discrepancy in economy, disposable income, and grocery market systems between urban and rural areas may explain this difference. Fruit is generally more expensive than vegetables and are often produced as commodities to be transported from rural areas to urban areas. Meanwhile, urban residents have more disposable income and better self-health care consciousness than rural residents. To increase VF consumption, especially fruit consumption, programs are needed to improve nutrition education[22-24], pricing, access, promotion, and advertising[25-26].
Educational level is associated with VF consumption in China. Individuals with high educational levels are more likely to have higher VF intake than those without. This finding is consistent with results from Bangladesh, Vietnam, Indonesia, Thailand[27], and Korea[28]. Individuals with high educational attainment may be more likely to understand the benefits of VF intake and seek a healthy lifestyle, including sufficient VF consumption, than those without[29-31]. Another community-based intervention study (included nutrition knowledge, physical activity, and other kinds of intervention to improve VF intake) showed that high nutrition knowledge improves VF consumption[32]. Poor health literacy is associated with low VF consumption.
The explanation for the association between obesity and VF consumption can be complex. VF intake may affect body weight given that it contains higher amounts of fiber and other nutrients with lower energy content than other food[20, 33]. The US 2007 Behavior Risk Factors Surveillance System data showed an inverse association between BMI and VF intake: Individuals with high BMIs had low VF intake[34-35]. Differences in food culture and dietary habits may explain the differences observed in China and the US.
Our study showed that Chinese adults with irregular breakfast or lunch frequency were more likely to have low VF consumption. Some previous research found that among adolescents, irregular breakfast frequency was associated with unhealthy eating habits and poor nutrition, including low VF intake[36-37].
We found an association between leisure-time physical activity and VF consumption among Chinese adults; this association has been observed in other studies[38]. A FINRISK study showed that physical inactivity is a risk factor for inadequate VF consumption[29]. Another study showed that inadequate VF consumption and insufficient physical activity were related[39].High levels of leisure-time physical activity partly reflect the health attitudes of individuals, and individuals with healthier lifestyles are more likely to consume enough VF than those without. In this study, we used variable health literacy to represent health knowledge and beliefs. Those with low-level health literacy were more likely to have inadequate VF consumption. To increase VF consumption interventional programs that promote healthy eating habits, good nutritional knowledge, and healthy life attitudes are needed.
This study had several key strengths. First, we used a large nationally representative sample and weighting methods to find nationally representative estimates. In addition, data were collected through standardized protocols to ensure data quality. Nevertheless, our study also suffers from some limitations. First, cross-sectional data were used, and we could not test causality nor draw any causal inferences. Second, VF consumption was based on self-reports, and thus could suffer from reporting errors and biases.
In conclusion, nearly half of Chinese adults failed to meet the VF consumption recommended by the WHO and the average fruit consumption failed to meet the recommended by Chinese Dietary Guidelines. Residence in rural areas, low educational level, irregular breakfast or lunch frequencies, lack of LTPA, and low health literacy were negatively associated with VF consumption. National efforts and programs are needed to promote VF consumption to help combat the growing chronic disease epidemic in China.
-
We thank all involved researchers and investigators for their support and effort in this study. We thank Dr. XUE Hong for his assistance to the project.
-
WLM, LYC, JB, and WYF designed this study; JB performed data analysis and wrote the first draft; and ZM, HZJ, DQ, ZMG, and ZZP were responsible for data collection and project implementation. All authors read and approved the final manuscript. Part of Dr. WANG You Fa's effort is funded by a research grant from the National Institute of Health (NIH, U54 HD070725). The U54 project (U54 HD070725) is funded by the Eunice Kennedy Shriver National Institute of Child Health and Human Development (NICHD) and the Office of the Director, National Institutes of Health (OD). Dr. WANG You Fa is the principal investigator of the projects. The content of the paper is solely the responsibility of the authors and does not necessarily represent the official views of the funders.

 Quick Links
 DownLoad: