

-
The T-2 toxin is one of the most toxic and common fungal mycotoxins. It has been acknowledged that it is naturally present in moldy corn, grains, and some other agricultural products, particularly in humid areas[1]. Moisture in the air provides favorable conditions for fungus growth and leads to increased levels of T-2 toxin. Exposure to this toxin can lead to many pathological changes, including cardiovascular alterations, nervous disorders, immunity inhibition, dermal inflammation, reproductive system damage, and cartilaginous necrosis[2].
Kaschin-Beck disease (KBD) is a chronic, endemic, degenerative osteoarthropathy, emainly distributed in the diagonal broad belt ranging from southeastern Siberia in Russia to southwest China[3]. According to China health statistics yearbook in 2010, there were 105.84 million residents at risk and approximately 0.69 million KBD patients in 14 provinces or autonomous regions of China (Chinese Health Statistical Digest 2010). In KBD endemic areas, the T-2 toxin has been widely detected in high levels in crops and food as opposed to the non-KBD areas. It has been suggested that the T-2 toxin may affect the expression of genes related to apoptosis, oxidative stress, mitochondrial function, and lipid metabolism, as well as cytokine levels in articular chondrocytes, eventually causing extracellular matrix (ECM) degradation and cell apoptosis in the articular cartilage[4].
Metabonomics is a systematic analytical method that provides a quantitative approach to assess metabolic regulations in the organism[5]. It presents the advantage of having high sensitivity, high resolution, rapid separation, and covering a high dynamic range of concentrations. Therefore, metabonomics has the potential to identify associations between metabolism and phenotype, and to further support studies on related metabolic pathways and networks in the organism. Comparsion with other detection technology, such as nuclear magnet resonance (NMR), gas chromatography-mass spectrometer (GC-MS), ultra-performance liquid chromatography and Q-TOF mass spectrometry (UPLC/Q-TOF MS) with better detection limits, better throughput, increased chromatographic resolution, and improved mass-spectrographic data quality has been widely applied in many metabonomic studies.
In this study, to further explore the molecular pathogenesis of cartilage destruction induced by the T-2 toxin, we established a rat anomaly model with articular cartilage destruction by T-2 toxin treatment and we used metabonomics analytical methods based on UPLC-Q-TOF MS to search for differences in metabolites, and to draw a detailed picture of changes in metabolic pathways in these rats.
Thirty healthy male Wistar rats were procured from Vital River Laboratory Animal Technology Co. Ltd. (Beijing, China). All animals were allowed to acclimatize for 7 days. Subsequently, the rats were randomly divided into control and model groups. The rats in the control group were fed with a standard rat diet, and those in the model group were given a standard rat diet containing T-2 toxin (300 ng/g). T-2 toxin crystals (Lot No. T4887, Sigma, St. Louis, MO, USA) were dissolved in pure ethanol (GR) to prepare a 3 mg/mL stock solution, which was diluted to 30 μg/mL and sprayed on the standard rat diet. The intended concentration of 300 ng of T-2 toxin/g of chow was obtained after sufficient evaporation of the solvent. Throughout 3 months of the study, all the animals had free access to distilled water and food at all times.
Blood samples were collected from the abdominal aorta and subsequently centrifuged to obtain the serum that was stored at -80 ℃ until the metabonomics analysis was conducted. Knee joints were fixed in 10% phosphate-buffered formalin in natural flexion position for 2 days and processed for histopathology evaluation.
Fixed knee joints were decalcified in 10% (w/v) ethylenediaminetetraacetic acid for 3 months. Tissue blocks were dehydrated in gradient series of ethanol, cleared in xylene, embedded in paraffin, sectioned, and stained with hematoxylin and eosin for histological examination. A microimaging system (Olympus, Tokyo, Japan) was used to observe pathological changes and collect microscopic images.
Before UPLC-MS analysis, proteins in serum samples (100 μL) were precipitated using methanol (300 μL). Next, the supernatant was reconstituted with acetonitrile and water (3:1), filtered through a 0.22 μm filter membrane, and removed into an autosampler vial for UPLC-MS analysis.
Chromatographic separation was carried out on a WATERS HSS T3 column (100 mm × 2.1 mm, 1.7 μm, i.d.; Waters Corporation) using a Waters ACQUITY UPLC System (Waters Corp., Milford, MA, USA). A 2-μL aliquot of supernatant was injected into the column. Analytes were eluted from the column using a gradient of water (A) and acetonitrile (B) (containing 0.1% formic acid) as the mobile phase. The gradient condition was: 0-1 min 100% A; 1-5 min, linear from 2% to 60% B; 5-8 min, linear from 60% to 98% B; 8-13 min, held at 98% B; and 13-15 min, immediate reduction to 2% B for equilibration of the column. Each run time was of 15 min with a flow rate of 0.30 mL/min. For MS analysis, the Waters Xevo G2 Q-TOF (Quatropde Time-of-Flight) Mass Spectrometer (Waters Corp.) was connected to the UPLC system via an electrospray ionization (ESI) interface. The mass-spectrometric full-scan data were acquired in the positive ESI mode from 50 Da to 1200 Da using the following optimal conditions: 3.0 kV capillary voltage, 120 ℃ source temperature, 350 ℃ desolvation temperature, 20 V sample cone voltage, cone gas flow of 50 L/h, and desolvation gas flow of 800 L/h.
The UPLC/Q-TOF MS data were processed using Micromass MarkerLynx Application version 4.1 (Waters Corporation, MA, USA). Following denoising, deconvolution, peak extraction, alignment, and merging, the data matrix containing assigned peak numbers (retention time-m/z pairs), sample names, and normalized ion intensities were exported into the SIMCA-P 11.5 software (Umetrics, Umea, Sweden) for partial least squares-discriminant analysis (PLS-DA), which were used to obtain the greatest variable importance in projection (VIP) values and to visualize the score plot. The variables with VIP values above 1.0 in the model were considered potential biomarkers. The goodness of the fit was quantified by R2, while the predictive ability was indicated by Q2.
Independent-samples t test was used for statistical analysis using the SPSS 17.0 software, and a P value < 0.05 was considered to be statistically significant. The databases HMDB (http://www.hmdb.ca) and METLIN (http://metlin.scripps.edu/) were used to identify the potential metabolic markers candidates based on their tandem mass spectrometry (MS/MS) spectra.
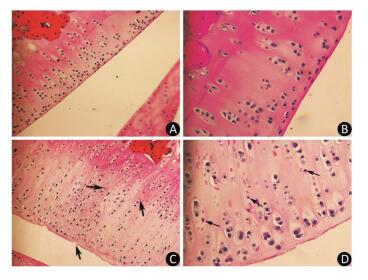
As the experiment progressed, some rats in the model group displayed slight diarrhea and hair loss; however, no significant differences in the mean body weight of the animals were detected between the two groups at any point of the experiment. The histopathological analysis of the articular cartilage in knee joints showed no signs of articular cartilage injury in rats fed with normal diets, as expected (Figure 1A-B). In contrast, the articular cartilage from the model rats revealed extensive areas of chondrocyte necrosis and superficial cartilage defect. Red 'cell ghosts', hypereosinophilic cytoplasm, and fragmented pyknotic nuclei consistent with apoptosis could be recognized in the photomicrographs (Figure 1C-D).

Figure 1. Light microscopy features of articular cartilage from Wistar rat knee joint stained with hematoxylin-eosin. Panels (A, 200× and B, 400×) show cartilages from control group fed with normal diets. Panels (C, 200× and D, 400×) show cartilages from model group treated with T-2 toxin. The arrows indicate superficial cartilage defect, chondrocyte necrosis and degeneration of cartilage.
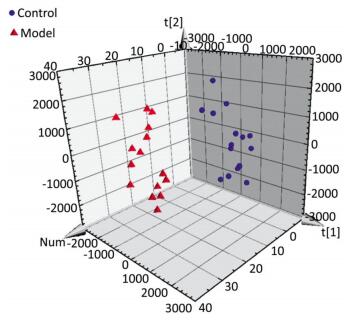
The serum samples were analyzed by UPLC/QTOF-MS in positive ionization mode. The PLS-DA method was then applied to identify significant clusters for multivariate data analysis. The PLS-DA scores (for the first two components, R2 = 0.949 and Q2 = 0.564) in positive ionization mode, which are shown in Figure 2, revealed a significant separation between the control and the model groups. Next, the VIP value, a commonly used biomarker selection method that evaluates the overall importance of the variables in the PLS-DA model and reflects the correlation of the endogenous metabolites with body status, was used and variables with VIP values above 1.0 were selected. Finally, an independent t-test was applied to determine the significance of the selected variables (P < 0.05). Based on these results, some ions were selected as biomarker candidates. These ions were primarily responsible for the significant separation in the score plot and strongly revealed the metabolic differences between the rats in the control and the model groups.
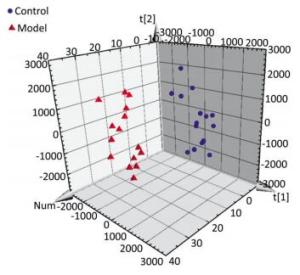
Figure 2. Score plot with PLS-DA of serum metabolite in control (sphere, blue), model (pyramid, red) rats in positive ESI mode.
The structural identification of the selected substances was performed by comparing the exact mass data, retention time, and corresponding MS/MS fragments with those of reference standards in the HMDB and METLIN databases. The 8 metabolites identified in the positive mode are shown in Table 1 including lysoPC(16:0), lysoPC [16:1(9Z)], lysoPC[18:4(6Z, 9Z, 12Z, 15Z)], lysoPC(14:0), lysoPE(18:0/0:0), L-valine, asparaginyl-glycine, and hippuric acid. All of them were significantly increased in the model group. These results suggest that the metabolic alterations associated with articular cartilage damage are related to the phospholipid and amino acid metabolic pathways.
Retention Time (min) Measured Mass (Da) Calculated Mass (Da) Mass Error (ppm) Metabolite Description* VIP Peak Areas (x±s) t-Value P-Value Control Group (n = 15) Model Group (n = 15) 8.83 496.3406 496.3403 0.60 LysoPCa(16:0) 6.33 3, 661, 000 ± 14, 245 3, 975, 000 ± 22, 130 4.624 0.000 8.59 494.3248 494.3247 0.20 LysoPC[16:l(9Z)] 6.01 572, 600 ± 75, 965 835, 600 ± 16, 487 5.613 0.000 8.59 516.3068 516.3090 4.26 LysoPC[18:4(6Z, 9Zl12Z45Z)] 3.42 223, 800 ± 33, 075 316, 900 ±67, 766 4.781 0.000 8.47 468.3093 4GS.3090 0.64 LysoPC(14:0) 2.77 267, 100 ±41, 078 330, 900 ±38, 193 4.411 0.000 5.93 190.0864 190.0828 18.94 Asparaginyl-glycine 2.29 60, 960 ±1, 290 92, 920 ± 8, 2D3 S.096 0.000 4.42 180.0658 180.0661 1.67 Hippuric acid 1.09 43, 720 ±7, 108 52, 740 ±1, 011 2.827 0.009 0.84 118.0864 118.0868 3.39 L-valine 1.03 20, 740 ±5, 016 28, 970 ±4, 275 4.833 0.000 8.67 482.3251 482.3247 0.83 LysoPEb(18:0/0:0) 1.73 350, 700 ±59, 233 394, 100 ±55;544 2.068 0.048 Note. *Concentration change with a positive value indicates a relatively higher concentration present in the model rats compared to the control group (P < 0.05). aLysoPC (Lysophosphatidylcholine). bLysoPE (Lysophosphatidyl ethanolamine). Table 1. The Identified Difference Metabolites in UPLC/Q-TOF MS Positive ion Mode
Abnormalities in phospholipid metabolism are known to be a clear risk factor for cardiovascular disease and play important roles in systemic inflammation, cartilage destruction, and cell apoptosis[6]. In addition, differences in the relative composition and in the levels of various phospholipid species have been detected in human plasma and synovial fluid from patients with varying degrees of osteoarthritis (OA), thus indicating that alterations in phospholipid composition and concentration are associated with the development of OA[7]. In the present study, the increased levels of phospholipid metabolites, such as lysoPE(18:0/0:0), lysoPC(14:0), lysoPC[18:4(6Z, 9Z, 12Z, 15Z)], lysoPC[16:1(9Z)], and lysoPC(16:0) indicated a marked perturbation in the phospholipid metabolic pathway in the rat anomaly model.
Lysophosphatidylethanolamine (LysoPE) has an important role in membrane structure and as energy reserve. The levels of lysoPE(18:0/0:0) increased following the massive destruction of membranes that occurred as a consequence of the cell apoptosis observed during the histological examination of the knee articular cartilage. Therefore, the increased levels of lysoPE(18:0/0:0) suggest a massive destruction of membranes induced by the T-2 toxin.
Lysophosphatidylcholine (LysoPC) is a naturally occurring product formed by the activity of the phospholipase A2 (PLA2) that removes fatty acids from the cell membrane and from lipoprotein phospholipids. LysoPC not only is produced at sites of inflammation were it upregulates growth factors and adhesion molecules, but it can also regulate the function of immune cells to participate in inflammatory processes and immune responses. It is known that the T-2 toxin significantly increases reactive oxygen species (ROS) through suppression of the mitochondrial membrane potential and of the activity of mitochondrial complexes in articular chondrocytes[2]. The excessive ROS would in turn activate PLA2 to catalyze the hydrolysis of the ester bond at the sn-2 position of phospholipids, resulting in the production of the majority of the serum LysoPC[10]. Eventually, the elevated levels of LysoPC would participate in an inflammatory process, likely contributing to the development of articular cartilage destruction.
The second pathway identified as perturbed in our model was the amino acid metabolic pathway. In particular, the levels of L-valine, hippuric acid, and asparaginyl-glycine increased significantly in the serum of the model rats. L-valine is an essential amino acid and a common component of proteins. Hippuric acid is the glycine conjugate of benzoic acid, and asparaginyl-glycine is a dipeptide which is an incomplete breakdown product of the protein catabolism[9]. The production and degradation of hippuric acid and asparaginyl-glycine in serum are related to glycine content, which together with its metabolic pathway may undergo pathological alterations during the development of OA. Valine to histidine, and leucine to histidine ratios in serum have also been proposed to be potential biomarkers for the management of OA[10]. Therefore, the levels of valine, hippuric acid, and asparaginyl-glycine in serum could change together with the destruction and catabolism of the articular cartilage.
Although we successfully characterized the endogenous metabolite profile of the model rat, our study had several limitations. Firstly, although the model rats were treated with a low dose of T-2 toxin, the occurrence of other systemic injuries caused by the toxin, which could interfere with the results to a certain degree, is unavoidable. Secondly, the analysis of the urine and the synovial fluid, in addition to the serum samples analyzed in this study, would have given a better picture. Finally, analysis of the serum samples by UPLC/QTOF-MS in the negative ionization mode, in addition to the positive ionization mode carried out here, would have allowed identifying additional specific metabolites.
In summary, we have successfully carried out serum metabonomics using UPLC/Q-TOF MS technology on Wistar rats treated with the T-2 toxin. Eight metabolites related to the metabolism of phospholipids and amino acids have been identified as being associated to articular cartilage destruction. Further research on these metabolic changes might provide important information on the molecular pathogenesis of T-2 toxin-induced articular cartilage destruction.
All the authors have read the manuscript and have agreed to submit it in its current form for consideration for publication in the Journal. None of the authors has any conflicting interests to declare.
The experimental protocol was approved by the Animal Ethics Committee of the Harbin Medical University. Use of animals in this experiment was in accordance with the Guide for the Care and Use of Laboratory Animals (National Research Council, 1996).
Serum Metabonomics of Articular Cartilage Destruction Induced by T-2 Toxin in Wistar Rats
doi: 10.3967/bes2018.009
Funds:
the National Natural Science Foundation of China 81372937
- Received Date: 2017-07-18
- Accepted Date: 2017-12-01
Abstract: The molecular pathogenesis of T-2 toxin-induced cartilage destruction has not been fully unraveled yet. The aim of this study was to detect changes in serum metabolites in a rat anomaly model with articular cartilage destruction. Thirty healthy male Wistar rats were fed a diet containing T-2 toxin (300 ng/kg chow) for 3 months. Histopathological changes in femorotibial cartilage were characterized in terms of chondrocyte degeneration/necrosis and superficial cartilage defect, and the endogenous metabolite profile of serum was determined by UPLC/Q-TOF MS. Treated rats showed extensive areas of chondrocyte necrosis and superficial cartilage defect in the articular cartilage. In addition, 8 metabolites were found to change significantly in these rats compared to the control group, including lysoPE (18:0/0:0), lysoPC(14:0), lysoPC[18:4 (6Z, 9Z, 12Z, 15Z)], lysoPC[(16:1(9Z)], lysoPC(16:0), L-valine, hippuric acid, and asparaginyl-glycine. These 8 metabolites associated with cartilage injury are mainly involved in phospholipid and amino acid metabolic pathways.
| Citation: | ZHU Lei, ZHAO Zhi Jun, REN Xiao Bin, LI Qiang, DING Hua, SUN Zhou, KAO Qing Jun, WANG Li Hua. Serum Metabonomics of Articular Cartilage Destruction Induced by T-2 Toxin in Wistar Rats[J]. Biomedical and Environmental Sciences, 2018, 31(1): 76-80. doi: 10.3967/bes2018.009

|

 Quick Links
 DownLoad: