


HTML
-
Esophageal cancer is one of the malignant tumors that threaten human health. Globally, esophageal cancer ranked ninth for cancer incidence and sixth for cancer death in 2013[1]. At present, most patients are treated via surgical resection, which is the main treatment method for esophageal cancer, however, the 5-year survival rate of patients with advanced disease is poor[2]. Therefore, identifying biomarkers with high sensitivity and specificity in the process of esophageal cancer progression and metastasis is essential for the early diagnosis of esophageal cancer and plays an important role in reducing mortality and improving the quality of life of these patients.
The tumor microenvironment is a dynamic environment that is composed of tumor cells, stromal cells (including tumor-associated fibroblasts, tumor-associated macrophages, pericytes, vascular endothelial cells, immune cells, etc.) and extracellular matrix during tumor growth[3]. Tumor cells interact with their microenvironment, which promotes their growth and metastasis[4]. Therefore, the study of tumor microenvironment has revealed a new approach for the diagnosis and treatment of cancer. Here, exosomes play a role in information exchange between the tumor and the tumor microenvironment. Exosomes are a class of membranous small vesicles, about 40 to 100 nm in diameter. They are released to the extracellular environment after the fusion of intracellular multivesicular bodies with the cell membrane. Exosomes are found not only in the culture supernatant of a variety of cells (such as hematopoietic cells, epithelial cells, tumor cells, etc.), but also in human fluids, such as serum (pulp), saliva, and urine[5]. There are a variety of bioactive substances in exosomes that can be delivered to recipient cells by fusion with the recipient cells[6]. One of these molecules is microRNA, a class of endogenous single-stranded non-coding RNA, which can regulate gene expression at post-transcriptional level by degrading the target mRNA or by inhibiting its translation via complete or incomplete base complementary pairing with the 3'-untranslated region (3'UTR) of the target mRNA molecule[7]. Studies have confirmed that tumor-derived exosomes contain different types of tumor cell-specific miRNA, in large quantities, and their molecular characteristics partially reflect the origin of the tumor phenotype[8]. Thus, the specific miRNAs carried by the plasma tumor-derived exosomes could be used as potential tumor markers in a variety of malignant tumors. In addition, plasma exosomes are stable in vitro, easy to collect, and less harmful to the human body, which makes them ideal for early clinical diagnosis of cancer.
Based on the above understanding, identification of tumor-specific miRNAs in serum (plasma) is important for large-scale screening of high-risk groups and early detection of tumors. To date, a number of tumor-specific miRNAs have been identified in tumor-derived exosomes in the serum (plasma) of patients with ovarian cancer[9, 10], pancreatic cancer[11, 12], lung cancer[13, 14], colon cancer[15, 16], breast cancer[17-19], and prostate cancer[20, 21]. However, there are few tumor-specific miRNAs identified in the plasma of esophageal cancer patients. Therefore, we screened 20 differentially expressed miRNAs in the plasma of esophageal cancer patients and healthy controls by miRNA microarrays, as previously described, of which 15 were up-regulated and 5 were down-regulated. Details of the microarray data are provided in an article published by another member of our group[22]. In this study, we selected the up-regulated miR-19b-3p, miR-25-3p, miR-93-5p, and let-7i-5p, and confirmed their expression by fluorescence quantitative PCR. Subsequently, we investigated the relationship between the statistically significant miR-93-5p and the risk of esophageal cancer, as well as its effect on the biological function of esophageal cancer cells when transmitted by exosomes.
-
For this study, 84 Han Chinese patients living in the Huai'an area for more than 20 years, diagnosed with primary esophageal squamous cell carcinoma (ESCC) by pathology or endoscopy, were selected as case group. All patients were treated with surgery, without radiotherapy. Han Chinese volunteers living in Huai'an with the same sex, age difference of ± 5 years old, and no digestive system diseases were matched with the ESCC patients, according to 1:1 pairing principle. Venous blood samples were collected from patients with esophageal cancer before surgery, as well as from the healthy controls, with the approval of the Southeast University Affiliated Zhongda Hospital Clinical Ethics Committee and the informed consent of the study participants.
-
Total RNA was extracted from cells and plasma using Trizol reagent (Invitrogen, USA) and the Blood (Serum/Plasma) Total RNA Extraction Kit (Nuo Lun, Shanghai), according to the manufacturers' instructions. The RNA concentration was determined using a NanoDrop spectrophotometer (Thermo, US). Extracted total RNA was stored at -80 ℃.
The reverse transcription reaction system for miRNA was as follows: total RNA 0.5 μg, 500 nnol/L RT primer (Riobio, Guangzhou) 1 μL, RNase-Free ddH2O (Tiangen, Beijing) was added to 5.5 μL; the mixture was heated at 70 ℃ for 10 min and placed on ice for 2 min; added 5 × RT Buffer 2.5 μL, 2.5 mmol/L dNTPs (Tiangen, Beijing) 1 μL, RNase-Free ddH2O 3 μL, 40 U/μL ribonuclease inhibitor (Thermo, US) 0.25 μL, and 200 U/μL MMLV (Promega, USA) 0.25 μL; the Mastercycler gradient PCR instrument (Eppendorf, Germany) was used for the reaction, and the conditions were 42 ℃ for 1 h, 70 ℃ for 10 min. The reverse transcription reaction for mRNA was as follows: total RNA 0.5 μg were mixed with 10 μmol/L OligoDT18 Primer 1 μL; added RNase-Free ddH2O to 15 μL, heated the mixture to 70 ℃ for 5 min and placed on ice for 5 min; followed by 5× MMLV Buffer 5 μL, 10 mmol/L dNTPs 1.25 μL, 200 U/μL MMLV 1 μL, 40 U/μL ribonuclease inhibitor 0.65 μL, and RNase-Free ddH2O 2.1 μL; placed the prepared sample in the Mastercycler gradient PCR instrument, and the reaction conditions were 42 ℃ for 1 h, 95 ℃ for 5 min, after which the product (cDNA) was stored at -20 ℃.
-
The reaction system was as follows: 10× Buffer 2 μL, 2.5 mmol/L dNTPs 1.6 μL, 1.6 μL of upstream and downstream primers, RNase-Free ddH2O 12 μL, cDNA 1 μL, and Taq DNase (Quanshijin, Beijing) 0.2 μL; reaction using Mastercycler gradient PCR: 75 ℃ for 5 min; 94 ℃ for 30 s, 60 ℃ for 30 s, 72 ℃ for 30 s, 12 cycles; following 72 ℃ for 5 min, the pre-amplification products were stored at -20 ℃.
-
The reaction was performed using the SYBR Green PCR master mix (Toyobo, Japan), upstream and downstream primers, RNase-Free ddH2O and cDNA template on the StepOne-plus fluorescence quantitative PCR instrument (ABI, US). The PCR product of miRNA was quantitatively corrected by the internal reference gene U6, while β-actin was used as invariant control for the mRNA analysis. The relative expression ΔCT value of the target gene was obtained by subtracting the Cycle threshold (CT) value of the target gene from that of the internal reference gene. The 2-ΔΔCt method was used to reflect the difference in expression between the target group and the control group.
-
FBS (foetal bovine serum; Gibico, USA) was centrifuged at 200, 000 ×g for 6 h to remove the bovine exosomes. 10% exosome-free FBS, 100 μg/mL streptomycin, and 100 U/mL penicillin were added to RPMI-1640 medium (Gibico, USA) to obtain the complete cell culture medium. The human esophageal cancer cell line EC9706 was rapidly resuscitated in a 37 ℃ water bath, removing the original cell cryopreservation solution and adding fresh complete medium, and placed in a 37 ℃, 5% CO2 (volume fraction), saturated humidity incubator for culture. Upon reaching 80%-90% confluency, cells were digested with 0.25% trypsin (containing 0.02% EDTA) for cell passage according to the ratio of 1:2.
-
20 μmol/L miRNA mimic stock solution was prepared with sterile DNase/RNase-Free ddH2O and stored at -20 ℃. Subsequently, 2 μL of 20 μmol/L miRNA mimic stock solution and 3 μL RNAiMAX (Invitrogen, USA) were respectively diluted with 250 μL serum-free medium Opti-MEM and incubated at room temperature for 5 min. Next, the two solutions were mixed and incubated at room temperature for 20 min to form a miRNA mimics-RNAiMAX mixture. Before transfection, the EC9706 cells with good condition were digested and inoculated in cell culture plates (3 × 10⁵/well). 500 μL miRNA mimics-RNAiMAX mixture was then added to each well, and each well was supplemented with RPMI-1640 complete medium without antibiotics to a total volume of 2 mL. Lastly, the culture plates were placed in the incubator for conventional culture.
-
After 36 h of transfection with miRNA mimics, EC9706 (donor cells) were inoculated at a density of 1 × 10⁵/well in the upper chamber of a Transwell culture plate (cell membrane pore size 0.4 μm), whereas the conventional cultured EC9706 cells (recipient cells) were inoculated into the lower chamber, at a density of 1 × 10⁵/well, one day earlier. After incubation for 24 h, the expression of Cy3-miRNAs in the recipient cells was observed under the FSX100 Bio-Intelligent Navigator (Olympus, Japan). The expression of miR-93-5p in recipient cells was detected by Stem-loop real time RT-PCR.
-
The EdU solution was diluted at a 1, 000:1 ratio with RPMI-1640 complete medium without antibiotics to a final concentration of 50 μmol/L, and the old culture medium in the culture plates was discard. Subseqently, 300 μL of 50 μmol/L EdU medium were added to each well and discarded after incubation for 2 h. Each well was then washed with phosphate buffer twice, for 5 min each time. Sequentially, 150 μL of 4% paraformaldehyde-containing PBS were added to each well for 30 min at room temperature and discarded, 150 μL of 2 mg/mL glycine were added to each well and discarded after incubation for 5 min on a shaker, and 300 μL of PBS were added per well to wash the cells for 5 min and discarded. To enhance cell membrane permeability, 300 μL of 0.5% TritonX-100 PBS were added to each well and discarded after 10 min incubation on the shaker. The cells were then washed with PBS for 5 min. Meanwhile, 1 mL 1 × Apollo® staining solution was prepared, including 938 μL Apollo® deionized water, 50 μL Apollo® reaction buffer, 10 μL Apollo® catalyst solution, 3 μL Apollo® Fluorescent Dye Solution, and 9 mg Apollo® Buffer Additive. In sequence, 300 μL of 1 × Apollo® were added to each well and discarded after incubation on the shaker for 30 min at room temperature in the dark, and 300 μL of 0.5% TritonX-100 PBS were added to each well, for three washes on shaker of 10 min each, and discarded. To reduce the dye background, 300 μL of methanol were added to each well and washed twice, for 5 min each time, then the cells where rinsed with PBS for 5 min. After preparing the 1 × Hoechst 33, 342 reaction solution, 300 μL were added to each well and discarded after incubation on the shaker for 30 min at room temperature in the dark, then 300 μL of PBS were added to each well to wash the cells 3 times, for 5 min each. Finally, 300 μL PBS were added to each well and the plates were kept at 4 ℃ in the dark.
The cells were placed under the 200-fold microscope of the FSX100 Bio-Intelligent Navigator, and 10 fields were selected randomly for each well of cells. The number of proliferating cells (red fluorescence) and viable cells (blue fluorescence) were counted respectively, and the proliferation rate was calculated by the number of red fluorescent cells/blue fluorescent cells × 100%.
-
Cells were collected and washed twice with PBS at 2, 000 rpm for 5 min, the cell concentration was then adjusted to 1 × 10⁶/mL, and 1 mL of the prepared cell suspension was taken after centrifugation. Subsequently, 500 μL of cold ethanol were added with a volume fraction of 70% and the cells were fixed at 4 ℃ (2 h to overnight). After the cells were washed with PBS, 100 μL RNase A were added and the cells were incubated in a 37 ℃ water bath for 30 min. Then, 400 μL Propidium Iodide (PI) was added and the cells were dark stained for 15 min. Finally, the cells were placed on a flow cytometer to detect the red fluorescence at the excitation wavelength of 488 nm.
-
Cells were collected and washed with PBS, then resuspended in serum-free RPMI-1640 medium. Next, 5 × 10³ cells were seeded on the upper chamber of a Transwell plate (cell membrane pore size 8 μm), which was supplemented with medium to 150 μL. The lower chamber was supplemented with 600 μL of complete RPMI-1640 medium without antibiotics. After incubation in the cell incubator for 24 h, the chamber was carefully removed, and the culture medium was aspirated. The cells were fixed with 95% ethanol for 10 min and stained by 0.1% crystal violet dye for 20 min, then washed with PBS. After air-drying, the chamber was observed through a bio-intelligent navigator to count and compare the number of transmembrane cells in each group.
-
The Matrigel matrix (BD, US) was dissolved at 4 ℃ and diluted in serum-free RPMI-1640 (volume ratio = 1:8). The Matrigel solution was then added to the upper chamber of the Transwell plate (chamber membrane diameter 8 μm) at 50 μL/well. After being kept overnight at 4 ℃, the chamber was placed at 37 ℃ for 2 h before use. Cells were collected and resuspended in serum-free RPMI-1640 medium, then seeded at 1 × 10⁵/well onto the Transwell upper chamber with Matrigel matrix and supplemented with medium to 150 μL. Next, 600 μL RPMI-1640 medium containing 50% FBS were added to the lower chamber. After incubation in a cell incubator for 24 h, the culture medium was removed from the chamber, and the Matrigel matrix and the cells that did not pass through the membrane were wiped with a cotton swab. The remaining cells were stained by 0.1% crystal violet dye for 20 min, then washed with PBS. After air-drying, the cells on the chamber membrane were immersed in 33% acetic acid solution for 15 min to elute the crystal violet, then the absorbance was measured at 570 nm.
-
Cells were collected by centrifugation at 2, 000 rpm for 5 min and washed twice with PBS. Then, 500 μL 1 × Binding Buffer were added to resuspend the cells. For fluorescent labelling, 5 μL Annexin V-FITC and 10 μL PI (Lianke, Hangzhou) were added to each well. After gentle mixing, the cells were incubated at room temperature for 15 min in the dark, and apoptosis was detected on the flow cytometer within 1 h.
-
The PTEN 3'UTR was cloned into the pmiR-RB-REPORT™ double luciferase reporter vector to obtain pmiR-Report-WT-PTEN. Mutant vectors were obtained by ligating GCACTTT with higher scoring from the binding site of miR-93-5p into CGTGAAA. Renilla luciferase was used as an internal control. EC9706 cells in the miR-93-5p mimics or negative control group were transfected to 96-well plates (1 × 10⁴ cells/well) with pmiR-Report-WT-PTEN, pmiR-Report-MUT-PTEN, as was the corresponding empty vector reporter plasmid by Lipofectamine RNAiMAX. Luciferase activity was measured using the Dual-Luciferase reporter assay system (Promega), 48 h after transfection.
-
EC9706 cells which were transfected with miR-93-5p mimic for 24 h were lysed with RIPA lysis buffer and protease inhibitors, and centrifuged at 14, 000 ×g at 4 ℃ for 6 min. A total of 20 μg protein was isolated by 10% SDS PAGE gel and transferred onto a PVDF membrane. Then, the PVDF membrane was placed in 5% skimmed milk powder (BD, US) solution and placed on a shaker at room temperature for 2 h. The primary antibodies of PTEN (Cell Signaling Technology, US) were diluted with 5% skimmed milk solution at a volume ratio of 1:1, 000. The membrane was then incubated with the respective antibodies at 4 ℃ on a shaker overnight. The horseradish peroxidase-labeled goat anti-mouse secondary antibody (Shenggong, Shanghai) was diluted with 5% skimmed milk in TBST at a volume ratio of 1:5, 000, then incubated with the membrane at room temperature for 40 min. The protein-antibody complex was visualized using the enhanced chemiluminescence kit (Thermo, US) and the chemiluminescence image analysis system (Tianneng, Beijing).
-
Our group has previously established a method for the isolation and identification of exosomes[23], and this study uses the same method. In short, the method was as follows: the exosomes were extracted by differential centrifugation and ultracentrifugation. The supernatant was collected after centrifugation at 300 ×g for 10 min, 1, 200 ×g for 20 min, and 10, 000 ×g for 30 min at 4 ℃. The supernatant was then centrifuged at 200, 000 ×g at 4 ℃ for 2 h. The resulting pellet was resuspended by adding clean PBS buffer and centrifuged again at 100, 000 ×g at 4 ℃ for 2 h. After discarding the supernatant, exosomes were resuspended in 100 μL PBS and stored at -80 ℃. Transmission electron microscopy was used to observe the morphology of exosomes. Western blotting was used to identify the expression of CD63, a surface marker molecule of exosomes.
-
Three pairs of plasma samples from esophageal cancer patients and matched healthy controls were randomly selected from the collected study samples. Total RNA extraction from plasma was performed using the mirVanaTM PARISTM Isolation Kit (Ambion, USA) according to the standard protocol provided by the manufacturer. The extracted total RNA was quantified by Agilent Bioanalyzer 2100 electrophoresis. MiRNA molecules in samples were fluorescently labeled using the miRNA Complete Labeling and Hyb Kit (Agilent, USA) and subjected to hybridization experiments. Results of the miRNA microarray were scanned using the Agilent Microarray Scanner (Agilent, USA).
-
The esophageal carcinoma (ESCA) miRNA-Seq and RNA-Seq data of 185 cases were downloaded from the TCGA database. The miR-93 expression data included a total of 198 samples consisting of 185 ESCA and 13 normal esophageal samples. The mRNA expression data included a total of 172 samples consisting of 161 ESCA and 11 normal esophageal samples. Statistical analysis was performed on these data.
-
SPSS 13.0 was used for data analysis. Statistical analysis included the paired t test, Pearson correlation analysis, and conditional logistic regression analysis (α = 0.05). The common genes of four predictive software (DIANA, miRTarBase, RNA22, TargetMiner) were used as target genes for candidate miRNAs. The GO database and the KEGG database were used to perform functional and pathway annotations on the target genes. The significant KEGG pathway was selected by GO enrichment, and the significance criteria were as follows: P < 0.05, FDR < 0.05.
Materials
Total RNA Extraction and Reverse Transcription
Pre-amplification of Plasma RNA Reverse Transcription Product (cDNA)
Real-time Fluorescence Quantitative RT-PCR
Cell Culture
Cell Transfection
Co-culture Experiment
Cell Proliferation Experiment
Cell Cycle Assay
Cell Migration Assay
Cell Invasion Assay
Apoptosis Analysis
Luciferase Reporter Assay
Western Blot
Isolation of Exosomes
MiRNA Microarray
TCGA Database Analysis
Statistical and Bioinformatics Analyses
-
Through questionnaire we collected data of demographic characteristics of 84 pairs of esophageal cancer patients and healthy controls. There were 52 (62%) males and 32 (38%) females in each group, and Table 1 shows the age, smoking, alcohol consumption, gastrointestinal disease history, family history of cancer, education, and occupation of the two groups. The results showed that there was no significant difference in the average age distribution, family history of cancer and education between the case group and the control group, while the distribution of smoking, alcohol consumption, history of gastrointestinal diseases and occupation was statistically different.
Variables ESCC Patients (n = 84) Healthy Controls (n = 84) P Valuea Age (year) 61.83 ± 7.63 63.06 ± 9.08 0.345 Smoking indexb < 400 45 65 0.002 ≥ 400 39 19 Alcohol consumption Never 43 60 0.011 Yesc 41 24 Digestive disease history 0.028 No 67 79 Yes 9 2 Family history of cancer No 70 78 0.153 Yes 10 5 Education Primary school and illiterate 48 44 0.618 Junior high school and above 18 20 Occupation Peasants 70 51 0.001 Others 14 33 Note.aχ2 test for smoking, alcohol use, digestive disease history, family history of cancer, education and occupation. bSmoking index = cigarettes/day × smoking years. cConsumed alcohol at least once a month. Table 1. Characteristics of ESCC Patients and Healthy Controls
-
Fluorescence quantitative PCR was used to validate the expression of up-regulated miRNAs (miR-19b-3p, miR-25-3p, miR-93-5p, and let-7i-5p) selected by plasma microarray in preoperative esophageal cancer patients and healthy controls. The expression of miRNAs in plasma was analyzed by paired t test. As shown in Table 2, the expression of miR-93-5p was statistically different (P = 0.035) between the two groups, the expression level in the plasma of ESCC patients being 1.39 times higher than that of the control population, while the expression of miR-19b-3p, miR-25-3p, and let-7i-5p did not differ significantly (P > 0.05).
Groups miRNAs N △Cta △△Ctb 2 –ΔΔCt P Value ESCC Patients miR-19b-3p 83 3.684 ± 2.212 -0.116 ± 2.596 1.084 0.684 ( > 0.05) miR-25-3p 81 0.589 ± 1.680 -0.313 ± 2.120 1.242 0.188 ( > 0.05) miR-93-5p 82 0.291 ± 1.798 -0.472 ± 1.987 1.387 0.035 ( < 0.05) let-7i-5p 81 2.731 ± 2.633 -0.341 ± 2.051 1.266 0.139 ( > 0.05) Healthy Controls miR-19b-3p 3.800 ± 1.900 miR-25-3p 0.902 ± 2.017 miR-93-5p 0.763 ± 1.694 let-7i-5p 3.072 ± 2.354 Note. aΔCt = Cttarget miRNA -CtU6. bΔΔCt = ΔCtESCC patients plasma -ΔCthealthy controls plasma. Table 2. Differential Expression of Four Candidate miRNAs in Plasma from ESCC Patients vs. Healthy Controls by RT-PCR
-
To investigate the relationship between the expression of plasma miR-93-5p and the risk of esophageal cancer, the expression of miR-93-5p (-ΔCt) was set as covariate and analyzed by conditional logistic regression. The up-regulation of plasma miR-93-5p in ESCC patients increased the risk of esophageal cancer, OR = 1.280, P = 0.042. This suggests that miR-93-5p may play an important role in the development of esophageal cancer.
-
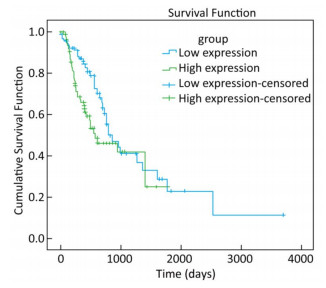
To explore whether the expression of miR-93-5p in esophageal cancer cells is different from that in adjacent tissues, miRNA sequencing data of 185 cases of esophageal cancer patients from the TCGA database were analyzed. As shown in Table 3, the expression of miR-93-5p in cancer tissues was significantly higher than that in adjacent tissues (P < 0.05). In addition, patients were divided into two groups according to their mean expression levels and the Kaplan-Meier survival analysis was carried out. We found miR-93-5p is significantly related with patient survival. Compared with the low expression group, miR-93-5p overexpression was significantly associated with poor clinical outcome (Figure 1).

Figure 1. Survival analysis of esophageal cancer patients according to miR-93-5p expression.
Groups miRNAs N Expression Levela t Value P Value Esophageal cancer tissues miR-93-5p 185 3.9 ± 0.13 -12.232 < 0.001 Adjacent tissues 13 3.4 ± 0.28 Note. amiR-93-5p expression was logarithmically transformed. Table 3. Expression of miR-93-5p in Esophageal and Paracancerous Tissues
-
The co-culture model of Transwell upper and lower chambers was used to study the transfer of miR-93-5p by exosomes from donor cells to recipient cells and the resulting effects. As shown in Figure 2A, donor EC9706 cells were grown in the upper chamber of a Transwell plate, while the lower chamber was seeded with recipient EC9706 cells. The diameter of the bottom membrane of the chamber was 0.4 μm, which allows the passage of supernatants but not that of the cellular components. Red fluorescence was visible in most of the recipient EC9706 cells after the donor EC9706 cells were transfected with Cy3-labeled miR-93-5p mimics and co-cultured with recipient EC9706 cells for 24 h (Figure 2B). QRT-PCR results showed that when miR-93-5p mimics were transfected into EC9706 cells for 48 h, the expression level of miR-93-5p in recipient EC9706 cells was 1.44 times that of miR-NC group after co-culture for 24 h (Figure 2C), which indicates that the donor cell EC9706-derived miR-93-5p was transferred into the recipient EC9706 cells by exosomes.
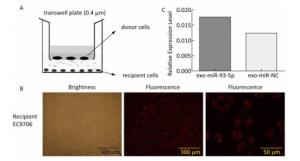
Figure 2. Cy3-miR-93-5p is transferred between EC9706 cells by exosomes. Transwell cell co-culture model (A). Observation of Cy3-miR-93-5p in recipient EC9706 cells (B). Expression level of miR-93-5p in recipient EC9706 cells (C).
-
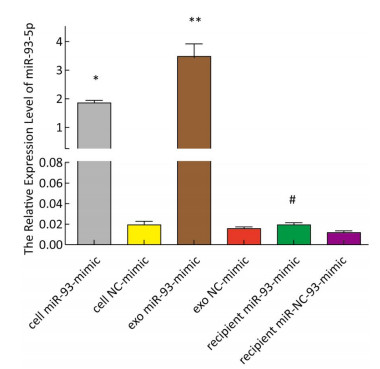
The expression of miR-93-5p in miRNA-transfected EC9706 cells and their exosomes was detected by real-time quantitative PCR. As shown in Figure 3, in EC9706 cells, the expression level of miR-93-5p in the miR-93-5p mimic transfection group was 108 times that of the control group (P < 0.05); in exosomes of EC9706 cells, the expression level of miR-93-5p in the miR-93-5p-mimic-transfected group was 230 times that of the control group (P < 0.05); in recipient EC9706 cells, the expression level of miR-93-5p in the miR-93-5p-mimic-transfected group was 1.8 times that of the control group (P < 0.05).
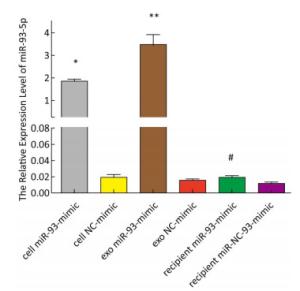
Figure 3. Expression of miR-93-5p in miRNA mimic-transfected EC9706 cells and exosomes. From left to right are miR-93-mimic transfected EC9706 cells, miR-NC-mimic transfected EC9706 cells, exosomes of miR-93-mimic transfected EC9706 cells, exosomes of miR-NC-mimic transfected EC9706 cells, recipient EC9706 cells of miR-93-5p-mimic transfected group, and recipient EC9706 cells of miR-NC-mimic transfected group. *P < 0.05 compared with the cell NC-mimic group, **P < 0.05 compared to the exo NC-mimic group, #P < 0.05 compared with the recipient miR-NC-mimc group.
-
The proliferation of EC9706 cells was detected after co-culture for 24 h, and the proliferation rate of the miR-93-5p group was 36.95% ± 5.58%, which was significantly higher than that of the negative control group 30.60% ± 3.91% (P < 0.05). This indicates that after donor EC9706 cells overexpressed miR-93-5p, miR-93-5p transferred by exosomes could promote the proliferation of recipient EC9706 cells through the cell co-culture model (Figure 4A-B). The cell cycle of recipient EC9706 cells was detected by flow cytometry after co-culture for 24 h. The proportion of G1 phase, S phase and G2 phase cells in the miR-93-5p mimic treatment group was 68.04% ± 0.81%, 23.26% ± 0.71%, and 8.70% ± 0.28%, respectively, while the proportion of G1 phase, S phase and G2 phase cells in the negative control group was 67.54% ± 0.87%, 23.53% ± 0.74%, and 8.92% ± 0.51%, respectively. There was no significant difference in the proportion of cells between the two groups (P > 0.05) (Figure 4D). Flow cytometry showed that the early apoptosis rate was 5.07% ± 1.55% after miR-93-5p mimics were transfected into EC9706 cells for 48 h, which was not significantly different (P = 0.797) from that of the negative control group 5.37% ± 1.08% (Figure 4C). This result suggests that miR-93-5p had no effect on the apoptosis of EC9706 cells. Compared with the negative control group, the migration and invasive ability of EC9706 cells in the miR-93-5p mimics transfection group were not significantly changed (P = 0.597) (Figure 4E-F). This suggests that miR-93-5p had no effect on EC9706 cell migration and invasion.
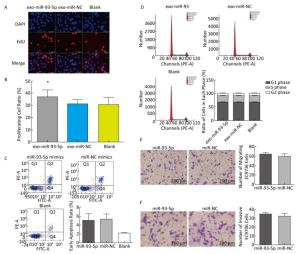
Figure 4. Effects of miR-93-5p transferred by exosomes on the biological function of recipient EC9706 cells. EdU staining of recipient EC9706 cells (A) and cell proliferation ratio (B), *P < 0.05 compared with the exo-miR-NC group. The apoptotic ratio of different MiRNA mimics transfected groups; Q1, Q2, Q3, Q4 represent the dead cells, late apoptotic cells, normal live cells and early apoptotic cells, respectively, *P < 0.05 compared with MiR-NC group (C). Cycle detection of recipient EC9706 cells, *P < 0.05 compared with the exo-miR-NC group (D). Effect of miR-93-5p mimic on the migration of EC9706 cells (E). Effect of miR-93-5p mimic on the invasion of EC9706 cells (F).
-
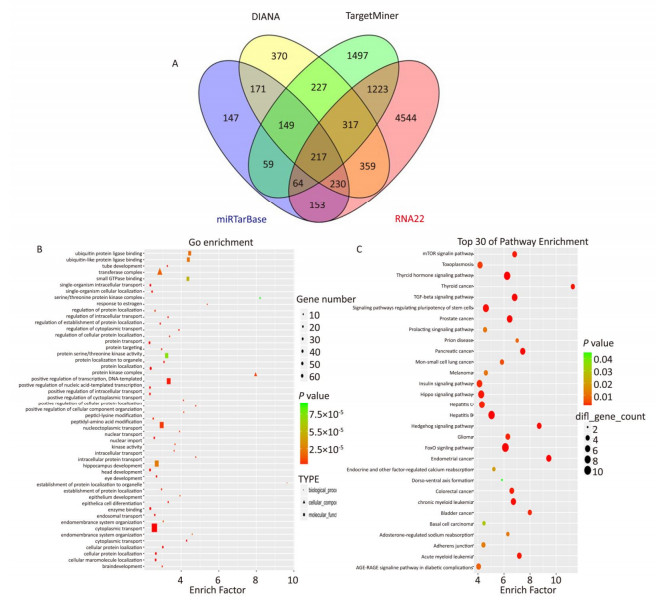
The target genes of miR-93-5p were predicted by four miRNA target gene prediction software (DIANA, miRTarBase, RNA22, TargetMiner), with 2, 040, 375, 1, 191, and 7, 107 target genes predicted, respectively, and there were 217 uniform target genes among them (Figure 5A). Functional significance analysis and functional annotation of candidate target genes were performed by the GO database. The target genes of miR-93-5p belonged to 165 GO classes, with the significance function of the target gene being mainly focused on the molecular function (enzyme activation and binding, protein binding, ion binding, macromolecule complex binding, etc.), cell synthesis (cytoskeleton, intracellular composition, cell nucleus, organelle, cell and organelle membrane sector, etc.), biological procedures (protein localization, amino acid modification, genetic material synthesis and transcription, cytoplasmic and nuclear transport, intracellular signal transduction, cell proliferation and development, macromolecular biosynthesis and metabolism, etc.), involving the cell cycle, growth, differentiation, apoptosis and other processes. Figure 5B lists the functional annotations with enrichment at the top 50 positions. Pathway annotation of the miR-93-5p candidate target genes was performed by the KEGG database. The results showed that miR-93-5p-regulated target genes were significantly involved in the mTOR signaling pathway, FoxO signaling pathway, and TGF-beta signaling pathway. Figure 5C shows the KEGG pathway of miR-93-5p with the enrichment at the top 30 positions.

Figure 5. Bioinformatics analysis of miR-93-5p target genes. Prediction number of miR-93-5p target genes (A). GO analysis of miR-93-5p candidate target genes (B). Signal analysis of miR-93-5p candidate target genes (C).
-
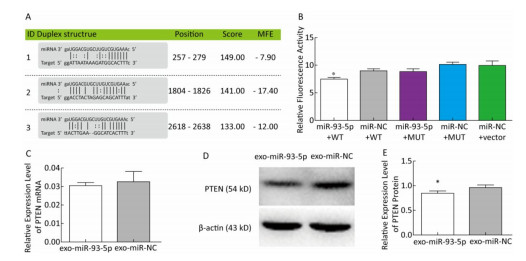
In order to further explore the effect of miR-93-5p on the proliferation of EC9706 cells through exosomes, the tumor-associated gene PTEN, which is associated with cell cycle and proliferation based on the literature and the common prediction of target gene prediction software DIANA, TargetMiner, miRTarBase, and RNA22, was selected for further study. There were three bioinformatics-predictived binding sites between miR-93-5p and PTEN 3'UTR (Figure 6A). The luciferase reporter assay was used to detect whether PTEN is a target gene of miR-93-5p. The results showed that the relative luciferase activity of the co-transfected pmiR-Report-WT-PTEN and miR-93-5p groups was significantly decreased compared with the co-transfected pmiR-Report-WT-PTEN and miR-NC groups. However, there was no significant difference in relative luciferase activity between the pmiR-Report-MUT-PTEN and miR-93-5p co-transfected group and the pmiR-Report-MUT-PTEN and miR-NC group, which suggested that miR-93-5p binds directly to the PTEN 3'UTR (Figure 6B). After incubation with donor EC9706 cells transfected with miR-93-5p/NC mimics for 24 h, the total RNA of recipient EC9706 cells was extracted to detect the expression level of PTEN mRNA. The results showed that PTEN expression in the miR-93-5p group was 0.94 times that of the miR-NC group, which was not statistically significant (P = 0.32), suggesting that miR-93-5p transferred by exosomes may not regulate PTEN at mRNA levels (Figure 6C). To further verify whether miR-93-5p transferred by exosomes affects the expression level of PTEN protein, the recipient EC9706 cells were collected and the total protein was extracted to detect the change in PTEN protein level after co-culture for 24 h. As shown in Figure 6D-E, the expression of PTEN protein in the miR-93-5p group was decreased compared with the miR-NC group, illustrating that miR-93-5p transferred by exosomes could inhibit the expression of PTEN protein in recipient EC9706 cells.
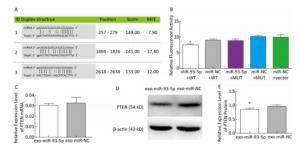
Figure 6. miR-93-5p transferred by exosomes inhibits the expression of PTEN protein in recipient cells by binding to the 3'UTR. Three binding sites and their scoring of miR-93-5p and PTEN 3'UTRs predicted by bioinformatics (A). The relative luciferase activity in EC9706 cells; WT: wild type, Vector: empty vector, MUT: mutation type. *P < 0.05 compared with that of the miR-NC + WT group (B). The effect of miR-93-5p transferred by exosomes on the expression of PTEN mRNA (C) and protein (D, E), *P < 0.05 compared with the exo-miR-NC group.
-
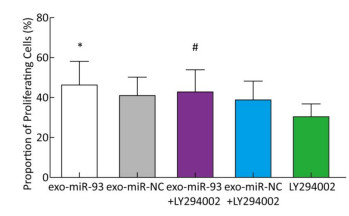
To explore the mechanism of miR-93-5p transferred by exosomes on the proliferation of recipient EC9706 cells, the PI3K/Akt inhibitor LY294002 (final concentration of 60 μmol/L) was added to donor EC9706 cells transfected with miR-93-5p/NC mimics. After 24 h of co-culture, the proliferation of recipient cells was measured. Compared with the miR-NC group, the proliferation rate of receptor cells in the miR-93-5p group increased by 13.41%, while the proliferation rate of miR-93-5p + LY294002 group was 10.14% higher than that of the miR-NC + LY294002 group. The proliferation capacity of miR-93-5p transferred by exosomes decreased by 24.4% after the addition of LY294002 (Figure 7). These results suggest that miR-93-5p transferred by exosomes may affect the proliferation of recipient EC9706 cells through the PI3K/Akt pathway partly.

Figure 7. miR-93-5p transferred by exosomes affects the proliferation of recipient EC9706 cells via the PI3K/Akt pathway. *P < 0.05 compared with the Exo-miR-NC group, #P < 0.05 compared with the exo-miR-NC + LY294002 group.
-
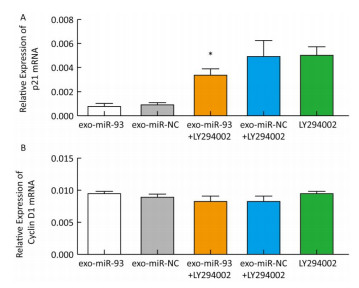
After incubation with donor EC9706 cells transfected with miR-93-5p/NC mimics for 24 h, we examined the mRNA expression of proliferation-related genes p21 and Cyclin D1 in the receptor EC9706 cells. The results showed that the expression of p21 in the miR-93-5p group was decreased compared with the control group and was significantly restored after adding LY294002 in the two groups (Figure 8A). The expression of Cyclin D1 in the miR-93-5p group was elevated compared with the control group and was decreased in both groups after the addition of LY294002 (Figure 8B). The results suggested that miR-93-5p may affect the expression of p21 and Cyclin D1 mRNA through the PTEN/PI3K/Akt pathway.
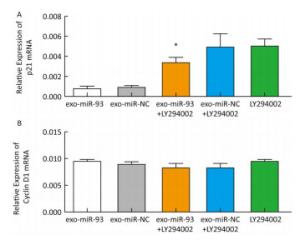
Figure 8. Expression of p21 (A) and cyclin D1 (B) mRNA in recipient EC9706 cells. *P < 0.05 compared with the Exo-miR-NC + LY294002 group.
-
After co-culture for 24 h, the expression of p21 and Cyclin D1 proteins in the recipient EC9706 cells was analyzed. As shown in Figure 9, the expression of p21 and Cyclin D1 protein in miR-93-5p receptor EC9706 cells decreased by 20.58% and 7.05%, respectively, and was restored to 26.71% and 10.33% after adding LY294002P21. The results suggested that miR-93-5p may affect the expression of proteins p21 and Cyclin D1 through the PTEN/PI3K/Akt pathway, thus promoting the proliferation of esophageal cancer cells.
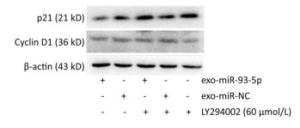
Figure 9. Expression of p21 and Cyclin D1 proteins in recipient EC9706 cells.
The Characteristics of Esophageal Cancer Patients and Healthy Controls
The Expression of miR-93-5p in Plasma Was Statistically Different between Patients with Esophageal Cancer and the Control Group
The Up-regulation of Plasma miR-93-5p in ESCC Patients Increased the Risk of Esophageal Cancer
TCGA Data Analysis Confirmed that MiR-93-5p Expression Differs among Tissues and is Associated with Patient Survival
Cy3-miR-93-5p Can be Transferred between EC9706 Cells by Exosomes
Expression of miR-93-5p in miRNA Mimic-transfected EC9706 Cells and Exosomes
miR-93-5p Transferred by Exosomes Promotes the Proliferation of Recipient EC9706 Cells, but has no Effect on Cell Cycle Distribution/Apoptosis /Migration/Invasion
Bioinformatics Analysis of miR-93-5p Target Genes
miR-93-5p Transferred by Exosomes Inhibits the Protein Expression of PTEN in Recipient Cells by Binding to the 3'UTR
miR-93-5p Transferred by Exosomes affects the Proliferation of recipient EC9706 Cells Partly via the PI3K/Akt Pathway
Effects of miR-93-5p Delivered by Exosomes on the Expression of p21 and Cyclin D1 mRNA Downstream of PTEN in Recipient EC9706 Cells
Effects of miR-93-5p Delivered by Exosomes on the Protein Expression of p21 and Cyclin D1 Downstream of PTEN in Recipient EC9706 Cells
-
A total of 15 miRNAs were found to be overexpressed in plasma from ESCC patients by microarray analysis, while 5 miRNAs were found to be downregulated[22]. Four miRNAs that were highly expressed in esophageal cancer cells and their exosomes, as indicated by plasma miRNA microarray, were selected to perform population verification. miR-93-5p was selected for further study, as its expression was statistically higher than that of the control population. miR-93-5p belongs to the miR-106b-25 family and its coding gene is located on chromosome 7q22.1, which is in the 13th intron of the host gene MCM7[24]. A number of studies have reported that the expression of miR-93-5p is abnormal in many cancers such as laryngeal cancer[25], esophageal cancer[26], liver cancer[27-29], ovarian cancer[30], bladder cancer[31], colorectal cancer[32], and gastric cancer[33]. In this study, conditional logistic regression analysis showed that the up-regulation of plasma miR-93-5p expression in esophageal cancer patients could increase the risk of esophageal cancer. Survival analysis of esophageal cancer patients in the TCGA database showed that the high expression of miR-93 is associated with poor prognosis. These results suggest that miR-93-5p may play an oncogenic role in the development of esophageal cancer[34, 35]. miR-93-5p, its multiple target genes and their related signaling pathways constitute a complex regulatory network, which plays an important role in the development of tumors. In the study of hepatocellular carcinoma and gastric cancer[36, 37], miR-93 can regulate the apoptosis of tumor cells. In prostate and ovarian cancer, miR-93 plays a role in promoting cancer cell proliferation and invasion[38-40]. In breast cancer, miR-93-5p inhibits the EMT of cancer cells[41]. In colon cancer, miR-93-5p contributes to the multi-drug resistance of cancer cells[42]. The available research on miR-93-5p in exosomes is limited to its expression profile analysis in different tissues or body fluids, therefore, our work is the first study on the transmission and function of miR-93-5p in tumor cells. In this study, we established an in vitro cell co-culture model that simulates the tumor microenvironment to investigate the effect of miR-93-5p in esophageal cancer-derived exosomes on esophageal cancer cells by autocrine mode in the microenvironment of esophageal cancer. The results showed that miR-93-5p transferred by exosomes from donor EC9706 cells could enter recipient EC9706 cells and affect their proliferation, which is consistent with the available literature[43-45]. In this study, miR-93-5p did not affect cell migration, invasion, apoptosis, and cycle distribution, which suggests that miR-93-5p may be tumor-specific and play different functions in different tumors.
-
In order to further explore the effect of miR-93-5p on the proliferation of EC9706 cells through exosomes, the tumor-associated gene PTEN, which is associated with the cell cycle and proliferation based on the literature and the common prediction of target gene prediction software, was selected for further study. PTEN is the first tumor suppressor gene found to have bispecific phosphatase activity. A recent study showed that PTEN is down-regulated in a variety of tumors, and that it integrates a complex signal network systems either directly or indirectly to play its role in cancer suppression[46, 47]. Our study found that PTEN is a functional target gene of miR-93-5p, which is one of the ways through which miR-93-5p transferred by exosomes promotes cancer. The relative luciferase activity of the co-transfected pmiR-Report-WT-PTEN and miR-93-5p groups decreased less compared with the co-transfected pmiR-Report-WT-PTEN and miR-NC groups. This may be because PTEN regulates multiple miRNAs, affecting their downstream signal cascades, so a single miRNA cannot fully explain the role of PTEN regulation. Then, we hypothesized that the exosome-derived miR-93-5p may affect the proliferation of recipient esophageal cancer cells in the cancer microenvironment by targeting PTEN and affecting the expression of its downstream proteins. Thus, we used LY294002, a recognized PI3k/Akt inhibitor for further study. The proliferation capacity of cells in the miR-93-5p transferred by exosomes group was weakened after the addition of LY294002. Moreover, the expression of p21 and Cyclin D1 protein in miR-93-5p receptor EC9706 cells decreased and was restored after the addition of LY294002, which supports our hypothesis. Studies show that the expression levels of p21 and Cyclin D1 can indirectly reflect changes in the cell cycle[48]. The proliferation capacity of cells with miR-93-5p transferred by exosomes decreased by 24.4% after the addition of LY294002. The result suggests that miR-93-5p may promote cell proliferation through a variety of mechanisms and the PI3K/Akt pathway only accounts for 24.4% of these pro-proliferative mechanisms. Liao et al. pointed that ERα regulates the proliferation of MCF-7 cells through the p21/cyclin D/CDK/Rb/E2F1 pathway[49], which suggested the important role of p21 and cyclin D in cell proliferation and was consistent with our results, supporting our conclusion. Our study suggests that miR-93-5p may promote receptor cell proliferation by affecting the expression of proteins p21 and cyclin D1 downstream of PTEN, partly via the PTEN/PI3K/Akt pathway. The limited role of the PI3K/Akt pathway in the promotion of cell proliferation by miR-93-5p indicated the need for further investigation of other mechanisms. In this study, the role and mechanism of exosome-derived miR-93-5p through autocrine mode in tumor microenvironment was discussed for the first time. Moreover, our preliminary experimental data support the further study of miR-93-5p in the tumor microenvironment.
miR-93-5p is Involved in the Development of Various Tumors
miR-93-5p May Promote Receptor Cell Proliferation by Affecting the Expression of Proteins Downstream of PTEN through the PTEN/PI3K/Akt Pathway
-
In conclusion, our study found that the expression of miR-93-5p differs significantly between esophageal cancer patients and healthy controls. Moreover, the overexpression of miR-93-5p is significantly associated with poor clinical outcome. miR-93-5p may promote receptor cell proliferation by affecting the expression of proteins p21 and cyclin D1 downstream of PTEN through the PTEN/PI3K/Akt pathway. Nevertheless, the role and mechanism of miR-93-5p in the microenvironment of esophageal cancer needs further study.
-
We thank LIU Hong Lin at the First People's Hospital of Huaian for the epidemiological survey and sample collection. We also thank HUANGFU Yue Hai at the Huaian Center for Disease Control and Prevention for sample pretreatment.
-
LIU Ran, YIN Li Hong, PU Yue Pu conceived and designed the experiments; LIAO Juan and LIU Meng Xin performed the experiments; LIU Meng Xin, WANG Xiang Hu, and GAO Zhi Kui analyzed the data; XIE Ming contributed materials; ZHANG Ying and SHANG Mu He contributed analysis tools; LIU Meng Xin wrote the paper.
National Natural Science Foundation of China grants 81573191
New Century Excellent Talents in University from the Ministry of Education NCET-13-0124
National Natural Science Foundation of China grants 81573191
the Graduate Research and Innovation Program of Colleges and Universities of Jiangsu Province KYLX15_0174
the Zhejiang Public Technology Application Research Project 2016C33218
National Natural Science Foundation of China grants 81573108

 Quick Links
 DownLoad: