


HTML
-
Tuberculosis (TB) remains a major global disease that poses a serious threat to human public health[1]. There were approximately 10.4 million new cases of TB worldwide in 2016 according to the World Health Organization (WHO)[2]. China has the third highest prevalence of TB patients and the second highest population of multi-drug resistant tuberculosis cases (MDR-TB) worldwide[2]. Despite the introduction of multi-drug combination chemotherapy in the 1960s and the active promotion of Directly Observed Treatment Short Course (DOTS) treatment policies after the 1990s in China, the TB epidemic has remained severe with the advent of drug-resistant strains[3-5]. Control of TB, especially drug-resistant TB, has become one of the major challenges and problems of public health in China. To solve this problem depends on a comprehensive understanding of the incidence and transmission of TB.
Advances in molecular epidemiology have enhanced our understanding of Mycobacterium tuberculosis (MTB), particularly the Beijing genotype and its sub-lineages. Several methods that are currently widely used in the study of MTB molecular epidemiology include the following: IS6110 restriction fragment length polymorphism (RFLP); spacer oligonucleotide typing (Spoligotyping); variable number tandem repeat (VNTR) analysis; large sequence polymorphism; single nucleotide polymorphism (SNP) genotyping; and whole genome sequencing (WGS)[6]. These methods have been successfully applied to identify TB recent transmission and investigate outbreaks[6]. IS6110-RFLP is the earliest and most widely used genotyping method for MTB. Spoligotyping is not suitable for the geographic regions where Beijing family strains predominate[6]. Currently, WGS can effectively guide the identification of the transmission chain, and it is possible to predict the outbreak of TB transmission, but the current cost is relatively expensive and will be more widely used in the future of molecular epidemiology[6]. VNTR is more widely used worldwide due to the following advantages: simplicity; rapidity; high operability; and high resolution. In addition, the digital results of VNTR make it easy for each laboratory to directly and reliably compare strains and establish a global database to explore the epidemiology and evolution of MTB[7]; however, VNTR can be confounded by homoplasty in some areas, i.e., the same or a similar genotype existed for strains without an epidemiologic association, especially Beijing family strains. These strains have a large representation in China, and have high genetic similarity, thus making recent transmission difficult to study with this method[8].
In the vast majority of regions in China, TB is mainly caused by Beijing family strains of MTB[8-14], and these strains cause the largest burden of tuberculosis in China[13, 15]. The prevalence of the Beijing family of MTB has continued to increase in the past few decades and has caused outbreaks in other parts of the world, thus leading to a global health concern[16-23]. The reason that Beijing family strains are so prevalent has been an intense area of investigation; the relationship between drug resistance and the genetic diversity of MTB is especially important. Some studies have shown that the Beijing genotype has increased rates of drug resistance[24, 25], while other studies have reported that there is no correlation between the Beijing family and resistance[14, 26]. These studies have drawn inconsistent conclusions comparing Beijing strains with non-Beijing strains, in part because of different research study designs, sampling schemes, and discrimination power of the genotyping method. Hence, it is necessary to analyze the relationship between drug resistance and genetic diversity of MTB, especially the Beijing family, by using a combination of different methods. Recently, Luo et al.[8] combined SNP analysis at eight different loci and VNTR to genotype MTB Beijing strains from Shanghai in eastern China. The burden of Beijing family isolates in this region was 85.3%[8]. The Beijing family strains were identified first, and eight SNPs in 3R (recombination, repair, and replication) genes were selected according to a previous study for genotyping these strains[27]. The results demonstrated that SNP genotyping can identify the clustered strains, which were misclassified into recent transmission due to the non-homologous similarity of VNTR markers, and thus are able to show more accurate molecular epidemiologic results for genotyping a homogenous population of MTB Beijing strains when SNP information is combined with VNTR[8].
TB and poverty are closely linked. It is more difficult to control TB in southwest China due to the remote mountainous areas and ethnic minorities. According to the 2010 Fifth National TB Epidemiological Survey[28], the active and smear-positive prevalence of pulmonary TB was 695/100, 000 and 105/100, 000 in western China, respectively, which was greater than the prevalence in the middle and eastern regions, which were also greater than the national prevalence. Therefore, a comprehensive understanding of the prevalence and the pattern of TB and drug-resistant TB transmission in the impoverished mountainous areas will be conducive to the progress and success of the national TB control project.
Accurate epidemiologic analysis will benefit from enhanced genotyping resolution. Although the distribution of Beijing family strains is lower in southwestern China than eastern China[26, 28, 29], we set out to determine the epidemiology of TB using the nine previously reported SNPs which are potentially involved in important phenotypic traits combined with the VNTR-15 genotyping method to gain a better understanding of the causes and transmission of TB patients in the mountainous areas of southwest China mountainous areas. Eight SNPs are included in 3R genes[8, 26, 27] and the ninth SNP is a gene (Rv2952) involved in lipid biosynthesis, in which there is a mutation in codon 176 (GGG - > AGG); the ninth SSP was used for Beijing family strain identification[16, 26, 30-32]. Then, we determined the relationship between drug resistance and transmission of TB and the factors related to the prevalence of the Beijing family strains. In addition, we we evaluated the method that combines SNPs and VNTR for genotyping Beijing strains, as proposed by Luo et al.[8], using strains isolated from the western part of China compared with strains collected from Shanghai in eastern China to judge whether or not the combination method is also applicable to the western mountainous area with a higher TB prevalence. The Beijing strain has a relatively low prevalence and can provide useful information for TB control in the western mountainous areas of China.
-
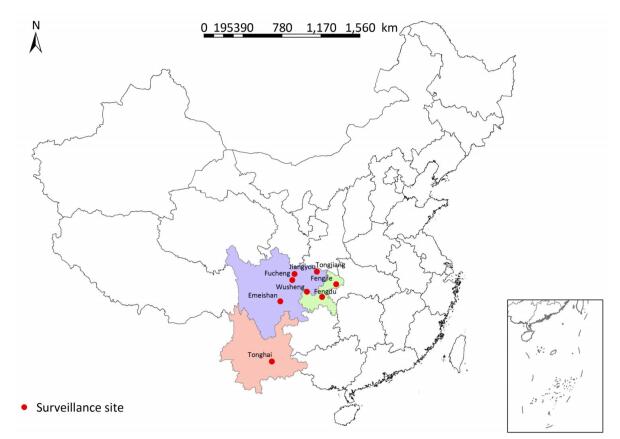
A total of 331 clinical strains were isolated in 2014 and 2015 from smear-positive TB patients from eight mountainous region counties in southwest China, including Emeishan county (25 strains), Fengdu county (16 strains), Fengjie county (45 strains), Fucheng district (17 strains), Jiangyou county (112 strains), Tonghai county (29 strains), Tongjiang county (34 strains), and Wusheng county (53 strains). The distribution of surveillance sites is shown in Figure 1. All strains were stored in 7H9 broth with 20% glycerol at -70 ℃ and plated on Lowenstein-Jensen medium for 4 weeks at 37 ℃ prior to genotyping and drug susceptibility testing.
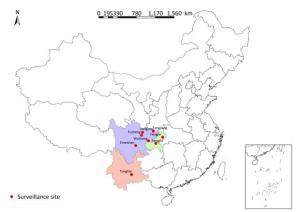
Figure 1. Distribution map of surveillance sites included in this study.
Mycobacterial colonies were picked up using a 10 μL sterile inoculating loop, resuspended in 200 μL of distilled H2O, then incubated at 85 ℃ for 30 min to inactivate the bacteria. Nucleic acid was extracted using the boiling-water-extraction method by boiling the suspension at 100 ℃ for 10 min. The DNA was removed in supernatant after centrifugation at 13, 839 ×g for 10 min (Sorvall Legend Micro 17R microcentrifuge; Thermo Fisher Scientific, America) and stored at -20 ℃.
-
The clinical strains were subjected to Beijing genotype identification using a real-time polymerase chain reaction (PCR) melting curve assay for genotyping of Beijing family strains in Rv2952 genes, as previously described[16, 26, 30-33]. Mestre et al.[27] reported that Beijing genotype strains can be divided into different sub-lineages by 8 SNPs in 3R (recombination, repair, replication) genes. Eight SNPs were also detected with single real-time fluorescent PCR[33]. The PCR was performed on a Bio-Rad CFX96 thermo cycler (Bio-Rad Laboratories, Inc., America) in a final volume of 10 μL containing 1 unit of TaqDNA polymerase (CoWin Biosciences, China). To prevent the probe from being degraded by DNA polymerase during the primer extension stage, we selected a Taq DNA polymerase enzyme that does not have 5' to 3' exonuclease activity during the amplification process, as previously described[33].
-
The clinical strains were subjected to 15-loci VNTR (VNTR-15) genotyping. Genotyping primers and amplification conditions of the VNTR-15 method are described in a previous study[34]. Electrophoresis voltage was set at 150 V using 1.5% gel for approximately 1 h. The DNA reference markers used were a 50-bp and 100-bp ladder. The standard MTB strain, H37Rv, was labeled as a control in each gel.
-
Drug susceptibility testing of these strains was performed as recommended by WHO/IUATLD (International union for tuberculosis and lung disease) using four first-line anti-TB drugs (ethambutol, isoniazid, rifampin, and streptomycin) and five second-line anti-TB drugs (capreomycin, kanamycin, ofloxacin, para-aminosalicylic acid, and protionamide)[35-37]. The final concentrations of drugs in Lowenstein-Jensen media were as follows: ethambutol (EMB) 2 μg/mL, isoniazid (INH) 0.2 μg/mL, kanamycin (KM) 30 μg/mL, ofloxacin (OFX) 2 μg/mL, capreomycin (CPM) 40 μg/mL, para- aminosalicylic acid (PAS) 1 μg/mL, protionamide (PTO) 40 μg/mL, rifampin (RFP) 40 μg/mL and streptomycin (SM) 4 μg/mL. The strain was considered to be resistant to the specific drug when the growth rate was > 1% compared to the control group (without any drugs). The MDR-TB strains were defined as resistant to both INH and RFP. All drugs were purchased from Sigma-Aldrich (St. Louis, MO, America).
-
The Hunter-Gaston index (HGI) was calculated refer to previous study to evaluate discriminatory power of VNTR-15 and the population diversity within each sub-lineage. Statistical analyses between genotype and DST were performed by SPSS v19.0 (SPSS Inc., America)[38, 39]. BioNumerics 5.0 software (Applied Maths, Sint-Martens-Latem, Belgium) was used to construct the minimal spanning tree (MST) and a dendrogram according to the VNTR-15 classification data as well as grouped by 8-loci SNP results to evaluate the overall population structure[40]. Chi-square and Fisher's exact test were conducted to identify if any differences between two items were statistically significant.
Strain Collection and DNA Extraction
Beijing Genotype Identification and SNP Genotyping
Units-variable Number of Tandem Repeats (MIRU-VNTR) Genotyping
Drug Susceptibility Testing
Statistic Analysis
-
A total of 183 (55.29%, 183/331) strains were classified into Beijing family with a single point mutation in the Rv2952 gene, and 148 (44.71%, 148/331) non-Beijing family strains without a single point mutation in Rv2952 were defined (Table 1). Following the 8 SNPs based on the 3R genes, the Beijing family strains were grouped into eight sub-lineages (Table 1). The most predominant sub-lineage was Bmyc10 (39.34%, 72/183), followed by Bmyc25 (20.77%, 38/183), Bmyc210 (17.49%, 32/183), Bmyc2 (5.46%, 10/183) and Bmyc4 (5.46%, 10/183), Bmyc26 (4.37%, 8/183), Bmyc13 (3.83%, 7/183) and Bmyc6 (3.78%, 6/183). Among all the sub-lineages, Bmyc10, Bmyc13, and Bmyc210 were defined as modern Beijing strains (60.66%, 111/183) according to the mutation of mutT2_58 gene[32]. Strains without mutations were defined as ancient Beijing strains. Bmyc10 and Bmyc25 were the most prevalence sub-lineage of modern and ancient Beijing strains, respectively.
Sublineage SNPs No. (%) Subgroup recR (codon 44) mutT4 (codon 48) recX (codon 59) mutT2 (codon 58) uvrD1 (codon 462) adhE2 (codon 124) ligD (codon 580) ogt (codon 37) Bmyc2 W W W W W W M W 10 (5.46) Ancient Bmyc4 M W W W W W W W 10 (5.46) Ancient Bmyc6 M M W W W W W W 6 (3.78) Ancient Bmyc25 M M W W W W W M 38 (20.77) Ancient Bmyc26 M M M W W W W W 8 (4.37) Ancient Bmyc10 M M M M W W W W 72 (39.34) Modern Bmyc13 M M M M M W W W 7 (3.83) Modern Bmyc210 M M M M W M W W 32 (17.49) Modern Table 1. Distribution of 183 Beijing Strains in Each Sub-lineage (W = wildtype, M = mutant)
-
We performed 15-loci VNTR to all 331 isolates to study the transmission clusters and population diversity of MTB in remote mountainous areas of southwest China. two hundred sixty-one MTB strains (78.61%; 261/331) had complete VNTR genotyping data that were included in this study. The 261 isolates were classified into 15 clusters (2 to 5 strains per cluster) and 224 unique genotypes, showing a clustering rate of 14.18% (37/261) and a discriminatory index of 0.9990 (Figure 2). The 148 Beijing isolates and 113 non-Beijing strains both contained 7 clusters. In addition, we also calculated the HGI for Beijing lineage and non-Beijing lineage. The Beijing family contained 129 unique genotypes, showing a clustering rate of 12.84% (19/148) and a discriminatory index of 0.9981. Additionally, the non-Beijing family isolates showed a clustering rate of 14.16% (16/113) and a discriminatory index of 0.9983. No significant difference between the Beijing and non-Beijing strains was observed with respect to the clustering rate (χ2 = 0.096, P = 0.756). There is a trend toward higher resolution for Beijing strains compared with non-Beijing strains (0.9983 vs. 0.9981); however, the trend was not significant. From the minimal spanning tree of the 261 strains based on VNTR-15 data, Beijing strains were mainly concentrated in one complex (shadowed with red color), and the genetic distance was relatively close, and non-Beijing strains were more dispersed (Figure 2). There were three isolates that were defined as non-Beijing strains (marked with fluorescent green color) located on the Beijing strains complex (Figure 2).
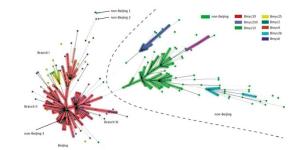
Figure 2. Minimal spanning tree of the 261 strains based on VNTR data. Each circle corresponds to a certain VNTR type. The size of the circle is proportional to the number of the isolates. The shadow zones in different colors correspond to different clonal complexes, and the color within the cycles represents different sub-lineages. The dotted line separates Beijing and non-Beijing strains.
-
Among all 331 clinical strains, 19.64% (65/331) isolates were resistant to any drugs involved in this study. The resistance rates from high-to-low were INH (10.57%), SM (9.97%), OFX (8.16%), RFP (5.44%), PAS (3.32%), KAM (2.11%), CPM (1.81%), EMB (1.21%), and PTO (0.30%). Seventeen [4.98% (17/331)] MTB isolates were detected as MDR-TB, and of these, 15 [88.24% (15/17)] were Beijing family MTB, and 2 [11.76% (2/17)] were non-Beijing strains (Table 2). Beijing strains had significantly higher rates of resistance to INH (χ2 = 5.715, P = 0.017) and RFP (χ2 = 6.057, P = 0.014; Table 2) compared with non-Beijing strains. Extremely significant differences were observed regarding PAS resistance (χ2 = 7.426, P = 0.006) and MDR (simultaneous INH and RFP resistance; χ2 = 7.870, P = 0.005) between the Beijing strains and non-Beijing strains (Table 2); however, there was no significant difference in drug resistance rates when comparing modern Beijing isolates with ancient Beijing isolates (Table 2). In addition, no significant differences were obtained between the drug resistance rates of Bmyc10 and Bmyc25, which accounted for the dominant sub-lineage of modern and ancient Beijing isolates, respectively (Table 2). We tested the relationships between Beijing lineage/modern Beijing sub-lineage and drug resistance. No significant correlation was observed (Beijing lineage, P = 0.326; modern Beijing sub-lineage, P = 0.311).
Drug Resistance Total N = 331 Beijing (n = 183) non-Beijing (n = 148) Beijing vs. non-Beijing Modern Beijing vs. Ancient Beijing Bmyc10 vs. Bmyc25 Ancient Beijing (n = 72) Modern Beijing (n = 111) Total Total Bmyc25 n = 38 Total Bmyc10 n = 72 χ2 P Values χ2 P Values χ2 P Values INH 35 (10.57%) 8 (11.11%) 6 (15.79%) 18 (16.22%) 10 (13.89%) 26 (14.21%) 9 (6.08%) 5.715 0.017 0.934 0.334 0.072 0.788 EMB 4 (1.21%) 2 (2.78%) 1 (2.63%) 1 (0.90%) 0 (0%) 3 (1.64%) 1 (0.68%) 0.085 0.770 0.145 0.703 a 0.345b RFP 18 (5.44%) 6 (8.33%) 6 (15.79%) 9 (8.11%) 5 (6.94%) 15 (8.20%) 3 (2.03%) 6.057 0.014 0.003 0.957 1.291 0.256a SM 33 (9.97%) 7 (9.72%) 4 (10.53%) 16 (14.41%) 11 (15.28%) 23 (12.57%) 10 (6.76%) 3.079 0.079 0.875 0.350 0.477 0.490 KAM 7 (2.11%) 3 (4.17%) 2 (5.26%) 3 (2.70%) 1 (1.39%) 6 (3.28%) 1 (0.68%) 1.568 0.210a 0.014 0.906 a 0.326 0.568a OFX 27 (8.16%) 4 (5.56%) 3 (7.89%) 14 (12.61%) 8 (11.11%) 18 (9.84%) 9 (6.08%) 1.540 0.215 2.452 0.117 0.040 0.841a CPM 6 (1.81%) 4 (5.56%) 1 (2.63%) 2 (1.80%) 1 (1.39%) 6 (3.28%) 0 (0%) 3.272 0.070 a 0.937 0.333 a 1.000b PTO 1 (0.30%) 0 (0%) 0 (0%) 1 (0.90%) 0 (0%) 1 (0.55%) 0 (0%) 1.000b 1.000b 1.000b PAS 11 (3.32%) 7 (9.72%) 3 (7.89%) 4 (3.60%) 1 (1.39%) 11 (6.01%) 0 (0%) 7.426 0.006 a 1.912 0.167 a 1.435 0.231 a MDR 17 (5.14%) 6 (8.33%) 5 (13.16%) 9 (8.11%) 5 (6.94%) 15 (8.20%) 2 (1.35%) 7.870 0.005 0.003 0.957 0.532 0.466 a Note. INH, isoniazid; RFP, rifampin; EMB, ethambutol; SM, streptomycin; KAN, kanamycin; OFX, ofloxacin; CPM, capreomycin; PAS, para-aminosalicylic acid; PTO, protionamide; a, evaluated with continuity correction chi-square; b, evaluated with Fisher's exact test. Table 2. Drug Resistance in Beijing Lineage MTB and Non-Beijing Lineage MTB
-
Based on the VNTR-15 genotyping results combined with drug resistance, as well as SNP genotyping results, we compared the characteristics of a cluster strain versus a unique type strain. The two groups did not differ with respect to drug resistance, lineage, or sub-lineage. The order of the clustering rate of different drug-resistant strains was OFX-resistant, MDR, RFP-resistant, any drug-resistant, INH-resistant, SM-resistant, and PAS-resistant. We tested for associations between clustering rates and the different drug resistant strains. No significant differences in the different drug resistance (except PTO) results were obtained between cluster strains versus unique type strains (P = 0.925; Table 3).
Characteristic Cluster Strains (%) Unique Type Strains (%) Cluster vs. Unique Type χ2 P Values Drug resistance 0.925b Yes 9 (17.65%) 42 (82.35%) 0.628 0.428 INH 4 (14.81%) 23 (85.19%) 0.000 1.000a EMB 0 (0%) 3 (100%) 1.000b RFP 3 (21.43%) 11 (78.57%) 0.165 0.685a SM 4 (14.81%) 23 (85.19%) 0.000 1.000a KAM 0 (0%) 4 (100%) 1.000b OFX 6 (30%) 14 (70%) 3.160 0.075a CPM 0 (0%) 4 (100%) 1.000b PTO 0 (0%) 0 (%) 1.000b PAS 1 (12.5%) 7 (87.5%) 0.000 1.000a MDR 3 (23.08%) 10 (76.92%) 0.287 0.592a Lineage 0.123 0.725 Beijing 20 (13.51%) 128 (86.49%) non-Beijing 17 (15.04%) 96 (84.96%) Sublineage 2.241 0.134 Ancient 4 (7.41%) 50 (92.59%) Modern 15 (15.96%) 79 (84.04%) Note. a, evaluated with continuity correction chi-square; b, evaluated with Fisher's exact test. Table 3. Factors Associated with Cluster Strains
-
To explore the relevance between VNTR genotypes and SNP-defined sub-lineages in our study, we constructed the MST based on VNTR-15 and SNP genotyping results, which was mapped onto the network (Figure 2). In light of the MST map, the Beijing genotype strains in this study were divided into one major complex (shadowed in red). On the whole, the MST for the part of Beijing strains can be divided into three main branches, among which the modern Beijing strains were mainly concentrated on branches Ⅱ and Ⅲ, and the genetic distances among ancient strains were relatively greater than modern Beijing strains. Non-Beijing strains were mainly concentrated on the right of the dotted line, with the exception of three strains (Figure 2). The modern Beijing strains are mainly concentrated in the trunk part of the MST map with a closer genetic distance between each other. The results of VNTR-15 were consistent with the sub-lineage defined by SNP at a lower resolution.
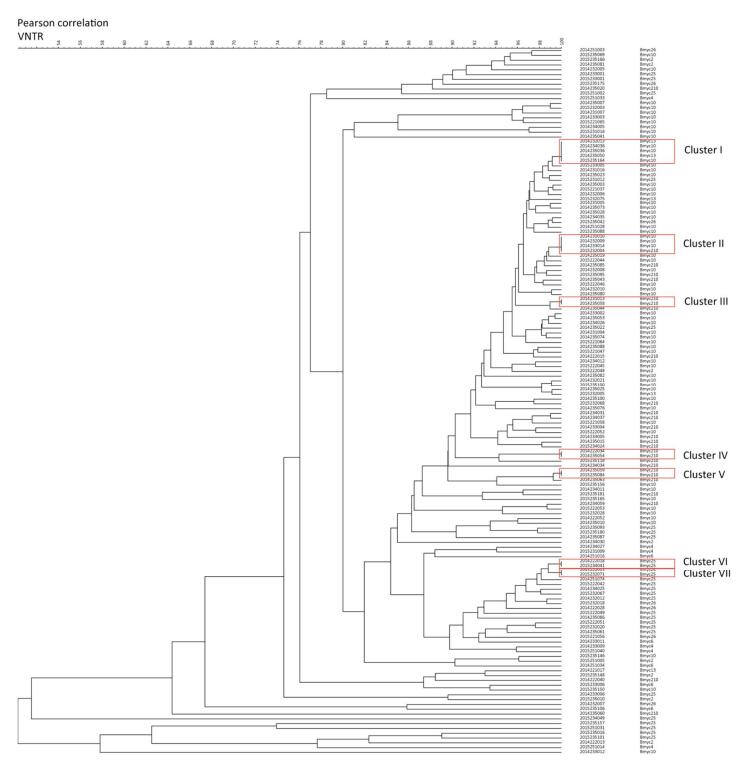
From the dendrogram constructed of VNTR-15 by BioNumerics 5.0 (Figure 3) with the additional SNP-based sub-type information for strains which had both VNTR-15 and 8-loci SNP data [80.88% (148/183)], we found that strains belonging to the same cluster by VNTR were differentiated into different sub-lineages (e.g., cluster Ⅰ contained Bmyc10 and Bmyc13; cluster Ⅱ contained Bmyc10 and Bmyc210; cluster Ⅶ contained Bmyc25 and Bmyc26); however, the other four clusters were composed by the same sub-lineage strains. There were discordances between VNTR-15 and SNP sub-lineages if we set a higher resolution. The SNP genotyping results were a supplement to VNTR-15, which showed a high level of homoplasy.
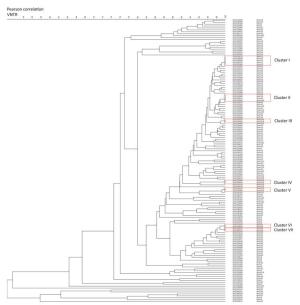
Figure 3. Dendrogram of VNTR-15 patterns of 148 Beijing strains. The dendrogram was constructed using UPGMA by BioNumeric 5.0. The corresponding isolate ID and sub-lineage were shown alongside the dendrogram on the right.
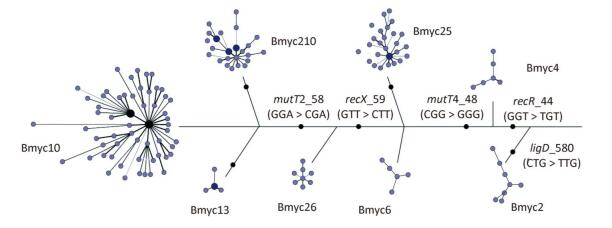
In addition, we constructed a composite tree based on 8-loci SNP and VNTR-15 to further study the evolution and diversity of each sub-lineage, as previously reported (Figure 4). The skeleton of the composite tree was based on the phylogenetic relationship defined by the SNPs in the 3R gene[27], and each branch was based on the MST of VNTR-15. With the exception of Bmyc6 and Bmyc13, the other six branches of the MST were expressed as a star network structure. This finding is the same as a previous study[8], and the sub-lineages may be caused by the recent funder effect, whereas the VNTR-15 genotype at each MST center is the founder genotype of each sub-lineage. The combination of SNPs and VNTRs can improve the accuracy of epidemiologic analysis of these strains.

Figure 4. A composite tree based on 8-loci SNP and VNTR-15. Each circle corresponds to a VNTR type. The size of the circle is proportional to the number of the isolates. The color within the circles represents a different number of strains.
Phylogenetic Structure Analysis of Beijing Family Isolates Based on SNP Genotyping
Genetic Diversity and Cluster Analysis Based on VNTR-15 Genotyping
Relationship between Drug Resistance and Beijing Family
Factors Associated with Cluster Strains
Evaluating the Method of Combining VNTR and SNP for Genotyping Beijing Strains
-
Although the number of TB deaths has fallen by 37% between 2000 and 2016, TB remains the leading infectious cause of global deaths, with 1.3 million mortalities among HIV-negative people in 2016[2]. The situation in developing countries is worse than that developed countries. In the past two decades, Beijing family strains of MTB have been widely distributed around the world and caused great public concern due to the frequent associations with drug resistance of TB[24, 41, 42], Bacillus Calmette-Guerin vaccination evasion, and hyper-virulence[43, 44]. These associations and conclusions have varied among different studies suggesting that genetic heterogeneity might exist within the Beijing family that confounds associations when examining data at this level of phylogenetic detail. In our study, Beijing family isolates constituted the majority [56.7% (148/261)] in our population, which is in agreement with previous studies[8, 27], but lower than the portion of strains collected from northern China and eastern China[8, 26, 45]. The prevalence of the Beijing genotype in these remote mountainous areas of southwestern China is similar to that reported in previous studies (Sichuan, 53.96%; Yunnan, 55.7%)[29, 46], while the prevalence is lower than most regions in China (Zhejiang, 71.6%; Jiangsu, 80.4%; Inner Mongolia, 85.48%)[47-49]. Modern Beijing strains had a higher prevalence when compared with ancient Beijing strains, which is consistent with other regions in China[32, 50]. The most predominant modern Beijing sub-lineage and ancient Beijing sub-lineage were Bmyc10 [39.34% (72/183)] and Bmyc25 [20.77% (38/183)], which were also consistent with a recent study in China[8, 26, 27].
According to different genomic markers, the leading scientific groups proposed at least 8 different genotyping programs, such as IS6110-RFLP, RDs, VNTR, SNP data sets, and WGS studies[51]. VNTR-15 genotyping was carried out for 331 strains included in the study. The genotyping results of 261 clinical isolates showed that the overall clustering rate was 14.18%, which was lower than Guangxi province (34.9%), Henan province (30.6%), Shanghai municipality (30.7%), and Heilongjiang province (35.7%)[52]. This may be due to the distance between the monitoring sites selected in this study and the insufficient number of strains in the monitoring site. In addition, there was no difference in the clustering rate and HGI between Beijing and non-Beijing strains, although there was a lower trend (0.9983 vs. 0.9981). According to the drug susceptibility testing, 19.64% (65/331) of the isolates were resistant to at least one of the 9 anti-TB drugs and 17 [4.98% (17/331)] MTB isolates were MDR-TB. This finding is different than the status of the entire nation[53].
We observed that the proportion of the Beijing family was statistically different with respect to MDR-TB and INH, RFP, and PAS resistance in comparison with the non-Beijing family. There was no significant difference when comparing modern Beijing isolates with ancient Beijing isolates, which may be due to the limited sample size limited. The two dominant sub-lineages (Bmyc10 and Bmyc25) of modern and ancient Beijing also had no significant difference in drug resistance. Beijing or ancient Beijing strains were not significantly associated with drug resistance with P values of 0.326 and 0.311, respectively. From the dendrogram of VNTR-15 patterns with additional sub-lineage provided by SNP genotyping, we found that the genetic distance between the ancient Beijing strains was relatively far away than the modern Beijing strains, as previous mentioned[50]. We analyzed the relationship between cluster and drug resistance, lineage, and sub-lineage to trace transmission of MTB; however, we did not detect a significant association between cluster and unique type strains for all four first-line drugs and five second-line drugs, including MDR.
SNPs identified in 3R genes can be used to divide the MTB Beijing family into several sub-lineages, and are also considered as a robust target for exploration of their phylogenetic evolution and propagation[27]; however, it is not possible to perform cluster analysis and further diversity studies because of the low resolution. VNTR is considered to be a new gold standard for alternative genotyping of IS6110[54] with the benefits that VNTR is PCR-based and is high resolution, fast, high throughput readings features, and facilitates easy exchange of data among different labs. This method can also be used to distinguish mixed infections. Nevertheless, VNTR does not accurately track transmission in high incidence countries, particularly in East Asia and South Africa, and especially China, where the Beijing strain is widely prevalent[7, 55]. Combining SNP with VNTR is a promising method to determine the molecular characteristics of MTB Beijing strains in eastern China, while the utility for MTB isolated in southwestern China, where Beijing family strains are less prevalent than eastern and northern China, according to previous study[56], is unknown. We performed the two analyses for our strains referring to the previous study by Tao et al.[8] to evaluate whether or not this combined method is a more proper way to carry out molecular epidemiology for MTB in southwest China.
When we examined the VNTR clusters, we observed one cluster, including different sub-lineages, revealing the existence of non-homologous similarity of VNTR-15 genotyping and there is heterogeneity among Beijing family strains. In addition, according to the VNTR-based MST map of each sub-lineage, it was apparent that there was more diversity between strains within a sub-lineage than could have been determined by SNPs alone. Therefore, SNP genotyping can correct false clustering based on VNTR-15 due to non-homologous similarity, and higher resolution of VNTR-15 can make up for the inability of 8-loci SNP genotyping method to cluster isolates connected by recent transmission; however, the strains that were isolated in different times were still identified as the same cluster and the same sub-lineage when we combined the results of the two methods. Thus, the hypervariable locus is still necessary to be incorporated into the analysis when it is necessary.
-
In summary, the MTB strains demonstrate high genetic diversity in remote mountainous areas of southwest China. The predominant lineage and sub-lineage are the Beijing family and modern Beijing strains. The proportion of Beijing family is statistically different between MDR-TB and INH, RFP, and PAS resistance in comparison with the non-Beijing family; however, the Beijing family was not associated with genetic clustering and drug resistance. Genetic clustering was not associated with drug resistance. Although the samples included in this study were only isolated from remote mountainous areas, which is not sufficient to represent the entire southwestern region of China, the results still show that 8-loci SNP can distinguish the misidentified clusters by VNTR-15. SNP genotyping can correct the incorrect definition of the VNTR-15 due to non-homologous similarity, and VNTR-15 can make up shortcoming of 8-loci SNP which has higher resolution and a lower cluster rate. Moreover, SNP genotyping used by real-time PCR melting curve assay were faster and more convenient than ISS6110 RFLP and spoligotyping and can be completed within 1 h. Thus, the 8 loci SNP genotyping in combination with 15 VNTR genotyping can be used in the regions with Beijing family predominates as a prime genotyping method for large-scale genotyping. SNP in combination with 15-locus MIRU-VNTR is a useful tool to study the molecular epidemiology of MTB strains in this area.
-
This study was reviewed and approved by the Ethics Review Board of the Chinese Center for Disease Control and Prevention.
-
We would like to thank all the organizers and implementers for their participation in this study. We are also greatly grateful to all the investigators for their contribution to data collection.

 Quick Links
 DownLoad: