


HTML
-
Optical coherence tomography (OCT) can provide cross-sectional images of a living sample with microscopic resolution[1] and has become the most widely used optical technique in medical imaging. Optical coherence tomography angiography (OCTA) is a very important extension of OCT that is used to visualize blood flow within microcirculatory tissue beds; it uses motion contrast to produce angiographic data across the retina and the choroid[2].
Optical microangiography (OMAG)[3] is one of the primary OCTA approaches. It can harness motion information to the fullest extent by exploiting both the amplitude and the phase information contained within the OCT signals and produce OCT angiography with better vascular connectivity, higher signal-to-noise ratio, and higher sensitivity to capillary blood flows[2]. In recent years, OMAG has been successfully used for identifying retinal and choroidal microvascular abnormalities[4-12]. However, there is a scarcity of data addressing the repeatability and reproducibility of OMAG, both of which are essential for clinical application. Therefore, this study was designed to assess the repeatability and reproducibility of the following parameters based on OMAG: vessel area density (VAD), vessel skeleton density (VSD), vessel diameter index (VDI), vessel perimeter index (VPI), vessel complexity index (VCI), flux, and foveal avascular zone (FAZ).
-
Normal volunteers were enrolled from March 2017 to May 2017. All the volunteers underwent comprehensive ophthalmologic examinations, including best-corrected visual acuity (BCVA), refraction measurement, intraocular pressure measurement, slit-lamp biomicroscopy, and fundus examination. The medical and family histories of the volunteers were collected. All eyes of the healthy volunteers enrolled in this study had a BCVA ≥ 20/20, a refractive error of about -3.00 to +3.00 diopters (D), an intraocular pressure between 10.0 and 21.0 mmHg, and nonsignificant findings in the anterior and posterior segments. The protocol of the study was approved by the Ethics Committee of Beijing Tongren Hospital, Capital Medical University, and adhered to the tenets of the Declaration of Helsinki. Written informed consent was obtained from each volunteer before enrollment into the study.
-
SD-OCT data were acquired using a Cirrus HD-OCT 5000 angiography system (Carl Zeiss Meditec Inc., Dublin, CA, USA). Image tracing (FastTracTM) and OCTA image quality review were performed for all scans. The signal strength was expressed as a quantitative measure for image quality ranging from 1 (poor) to 10 (good). The signal strength of each scan was not less than 8, following the equipment manufacturer's recommendation to acquire high-quality images. The scan patterns included Angiography 3 × 3 mm and HD Radical. The angiography scans consisted of 245 A-scans at 245 B-scan positions. In the first visit, one eye (randomly selected) of each volunteer was scanned three times continuously; between each scan, the volunteers were asked to sit back and rest for about 30 s to 1 min. The second visit took place 1 week later, when the same scan protocol was followed.
-
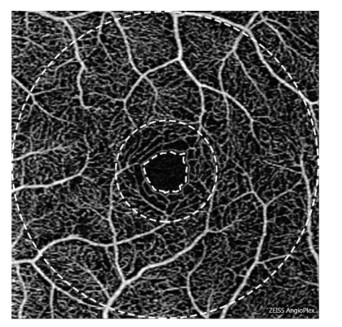
The obtained OCTA data were analyzed by a standardized procedure using MATLAB (R2016a, MathWorks, Inc., Natick, MA, USA) and semiautomatic software[13]. All the commercially available OCTA instruments are built with automated segmentation, and there are certain differences[14]. In this study, the retinal microvasculature was separated into three distinct physiological layers by manual manipulation[15], and the superficial vascular network encompassing layers from the ganglion cell layer to the inner plexiform layer was chosen as the target level for analysis. Using the OMAG algorithm, all the parameters, viz., VAD, VSD, VDI, VPI, VCI, flux, and FAZ, could be quantified from the images, which have been defined previously as follows[15, 16]: VAD is calculated as a unitless ratio of the total image area occupied by the vasculature to the total image area in the binary vessel maps, VSD is calculated as the ratio of the length occupied by the blood vessels to the total area in the skeletonized vessel map, VDI is calculated using both the vessel area map and the skeletonized vessel map to yield the averaged vessel caliber, VPI is calculated using the vessel perimeter map as the ratio of the vessel perimeter to the total area of the OCTA image, VCI is calculated using both the vessel perimeter map and the vessel area map, flux is defined as the total number of particles across the imaging voxel cross-section per unit time, and FAZ is defined as the macular foveal area without blood flow signal. The range of measurement of OCTA is shown in Figure 1. The boundary of FAZ is marked by the inner ring. The diameters of the middle ring and the outer ring are 1 mm and 3 mm, respectively. The fovea is defined as the area between the inner and the middle ring, and the parafovea is defined as the area between the middle ring and the outer ring. The data of fovea and parafovea were calculated respectively.

Figure 1. The range of measurement of OCTA. The panel shows sample angiography image of the superficial vascular network of a normal eye using OCTA on a 3 × 3 mm scan. The boundary of FAZ is marked by the inner ring. The diameters of the middle ring and the outer ring are 1 mm and 3 mm, respectively. The fovea is defined as the area between the inner and the middle ring, and the parafovea is defined as the area between the middle ring and the outer ring.
-
Statistical analysis was performed using SPSS (22.0, IBM SPSS Inc., Armonk, NY, USA). For each eye, two coefficients of variation (CVs) were calculated from three scans acquired at the same visit and six scans acquired at two visits to evaluate the intravisit and intervisit, respectively. Mean CVs and standard deviations (SDs) of the 40 subjects were further calculated to represent the final intravisit and intervisit repeatability for each parameter. The three scans of the first visit were analyzed independently by two technical staffs to evaluate the agreement between the observers' measurements for interobserver reproducibility; the intraclass correlation coefficient (ICC) two-way mixed model with a 95% confidence interval (CI) on absolute agreement was used to analyze measurement reliability.
Study Design and Population
Image Acquisition
Image Analysis
Statistical Analysis
-
A total of 40 eyes of 40 normal Asian volunteers (16 males and 24 females) were included in this study. The mean age of the volunteers was 35.0 ± 6.7 years (range: 22-55 years). The examination results were as follows: BCVA ≥ 20/20, mean refractive error -1.03 ± 1.07 D (range: -3.00 to 1.00 D), and mean intraocular pressure 14.2 ± 2.5 mmHg (range: 12.0-19.2 mmHg). All eyes were recruited from volunteers without any previous disease or treatment history, and there were also no abnormalities on the fundus examination or the OCT scanning.
Results of the intravisit and intervisit repeatability of the measurements are summarized in Table 1. The measurements revealed high repeatability [CVs ≤ 4.2% (intravisit) and ≤ 4.6% (intervisit)] for all parameters. The CVs were lower for intravisit than for intervisit.
Parameters Intravisit Repeatability Intervisit Repeatability Mean ± SD CV (%) Mean ± SD CV (%) Fovea VAD 0.224 ± 0.007 3.3 ± 2.5 0.225 ± 0.008 3.7 ± 2.9 VSD 0.067 ± 0.010 2.8 ± 2.2 0.066 ± 0.010 3.0 ± 2.7 VDI 3.373 ± 0.103 0.8 ± 0.7 3.377 ± 0.101 0.9 ± 0.9 VPI 0.177 ± 0.024 2.4 ± 1.5 0.177 ± 0.024 2.7 ± 2.0 VCI (1.031 ± 0.351) × 107 2.1 ± 1.8 (1.021 ± 0.352) × 107 2.3 ± 2.0 Flux 0.065 ± 0.013 5.8 ± 3.9 0.065 ± 0.013 6.3 ± 4.4 Parafovea VAD 0.290 ± 0.026 2.6 ± 2.0 0.291 ± 0.026 3.0 ± 2.4 VSD 0.088 ± 0.008 2.8 ± 1.6 0.088 ± 0.008 3.3 ± 1.9 VDI 3.334 ± 0.067 0.6 ± 0.4 3.337 ± 0.070 0.7 ± 0.5 VPI 0.220 ± 0.019 2.6 ± 1.5 0.220 ± 0.018 3.0 ± 1.6 VCI (1.671 ± 0.138) × 107 2.1 ± 1.6 (1.673 ± 0.134) × 107 2.2 ± 1.6 Flux 0.106 ± 0.013 5.1 ± 2.4 0.106 ± 0.014 6.1 ± 2.9 FAZ 0.267 ± 0.080 1.3 ± 0.7 0.267 ± 0.080 1.3 ± 0.8 Note. VAD, vessel area density; VSD, vessel skeleton density; VDI, vessel diameter index; VPI, vessel perimeter index; VCI, vessel complexity index; FAZ, foveal avascular zone; CV, coefficient of variation. Table 1. Intravisit and Intervisit Repeatability of Measurements Using OMAG in Normal Eyes
Interobserver reproducibility of various parameters was analyzed using ICC and its 95% CI, which are presented in Table 2. All the parameters showed excellent agreement (ICCs ≥ 0.923) between the observers.
Parameters Mean ± SD ICC 95% CI Fovea VAD 0.225 ± 0.034 0.952 0.906-0.976 VSD 0.067 ± 0.010 0.959 0.919-0.979 VDI 3.373 ± 0.106 0.913 0.828-0.956 VPI 0.177 ± 0.024 0.970 0.941-0.985 VCI (1.031 ± 0.356) × 107 0.988 0.977-0.994 Flux 0.065 ± 0.014 0.937 0.874-0.968 Parafovea VAD 0.290 ± 0.027 0.903 0.808-0.951 VSD 0.088±0.009 0.935 0.870-0.967 VDI 3.334 ± 0.069 0.928 0.858-0.964 VPI 0.220 ± 0.029 0.933 0.867-0.966 VCI (1.671 ± 0.141) × 107 0.943 0.887-0.971 Flux 0.106 ± 0.014 0.905 0.812-0.952 FAZ 0.267 ± 0.079 0.998 0.997-0.999 Note . VAD, vessel area density; VSD, vessel skeleton density; VDI, vessel diameter index; VPI, vessel perimeter index; VCI, vessel complexity index; FAZ, foveal avascular zone; ICC, intraclass correlation coefficient; CI, confidence interval. Table 2. Interobserver Reproducibility of Measurements Using OMAG in Normal Eyes
-
The retinal vascular system, especially the macular area, is essential for normal visual function. Various techniques have been used to study retinal perfusion[17-19]; however, some of them are limited by their intrinsic properties, such as nonquantitative or invasive nature[20].
The OCTA as a novel noninvasive imaging technology could provide ocular blood flow imaging and functional visualization of the retinal and choroidal vasculatures[21]. In general, OCTA techniques could be classified into three categories based on the signal information used to contrast flow[22-24]. In previous studies, VAD and VSD were the two primary quantitative parameters reported[25-27], but when the decrease of microvascular perfusion is sometimes accompanied with vessel dilation, VAD is only capable of providing partial information about vascular abnormalities[15].
The OMAG, which was developed by Wang et al.[28], could provide more quantitative parameters to analyze blood flow information[15] as follows: VAD provides the estimate of a real vessel density as it takes both vessel length and vessel diameter into consideration; VSD quantifies the vessel density by only considering whether the vessel exists, which is simply an assessment of the vessel length density regardless of the vessel diameters; VDI describes the vessel size information regardless of the vessel length and is thus sensitive to vascular dilation; VPI uses the perimeter to present every vessel, which includes both the length and the diameter, similar to VAD; and VCI is used to describe vascular tortuosity.
Recently, Lei et al.[29] provided vessel length density (VLD) and perfusion density (PD) of the superficial vascular network, which can be obtained from OCTA images with high levels of repeatability and reproducibility. Our study took a lead in using a relatively large sample and all the parameters to assess the repeatability and reproducibility of OCTA based on OMAG measurements of macular vessels in normal eyes. The CV is a standardized measure of dispersion of a probability distribution or a frequency distribution and could scale the variability for the measurement size to reduce the effect of measurement scaling in estimating reproducibility. The measurements of all parameters showed high repeatability in both intravisit (CVs ≤ 4.2%) and intervisit (CVs ≤ 4.6%). In general, the CVs for intravisit were lower than for intervisit, indicating a better intravisit repeatability than intervisit repeatability. The FAZ size is closely related to age[30], and the FAZ shape, which also varied individually, could influence the measurements for the central foveal region. In this study, the CVs of VAD were lower for the parafovea field than for the fovea field, consistent with previous research[31]. The ICCs ranged from 0.903 to 0.998, also indicating good interobserver reproducibility. Technically, the high reproducibility may be a result of the automatic detection and calculation. Although the semiautomatic software was used, and data were calculated by two technical staffs; nevertheless, the results of our study were satisfactory and consistent with the study by Chen et al.[32] using a similar method.
It is difficult to assess the velocity of retinal blood flow. Although numerous studies have assessed the qualitative relationship between OCTA and retinal blood flow over the past several years, no convincing quantitative relationship has been proven. Choi et al.[16] showed that the OMAG signal was a function of flux within a specific velocity range. Tokayer et al.[24] performed an in-vitro phantom study using whole human blood to investigate the effect of flow velocity on split-spectrum amplitude-decorrelation angiography (SSADA) signal and obtained similar results. In the present study also, we obtained a relatively ideal reproducibility for the flux parameter, which should be analyzed further to determine whether it might become a new indicator of the velocity of retinal blood flow.
There are several limitations in the current study. First, the study was limited by assessing only the repeatability and reproducibility of superficial vessel parameters. One of the reasons for not assessing the deep vessel parameters is that it is difficult to remove projection artifacts of vessels from the superficial vascular network in the deep vascular network. Second, we evaluated only the average state of all parameters in the fovea and the parafovea; the data of the subfields such as the superior, the inferior, the temporal, and the nasal sectors should be analyzed in further studies.
In conclusion, the results of this study demonstrated good repeatability and reproducibility of OCTA based on OMAG for the measurement of superficial vessel parameters in normal eyes.
-
Ruikang K Wang and the Oregon Health & Science University co-own a patent that is licensed to Carl Zeiss Meditec, Inc. and Kowa, Inc. Ruikang K Wang received an innovative research award from Research to Prevent Blindness. He is a consultant to Carl Zeiss Meditec, Insight Photonic Solutions. The remaining authors declare that they have no competing interests.

 Quick Links
 DownLoad: