


HTML
-
The population worldwide is ageing rapidly, and the proportion of the global population aged over 60 years is expected to double from 11% to 22% by 2050[1]. The expected increase in the absolute number of older adults (age ≥ 80 years) will triple the 2013 population, reaching 392 million over this period[2]. In China, an increase of 15.7% (from 12.4% to 28.1%) in the proportion of adults aged ≥ 60 years is expected, and the number of persons aged ≥ 80 years is expected to increase from 23 million to 90 million, with both increases representing the fastest in the world[2]. Nevertheless, China is currently experiencing a demographic and epidemiologic transition. Many regions are unprepared to meet the demands of an aging population. To deal with the ensuing pressures of both per capita and total spending on health, the identification of research priorities should drive the fields of nutrition and public health in aging populations to prepare for the 'Silver Tsunami'.
The current focus of nutrition in older adults is often a healthy diet to prevent the risk of developing lifestyle diseases such as cardiovascular disease, type 2 diabetes mellitus, and so on. However, there is a large body of evidence to indicate that undernutrition is a common problem in this age group[3-6]. Unequivocally, undernutrition is associated with serious health problems, which have an impact on the well-being and quality of life of the individual[7]. Studies have shown that undernutrition increases the risk of morbidity and mortality, the length of hospital stay, and costs in the elderly population[8]. Sparre-Sorensen et al. found 340 excess deaths owing to undernutrition, which was about 10 times more than for other diseases in the Danish population[9]. The prevalence of undernutrition varies widely across different population subgroups of elderly people but is generally acknowledged to be higher in very old individuals, which would lead to aggravation of deteriorating health and functional status and increased risk of dependency and disability. Early identification and treatment of undernutrition can lead to improved outcomes and better quality of life[10, 11]. There is a clear lack of knowledge about the prevalence of undernutrition among the older people in China.
Increasing dietary intake via dietary counseling or nutritional supplementation is regarded as an economic and feasible method to improve undernutrition[12, 13]. It is well known that undernutrition and obesity are closely associated with energy and protein intake. In addition, research has found that consuming foods rich in sugar and saturated fat as the primary energy source is the main driver of the obesity epidemic, and the proportions of energy consumed as carbohydrates and fat are predicted to result in changes of body weight[14-16]. However, little is known about the relationship between dietary factors, especially the various food sources of energy or macronutrients, and undernutrition in elderly adults. It is therefore necessary to recognize the fundamental importance of proper nutritional support and explore the related dietary factors for undernutrition in this population.
The aim of this study was to estimate the prevalence of undernutrition in a sample of elderly Chinese residents aged 75 years old and over, living in different areas of China, and to identify the dietary factors related to undernutrition among these people.
-
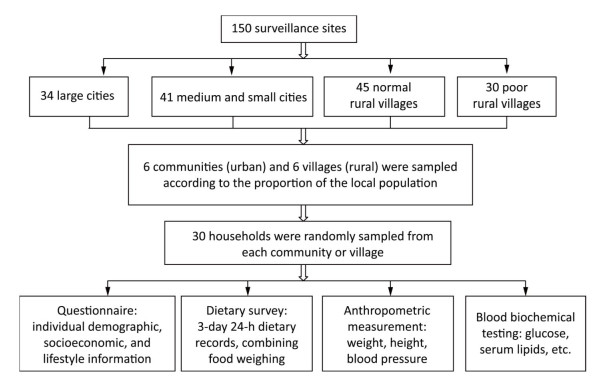
In this study, we used data from the Chinese Nutrition and Health Surveillance (CNHS) during 2010-2012 (Figure 1). The CNHS applied stratified, multistage, systematic clustered random sampling proportional to the population, to create a representative sample of China as a whole, including its 31 provinces, autonomous regions, and municipalities. Random sampling was conducted in 6 communities (urban) and 6 villages (rural), equal to the proportion of the local population at 150 survey sites of 4 types (large cities, medium and small cities, normal rural villages and poor rural villages). Thirty households were randomly sampled from each community or village. We included members of these households who were local residents or had lived locally for over 6 months and who were able to walk independently to the survey site. The CNHS was approved by the Ethical Committee of the National Institute for Nutrition and Food Safety of the Chinese Center for Disease Control and Prevention (2013[018]). All participants provided written informed consent. We enrolled participants aged 75 years and above in this study.
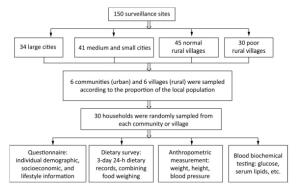
Figure 1. Flow diagram of the Chinese Nutrition and Health Surveillance during 2010-2012.
-
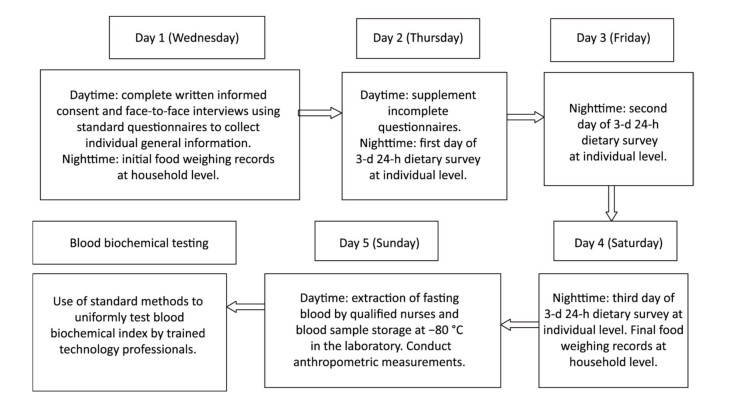
The CNHS included a questionnaire, dietary survey, and physical measurement of weight, height, blood pressure and selected biomarkers of disease and nutritional status[17] (Figure 2). A face-to-face interview using a standard questionnaire was conducted at the home of participants to collect individual demographic, socioeconomic, lifestyle, and physical activity information. Weekly physical activity MET (metabolic equivalent) min/week was calculated using the International Physical Activity Questionnaire (IPAQ) scoring procedure and classified according to the categorical score[18]. We also investigated whether participants had engaged in physical labor (such as farm work, physical labor-related occupations, and so on) in the past year. Anthropometric measurements were taken by trained staff at the local community health service center using uniform equipment. Weight was measured to the nearest 0.1 kg, with participants wearing no shoes and light clothing. Height was determined to the nearest 0.1 cm, without shoes. Body mass index (BMI) was calculated as weight (kg) divided by height (m) squared. The dietary survey was administered by trained dietary staff by querying and recording the information in a face-to-face interview. In addition, consecutive 3-day 24-hour dietary records were included at individual level, combined with food weighing at household level. All types and amounts of food consumed during the dietary survey days were documented by trained interviewers, using food models and pictures.Categorized food intake, dietary nutrient intake, and food sources of energy and macronutrients were calculated using food codes and the Chinese Food Composition Table[19, 20].
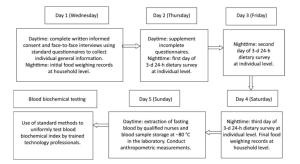
Figure 2. Example of the operational procedure at surveillance sites in the CNHS.
A total of 3, 381 participants aged 75 years and over had available data of food intake and anthropometric measurements. The data cleaning rules included samples with missing or illogical data (n= 162), less one day dietary records (n= 23), energy intakes lower than 800 kcal (3, 346 kJ) per day per reference man (n= 179), or higher than 5, 000 kcal (20, 910 kJ) per day per reference man (n= 204). Participants with missing values for basic demographic information, anthropometric measurements, dietary information, or blood samples were excluded (n= 261). Finally, 2, 552 participants aged 75 years and over were included in the analysis.
We defined undernutrition/underweight in participants as BMI less than 18.5 kg/m2 and normal weight as BMI between 18.5-24.9 kg/m2[21-23].
-
Data analysis was performed using SAS for Windows V9.3 (SAS Institute, Cary, NC, USA). Continuous variables with normal distribution and equal variance were compared between two groups using a Student t-test. For categorical variables, the chi-square test was used to examine the difference between two groups. The Mann-Whitney test was used when the data distribution was skewed. A sampling weight was assigned to each participant based on the study design using weight coefficients to harmonize the sample structure of the survey with that of the 2010 Chinese population census. The standardized prevalence of underweight was calculated using weighted data to represent the overall elderly Chinese population aged 75 years or older. PROC SURVEYMEANS and PROC SURVEYFREQ procedures in SAS were used to calculate mean, proportion, and their 95% confidence intervals (CIs). A two tailed P value < 0.05 was considered statistically significant.
As the sites formed clusters in the CNHS sampling scheme, complex sample survey (SVY) logistic regression analysis was performed to account for the data structure in PROC SURVEYLOGISTIC. The difference among lifestyle and socioeconomic groups was examined using SVY univariate logistic regression analysis, with normal BMI as reference. Two SVY multivariate logistic regression analysis models were used to assess the associations between sociodemographic/lifestyle factors, dietary intake, and undernutrition in participants. Food/macronutrient intakes and the proportions of food sources were categorized as quartiles, tertiles, or binary depending on the distribution of consumption. The association between food/macronutrient intake and undernutrition was adjusted for age, residential area (urban or rural area), region (north or south region which was divided by the Qinling Mountains and Huaihe Rive), physical activity, physical labor, smoking, health status, income, and energy intake (except when energy intake was the exposure variable), with normal BMI as reference. In the final model, a P value of < 0.05 was considered significant.
Data Sources
Participants and Methods
Statistical Analyses
-
A total 2, 552 elderly participants in the CNHS during 2010-2012, aged 75 years and over, were included in the present study. General demographic and lifestyle characteristics of participants are presented in Table 1. The average age of participants was 79.42 years old. Most participants had a some type of chronic disease (74.8%) and low education levels (88.1%). The majority (62.1%) of participants had a partner and lived with their family. In this study, 1, 467 participants (57.5%) lived in urban areas and 1, 085 participants (42.5%) lived in rural villages. Participants in urban communities had significantly higher BMI than those in rural areas (P < 0.001). The proportions of participants who smoked (26.9%) and engaged in physical labor (19.2%) were higher in rural villages (P < 0.05). However, average physical activity levels and the proportion of participants with a partner (64.2%) were higher in urban communities (P < 0.05). The proportions for education and income level were significantly different between the two types of residential area (P < 0.001).
Characteristics Urban
(N = 1, 467)Rural
(N = 1, 085)Total
(N = 2, 552)P -value# Age at survey (y), χ (se) 79.28 (0.15) 79.59 (0.15) 79.42 (0.11) 0.107 BMI, χ(se) 23.63 (0.15) 22.21 (0.18) 22.95 (0.12) < 0.001 Physical activity (MET min/week), χ(se) 4, 646 (317) 3, 101 (138) 3, 905 (177) < 0.001 Physical labor, n (%) < 0.001 No 1, 412 (96.25) 895 (82.49) 2, 307 (90.40) Yes 55 (3.75) 190 (17.51) 245 (9.60) Sex, n (%) 0.924 Male 734 (50.03) 542 (49.95) 1, 276 (50.00) Female 733 (49.97) 543 (50.05) 1, 276 (50.00) Health status, n (%)† 0.291 Has a chronic disease 1, 127 (76.82) 783 (72.17) 1, 910 (74.84) No chronic disease 340 (23.18) 302 (27.83) 642 (25.16) Smoker, n (%) 0.043 No 1, 220 (83.16) 793 (73.09) 2, 013 (78.88) Yes 247 (16.84) 292 (26.91) 539 (21.12) Drinker, n (%) 0.802 No 1, 143 (77.91) 847 (78.06) 1, 990 (77.98) Yes 324 (22.09) 238 (21.94) 562 (22.02) Education level, n (%)‡ < 0.001 Low 1, 186 (80.85) 1, 061 (97.79) 2, 247 (88.05) Medium 164 (11.18) 21 (1.94) 185 (7.25) High 117 (7.98) 3 (0.28) 120 (4.70) Income level, n (%)§ < 0.001 Low 500 (34.08) 624 (57.51) 1, 124 (44.04) Medium 513 (34.97) 206 (18.99) 719 (28.17) High 348 (23.72) 222 (20.46) 570 (22.34) Unknown 106 (7.23) 33 (3.04) 139 (5.45) Marital status, n (%) 0.024 Single 525 (35.79) 443 (40.83) 968 (37.93) Has a partner 942 (64.21) 642 (59.17) 1, 584 (62.07) Note. Abbreviations: χ, mean; se, standard error; MET, metabolic equivalent. †Chronic disease indicates having at least one of the following: hypertension, dyslipidemia, or diabetes, diagnosed by measurement and biochemistry testing in this survey or by a professional doctor. ‡Education levels: low indicates illiterate, primary school or below, or junior high school; medium indicates senior high school; high indicates college or above. §Income level = annual average income: low for urban < 9, 999 RMB, rural < 5, 000 RMB; medium for urban 10, 000-19, 999 RMB, rural 5, 000-9, 999 RMB; high for urban ≥ 20, 000 RMB, rural ≥ 15, 000 RMB. #Continuous variables used t-test; categorical variables used χ2 test. Table 1. General Characteristics of Participants in Different Residential Area in this Study#
The prevalence of undernutrition was 10.5% in the elderly population aged ≥ 75 years. According to univariate analysis of the data, the positively associated lifestyle factors for underweight were living in rural areas (OR= 2.03, 95% CI: 1.43-2.90), living in the south region (OR= 1.48, 95% CI: 1.02-2.15), smoking (OR= 1.66, 95% CI: 1.19-2.32) and having a chronic disease (OR= 1.63, 95% CI: 1.19-2.22); higher income level was inversely related (OR= 0.64, 95% CI: 0.44-0.94) with undernutrition, with normal BMI as the reference group. The prevalence of underweight in rural areas (14.8%) was found to be more than twice that in urban communities (6.6%) (P < 0.001). In the north region, the prevalence of underweight was lower than that in the south region, with 7.5% and 12.0%, respectively (P < 0.05). Smoking was associated with a higher rate of underweight compared with not smoking (P= 0.003; 16.3% vs. 8.9%). A higher prevalence of underweight was also found in participants who did not have hypertension, dyslipidemia, or diabetes (P= 0.002; 16.9%) and those with low income levels (P= 0.023; 12.7%). The prevalence of undernutrition in men was 12.1% and that in women was 9.2%, and the difference was not significant. The prevalence of underweight showed no significant difference among the groups with respect to physical activity and education levels (P > 0.05). The results of the analysis are depicted in Table 2.
Characteristics No. of Participants Prevalence (%) 95%CI P-value# Lower Upper Overall 2, 552 10.5 8.6 12.4 Sex 0.089 Male 1, 276 12.1 9.7 14.5 Female 1, 276 9.2 6.9 11.5 Residential area < 0.001 Urban 1, 467 6.6 4.8 8.3 Rural 1, 085 14.8 11.7 17.9 Region 0.041 North 939 7.5 5.3 9.7 South 1, 613 12.0 9.6 14.4 Physical activity level† 0.432 Light 91 13.2 5.3 21.0 Moderate 1, 202 11.2 8.8 13.5 Heavy 1, 163 9.1 6.8 11.4 No response 96 15.7 5.9 25.5 Physical labor 0.302 No 2, 307 9.9 8.1 11.7 Yes 245 15.3 9.5 21.1 Smoker 0.003 No 2, 013 8.9 7.0 10.8 Yes 539 16.3 12.6 20.0 Drinker 0.140 No 1, 990 9.94 8.10 11.78 Yes 562 12.70 9.38 16.02 Health status 0.002 Has a chronic disease 1, 910 8.3 6.7 9.9 No chronic disease 642 16.9 12.8 21.0 Education level 0.157 Low 2, 247 10.9 9.0 12.9 Medium 185 6.1 1.4 10.7 High 120 3.3 0.0 7.6 Income level 0.023 Low 1, 124 12.7 10.2 15.2 Medium 719 8.6 5.5 11.6 High 570 7.9 5.6 10.3 Unknown 139 8.9 1.8 16.0 Marital status 0.298 Single 968 0.1 0.0 0.2 Has a partner 1, 584 6.6 5.2 8.1 Note. †Physical activity level: light means < 600 MET min/week, moderate means 600-3, 000 MET min/week, heavy means ≥ 3, 000 MET min/week. #Using SVY univariate logistic regression analysis, with normal BMI as reference. Table 2. Prevalence of Undernutrition among Elderly Chinese Adults Aged Over 75 Years with Different Lifestyle and Socioeconomic Status during 2010-2012 (weighted data)#
Figure 3 shows the result of multivariate SVY logistic regres sion analysis. The following lifestyle/socioeconomic factors had a positive association with underweight in participants aged ≥ 75 years: 1) living in rural areas (OR= 1.94, 95% CI: 1.31-2.89; P= 0.001), 2) living in the south region (OR= 1.62, 95% CI: 1.11-2.35; P= 0.012), 3) smoking (OR= 1.55, 95% CI: 1.05-2.28; P= 0.028), and 4) having no chronic diseases, i.e., hypertension, diabetes, or dyslipidemia (OR= 1.61, 95% CI: 1.15-2.21; P= 0.005).
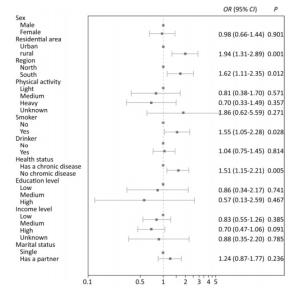
Figure 3. Odds ratios of lifestyle and socioeconomic factors for undernutrition prevalence among elderly Chinese adults aged 75 years and over during 2010-2012 (weighted data). Models were adjusted for the variables in the figure using SVY multivariate logistic regression analysis, with normal BMI as reference.
The average energy and protein intake of this population was 1, 654 kcal/d and 50.85 g/d [0.91 g/kg BW (body weight)/d], respectively. According to Chinese Dietary Reference Intakes (DRIs), 66.1% of participants failed to meet the Estimated Energy Requirement (EER) and only 27.9% consumed sufficient protein to meet the Recommended Nutrient Intake (RNI) for protein. In this study, we found that higher rice and animal oil consumption existed in the underweight group whereas milk and vegetable oil consumption were higher in the normal-weight group (P < 0.05 or P < 0.001). There was no significant difference in energy intake, dietary protein, and fat intake between the two groups. However, a significantly higher dietary carbohydrate intake was found among participants with normal weight (P= 0.008). The percentages of energy from fat and carbohydrates were higher in the normal-weight group than those in the underweight group (P < 0.05). The percentage of energy from cereals and the proportion of fat intake from animal sources were both significantly higher in underweight participants (P = 0.004, P= 0.049). On the contrary, the proportion of fat intake from plant sources was significantly higher in individuals with normal weight (P = 0.049). The percentage of protein intake from cereals was high in the underweight group whereas the percentages of protein intake from good-quality food sources (such as legumes, animal sources, and so on) were high in the normal-weight group, even though there was no statistically significant difference between the two groups (P > 0.05). The results of this analysis are presented in Table 3.
Item Underweight Group(n= 245) Normal-weight Group (n = 1,294) Total(n =2,552) P-value χ M P25 P75 χ M P25 P75 χ M P25 P75 Food intake (g/d) Rice 194.4 147.09 56.61 300.7 138.36 100.29 40.01 200.58 133.39 93.95 38.71 193.89 <0.001 Wheat 75.4 43.58 0 104.79 96.58 66.48 16.67 145.91 100.45 72.82 21.96 148.34 <0.001 Tubers 29.45 0 0 39.65 25.25 0 0 33.33 25.56 0 0 33.33 0.609 Vegetables 224.27 200.01 115.56 300 224.84 198.93 123.33 296.66 226.19 200.01 121.74 294.44 0.575 Legumes 3.12 0 0 0 3.1 0 0 0 3.56 0 0 0 0.261 Meat 62.22 50 7.57 98 62.11 46.67 13.33 93.33 62.26 43.66 13.33 93.21 0.891 Milk 22.65 0 0 0 32.39 0 0 0 39.96 0 0 5.12 <0.001 Eggs 18.76 0 0 28 20.94 10.14 0 33.33 22.2 14.67 0 35.2 0.08 Fish 18.98 0 0 26.38 19.73 0 0 27 20.4 0 0 27.81 0.863 Vegetable oils 24.66 20.1 8.15 35 27.55 23.3 11.7 36.9 28.22 24 12.73 38.18 0.049 Animal oils 5.74 0 0 3.8 3.53 0 0 0 3.12 0 0 0 <0.001 Energy and macronutrients Energy (kcal/d) 1,716 1,634 1,280 1,980 1,646 1,542 1,217 1,967 1,654 1,556 1,234 1,971 0.05 Protein (g/d) 50.82 48.77 34.76 63.19 50.01 46.9 34.78 61.27 50.85 47.14 35.64 62.09 0.354 Protein (g/kg BW/d) 1.19 1.14 0.82 1.45 0.94 0.87 0.6 1.13 0.91 0.82 0.6 1.13 0.103 Fat(g/d) 56.55 54.03 35.21 73.17 59.72 53.53 36.02 75.8 60.16 54.31 37.17 75.92 0.352 Carbohydrate (g/d) 228.3 209.37 160.77 274.68 252.79 238.85 160.54 300.76 229.37 211.76 160.76 274.7 0.008 %E protein 12.02 11.5 9.65 13.9 12.34 11.9 9.9 14 12.43 12 10.2 14.2 0.23 %Efat 30.31 29.5 20.5 39.7 32.45 31.5 23.6 40.2 32.56 31.8 23.83 40.48 0.018 %E carbohydrate 58.15 58.60 49.15 68.3 55.75 56 47.4 64.73 55.65 55.9 47.3 64.7 0.008 Food source of energy and macronutrients %E cereals 55.25 55.5 45.05 67.6 52.02 51.85 40.1 63.63 51.45 51.45 39.5 63.3 0.004 %E legumes 1.89 0 0 2.75 2.25 0.55 0 2.8 2.2 0.5 0 2.88 0.132 %E tubers 2.05 0 0 2.60 2.03 0 0 2.7 2.1 0 0 2.70 0.796 %E animal source 13.77 11.3 5.15 21.05 15.09 13 6.08 22.43 15.22 13.1 6.2 22.3 0.156 %E oil 16.6 13.5 8.35 23.2 17.07 14.6 9.3 22.93 17.1 14.7 9.3 23.2 0.398 %E alcohol 0.53 0 0 0 0.58 0 0 0 0.5 0 0 0 0.683 %E other 9.71 6.3 4 12.55 10.49 7.25 4.18 14.23 10.89 7.7 4.3 14.6 0.137 %Protein cereals 48.08 46.7 32.4 63.35 45.78 43.4 29.4 61.23 45.01 42.6 28.83 59.7 0.101 %Protein legumes 5.69 0 0 9.1 6.61 1.8 0 9.4 6.45 1.65 0 9.5 0.166 %Protein animal 29.04 29.3 13 45.15 30.12 29 13.8 44.3 30.64 29.95 14.8 44.88 0.535 %Protein other 17.19 14.7 9.35 21.65 17.49 14.9 9.8 22.9 17.9 15.3 9.8 23.4 0.494 %Fat animal 39.7 34.7 17.15 57.6 35.64 32.4 1S.00 51.83 34.96 31.2 15.5 50.9 0.049 %Fat plant 60.3 65.3 42.2 82.8 64.36 67.6 48.18 85 65.04 68.8 49.1 84.5 0.049 Note. Abbreviations: χ, mean; M, median; P25, percentile 25; P75, percentile 75; BW, body weight. Mann-Whitney test between underweight and normal-weight groups. Table 3. Differences in Food and Dietary Macronutrient Intake between Underweight and Normal Weight Elderly Chinese Adults Aged 75 Years and Over (2010-2012)
In multivariate SVY logistic regression models, we found several factors associated with undernutrition among our elderly participants, with the normal BMI group as reference. 1) High rice (≥ 194 g/d) consumption and animal oil consumption (> 0 g/d) were positively associated with underweight (rice: OR= 2.44, 95% CI: 1.35-4.40, P= 0.023; animal fat: OR= 1.60, 95% CI: 1.18-2.17, P= 0.002). 2) A high percentage of fat intake from animal sources (≥ 50.9%) was positively associated with undernutrition, with OR= 1.56 (95% CI: 1.06-2.31). 3) High wheat consumption (≥ 149 g/d), moderate vegetable consumption (17-200 g/d), a proper proportion of energy from fat (24%-32%), and high percentage of fat intake from plant sources (≥ 84.5%) showed an inverse association with underweight (wheat: OR= 0.44, 95% CI: 0.26-0.74, P= 0.024; vegetables: OR= 0.20, 95% CI: 0.05-0.84, P= 0.027; percentage of energy from fat: OR = 0.54, 95% CI: 0.35-0.83, P= 0.005; percentage of fat from plant sources: OR= 0.67, 95% CI: 0.46-0.99, P= 0.049). All logistic regression models were adjusted for confounders such as age, residential area region, physical activity, smoking, health status, income, and energy intake. The results are presented in Table 4.
Dietary Group Q1 Q2 Q3 Q4 P-value Rice 1 1.87 (1.02-3.42) 1.42 (0.79-2.56) 2.44 (1.35-4.40) 0.023 Wheat 1 0.92 (0.57-1.50) 0.81 (0.49-1.35) 0.44 (0.26-0.74) 0.024 Tubers# 1 0.91 (0.54-1.52) 0.99 (0.66-1.49) - 0.511 Fruit# 1 0.87 (0.55-1.37) 1.04 (0.69-1.56) - 0.899 Vegetables 1 0.20 (0.05-0.84) 0.22 (0.05-1.02) 0.25 (0.05-1.14) 0.027 Legumes & 1 0.68 (0.42-1.11) - - 0.055 Meat 1 1.04 (0.66-1.63) 0.96 (0.62-1.49) 1.33 (0.83-2.12) 0.749 Milk & 1 0.71 (0.39-1.30) - - 0.266 Eggs# 1 1.12 (0.78-1.60) 1.02 (0.62-1.66) - 0.836 Fish# 1 1.11 (0.70-1.78) 1.19 (0.76-1.86) - 0.910 Vegetable oils 1 0.88 (0.56-1.36) 0.76 (0.47-1.24) 0.82 (0.50-1.34) 0.340 Animal oils & 1 1.60 (1.18-2.17) - - 0.002 Energy 1 0.92 (0.56-1.51) 1.28 (0.84-1.96) 1.03 (0.65-1.63) 0.345 Protein 1 0.79 (0.50-1.25) 1.11 (0.68-1.82) 1.39 (0.73-2.65) 0.526 Fat 1 0.81 (0.50-1.33) 1.21 (0.73-2.02) 0.91 (0.48-1.76) 0.617 %E fat 1 0.54 (0.35-0.83) 0.76 (0.50-1.14) 0.85 (0.54-1.34) 0.005 %E carbohydrates 1 0.99 (0.61-1.63) 0.74 (0.45-1.23) 1.23 (0.72-2.07) 0.665 %E protein 1 1.32 (0.91-1.92) 0.96 (0.61-1.52) 1.38 (0.82-2.27) 0.193 %E cereals 1 0.83 (0.48-1.44) 1.16 (0.67-2.01) 1.03 (0.55-1.91) 0.403 Fat from animal sources 1 1.42 (0.97-2.07) 1.14 (0.69-1.88) 1.56 (1.06-2.31) 0.041 Fat from plant sources 1 0.79 (0.50-1.25) 0.91 (0.58-1.44) 0.67 (0.46-0.99) 0.049 Note. †Models adjusted for age, residential area, region, physical activity, physical labor, smoking, health status, income, and energy intake, using SVY multivariate logistic regression analysis; reference is normal BMI. #Food intake categorical levels were none, or below or above medium intake. & Food intake categorical levels were consumption or no consumption. Table 4. Odds Ratio (95% CI) for Undernutrition Prevalence by Quartiles of Dietary Food or Macronutrient Intake among Elderly Chinese Adults Aged 75 and Over Years during 2010-2012 (weighted data)†
-
This study showed that the prevalence of undernutrition was 10.5% among elderly Chinese adults aged 75 years and over. Elderly people living in rural areas, those living in the south region, those who smoked, and those who did not have hypertension, dyslipidemia or diabetes were found more likely to have undernutrition. Dietary factors such as wheat, rice consumption, the proportion of energy intake from fat, and the food source of fat were associated with underweight in this population.
Undernutrition in older people is an growing public health problem worldwide, with the average human life expectancy steadily increasing. In comparison to other health care settings, there is limited literature on the prevalence of underweight in community-dwelling older adults. In 2015, undernutrition affected less than 10% of independent older European people living in the community[24]. Ongan et al. found that the prevalence of underweight was 6.7% among community-living older adults in Turkey[25]. By comparison, underweight status is more severe among older Chinese people, with prevalence of 10.5%. Underweight occurs frequently owing to the fragile status of people at very advanced ages. The reported prevalence of underweight is 6.0% among Chinese people aged 18 years and over[26]. However, the prevalence among our participants aged 75 years and above was much higher than that among other age groups in the CNHS during 2010-2012: 7.5% in the age group 18-44 years, 2.5% in the group aged 45-59 years, and 6.1% in the age group 60 years and older[26]. Many common physiological characteristics of older adults might lead to undernutrition, such as worse appetite, sensory decline, poor self-care ability, chewing and swallowing problems, physical and cognitive impairment, and gut microbiome imbalance[27-29]. In addition, some socioeconomic and lifestyle factors such as poverty, low education level, loneliness, comorbidity, and smoking could be regarded as causes of undernutrition in elderly populations[30-33]. In this study, we found the prevalence of underweight was uniformly higher among participants living in rural areas, those with low income levels, and those who smoked.
China has experienced rapid economic growth and development over the past decades, and the lifestyle and dietary patterns have changed dramatically owing to globalization of the food market, consumption of more refined foods, frequent eating out, and motorized travel, especially in urban areas. Thereby, overweight and obesity have become more prevalent in urban areas and underweight has become aggregated in rural areas[34, 35]. With respect to the positive association between living in the south region and underweight, one plausible explanation could be the geographical characteristics and dietary cultural differences between the north and the south of China. In North China, people experience cold weather at least half the year and have greater energy and fat intakes but less physical activity. Some researchers have reported that the traditional northern dietary pattern in China is positively associated with general and abdominal obesity[36]. In addition, the traditional southern dietary pattern comprises less energy-dense foods such as rice, vegetables, and fruits[37]. These might cause the higher prevalence of underweight in the south region.
It is well known that inadequate caloric and protein intake is a major determinant for undernutrition status. However, we did not find that energy and protein intake were significantly different between the underweight and normal-weight groups. In addition, there was no association between energy or protein intake and underweight. Nevertheless, we found that the proportion of energy from cereals was higher in underweight elderly people. Furthermore, the proportion of energy from fat (24%-32%) and higher fat intake from plant sources was inversely associated with undernutrition. Similarly, the proportion of protein from cereals was high in the underweight group whereas the percentage of high-quality protein (such as protein from legumes or animal sources) was high in the normal-weight group. Thus, it is important to focus on the quality of dietary intake for older populations rather than merely the quantity of energy and protein intake. In the very elderly population, physiological characteristics can induce many symptoms such as poor appetite, dysphagia, poor dentition, maldigestion, and malabsorption, among others[38]. Therefore, a good-quality, digestible, and absorbable diet is needed for this population.
Vegetable oils contain different kinds of fatty acids whose composition varies widely. Typically, the predominant types of fatty acids are monounsaturated fatty acids (MUFAs) and polyunsaturated fatty acids (PUFAs), which enhance nutrient digestibility and are more beneficial for healthy weight[39]. Chinese traditional dietary habits include use of lard as the main source of animal-based oils[40]. The consumption of animal oils or lard is higher in rural areas, especially poor ones, and in the south of China[41]. Some researchers have demonstrated that lard leads to a reduction of antioxidants in the liver, increases the burden on the kidneys, and causes elevation of adipogenesis and hydrolysis of triglycerides in adipose tissues. Lard also has a much stronger capacity of stimulating lipolysis than vegetable oils, to effect weight loss[40]. In this study, we found that the prevalence of underweight was much higher among individuals living in rural or southern regions who consumed more animal oils/lard than other participants[26]. Therefore, we suggest that the proportion of energy intake from fat (AMDR (Acceptable Macronutrient Distribution Range) of total fat in China) might be increased to the appropriate range of 24%-32%, which is consistent with the new recommendation of the FAO (Food and Agricuture Organization)/WHO (World Health Organization) for an AMDR of total fat of 20%-35%E[42]. In addition, the type of fat intake might be chosen from plant over animal sources for elderly adults who are underweight.
In the present study, we found that rice consumption was higher in older persons with underweight and rice consumption was positively associated with undernutrition, in contrast to wheat consumption. There is much data lacking about the relationship of food intake and underweight in very old people. Similarly, previous studies in children have shown that the percentage of child underweight increases as rice expenditures rise and higher rice intake increases the likelihood of children developing stunted growth[43, 44]. A recent study extended our findings from another aspect in that the rice staple dietary pattern was negatively associated with general obesity in elderly Chinese women [prevalence ratio (PR) = 0.745; 95% CI: 0.673-0.807] and the highest quartile of the wheat staple pattern had significantly greater risk of central obesity in elderly Chinese men (PR= 1.331; 95% CI: 1.094-1.627)[45]. In a longitudinal study of dietary patterns in China, researchers also found that adherence to a modern high-wheat dietary pattern might be positively associated with overweight and obesity; a one-unit increase in the modern high-wheat pattern was associated with a BMI ≥ 23 kg/m2 (OR= 1.27, 95% CI: 1.24-1.30) for the entire follow-up period[46]. Rice is characterized by a very low nutrient density in which the content of protein is much lower than that of wheat[47] and protein is less digestible[48]. A system analysis considered that when rice consumption decreases, wheat consumption increases, and the intakes of total energy and total protein increase as well[49].
The present study had several limitations. First, this study was designed as a cross-sectional study; therefore, we could not explain the causal relationship between diet and underweight. In the future, long-term longitudinal studies and randomized controlled trials are needed to explore the effect of diet on improving undernutrition. Second, we were aware of some confounders that were omitted from the study, for example, consumptive diseases, gastrointestinal diseases, psychological illness (anorexia, depression), and detailed drug information; these factors are common in older populations and might affect the association between dietary and weight. Third, using the 24-hour recall method to collect data of dietary intake cannot reflect long-term dietary status. A food frequency questionnaire (FFQ) should be included in future studies. Lastly, in this study, body composition was not measured, which is very important for elderly people who are underweight. Undernutrition has emerged as an important etiological factor in the development of the two main geriatric health threats, sarcopenia and frailty, which manifest as a paucity of muscle mass[50, 51]. Therefore, it is important to understand the association between body composition and nutrition in elderly adults who are underweight. Further studies should examine this issue.
In conclusion, the serious prevalence of undernutrition among the elderly Chinese population aged 75 years and over requires greater attention, particularly elderly people living in rural areas or in the south of China, as well as those who smoke and have low income levels. Dietary energy intake is insufficient among most older people. Underweight older adults are recommended to improve the quality of their diet by consuming sufficient energy and protein from various food sources, and including good-quality fats and adequate vegetable consumption.
-
We acknowledge all participants and staff of the Chinese Nutrition and Health Surveillance (CNHS) and the support from the related departments of 31 provinces, autonomous regions and municipalities.
-
The authors' contributions were as follows: LIU Zhen analyzed the data and wrote the manuscript; PANG Shao Jie cleaned the data; MAN Qing Qing, WANG Jing Zhong collected information and took anthropometric measurements; ZHAO Wen Hua and ZHANG Jian conceived and designed the study; ZHANG Jian supervised the study.
-
The authors declare no conflicts of interest.

 Quick Links
 DownLoad: