


HTML
-
According to the data from the WHO, 1, 170, 000 preterm infants are born in China every year; the number of preterm births ranks in the top two throughout the world[1, 2]. Data from 2005 showed that 62.3% of hospitalized preterm infants were late preterm infants, defined as newborns with a gestational age (GA) between 34+0 and 36+6 weeks. Data from four major hospitals in Beijing also showed that late preterm infants accounted for 71.5% of all preterm infants, similar with the figure for the US[3, 4]. Most preterm infants will benefit if we manage late preterm infants well, even in regions lacking resources.
Late preterm infants were once known as 'near full-term infants'. Even now, some doctors and parents still consider late preterm infants large enough to be classified as full-term infants and do not believe they need more attention[1-5]. However, many studies have shown that the incidence of short-term complications in late preterm infants, such as hypoglycemia, hyperbilirubinemia, respiratory distress syndrome, feeding intolerance, and infection was much higher than in full-term infants, and caused longer hospital stays and higher medical costs. As for long-term complications, asthmatic disease, cerebral palsy, physical growth retardation, and delayed intellectual development also affect the quality of life of this population[6-9]. Nutritional support of late preterm infants is one of the most important aspects of management of late preterm infants. Providing optimal nutritional support to late preterm infants may improve survival and quality of life as it does for very preterm infants. There is no guideline or widely accepted protocol for nutritional support of late preterm infants: the nutritional management status of this population varies greatly between institutions and even between doctors in the same hospital. Various factors, such as the nature of feeds, time of initiation of enteral feeding, and the increasing volume of enteral feeding, may affect nutritional support, body weight gain, and the incidence of complications. This is the first multi-center study focusing on the enteral feeding practices in hospitalized late preterm infants in China and helps us to appreciate the critical importance of enteral feeding management of late preterm infants in China.
-
A cross-sectional study was conducted. The study was approved by the ethics committee of Peking Union Medical College Hospital. Twenty-five member hospitals participating in the Beijing Cooperative Multi-center Preterm Infants Network (BCMPN) participated in this multi-center study. In the BCMPN, there are 20 level Ⅲ hospitals and 5 level Ⅱ hospitals in the Chinese medical system.
-
Inclusion criteria: From October 2015 to October 2017, preterm infants born at 34+0 through 36+6 weeks' GA and admitted to the neonatal intensive care units (NICUs) or neonatal nurseries of 25 hospitals in Beijing, affiliated with the BCMPN, were eligible for enrollment.
Exclusion criteria: Infants with major congenital anomalies and/or gastrointestinal diseases and infants who transferred to other medical institutions before discharge or died within the first 48 h of life were excluded from the study.
-
The data collection form was designed as a software program named Infantmed and was installed on tablets provided to all the participating hospitals. The same standard length and head circumference scales were provided to all the participating hospitals. The weighing scales of all the participating hospitals were calibrated with a standard weight. A manual of operations of our study was used in all the member hospitals, in which all the data definitions and complication definitions were included. Small for gestational age (SGA) birth was defined as a birth weight below the 10th percentile for the same GA. Definitions for common complications of late preterm infants were adapted from 'Practice of Neonatology (4th edition)'[10]. Asphyxia was defined as a sentinel hypoxic event occurring immediately before or during labor and an Apgar score at 1 min not to exceed 7. Hypoglycemia was defined as blood glucose < 2.2 mmol/L, and hyperglycemia was defined as blood glucose > 7 mmol/L, regardless of gestational or postnatal age or weight. Anemia was defined as central venous hemoglobin < 13 g/dL or capillary hemoglobin < 14.5 g/dL. Hyperbilirubinemia was defined as a level of total serum bilirubin over the 95th percentile point of the hour-specific bilirubin curve for infants over 35 weeks' gestational age and preterm infants[11, 12]. Infection was suspected if an infant demonstrated symptoms and signs such as temperature irregularity, lethargy, irritability, poor peripheral perfusion, cyanosis, feeding intolerance, vomiting, diarrhea, or abdominal distention, tachypnea, respiratory distress, apnea, tachycardia, hypotension, hypoglycemia, hyperglycemia, or metabolic acidosis, or abnormal complete blood cell count or C-reactive protein. A blood culture was performed before the initiation of antibiotics. A negative blood culture was diagnosed as infection and a positive blood culture as blood-culture-proven sepsis.
Baseline data were obtained soon after admission, and outcome data were obtained every day or at the time of discharge to home. All data were uploaded to the database from tablets every day or within 3 d after infants were discharged. Basic data collected included GA, sex, Apgar score, birth weight (BW), length, head circumference, SGA birth, and the incidence of asphyxia, respiratory distress syndrome (RDS), hyperbilirubinemia, anemia, neonatal infection, hypoglycemia, and hyperglycemia during the length of stay.
Enteral feeding data during hospitalization were collected, including the time of initial enteral feeding, the nature of enteral feeding during hospitalization, the volume and calories of enteral feeding (not ordered volume but actual volume fed to infants) on days 1-7, and at discharge, the time taken to achieve full enteral feeding [defined as receiving enteral feeding of 150 mL/(kg·d)], the time taken to achieve full enteral calories [defined as receiving a caloric content of 120 kcal/(kg·d) by enteral feeding], whether the infants received parenteral nutrition (including amino acids or lipid solution during birth hospitalization), the time taken to regain birth weight, weight at discharge, length at discharge, head circumference at discharge, and weight growth velocity {GV = [1000 × ln (Weighty / Weightx)] / (Dy- Dx), x = the day with the lowest body weight, y = length of stay}[13, 14].
-
The Statistical Package for the Social Sciences (SPSS) for Windows, version 24.0 (IBM SPSS Inc. Chicago, IL, USA) was used for statistical analysis. The Kolmogorov-Smirnov test was used to determine whether or not the variables were normally distributed. Data were presented as mean ± standard deviation for normally distributed variables and percentages (median, and P25, P75) for variables that were not normally distributed. Comparisons between groups were performed by the χ2 test for discrete variables or by ANOVA or the Kruskal-Wallis test, when appropriate, for continuous variables. The level of significance was set at P < 0.05.
Study Design
Study Population
Definitions, Data Collection, and Analysis
Statistics
-
A total of 1, 463 late preterm infants were enrolled in this study, with a median (IQR) GA of 35.6 (34.9, 36.1) weeks. The percentage of small for gestational age (SGA) was 11.6% for all late preterm infants. When stratified by GA, 17% of infants born at 36 weeks' GA were born SGA. Of the enrolled late preterm infants, 3.7% developed RDS. More infants born at 34 weeks' GA were diagnosed with RDS (6.5% of infants born at 34 weeks' GA versus 2.8% of infants born at 35 weeks' GA versus 2.7% of infants born at 36 weeks' GA, P = 0.004). The incidence of hypoglycemia was 13.1%, and 2.3% of late preterm infants were diagnosed with hyperglycemia (4.3% of infants born at 34 weeks' GA versus 2.1% of infants born at 35 weeks' GA versus 1.1% of infants born at 36 weeks' GA, P = 0.023). A total of 45.0% of infants were diagnosed with hyperbilirubinemia and 14.1% with anemia. Twenty-two percent of infants were diagnosed with neonatal infection and exposed to antibiotics, of which 1.8% had blood-culture-proven sepsis, and there was no significant difference between GA groups. There was an inverse correlation between the length of hospital stay and GA. Infants born at 34 weeks' GA stayed in hospital for 10 (8, 13) days, while the hospital stay length of infants born at 36 weeks' GA was shortened to 7 (6, 9) days. Other study characteristics of our late preterm infant cohort are shown in Table 1.
Characteristics All Infants 34 Weeks 35 Weeks 36 Weeks P Value N (%) 1, 463 (100%) 369 (25.2%) 566 (38.7%) 528 (36.1%) GA (weeks) 35.6 (34.9, 36.1) 34.4 (34.1, 34.7) 35.4 (35.1, 35.7) 36.3 (36.1, 36.6) < 0.001 Male infants, n (%) 789 (53.9%) 207 (56.1%) 303 (53.5%) 279 (52.8%) 0.061 C-section, n (%) 962 (65.8%) 262 (71.0%) 351 (62.0%) 349 (66.1%) 0.047 Asphyxia, n (%) 21 (1.4%) 10 (2.7%) 7 (1.2%) 4 (0.8%) 0.047 W at birth (g) 2, 440 (2, 200, 2, 710) 2, 250 (2, 020, 2, 440) 2, 485 (2, 259, 2, 740) 2, 545 (2, 300, 2, 800) < 0.001 L at birth (cm) 47.0 (45.0, 48.0) 46.0 (44.0, 47.0) 47.0 (45.0, 48.0) 47.0 (46.0, 49.0) < 0.001 HC at birth (cm) 32.0 (31.5, 33.0) 32.0 (30.5, 33.0) 32.5 (32.0, 33.0) 32.5 (32.0, 33.0) < 0.001 SGA, n (%) 170 (11.6%) 28 (7.6%) 52 (9.2%) 90 (17.0%) < 0.001 RDS, n (%) 54 (3.7%) 24 (6.5%) 16 (2.8%) 14 (2.7%) 0.004 Hypoglycemia, n (%) 192 (13.1%) 52 (14.1%) 67 (11.8%) 73 (13.8%) 0.519 Hyperglycemia, n (%) 34 (2.3%) 16 (4.3%) 12 (2.1%) 6 (1.1%) 0.023 Hyperbilirubinemia, n (%) 658 (45.0%) 175 (47.4%) 241 (42.6%) 242 (45.8%) 0.319 Anemia, n (%) 207 (14.1%) 67 (18.2%) 77 (13.6%) 63 (11.9%) 0.091 Infection, n (%) 321 (21.9%) 82 (22.2%) 123 (21.7%) 116 (22.0%) 0.987 Blood-culture-proven sepsis, n (%) 27 (1.8%) 8 (2.2%) 79 (1.2%) 12 (2.3%) 0.386 W at discharge (g) 2, 480 (2, 280, 2, 750) 2, 340 (2, 138, 2, 540) 2, 530 (2, 319, 2, 790) 2, 560 (2, 335, 2, 860) < 0.001 L at discharge (cm) 47.0 (46.0, 49.0) 46.5 (45.0, 48.0) 48.0 (46.0, 49.0) 48.0 (46.0, 49.0) < 0.001 HC at discharge (cm) 33.0 (32.0, 33.5) 32.0 (31.0, 33.0) 33.0 (32.0, 33.8) 33.0 (3.0, 34.0) < 0.001 Length of stay (d) 8 (7, 11) 10 (8, 13) 8 (7, 10) 7 (6, 9) < 0.001 Note. Data are shown as x±s or percentage (median and P25, P75); GA: gestational age; W: weight; L: length; HC: head circumference; SGA: small for gestational age; RDS: respiratory distress syndrome. Table 1. Demographic Data of Late Preterm Infants
-
The percentage of exclusive breastfeeding was 4.5% for the entire cohort at the initiation of enteral feeding and increased to 14.4% when the infants were discharged. Most late preterm infants, approximately 46.1%, were fed with preterm infant formula (80 kcal/100 mL or 81 kcal/100 mL) during hospitalization. Post-discharge formula (73 kcal/100 mL or 74 kcal/100 mL) was used for 17.0% of late preterm infants, and 8.7% infants accepted full-term formula (67 kcal/100 mL or 68 kcal/100 mL). Mixed feeding was given for 22.9% infants, who received any kind of formula and human milk. There were 12 cases of missing data concerning enteral feeding, which accounted for 0.8%. Infants born at 35 weeks' GA received more post-discharge formula, and more infants born at 36 weeks' GA received full-term formula. Only 4.3% of infants born at 34 weeks' GA were fed exclusively with human milk after birth, 33.1% of them received mixed feeding, and the exclusive human milk feeding rate increased to 21.1% at discharge, which is higher than that in infants born at 35 weeks' and 36 weeks' GA (Table 2).
Nature All Infants
(N = 1, 463)34 Weeks
(n = 369)35 Weeks
(n = 566)36 Weeks
(n = 528)P Value Exclusive human milk feeding, n (%) 66 (4.5%) 16 (4.3%) 25 (4.4%) 25 (4.7%) 0.628 Preterm infant formula feeding, n (%) 674 (46.1%) 178 (48.2%) 258 (45.6%) 238 (45.1%) 0.473 Post-discharge formula feeding, n (%) 248 (17.0%) 41 (11.1%) 126 (22.3%) 81 (15.3%) < 0.001 Full-term formula feeding, n (%) 128 (8.7%) 8 (2.2%) 48 (8.5%) 72 (13.6%) < 0.001 Mixed feeding, n (%) 335 (22.9%) 122 (33.1%) 107 (18.9%) 106 (20.1%) < 0.001 Exclusively human milk feeing at discharge, n (%) 209 (14.4%) 77 (21.1%) 68 (12.1%) 64 (12.3%) < 0.001 Table 2. The Nature of Enteral Feeding of Late Preterm Infants During Hospitalization
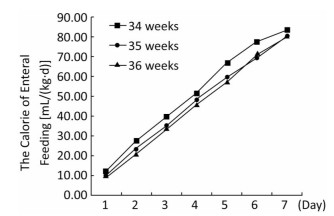
The volume and energy levels of enteral nutrition at different time points are shown in Table 3. Infants born at 36 weeks' GA received a greater volume of enteral feeding on days 1 through 6 and more calories in the form of enteral feeding on days 1 through 5, but this trend was reversed on days 6 and 7 (Figures 1, 2). With the present nutritional support, only 28.4% of late preterm infants achieved full enteral feeding at discharge, and only 19.2% of late preterm infants achieved 120 kcal/(kg·d) by enteral feeding at discharge. More infants born at 34 weeks' GA achieved full enteral nutrition (41.7% of infants born at 34 weeks' GA versus 24.2% of infants born at 35 weeks' GA versus 23.7% of infants born at 36 weeks' GA, P < 0.001) and full enteral caloric intake (29.3% of infants born at 34 weeks' GA versus 16.6% of infants born at 35 weeks' GA versus 15.0% of infants born at 36 weeks' GA, P < 0.001) at discharge and received a greater volume [118.3 mL/(kg·d)] in infants born at 34 weeks' GA versus 103.0 mL/(kg·d) in infants born at 35 weeks' GA versus 105.9 mL/(kg·d) of infants born at 36 weeks' gestation, P < 0.001) and higher energy by enteral feeding [117.7 kcal/(kg·d)] in infants born at 34 weeks' GA versus 102.4 kcal/(kg·d) in infants born at 35 weeks' GA versus 100.4 kcal/(kg·d) in infants born at 36 weeks' GA, P < 0.001) at discharge. At discharge, 40.5% of infants had not regained their birth weight. Infants born at 36 weeks' GA regained their birth weight sooner, but more of them did not regain their birth weight at discharge (47.9% of infants born at 36 weeks' GA versus 38.7% of infants born at 35 weeks' GA versus 32.5% of infants born at 34 weeks' GA, P < 0.001). The mean rate of body weight gain in late preterm infants was 9.6 (5.9, 13.9) g/(kg·d). There was a trend toward a higher rate of body weight gain in infants born at 34 weeks' GA but no significant difference between different GA groups (Table 4).
Feeding Practices All Infants
(N = 1, 463)34 Weeks
(n = 369)35 Weeks
(n = 566)36 Weeks
(n = 528)P Value Initial time of enteral feeding (d) 1.0 (1.0, 1.0) 1.0 (1.0, 1.0) 1.0 (1.0, 1.0) 1.0 (1.0, 1.0) 0.760 Volume of EN on D1 [mL/(kg·d)] 14.1 (6.5, 26.5) 12.9 (5.3, 21.6) 13.3 (7.0, 21.4) 16.3 (6.4, 32.1) < 0.001 Energy of EN on D1 [mL/(kg·d)] 10.7 (4.9, 19.9) 10.0 (4.1, 17.2) 9.9 (5.5, 16.2) 12.3 (4.9, 23.9) < 0.001 Volume of EN on D2 [mL/(kg·d)] 32.0 (17.1, 48.5) 29.7 (16.7, 43.2) 30.7 (16.0, 46.5) 35.7 (19.3, 53.3) < 0.001 Energy of EN on D2 [mL/(kg·d)] 24.4 (13.0, 36.0) 21.8 (12.3, 34.0) 23.2 (12.3, 35.2) 27.3 (14.9, 39.9) < 0.001 Volume of EN on D3 [mL/(kg·d)] 46.8 (29.3, 67.8) 43.4 (26.8, 63.4) 45.7 (27.9, 65.9) 51.2 (32.9, 75.8) < 0.001 Energy of EN on D3 [mL/(kg·d)] 35.8 (22.3, 51.3) 33.5 (20.9, 49.3) 35.1 (21.6, 49.0) 39.5 (24.4, 56.1) < 0.001 Volume of EN on D4 [mL/(kg·d)] 64.0 (42.1, 87.7) 60.0 (37.8, 84.4) 63.2 (42.7, 86.0) 67.9 (45.7, 91.4) < 0.001 Energy of EN on D4 [mL/(kg·d)] 48.3 (32.4, 66.9) 46.1 (29.3, 64.7) 48.3 (33.3, 64.9) 51.2 (34.3, 70.2) 0.002 Volume of EN on D5 [mL/(kg·d)] 82.1 (55.6, 105.4) 75.3 (52.1, 103.7) 79.5 (55.1, 100.5) 87.0 (59.0, 112.0) 0.002 Energy of EN on D5 [mL/(kg·d)] 61.1 (42.4, 80.0) 57.2 (39.9, 78.3) 59.8 (41.7, 76.4) 66.5 (43.9, 84.2) 0.011 Volume of EN on D6 [mL/(kg·d)] 95.6 (68.4, 123.4) 93.5 (67.9, 122.5) 91.3 (66.7, 119.4) 103.0 (71.4, 112.0) 0.037 Energy of EN on D6 [mL/(kg·d)] 72.0 (51.6, 92.9) 71.5 (51.9, 92.4) 69.6 (50.5, 89.8) 77.2 (52.4, 97.9) 0.083 Volume of EN on D7 [mL/(kg·d)] 108.0 (78.1, 133.3) 108.8 (77.5, 134.0) 103.8 (79.8, 131.1) 110.7 (78.0, 136.4) 0.532 Energy of EN on D7 [mL/(kg·d)] 81.5 (60.0, 101.9) 80.9 (61.3, 103.4) 80.8 (60.2, 100.2) 83.0 (58.7, 102.8) 0.804 Volume of EN at discharge [mL/(kg·d)] 108.7 (81.1, 133.0) 118.3 (94.0, 139.9) 103.0 (76.7, 130.2) 105.9 (77.7, 131.2) < 0.001 Energy of EN at discharge [mL/(kg·d)] 105.0 (84.3, 133.2) 117.7 (97.8, 151.7) 102.4 (82.5, 129.4) 100.4 (79.1, 126.6) < 0.001 Achieving 150 (mL/kg·d) at discharge n (%) 416 (28.4%) 154 (41.7%) 137 (24.2%) 125 (23.7%) < 0.001 The time achieving 150 [mL/(kg·d)] (d) 8 (7, 10) 9 (7, 11) 8 (6, 10) 7 (6, 10) 0.198 Achieving 120 (kcal/kg·d) at discharge n (%) 281 (19.2%) 108 (29.3%) 94 (16.6%) 79 (15.0%) < 0.001 The time achieving 120 [mL/(kg·d)] (d) 8 (7, 11) 9 (7, 12) 8 (7, 10) 7 (6, 9) < 0.001 Note. EN: Enteral nutrition. Table 3. Data on Enteral Feeding Practices of Late Preterm Infants During Hospitalization
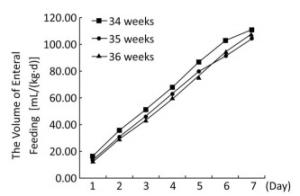
Figure 1. The volume of enteral feeding of late preterm infants at different time points.
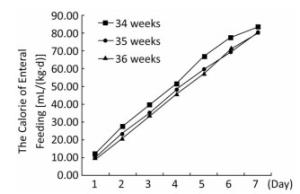
Figure 2. The calorie of enteral feeding of late preterm infants at different time points.
Items All Infants
(N = 1, 463)34 Weeks
(n = 369)35 Weeks
(n = 566)36 Weeks
(n = 528)P Value W at birth (g) 2, 440 (2, 200, 2, 710) 2, 250 (2, 020, 2, 440) 2, 485 (2, 259, 2, 740) 2, 545 (2, 300, 2, 800) < 0.001 Time with lowest W (d) 3 (3, 4) 3 (3, 4) 3 (3, 4) 2 (3, 4) 0.442 Time regained the BW (d) 6 (4, 7) 6 (5, 8) 6 (4, 7) 5 (4, 6) < 0.001 Infants who did not regain their BW at discharge, n (%) 592 (40.5%) 120 (32.5%) 219 (38.7%) 253 (47.9%) < 0.001 Length of stay of infants who did not regain their BW (d) 7 (6, 9) 8 (7, 10) 7 (5, 9) 6 (5, 8) < 0.001 W at discharge in g (IQR) 2, 480 (2, 280, 2, 750) 2, 340 (2, 138, 2, 540) 2, 530 (2, 319, 2, 790) 2, 560 (2, 335, 2, 860) < 0.001 Growth velocity [mL/(kg·d)] 9.6 (5.9, 13.9) 10.7 (7.1, 14.4) 9.1 (5.5, 13.6) 9.3 (5.5, 14.1) 0.818 Note. W: Weight; BW: Birth weight. Table 4. Data on Body Weight Change
Demographic Features
Enteral Feeding Practices
-
Late preterm infants represent the largest proportion of infants born at less than 37 weeks' GA. They are often considered both physiologically and metabolically mature because they are of comparable size and weight at birth to infants born at term; indeed, they seem to have fewer severe neonatal complications and fewer long-term neurological sequelae when compared with infants born before 34 weeks' GA, especially extremely preterm infants[15]. However, late preterm infants are born more than a few days earlier than term infants and are at increased risk of adverse clinical outcomes compared with term infants[16, 17]. The mean length of hospital stay in late preterm infants is much longer than what is generally accepted for term infants born by vaginal delivery (48 h) and by cesarean delivery (96 h). Several studies have shown that late preterm infants, compared with their term counterparts, have a higher incidence of neonatal morbidities including hyperbilirubinemia, anemia, hypoglycemia, infection, and respiratory distress syndrome[5, 18].In our study, 3.7% of late preterm infants developed respiratory distress syndrome, 2.3% hyperglycemia, 45.0% hyperbilirubinemia, 14.1% anemia, 21.9% infection, and 1.8% blood-culture-proven sepsis. Some complications had incidences similar to those reported in other research, while others had higher incidences[3, 19]. Different definitions of hyperbilirubinemia and infection might account for the differences seen in the rates of these complications. Because of the lack of microvolume blood detection in some member hospitals, phlebotomy might account for increased anemia, particularly in infants born at 34 weeks' GA. Optimal nutritional management would reduce these complications and promote the growth and neurodevelopment of preterm infants[20, 21]. A standardized feeding protocol might decrease the incidence of hypoglycemia, hyperglycemia, and hyperbilirubinemia. However, significant variation between units exists in the delivery of care to this population[22]. Documentation of feeding practices is rare in the literature. Feeding regimens designed specifically to meet the nutritional requirements of late preterm infants have not been established. At present, there is no routine data collection about the nutritional management of late preterm infants in China; to our knowledge, this study was the first to focus on the enteral feeding practices of hospitalized late preterm infants. The data demonstrated the status of enteral feeding practices in China and allow us to consider strategies to improve our enteral feeding support of late preterm infants.
When a preterm infant is born, the rich supply of nutrition that has supported the growth and development of the fetus up to that point is interrupted[23]. Much attention has focused on enhancing the nutritional support of very low birth weight (VLBW) and extremely low birth weight (ELBW) infants to improve survival and quality of life. The nutritional requirements of VLBW infants have been defined to prevent cumulative nutritional deficits soon after birth. The goal of these efforts is to improve growth early so that preterm and VLBW infants reach a normal weight and length by the expected date of delivery or, at the latest, by the time they are discharged from the hospital[24]. Nutritional requirements for late preterm infants can be evaluated in the manner that is currently applied to VLBW infants and with a similar goal[24]. Generally, insufficient attention is paid to the enteral feeding support of late preterm infants. Late preterm infants are not mature enough to obtain enteral nutrition as full-term infants, although they are considered nearly full term. Considering these infants as healthy babies may place them at a disadvantage. Our study revealed that enteral feeding support for hospitalized late preterm infants is insufficient, and early discharge practices place them at risk for growth failure. The initial volume and energy of enteral feeding was 14.1 mL/(kg·d) and 10.7 kcal/(kg·d). Enteral feeding volume advanced by approximately 15 mL/(kg·d), and enteral energy advanced by approximately 10 kcal/(kg·d). On day 7, the average enteral feeding volume was 108 mL/(kg·d), and the average enteral feeding energy was only 81.5 kcal/(kg·d); the average volume was 108.7 mL/(kg·d), and the average energy was 105.0 kcal/(kg·d) at discharge. Only 24.8% of hospitalized late preterm infants achieved full enteral feeding, and only 19.2% of late preterm infants achieved full energy intake by day 8. These data indicate that only 70%-80% of late preterm infants achieve full enteral feeding after they are discharged home, typically after day 8. Data from another study showed preterm infants born at 30-33 weeks' GA achieved full enteral feeding by day 8[25], and extremely preterm infants attained full enteral feeding by postnatal days 7 (5 to 11)[26-28]. Less mature preterm infants are capable of achieving full enteral feeding earlier than the late preterm infants in our study. This calls us to consider establishing a more aggressive enteral feeding regimen for late preterm infants.
In our study, approximately 40% of late preterm infants did not regain their birth weight when they were discharged by the seventh day of life. We believe the reason is that these late preterm infants were discharged home too early. However, our data showed that infants who regained their birth weight were discharged earlier than those who did not regain their birth weight. Infants born at 36 weeks' GA could regain their birth weight sooner, but more of them had not regained their birth weight at discharge. All these data indicate that the main reason was not short length of stay but insufficient nutrition support during hospitalization following birth. The nutritional goal for preterm infants is to mimic the rate of growth and composition of weight gain for a normal fetus of the same gestational age[29, 30], but the late preterm infants in our study failed to gain at least 15 g/(kg·d), the recommended intrauterine growth rate.
Insufficient enteral feeding during hospitalization following birth potentially places late preterm infants at risk of growth failure after discharge home. Some participating BCMPN hospitals did not allow mothers to accompany their children in hospital, and mothers had no opportunity to practice feeding their own infants before the infants are discharged. Parents often cannot feed late preterm infants as well as the nursing staff can in the hospital setting because of the lack of feeding skills and experience during the first several days after discharge; therefore, these late preterm infants may be at risk of malnutrition during their early postnatal life. This risk is demonstrated in a population-based cohort study of late preterm and term infants in which late preterm infants were found to be at increased risk of being underweight and stunted at 12 and 24 months of age[31]. Furthermore, inadequate nutrition during vulnerable periods of development has been associated with impaired brain development in animal models and with impaired neurocognitive development in human preterm infants[29, 30]. The negative impacts of unsatisfactory nutritional status on long-term neurodevelopment of preterm infants have been widely studied in extremely preterm infants[32]. Given the known relationships among poor early growth, inadequate nutrition during hospitalization after birth, and long-term development of VLBW infants, it may be speculated that similar risks exist for late preterm infants[24]. However, for late preterm infants, data are scarce and warrant further exploration. We intend to follow up this late preterm infant cohort to establish important long-term outcome measurements.
Other than an energy deficiency at discharge, a low human milk feeding rate is a prominent problem for hospitalized late preterm infants in China. The initial rate of exclusive human milk feeding was only 4.5%, and mixed human milk and formula feeding accounts 22.9%. The rate of exclusive breast milk feeding increased to 14.4% at discharge. In the US, the rate of exclusive breast feeding is nearly 40% in late preterm infants[33]. Compared with term infants and extremely preterm infants, for whom the benefits of human milk feeding are well documented, the importance of human milk feeding support for late preterm infants has been ignored[34, 35]. One study in Australia also demonstrated that late preterm infants were less likely to be discharged exclusively breastfed from hospital (OR = 0.4, 95% CI: 0.1-1.0, P = 0.04) compared to infants born at 37 weeks' gestation[36]. In our study, 4.3% of infants born at 34 weeks' GA received exclusive human milk feeding initially, similarly to infants born at 35 and 36 weeks' GA. However, 33.1% of infants born at 34 weeks' GA were fed with mixed human milk and formula, a much higher rate than that in the other two GA groups, and the exclusive human milk feeding rate increased to 21.1% at discharge, which was also much higher than the rate in the other two GA groups. This demonstrates that the doctors knew and accepted the importance of human milk feeding for preterm infants and paid more attention to human milk feeding for infants born at 34 weeks' GA because they were considered less mature than other two GA groups. The importance of human milk feeding for infants at 35 and 36 weeks' GA was also ignored. Although the oro-buccal coordination and swallowing mechanisms are immature in some late preterm infants, and partially explained the low human milk feeding rate, other factors contribute to this problem. The separation of infants from their mothers certainly played an important role in the low human milk feeding rates observed in China[37, 38]. In our study, some hospitals did not accept human milk because of concerns about transmission of infection. Also, some parents could not send human milk every day because of the traffic problems in Beijing. There is much work to do, such as enhancing human milk feeding education, improving the technique of expressing breast milk, and establishing a family-based nursing care environment or kangaroo mother care to promote the human milk feeding rate in late preterm infants[39, 40].
When there is no human milk available, several formulas could be chosen: preterm formula, post-discharge formula, and term formula. It is uncertain which one is more adaptive for late preterm infants. Some clinical research has been carried out about the calorie and protein supply for VLBW infants and ELBW infants, but the nutritional requirements for late preterm infants have not been established. Several questions remain to be answered. Is preterm formula the most substitute for infants when human milk is not available? Are higher calorie and protein contents required for optimal long-term growth and development of late preterm infants? Is term formula an acceptable alternative to preterm formula for some late preterm infants? The current study provides baseline information but does not provide definite answers to these questions. In our study, most late preterm infants (46.1%) received preterm formula, 17.0% of late preterm infants received post-discharge formula, and 8.7% of infants received term formula. More infants born at 34 weeks' GA were fed with preterm formula, while more of those born at 35 weeks' GA received post-discharge formula, and more infants born at 36 weeks' GA were fed with term formula. The energy density supply decreased with the increase in GA. More infants born at 34 weeks' GA were fed with preterm formula because they were considered less mature, and infants born at 36 weeks' GA were considered as nearly term infants to be fed with full-term formula. Studies designed to determine the best way to provide optimal nutrition to late preterm infants, the largest subgroup of preterm infants, are needed. We plan to follow up with these late preterm infants to explore the relationship of early enteral feeding management with long-term outcomes.
The strengths of this study include its multi-center nature and the availability of detailed maternal and infant data during hospitalization. However, variations exist between different care centers enrolled in this study. For example, a small proportion of stable late preterm infants were not admitted to NICU or the neonatal ward after birth and were discharged home with mothers at approximately three postnatal days; therefore, data were not collected on these infants. Another limitation is the lack of data after discharge and long-term outcome of these late preterm infants. The correlation of nutritional support with long-term outcomes should be explored in large population-based studies to guide the best practice for the care of late preterm newborns and optimize subsequent outcomes.
-
According to the data from 25 participating BCMPN hospitals, we found that not enough attention was paid to the enteral feeding support of late preterm infants; many late preterm infants did not achieve full enteral feeding and had failed to regain their birth weight when they were discharged. Only 14.1% of late preterm infants were fed exclusively human milk at the time of discharge. Most late preterm infants received preterm infant formula when there was no human milk available. Our data indicate the need to propose a more aggressive enteral feeding support scheme and make every effort to promote human milk feeding for late preterm infants.
-
QUAN Mei Ying, LI Zheng Hong, WANG Dan Hua, and ZHANG Wei initiated and designed the protocol, participated in the data analysis and interpretation and writing of the manuscript. YANG Li, LIU Jie, QIN Xuan Guang, ZHANG Xin, and HAN Tong Yan participated in the data collection, interpretation and writing of the manuscript. SCHIBLER Kurt participated in writing and proofreading of the manuscript. All the co-authors approved the final manuscript.
-
We would like to thank Dr. LI Ying, Haidian Maternal & Child Health Hospital of Beijing; Dr. FU Xiao Hui, Beijing Shangdi Hospital; Dr. XU Xiao Jing, The First Hospital of TsingHua University; Dr. LONG Hui, Chinese PLA General Hospital; Dr. LIU Zun Jie, Beijing Obstetrics and Gynecology Hospital, Capital Medical University; Dr. YANG Zhao Yi, Navy General Hospital; Dr. GUO Guo, 302 Military Hospital of China; Dr. SUN Fang, China-Japan Friendship Hospital; Dr. MI Rong, Children's Hospital affiliated to Capital Institute of Pediatrics; Dr. CHEN Xu Lin, The 306th Hospital of PLA; Dr. MEI Ya Bo, BAYI Children's Hospital; Dr. YAN Ju, Beijing Hospital; Dr. CUI Hong, Beijing Friendship Hospital, Capital Medical University; Dr. QI Yu Jie, Beijing Children's Hospital, Capital Medical University; Dr. GUO Su Mei, General Hospital of China Aviation; Dr. LIU Gui Ying, Beijing Anzhen Hospital, Capital Medical University; Dr. LIU Hui, People's Hospital of Beijing Daxing District; Dr. SONG Zhi Fang, Peking University Third Hospital Yanqing Hospital; Dr. LIU Yu Huan, Beijing Ditan Hospital, Capital Medical University for their contribution to the research.
the CAMS Initiative for Innovative Medicine 2016-12M-1-008
Science and Technology Project of Beijing Health and Family Planning Commission 2016001

 Quick Links
 DownLoad: