HTML
-
Cleft lip and/or palate (CLP) is one of the most common human craniofacial congenital anomalies. The worldwide incidence of CLP is approximately 1/500-1/2, 500[1], varying by race, region, country, and socioeconomic level. CLP affects suckling, swallowing, and the development of language and hearing of the children, and even results in psychological problems, which directly impact quality of life. The anomaly also increases the mental and financial burdens on the individuals and their families. Thus, the prevention, diagnosis, and treatment of CLP is an important public health and social issue around the world[2].
CLP can be categorized into syndromic CLP (SCLP) and non-syndromic CLP (NSCLP), according to whether affected individuals have other apparent cognitive or structural abnormalities. SCLP often is caused by single gene mutations, chromosomal abnormalities, or teratogenic exposure. However, the etiology and pathogenesis of NSCLP are complex, being caused by multiple genes and environmental factors[3]. The formation of NSCLP may be related to chromosomal abnormalities and mutations in several genes[4-6]. Even after many years of investigation, controversy remains over the susceptibility genes of NSCLP, and further clarification is required.
In our previous study using whole-exome sequencing, we found that the de-ubiquitinating enzyme (DUB) YOD1 is a candidate susceptibility gene of NSCLP[7]. However, the biological mechanism of YOD1 and the associations of YOD1 variants with NSCLP remain unclear. YOD1, also known as OTUD2, encodes a protein that belongs to the ovarian tumor (OUT) family of DUBs[8]. DUBs can reverse ubiquitination by removing ubiquitin or ubiquitin chains from target proteins to regulate processes such as transforming growth factor-β (TGF-β) signaling[9]. UCH37, a member of the UCH enzyme subfamily, is the first identified DUB active in the control of TGF-β signaling[10]. USP4 is a DUB interacting directly with TGF-β type Ⅰ receptor, thereby controlling receptor levels at the plasma membrane[11]. OTUB1, another member of the OUT family, enhances TGF-β signaling by inhibiting the ubiquitination and degradation of active Smad2/3[12]. These data provide new insights into the molecular mechanisms underlying interactions between DUBs and TGF-β signaling. We speculate that YOD1 may potentially reverse ubiquitination and play an important role in regulating TGF-β signaling.
Studies have shown that the TGF-β family, especially TGF-β3, is one of the strongest candidate genes for involvement in NSCLP in humans[4]. The signaling pathway triggered by TGF-β controls cell proliferation and migration which are important in the normal fusion of the palate[13]. Anomalies in cell proliferation and migration are closely related to the occurrence of NSCLP[14]. This implicates TGF-β signaling in the development of CLP[15, 16]. Here, we hypothesize that the abnormal TGF-β signaling regulated by YOD1 could affect cell migration, which may contribute to NSCLP.
In this study, we show that YOD1 overexpression enhances the migration of human oral keratinocytes (HOKs). We further demonstrate that the TGF-β signaling pathway is up-regulated by YOD1 overexpression. Our study reveals a novel role of YOD1 in promoting the TGF-β signaling pathway, which may be involved in the pathogenesis of NSCLP.
-
The CDS region (1, 047 bp) of the YOD1 gene (NM.018566.3) was inserted into the pEGFP-N3 plasmid to construct the YOD1 overexpression plasmid pEGFP-N3-YOD1, which was constructed by Applied Biological Materials, Inc., (Richmond, BC, Canada). pEGFP-N3 was used as a negative control.
-
HOKs were purchased from the Institute of Biochemistry and Cell Biology, Chinese Academy of Sciences (Shanghai, China). The cells were cultured in RPMI 1640 medium (Life Technologies, Carlsbad, CA, USA) containing 15% fetal bovine serum (FBS) (Life Technologies), and incubated in a humidified incubator at 37 ℃ and 5% CO2. Cells were plated in quadruplicate into a six-well plate (Corning, Corning, NY, USA) at a density of 3.5 × 10⁵ cells/well 24 h prior to transfection to ensure that the cells reached 70% to 90% confluence at transfection. Each experiment consisted of four groups: In the YOD1 group, the cells were transfected with pEGFP-N3-YOD1; in the negative control group, the cells were transfected with pEGFP-N3; in the Lipo2000 group, the cells were transfected with Lipofectamine 2000 (Invitrogen, Carlsbad, CA, USA) without the plasmid; and in the blank control group, the cells were un-transfected. All transfections were performed in triplicate for each time point. After transfection for 48 h, cells were harvested and subjected to the next steps.
-
Total RNA was extracted from HOKs using TRIzol reagent (Invitrogen), according to the manufacturer's protocols. cDNA was synthesized from 500 ng total RNA using a PrimeScript RT Reagent Kit (TaKaRa, Japan). qPCR was performed using SYBR Green qPCR master mix (TaKaRa Bio Inc., Shiga, Japan) on an ABI 7500 qPCR system (Applied Biosystems, Foster City, CA, USA). Primer sequences for qPCR were as follows. The oligonucleotide primers were designed by GenScript qPCR (TaqMan) Primer Design (GenScript, Piscataway, NJ, USA) (Table 1). The qPCR was carried out according to the following procedures: holding stage, 1 cycle at 95 ℃ for 30 s; cycling stage, 40 cycles at 95 ℃ for 5 s, and 60 ℃ for 34 s; melt curve stage, 1 cycle at 95 ℃ for 15 s, 60 ℃ for 1 min, and 95 ℃ for 15 s. The data were analyzed using the 2-ΔΔCTmethod with GAPDH mRNA for standardization.
Gene Sequences (5'-3') YOD1 F: CTTCCCTGATCCAGATACACCTCCT R: TCCCTTGCTTCTGCTTGTCCAGTT TGF-β1 F: GACAGCAGGGATAACACACT R: ATGAGAAGCAGGAAAGGC TGF-β2 F: TGGAAATGGATACACGAACC R: ACGCAGCAAGGAGAAGCA TGF-β3 F: CCTCTACATTGACTTCCGACA R: GGCAGATGCTTCAGGGTTC GAPDH F: AAGAAGGTGGTGAAGCAGG R: GTCAAAGGTGGAGGAGTGG Table 1. Designed PCR Primers
-
HOKs were homogenized in RIPA lysis buffer with protease inhibitors (Beyotime Institute of Biotechnology, Jiangsu, China) and phosphatase inhibitors (Nanjing KeyGEN Biotech. Co. Ltd., Nanjing, China) for extraction of total cellular protein. The protein content was measured using a BCA protein assay kit (Beyotime Institute of Biotechnology). Samples containing 60 μg of proteins were separated by 10% sodium dodecyl sulfate-polyacrylamide electrophoresis and transferred to polyvinylidene difluoride membranes. The membranes were blocked with 5% milk or BSA for 1.5 h at room temperature, then incubated with the primary antibody (1:1, 000) at 4 ℃ overnight. The primary antibodies used were: YOD1 polyclonal antibody (Proteintech, Rosemont, IL, USA), TGF-β1 polyclonal antibody (Proteintech), TGF-β2 polyclonal antibody (Bioworld Technology, St Louis Park, MN, USA), TGF-β3 polyclonal antibody (Proteintech), Smad2/3 antibody, p-Smad2/3 antibody, Smad4 antibody and β-tubulin antibody (all from Cell Signaling Technology, Danvers, MA, USA). After washing three times with TBST, the membranes were incubated with the secondary antibody (1:1, 000). The protein expression level of β-tubulin was used as a control. Image J software was used for quantitative analysis of western blots.
-
Each group of HOKs in the logarithmic growth phase was collected and plated into a 96-well culture plate (4 × 10⁴/well), six duplicate wells for each group, conventionally cultured at 37 ℃ with 5% CO2. A total of 10 μL CCK-8 reagent (Dojindo Laboratories, Kumamoto, Japan) was added into each well after 0, 24, 48, 72, and 96 h. After a 2 h incubation at each time point, the optical density (OD) value was measured at a wavelength of 450 nm using an Epoch™ microplate spectrophotometer (BioTek, Winooski, VT, USA), and a blank well was set as zero[17]. The results were used to draw cell growth curves.
-
HOKs were collected and plated into 12-well plates (5 × 10⁵/well). A sterile 200 μL pipette tip was used to create a straight scratch through the cell monolayer when the cells reached confluence. Phosphate buffered saline was used to wash the cell layer three times. The width between the borders of each scratch was observed under an inverted microscope equipped with a digital camera (magnification: 10 × 10, Olympus Corporation, Tokyo, Japan) and images were captured in each group at 0 and at 24 h. The wound area was then measured using Image J (NIH, Bethesda, MD, USA). The rate of migration = [wound area (0 h)-wound area (24 h)/ wound area (0 h)].
-
Statistical analysis was performed with SPSS 16.0 statistical software (SPSS, Inc., Chicago, IL, USA). Quantitative data are presented as x±s. Multiple comparisons were made using one-way analysis of variance (ANOVA) and Dunnett's t-test was applied for multiple comparisons with the control. The dependent variable was overexpression of YOD1 in HOK cells. The independent variables included the mRNA and protein levels of the biomolecules involved in TGF-β3 signaling, cell proliferation, and migration. The experiments above were repeated at least in triplicate. The level of significance was set at P ≤ 0.05.
Plasmid Construction
Cell Culture and Transfection
Reverse Transcription and qPCR
Western Blotting
Cell Counting Kit-8 (CCK-8) Assay
Wound Healing Assay
Statistical Analysis
-
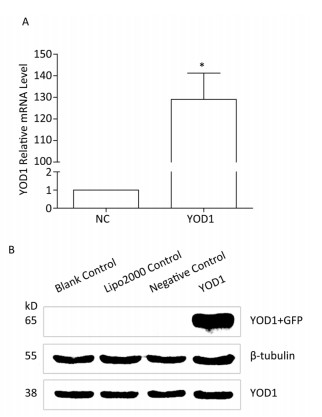
qPCR and western blotting were used to analyze the mRNA and protein expression, respectively, of YOD1 in the HOKs in each group after transfection. Both mRNA and protein expression levels of YOD1 were markedly higher in the YOD1 group compared with the negative control group (Figure 1).
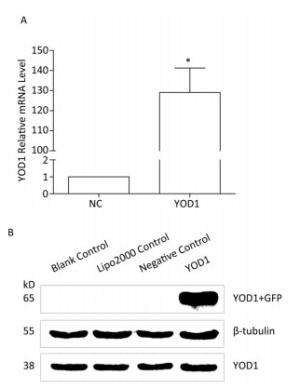
Figure 1. Overexpression of YOD1 in HOK cells. HOK cells were transfected with pEGFP-N3-YOD1 or pEGFP-N3. After 48 h, total mRNA and protein was extracted from each group. (A) qPCR showed that the mRNA expression of YOD1 in HOK cells transfected with pEGFP-N3-YOD1 was increased compared with cells transfected with pEGFP-N3. Data are shown as x±s of three replicate experiments from each group. *P < 0.05 compared with negative control. (B) Western blotting showed that only HOK cells transfected with pEGFP-N3-YOD1 had a band at 65 kD, while the other groups had no bands. These results showed that YOD1 was successfully overexpressed in HOK cells after transfection with pEGFP-N3-YOD1.
-
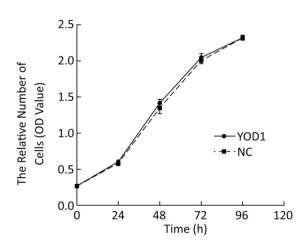
To investigate the effect of YOD1 overexpression on HOK proliferation, the CCK-8 assay was performed after transfection for 48 h. There were no significant differences in the proliferation of HOKs between the YOD1 group and the negative control group at any time point (Figure 2). The results showed that YOD1 overexpression failed to alter the proliferation rate of HOKs.
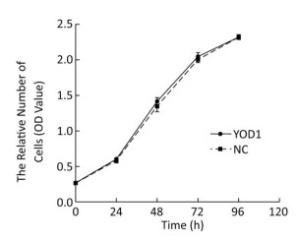
Figure 2. Effects of YOD1 overexpression on proliferation of HOK cells. After transfection for 48 h, the cell proliferation rate was assessed using the CCK-8 assay. Results showed that there was no significant change in the cell proliferation rate between the YOD1 group and the negative control group at any time point. This suggested that YOD1 overexpression had no obvious effect on cell proliferation. The optical density (OD) was expressed as x±s of six replicates for each group.
-
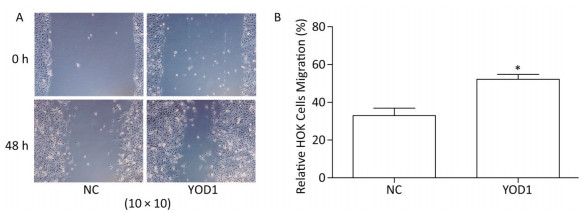
The wound healing assay was used to investigate migration of HOKs after transfection for 48 h. The migration area of HOKs was significantly increased in the YOD1 group compared with the negative control group (Figure 3). The results showed that YOD1 overexpression enhanced the migration of HOKs.
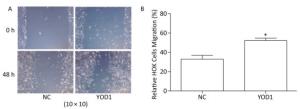
Figure 3. Effects of YOD1 overexpression on migration of HOK cells. (A) After transfection for 48 h, cell migration ability was detected by the wound healing assay. (B) The results showed that the relative mobility of cells in the YOD1 group was significantly higher than that in the negative control group. The results suggested that overexpression of YOD1 promotes cell migration. Data are expressed as x±s of three replicates for each group. *P < 0.05 compared with negative control.
-
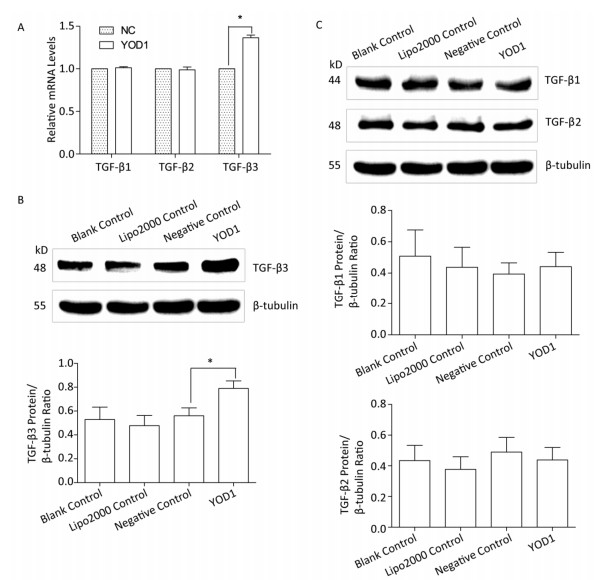
The TGF-β superfamily, including TGF-β1, TGF-β2, and TGF-β3, can transmit signals via cell surface receptors and intracellular Smad transcription factors[18]. To identify which members of the TGF-β family are affected by YOD1 overexpression, qPCR and western blotting, respectively, were performed to analyze the mRNA and protein expression levels of TGF-β1, TGF-β2, and TGF-β3 in HOKs after transfection. The mRNA and protein levels of TGF-β3 were increased compared with the negative control group. However, there were no significant differences in TGF-β1 or TGF-β2 expression levels (Figure 4). These results indicated that YOD1 overexpression enhances expression of TGF-β3.
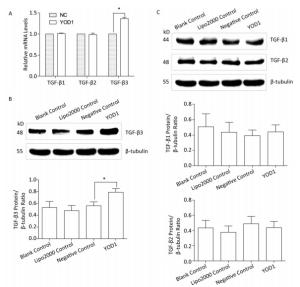
Figure 4. Effects of YOD1 overexpression on TGF-β cytokines. After transfection for 48 h, qPCR and Western blotting were used to analyze the mRNA and protein levels, respectively, of TGF-β1, TGF-β2, and TGF-β3. (A) qPCR showed that the mRNA expression of TGF-β3 was significantly increased compared with the negative control group, while the mRNA expression of TGF-β1 and TGF-β2 did not change. (B) Western blotting showed that protein expression of TGF-β3 was visibly elevated relative to the negative control group. (C) However the protein expression of TGF-β1 and TGF-β2 did not change. Data are shown as x±s of three replicate experiments from each group. *P < 0.05 compared with negative control.
-
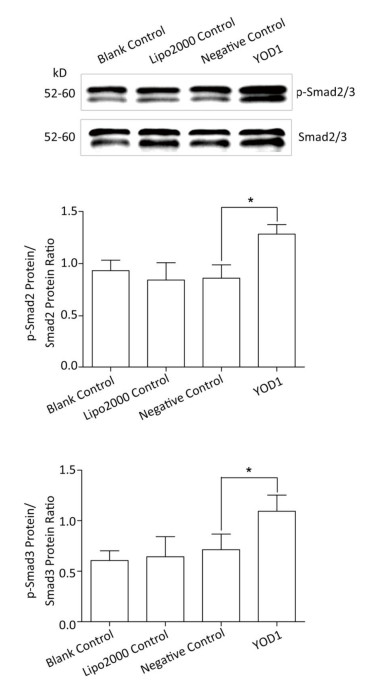
Smad family members are essential intracellular signaling components of the TGF-β superfamily. TGF-β primarily signals through the phosphorylation of Smad2/3. Phospho-Smad2/3 interacts with Smad4 and translocates to the nucleus to regulate the transcription of target genes[18, 19]. In order to verify whether YOD1 affected Smads, the protein levels of Smad2/3, Smad4, and phospho-Smad2/3 were quantified. The protein levels of phospho-Smad2/3 were elevated by YOD1 overexpression, while the protein levels of Smad2/3 and Smad4 did not change significantly in the YOD1 group (Figure 5). These results indicated that overexpression of YOD1 promotes the phosphorylation of Smad2/3.
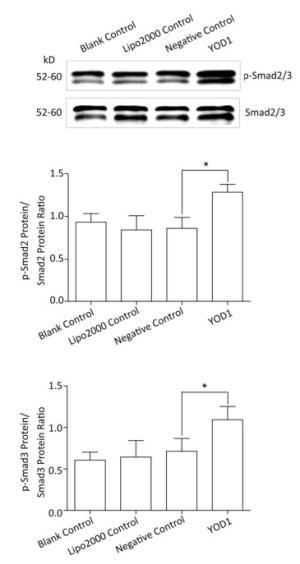
Figure 5. Effects of YOD1 overexpression on Smads. After transfection for 48 h, the protein levels of Smad2/3 were detected by Western blotting, and phospho-Smad2/3 levels were also analyzed. Western blotting showed that the amounts of phospho-Smad2/3 were significantly increased after YOD1 overexpression, compared with the control group. Data are shown as x±s of three replicate experiments from each group. *P < 0.05 compared with negative control.
YOD1 Overexpression in HOKs
Effect of YOD1 Overexpression on Cell Proliferation
Effect of YOD1 Overexpression on Cell Migration
Effect of YOD1 Overexpression on Expression of TGF-β
Effect of YOD1 Overexpression on Smads
-
In this study, we have shown that YOD1 overexpression in HOKs after transfection with pEGFP-N3-YOD1 enhanced migration of HOKs. The mRNA and protein levels of TGF-β3 were increased by overexpression of YOD1. YOD1 overexpression also increased the amount of phospho-Smad2/3. These data shed light onto the molecular mechanisms of migration of HOKs involving the regulation of TGF-β3 by YOD1. We propose that the impacts of YOD1 on TGF-β3 signaling induce migration of HOKs resulting in lip and palate formation. In our previous study, we found that YOD1 is a susceptibility gene for NSCLP[7]. Therefore, mutation of YOD1 could suppress TGF-β3 signaling leading to decreased cell migration and resulting in NSCLP. We suggest that YOD1 mutation may play an important role in the pathogenesis of NSCLP.
The present study has demonstrated that overexpression of YOD1 increases the migration of HOKs. The developmental process of the lip and palate is complex, including the development and migration of neuroblasts, formation of the pharyngeal arch, and the fusion of facial bones[20]. Our data show that YOD1 is associated with cell migration, which may contribute to normal lip fusion and palate fusion. Therefore, YOD1 plays a role that could not be ignored in normal formation of the intact lip and palate, and that YOD1 mutation may prevent cell migration, thus contributing to failure of lip and palate development. However, the mechanisms underlying YOD1 overexpressionmediated cell migration remain to be clarified.
Cell proliferation is also important for craniofacial development. We investigated the effect of YOD1 on the proliferation of HOKs, and found that YOD1 overexpression had no effect. However, another study showed that YOD1 overexpression inhibited the proliferation of cervical cancer cells[21]. This inconsistent effect of YOD1 on cell proliferation across studies may be due to inherent differences in the nature of the cell types. Therefore, further experiments to test the effect of YOD1 on the proliferation of different cell lines are needed.
The regulatory mechanism of NSCLP is still unclear. Evidence suggests that various signaling pathways regulated by molecules such as TGF-β, play an important role in the developmental process of the palate[22, 23]. Any disturbance in these molecules may cause developmental disorders in lip and palate formation, leading to NSCLP. The TGF-β superfamily, including TGF-β1, TGF-β2, and TGF-β3 in mammals, plays an important role in regulating cell growth, migration, and differentiation. It has been confirmed that TGF-β3 has a moderate relationship with cleft palate[24]. In our study, we found that both TGF-β3 mRNA and protein were elevated after YOD1 overexpression. TGF-β3 may therefore be involved in cell migration related to the process of palatal fusion. Therefore, our results suggest that the increased TGF-β3 expression induced by YOD1 overexpression may contribute to development of the lip and palate. Abnormal expression of TGF-β3 mRNA and protein may result in inhibition of TGF-β3 signaling leading to NSCLP. It is reported that CLP occurs in TGF-β3 knockout mice[25]. In addition, population studies have shown that gene mutation is closely related to NSCLP[15, 26, 27]. Our data provide evidence that YOD1 expression level positively correlated with TGF-β3 expression which also correlated with cell migration. This study highlights the role of TGF-β3 in supporting the involvement of decreased expression of TGF-β3 caused by YOD1 mutation in the development of NSCLP.
TGF-β3 signaling regulates gene transcription through a signaling cascade from cell surface receptors to intracellular Smads. Smad proteins are the intracellular transducers of TGF-β signaling and the TGF-β3 pathway signals through Smad2 and 3. Activated type Ⅰ receptors phosphorylate Smad2 and 3 to induce them to form a complex with Smad4 leading to nuclear translocation[28]. In our study, we found that YOD1 overexpression increased the amount of phospho-Smad2/3. Our findings are consistent with the effect of another de-ubiquitinating enzyme, OTUB1, which enhances the TGF-β signaling pathway by inhibiting the ubiquitination and degradation of active Smad2/3[12]. Phospho-Smad2/3 accumulate in the nucleus, where they are directly involved in the regulation of transcription of target genes. Phospho-Smad2/3 are required for proper TGF-β signal transduction. Together, these results imply that increased phospho-Smad2/3 levels induced by YOD1 are essential for up-regulation of TGF-β3 signaling. These results provide information on YOD1-responsive TGF-β3 expression in cell migration of HOKs.
Ubiquitination leading to proteosomal degradation is a well-established mechanism for regulating TGF-β3 signaling components such as TGF-β3 and Smads[29, 30]. In our study, we showed that YOD1 overexpression increased the protein expression of TGF-β3 and phospho-Smad2/3. The results indicated that TGF-β3 signaling is enhanced by YOD1. As a de-ubiquitinating enzyme, YOD1 may interact with TGF-β3 and phospho-Smad2/3, and oppose ubiquitin-mediated degradation to enhance TGF-β3 signaling transcriptional responses. YOD1 may regulate the development of the lip and palate by acting on TGF-β3 signaling via de-ubiquitination. The aberrant TGF-β3 signaling contributes to developmental defects of the palate which lead to NSCLP. However, the effects of YOD1 on ubiquitination of TGF-β and its effects on signaling need to be further investigated.
Our study has some limitations. First, the effects of YOD1 on migration of HOKs and TGF-β3 signaling were modest. Second, our study did not reveal whether YOD1 directly affects NSCLP. Further genetic perturbations are needed to address the roles of YOD1 in NSCLP. Last, but not least, a major limitation of the study is the use of oral keratinocytes. It would have been appropriate to use mouse embryonic palatal mesenchymal (MEPM) cells to conduct the study. We may reconsider MEPM cells as the cell system of choice for further exploration in our future research.
-
Our current study has demonstrated that overexpression of YOD1 enhances the migration of HOKs. We have identified that YOD1 is involved in cell migration by regulating TGF-β3 signaling which is important for the development of the palate. Ultimately, we hope that our study can contribute to understanding of the mechanism of NSCLP.
-
JU Qiang was the principal investigator, who drafted the manuscript; LI Meng Xue was responsible for biocytoculture; CHEN Gang took the responsibility for transfection; WANG Heng Xue participated in extracting total RNA; SHI Qiao Mei performed qPCR; GE Xing extracted proteins and performed western blotting experiments; DING Zhen conducted CCK-8 experiments of and performed wound healing assays; WANG Qi collated and analyzed the experimental data; and XU Li Chun provided spelling and grammatical guidance and polished the entire article.
National Natural Science Foundations of China 81273103







 Quick Links
 DownLoad:
