


HTML
-
Coronary heart disease (CHD) is a complex disease with a pathogenesis caused by multiple environmental and genetic risk factors[1, 2]. Genetic factors play an important role in the occurrence and development of CHD[3, 4], especially among patients with premature CHD (PCHD)[5, 6]. While CHD generally occurs at an older age (usually after 55 years), PCHD occurs at an earlier age; as such, PCHD can obviously influence a patient's quality of life and lead to premature death. The disease may cause mental and financial stress to patients and their families[7], especially those with severe coronary artery diseases, such as triple-vessel disease (TVD)[8]. Therefore, early detection of risk for premature TVD (PTVD) on the basis of genetic factors can promote the implementation of preventive strategies to improve cardiovascular outcomes.
Both genome-wide association studies and candidate gene studies have reported that the cyclin-dependent kinase inhibitor 2B antisense RNA 1 (CDKN2B-AS1) gene is associated with increased risk for CHD[9-11]. The CDKN2B-AS1 gene is clustered at chromosome 9p21 and located near the CDKN2A-CDKN2B gene. Its product is a functional RNA molecule that leads to epigenetic silencing of other genes in this cluster. Gene polymorphisms at this region are often regarded as loci with significant genetic susceptibility for cardiovascular disease, the definite allelic carrying conditions and sex specificity of polymorphisms of CDKN2B-AS1 remain unclear[12, 13], especially among patients with severe PCHD. Therefore, we performed a case-control study to investigate the associations between single-nucleotide polymorphisms (SNPs) of CDKN2B-AS1 and the risk for PTVD in the Chinese population.
-
PTVD patients of the 'Long-term Outcome of Triple-vessel Coronary Artery Disease Undergoing Three Different Strategies' study (ClinicalTrials.gov ID: NCT02634086) were consecutively enrolled from April 2004 to February 2011 in Fuwai Hospital (Beijing, China). TVD was defined as angiographic stenosis of ≥ 50% in all three main coronary arteries, including the left anterior descending, left circumflex, and right coronary arteries. No predetermined exclusion criteria were specified. PTVD was defined as TVD in men ≤ 50 years and in women ≤ 60 years[6]. Subjects of the control group were age-matched with PTVD patients and defined as normal coronary arteries (no luminal stenosis in coronary angiography or coronary CT scan images). Baseline data were collected from all PTVD patients and control subjects. This study complied with the guidelines of the Declaration of Helsinki, and the ethics committee of Fuwai Hospital approved of the research protocol.
-
Peripheral venous blood was collected, and genomic DNA was extracted from leukocytes via the standard salting-out method[14]. Five SNPs (rs1063192, rs2285327, rs3217986, rs3217992, and rs4977574) of the CDKN2B-AS1 gene were obtained from the HapMap project (http://hapmap.ncbi.nlm.nih.gov/) of the Chinese Han in Beijing with a minor allele frequency (MAF) ≥ 0.05; the data obtained were the latest provided (release #28). Four other SNPs (rs10757274, rs1333042, rs1333049, and rs9632884) were selected from previous literature reports[4, 15]. Among the nine SNPs included in this work, two (rs3217986, rs3217992) were located in the 3 kb upstream sequence of the transcription start site of the CDKN2B-AS1 gene; the seven other SNPs (rs1063192, rs10757274, rs1333042, rs1333049, rs2285327, rs4977574, and rs9632884) were located in the intron area. The improved multiplex ligase detection reaction method was used to genotype all SNPs, and alleles for each SNP were distinguished by different fluorescent labels of allele-specific oligonucleotide probe pairs. Different SNPs were further distinguished by different extended lengths at the 3' end[16].
-
For baseline data, continuous variables were compared by t test as appropriate, and categorical variables were analyzed using Pearson's chi-squared test. Continuous variables are presented as mean ± standard deviation, and categorical variables are presented as number with frequency. The allele-carrying status of the CDKN2B-AS1 gene between the two groups was analyzed by the chi-squared test; the same test was applied to analyze the genotype distribution of each target SNP for deviations from the Hardy-Weinberg equilibrium (HWE) (P > 0.05). The association between target SNPs and the risk for PTVD was evaluated by logistic multivariate regression analysis, and the results are expressed as odds ratios (OR) with corresponding 95% confidence intervals (CI). All statistically significant covariates and positive SNPs were entered into the model with adjustments for multivariate analysis. To reduce Type Ⅰ errors, Bonferroni correction was applied for multiple testing. All statistical analyses were performed by applying two-sided tests at a significance level of 0.05 using SPSS version 19.0 software (IBM Corporation, Armonk, New York, USA).
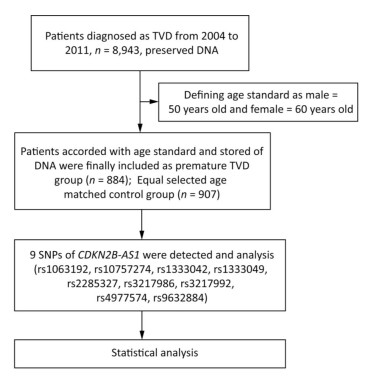
The flow chat of the study was shown in Figure 1.

Figure 1. Flow chat.
Patient Selection
DNA Extraction and SNP Detection
Statistical Analysis
-
A total of 884 PTVD patients and 907 control subjects were enrolled in this study. PTVD patients tended to be male and had a higher incidence of traditional risk factors, such as hypertension, hyperlipidemia, diabetes mellitus, and smoking history, than the control group (P < 0.001). Levels of blood lipids and blood glucose also significantly differed between the two groups (Table 1).
Characteristics PTVD Group
n = 884Control Group
n = 907P Value Age, year 47.7 ± 6.1 46.9 ± 10.1 0.087 Female (%) 240 (27.2) 303 (33.4) < 0.001 BMI, kg/m2 26.5 ± 3.4 25.2 ± 3.4 < 0.001 Hypertension (%) 545 (61.7) 235 (26.0) < 0.001 Hyperlipidemia (%) 534 (60.4) 118 (13.0) < 0.001 Diabetes mellitus (%) 312 (35.4) 65 (7.2) < 0.001 Bleeding (%) 11 (1.2) 0 (0) 0.105 Smoke (%) 488 (55.2) 305 (33.7) < 0.001 WBC, 109/L 7.2 ± 2.3 6.1 ± 1.5 < 0.001 RBC, 1012/L 4.8 ± 0.4 4.9 ± 0.4 0.818 Hemoglobin, g/L 140.0 ± 16.1 146.9 ± 15.6 < 0.001 Platelet, 109/L 215.4 ± 61.2 186.7 ± 54.0 < 0.001 Creatinine, μmol/L 77.3 ± 17.1 73.2 ± 15.3 < 0.001 TG, mmol/L 2.0 ± 1.2 1.7 ± 1.2 < 0.001 TC, mmol/L 4.8 ± 1.2 4.7 ± 1.0 0.089 HDL-C, mmol/L 1.0 ± 0.3 1.2 ± 0.3 < 0.001 LDL-C, mmol/L 2.7 ± 1.2 2.9 ± 0.9 0.012 Blood glucose, mmol/L 6.4 ± 3.3 5.7 ± 1.1 < 0.001 Note. PTVD = premature triple-vessel disease; BMI = body mass index; WBC = white blood cells; RBC = red blood cells; TG = triglycerides; TC = total cholesterol; HDL-C = high density lipoprotein cholesterol; LDL-C = low density lipoprotein cholesterol; Data are expressed as mean ± standard deviation or count (percentage). Table 1. Baseline Data of the PTVD and Control Groups
-
Basic information on the nine SNPs of CDKN2B-AS1, including loci location, allele frequency, HWE test results, and analytical model, are shown in Table 2. All SNPs in both groups demonstrated HWE (P > 0.05). Differences in the frequency distributions of alleles between the PTVD patients and controls were conducted using chi-squared tests, and the allele frequencies of seven tag SNPs were higher in the PTVD group than in the control group (rs1063192 A, P < 0.001; rs10757274 G, P < 0.001; rs1333042 G, P < 0.001; rs1333049 C, P < 0.001; rs3217986 G, P = 0.040; rs4977574 G, P < 0.001; rs9632884 C, P < 0.001). After analyzing differences between genders, the frequencies of several alleles were found to significantly differ between males and females; these alleles included rs1063192 [dominant model: AA/GG+GA, male: 455 (70.7%)/188 (29.3%) vs. 353 (58.4%)/251 (41.6%), P < 0.001; female: 160 (66.4%)/81 (33.6%) vs. 176 (58.1%)/127 (41.9%), P = 0.123] and rs3217986 [dominant model: TT/GG+GT, male: 511 (79.5%)/132 (20.5%) vs. 534 (88.4%)/70 (11.6%), P = 0.001; female: 203 (84.2%)/38 (15.8%) vs. 253 (83.5%)/50 (16.5%), P = 0.838], as shown in Table 3.

Table 2. Comparison of SNPs of CDKN2B-AS1 between the PTVD and Control Groups

Table 3. Allele-carrying Status of CDKN2B-AS1 between Males and Females of the PTVD and Control Groups
We further assessed the association between SNPs that were significantly different between the two groups and PTVD risk using logistic regression analysis. The results of analyses under the dominant and recessive genetic models are presented in Tables 4 and 5, respectively. We determined that homozygote AA of rs1333042 is associated with decreased risk for PTVD (dominant model, OR = 0.42, 95% CI: 0.22-0.82, P = 0.011) and that the G allele of rs3217986 is associated with increased risk for PTVD in male patients (dominant model, OR = 2.94, 95% CI: 1.27-6.80, P = 0.012). Regardless of the model applied, no positively mutated allele was found in female PTVD patients (Tables 4 and 5). Logistic regression analysis also revealed that traditional risk factors, such as hypertension, hyperlipidemia, diabetes mellitus, smoking history, and high levels of blood lipids, were associated with increased risk for PTVD in both male and female PTVD patients (Tables 4 and 5).

Table 4. Logistic Regression Analysis under the Dominant Model of PTVD

Table 5. Logistic Regression Analysis under the Recessive Model of PTVD
Baseline Characteristics
Gene Polymorphism Analysis
-
The CDKN2B-AS1 gene, which is located in chromosome 9 (9p21), was identified as a risk factor for CHD in 2007[17]. However, the polymorphisms of CDKN2B-AS1 in patients with PCHD are not very clear, especially among patients with PTVD. To the best of our knowledge, this study is the first to report the association of CDKN2B-AS1 gene polymorphisms with PTVD. In this study, we found that: (1) the allele-carrying frequencies of seven tag SNPs of the CDKN2B-AS1 gene significantly differed between the PTVD patients and control subjects; (2) homozygote AA of rs1333042 was associated with decreased risk for PTVD; (3) allele-carrying conditions differed between genders; in particular, the G allele of rs3217986 was associated with increased risk for PTVD only in male patients; and (4) the proportion of traditional risk factors was significantly higher in PTVD patients than in the control group.
The function of CDKN2BAS is yet unknown. Some studies suggest that the product of this gene is a functional RNA molecule that interacts with polycomb repressive complex-1 (PRC1) and -2 (PRC2), leading to epigenetic silencing of other genes[18]. Polymorphisms at the 9p21 region may induce higher expression of the CDKN2B-AS1 transcript, thereby inhibiting the expression of CDKN2A and CDKN2B. Previous studies have demonstrated that CDKN2BAS transcript levels show a strong correlation with the severity of atherosclerosis. The SNP loci rs564398, rs4977574, rs2891168, and rs1333042 are considered to be related to increased risk for CHD[9]. Our study involved patients with PTVD, and significantly different frequencies of some alleles of the CDKN2B-AS1 gene were observed between the PTVD patients and control subjects. These results are consistent with previous studies involving different races[11, 19] and suggest that CDKN2B-AS1 gene mutations are indeed associated with increased risk for CHD, especially in patients with severe coronary artery disease.
While homozygote AA of rs1333042 has been considered to be associated with decreased risk for CHD[11], the GG genotype has been associated with increased risk for CHD in previous studies[20, 21]; these findings were confirmed in the present study. Logistic regression analysis showed that homozygote AA of rs1333042 is an independent protective factor in PTVD patients. This result enriches the current research on this allele.
We analyzed the allele-carrying status of CDKN2B-AS1 between genders and found differences in allele frequencies, especially those of rs1063192 and rs3127986, between males and females. rs3217986 was confirmed to be an independently associated SNP for MI (P = 0.04) by Helgeland et al.[22]. However, this study did not analyze allele frequencies between males and females. Logistic regression analysis showed that the G allele of rs3217986 was an independent risk factor for PTVD in male patients, but no allele was found to be associated with increased or decreased risks for PTVD in female patients. Previous studies have suggested that gender differences could affect the expression of some genes and, in turn, influence disease progression[23, 24]. However, the specific mechanism of this phenomenon is not very clear in PCHD. In the present study, we only carried out a preliminary analysis of allele frequencies between genders; the pathogenesis of CHD at the molecular and protein levels was not elucidated. More work on this topic may be undertaken in future research.
The traditional risk factors of CHD, such as hypertension, hyperlipidemia, diabetes mellitus, and smoking, play an important role in the pathogenesis of PTVD[25]. In the current study, we found that early-onset CHD is significantly associated with traditional risk factors, which suggests that control of these risk factors is especially important among patients with PCHD.
-
In this study, several limitations must be taken into consideration. First, the participants were limited to the Chinese population, and the sample size was relatively small. Large-scale research is necessary to verify our findings. Second, some differences in basic clinical characteristics between patients and control subjects were noted. Despite applying adjustments for these confounders during our statistical analyses, we cannot completely avoid the potential influences of these differences on the results. Finally, the molecular biological mechanisms of gene polymorphisms of CDKN2B-AS1 were not investigated in this study, and the epigenetics of the CDKN2B-AS1 gene remains unclear.
-
Polymorphisms of the CDKN2B-AS1 gene were associated with the incidence of PTVD in the Chinese population, and homozygote AA of rs1333042 was associated with decreased risk for PTVD. In addition, allele frequencies differed between genders. Therefore, the SNPs of CDKN2B-AS1 could have clinical importance as pre-diagnostic markers for PTVD. Future studies are needed to determine the function and value of these SNPs.
-
We thank all individuals participating in this study for their contribution to data collection, patient selection, and quality control.
-
XU Jing Jing, article design and composition; JIANG Lin, data acquisition; XU Lian Jun, research design and data acquisition; GAO Zhan, research design; ZHAO Xue Yan, research ideas; ZHANG Yin, research design and data acquisition; SONG Ying, research design; LIU Ru, data acquisition; SUN Kai, statistical analysis; GAO Run Lin, research design and planning; XU Bo, data guidance; SONG Lei, research design and overall guidance; and YUAN Jin Qing, research design and overall guidance.
National High Technology Research and Development Program of China 2015AA020407
National Natural Science Foundation of China 81470380
funding from the CAMS Innovation Fund for Medical Sciences (CIFMS) 2016-I2M-1-002
National Basic Research Program of China 2010CB732601

 Quick Links
 DownLoad: