


HTML
-
Cardiovascular disease (CVD) is a major cause of death and disability, accounting for 17 million deaths annually worldwide[1]. Atherosclerosis is an asymptomatic process that begins early in life and eventually leads to clinically overt CVD, with the age of onset determined by genetics, environment, and associated interactive factors. Therefore, early detection of subclinical atherosclerosis using noninvasive diagnostic modalities is important for an early intervention to reduce or retard clinical CVD event onset or progression.
Coronary computed tomography (CT) angiography is a widely used noninvasive tool for the evaluation of coronary atherosclerosis. Coronary stenosis and coronary plaques can be detected at different segments of the coronary arteries using coronary CT angiography[2]. Atherosclerotic plaque consists of a variety of amorphous materials, including fibrous debris, cholesterol, and matrix materials such as calcium[3]. According to the extent of coronary artery calcium deposition, coronary atherosclerotic plaques can be divided into noncalcified plaques, calcified plaques, and mixed plaques.
Although the presence of coronary plaques is an established risk predictor of CVD development, studies suggest that the types of coronary plaques might be more important in the prediction of CVD events. There are conflicting findings with regard to which plaque type predisposes patients to greater cardiovascular risks, although emerging data have suggested that a mixed or calcified plaque might be more likely to be associated with an elevated risk of adverse outcomes[4, 5].
Therefore, we conducted a cross-sectional analysis of associations between coronary plaque types determined by coronary CT angiography and the likelihood of having CVD evaluated by risk assessment tools such as the Framingham risk score (FRS) and the 10-year atherosclerotic cardiovascular disease (ASCVD) risk score in a community cohort of middle-aged Chinese adults without previous history of CVD or clinical symptoms of myocardial ischemia.
-
The study population, design, and protocol have been described previously[6-7]. Briefly, all permanent residents aged 40 years or older in Songnan community, Shanghai, China, were invited to participate in a screening examination for cardiometabolic diseases in 2008, among which 10, 185 individuals participated and had their fasting blood glucose evaluated. These participants were categorized into normal fasting glucose [fasting plasma glucose (FPG) < 100 mg/dL without a previous diabetes diagnosis], prediabetes (100 ≤ FPG < 126 mg/dL without a previous diabetes diagnosis), and diabetes (FPG ≥ 126 mg/dL or a previous diabetes diagnosis). Among them, 5, 250 participants were randomly selected on a ratio of 1.0 (diabetes): 1.2 (prediabetes): 1.44 (normal fasting glucose), and 4, 012 individuals responded and underwent a more detailed and comprehensive evaluation including a standard 75-g oral glucose tolerance test. The participants were reclassified into normal glucose regulation (NGR), prediabetes, and diabetes based on their diabetes history and FPG and 2-h post-load PG levels according to the 1999 World Health Organization criteria.
-
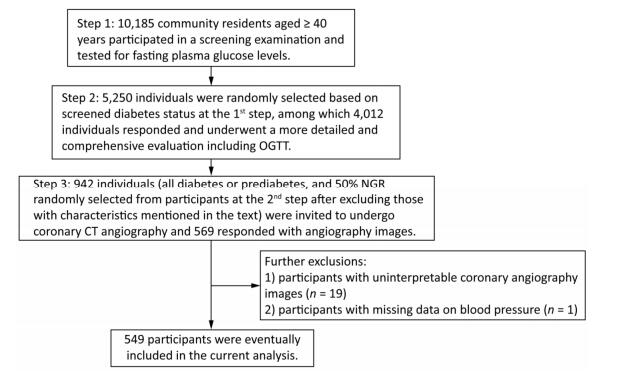
For the current study, we selected a subgroup of participants to undergo coronary CT angiography to measure coronary atherosclerosis. The subgroup included all participants with diabetes or prediabetes, and 50% of the participants with NGR were randomly selected from the original 4, 012 participants after excluding those with following characteristics: (1) age > 60 years, (2) cardiac ischemia symptoms, (3) a CVD history, (4) abnormal Q waves on resting electrocardiogram (ECG), (5) diabetes for more than 5 years, (6) impaired liver or renal function defined by a history of liver diseases other than nonalcoholic fatty liver disease, alanine aminotransferase more than twice the upper limit of the normal range, serum creatinine > 133 μmol/L, or an estimated glomerular filtration rate < 60 mL/min per 1.73 m2, (7) pregnant or having significant medical comorbidities, (8) X-ray examination or CT scan within 12 months, (9) tachycardia (heart rate > 90 bpm) or arrhythmia such as atrial fibrillation on ECG leading to coronary artifacts during coronary CT angiography, or (10) allergic reaction history to an iodine-containing contrast agent. A total of 942 participants were selected and 593 responded, among which 569 had coronary CT angiography. After excluding the participants with uninterpretable coronary angiography segments attributable to motion artifacts (n = 19) and participants with missing data on blood pressure (BP; n = 1), 549 participants were eventually included in the current analysis. Details of the study participants selection are shown in Figure 1.
Figure 1. Flow chart of the study population.
The Institutional Review Board of Rui-Jin Hospital approved the study protocol, and written informed consent was obtained from each participant.
-
Detailed information on education, medical history and current medications, family coronary artery disease (CAD) history in first-degree relatives, and lifestyle factors such as current smoking, current drinking, and physical activity were obtained using a standard questionnaire by trained physicians. Current smoking is defined as having smoked at least one cigarette per day or seven cigarettes per week in the past 6 months. Current drinking is defined as consuming alcohol at least once a week in the past 6 months. Physical activity included activities during work hours as well as at leisure time. Anthropometric measurements such as weight and height were obtained according to standard procedures. Height was measured to the nearest 0.1 cm, and weight was recorded to the nearest 0.1 kg while the participants were wearing lightweight clothing and no shoes[8]. Body mass index (BMI) was calculated as body weight in kilograms divided by body height in meters squared (kg/m2)[9]. BP was measured three times consecutively after at least 5-min rest on the nondominant arm using an automated electronic device (OMRON Model HEM-752; Omron Company, Dalian, China) with 1-min intervals between measurements. The average of the last two readings was used for analysis[7].
All participants were asked to fast for at least 10 h before blood samples were collected. Plasma glucose, serum triglycerides, total cholesterol (TC), high-density lipoprotein cholesterol (HDL-C), and low-density lipoprotein cholesterol (LDL-C) were measured using an autoanalyzer (Beckman CX-7 Biochemical Autoanalyser, Beckman Coulter, Brea, CA, USA). Hemoglobin A1c (HbA1c) was determined by high-performance liquid chromatography (Bio-Rad, Hercules, CA, USA) in a laboratory accredited by the US National Glycohemoglobin Standardization Program.
Hypertension was defined as systolic BP ≥ 140 mmHg and/or diastolic BP ≥ 90 mmHg and/or antihypertensive drug treatment within 2 weeks[10]. Dyslipidemia was defined as HDL-C < 40 mg/dL and/or LDL-C ≥ 160 mg/dL and/or TC ≥ 240 mg/dL and/or triglycerides ≥ 200 mg/dL[11]. Diabetes was defined as FPG ≥ 126 mg/dL and/or 2-h post-load PG ≥ 200 mg/dL and/or taking antidiabetic medications[12]. The index of homeostasis model assessment of insulin resistance (HOMA-IR) was calculated as fasting insulin concentration (mIU/L) × FPG (mmol/L) / 22.5. Insulin resistance was defined as HOMA-IR above 2.5[13].
-
All examinations were performed on a dual- source CT scanner (SOMATOM Definition; Siemens Medical Solutions, Forchheim, Germany). A standard retrospectively ECG-gated scanning protocol was used, with 0.6-mm slice collimation, 330-ms gantry rotation time, 120-kV tube voltage, and a maximum tube current of 400 mAs/tube[7]. All scans were performed using ECG-controlled tube current modulation. A bolus of 70 mL Iohexol injection (350 mg/mL iodine; Omnipaque; GE Healthcare Shanghai, Shanghai, China) was intravenously injected (4 mL/s) via an 18-gauge catheter placed in the antecubital vein, followed by a 40-mL saline chaser[7].
An experienced senior radiologist who was blind to the clinical information read the angiography images on an offline three-dimensional workstation (ADW 4.4; GE Healthcare, Waukesha, WI, USA). Coronary arteries were divided into 15 segments according to the American Heart Association[14]. Only segments with a diameter > 1.5 mm were included for analysis. Furthermore, participants with uninterpretable segments attributable to motion artifacts were excluded. Coronary plaques were considered when structures > 1 mm2 were detected within or adjacent to the coronary artery lumen, which could be clearly distinguished from vessel lumen and the surrounding pericardial tissue. Plaques occupied by calcified tissue were classified as calcified or mixed plaques, and plaques without any calcium were classified as noncalcified plaques.
-
The FRS and 10-year ASCVD risk score were calculated according to previously published algorithms[15-17]. The FRS was calculated based on coronary risk factors including age, sex, LDL-C, HDL-C, BP, smoking status, and the presence or absence of diabetes. The ASCVD score was calculated by age, sex, TC, systolic BP (using different coefficients, depending on whether or not the individual was treated for hypertension), smoking status, and the presence or absence of diabetes. We further stratified the overall study population into high-risk and low-risk groups according to the medians of the FRS and ASCVD score, respectively. The median of the FRS was 5.60%, and the median of the ASCVD score was 3.82% in the current study.
-
Continuous variables are presented as means ± standard deviations or medians (interquartile ranges), and categorical variables are presented as absolute numbers (percentages). Demographic characteristics, metabolic features, the FRS and ASCVD score, and percentages of high-risk participants defined by the FRS or ASCVD score above medians were described and compared among groups of participants without plaques, with noncalcified plaques, and with calcified or mixed plaques using linear regression for continuous variables or logistic regression for categorical variables with adjustment for age and sex. Shapiro- Wilk test was performed to test for normality of variables. The following skewed variables were normalized by logarithmic transformation before analysis: physical activity, triglycerides, FPG, 2-h post-load PG, HbA1c, HOMA-IR, FRS, and ASCVD score.
The associations between plaque compositions and the likelihood of having CVD were examined using linear regression models with the FRS and ASCVD score as continuous variables and logistic regression models with the FRS and ASCVD score above or below median as binary variables. Model 1 was unadjusted. Model 2 was adjusted for age and sex. Model 3 was adjusted for age, sex, education, current drinking, physical activity level, overweight or obesity, elevated diastolic BP, increased LDL-C, increased triglycerides, and insulin resistance. Analyses were also conducted in subgroups of men or women, age above or below the median, BMI < or ≥ 25 kg/m2, with or without hypertension, diabetes, and dyslipidemia. Interactions were tested by introducing cross-product terms of stratum variables and plaque status in logistic regression models.
All analyses were performed using SAS version 9.2 (SAS Institute, Cary, NC, USA). All statistical tests were two-sided, and a P < 0.05 was considered as statistically significant.
Study Population
Inclusion and Exclusion Criteria
Data Collection
Coronary CT Angiography
FRS and 10-year ASCVD Risk Score
Statistical Analysis
-
The general characteristics of the study population according to plaque compositions are presented in Table 1. Nearly half of the overall study population (48.6%) have no coronary plaques, 36.6% have noncalcified plaques, and 14.8% have calcified or mixed plaques. The levels of BMI, systolic and diastolic BP, TC, LDL-C, fasting and 2-h post-load glucose, and HbA1c had a significantly increasing trend across groups of participants without plaques, with noncalcified plaques, and with calcified or mixed plaques (all P values for trend < 0.05), whereas percentages of individuals with a family CAD history, education above high school level, currently smoking, currently drinking, or with dyslipidemia were not significantly different.
Characteristics Overall (n = 549) No Plaques (n = 267) Noncalcified Plaques (n = 201) Calcified or Mixed Plaques (n = 81) P for Trend Age (years) 52.2 ± 4.2 51.4 ± 4.4 52.5 ± 4.1* 53.8 ± 3.4§ < 0.001 Men, n (%) 233 (42.4) 92 (34.5) 100 (49.8)† 41 (50.6)* 0.001 Family history of CAD, n (%) 108 (19.7) 50 (18.7) 41 (20.4) 17 (21.0) 0.339 Education above high school level, n (%) 188 (34.2) 99 (36.9) 73 (36.3) 16 (19.8)* 0.098 Current smokers, n (%) 158 (28.8) 62 (23.2) 66 (32.8) 30 (37.0) 0.487 Current drinkers, n (%) 134 (24.7) 53 (20.1) 57 (32.2) 24 (29.6) 0.329 Physical activity (METs-h/week) 31.3 (11.6-69.3) 28.0 (17.6-59.4) 34.7 (11.6-79.1) 34.7 (13.2-69.3) 0.287 BMI (kg/m2) 25.5 ± 3.4 24.9 ± 3.4 26.2 ± 3.3§ 25.7 ± 3.8* 0.002 Systolic BP (mmHg) 132 ± 19 127 ± 17 135 ± 20§ 139 ± 20§ < 0.001 Diastolic BP (mmHg) 80 ± 10 77 ± 9 82 ± 10§ 83 ± 11§ < 0.001 Total cholesterol (mg/dL) 199 ± 36 196 ± 36 202 ± 37* 202 ± 36 0.017 LDL-C (mg/dL) 92 ± 27 90 ± 25 94 ± 28* 95 ± 29 0.042 HDL-C (mg/dL) 52 ± 12 53 ± 12 51 ± 11 53 ± 12 0.208 Triglycerides (mg/dL) 113 (77-172) 105 (72-156) 120 (89-183)* 124 (82-172) 0.063 Fasting PG (mg/dL) 94 (86-105) 92 (85-103) 94 (86-105) 97 (86-121)‡ < 0.001 2-h post-load PG (mg/dL) 144 (112-186) 141 (106-177) 149 (119-184) 141 (110-223) 0.041 HbA1c (%) 6.00 (5.70-6.50) 6.00 (5.70-6.40) 6.00 (5.70-6.50) 6.20 (5.80-6.90)§ < 0.001 HOMA-IR 1.72 (1.04-2.63) 1.58 (0.95-2.41) 1.81 (1.22-2.77)† 1.95 (1.30-2.94) 0.015 Hypertension, n (%) 245 (44.6) 90 (33.6) 110 (54.7)§ 45 (55.6)† < 0.001 Diabetes, n (%) 130 (23.7) 57 (21.3) 43 (21.4) 30 (37.0)† 0.035 Dyslipidemia, n (%) 190 (34.6) 82 (30.6) 76 (27.8) 32 (39.5) 0.151 Note. All comparisons were adjusted for age and sex. Continuous variables are presented as means ± standard deviations or medians (interquartile ranges), and categorical variables are presented as absolute numbers (percentages). *P < 0.05 compared with the no plaques group. †P < 0.01 compared with the no plaques group. ‡ P < 0.001 compared with the no plaques group. §P < 0.0001 compared with the no plaques group. CAD, coronary artery disease; METs, metabolic equivalents; BMI, body mass index; BP, blood pressure; LDL-C, low-density lipoprotein cholesterol; HDL-C, high-density lipoprotein cholesterol; PG, plasma glucose; HbA1c, hemoglobin A1c; HOMA-IR, the index of homeostasis model assessment of insulin resistance. Table 1. General Characteristics of the Study Population
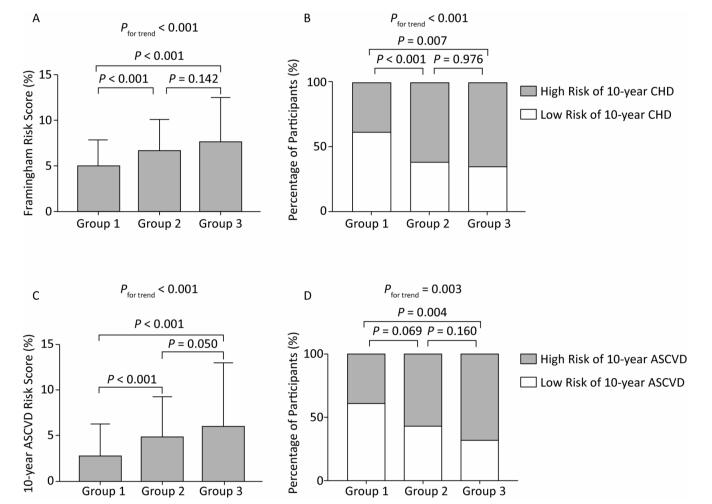
The medians of the FRS were 4.91%, 6.62%, and 7.60%, and the medians of the 10-year ASCVD score were 2.76%, 4.75%, and 5.90% in participants without plaques, with noncalcified plaques, and with calcified or mixed plaques, respectively (both P values for trend < 0.001; Figure 2A and C). Using the FRS and ASCVD score above medians of the overall study population to define high-risk participants, that is, participants with the FRS ≥ 5.60% or participants with the ASCVD score ≥ 3.82%, respectively, percentages of high-risk participants also increased substantially across three groups (both P values for trend < 0.01; Figure 2B and D).

Figure 2. (A) and (C): Levels of the Framingham risk score and the 10-year ASCVD risk score (medians and interquartile ranges). (B) and (D): Percentages of high-risk participants among groups. Group 1, no plaques; Group 2, noncalcified plaques; Group 3, calcified or mixed plaques. P values were adjusted for age and sex. CHD, coronary heart disease; ASCVD, atherosclerotic cardiovascular disease.
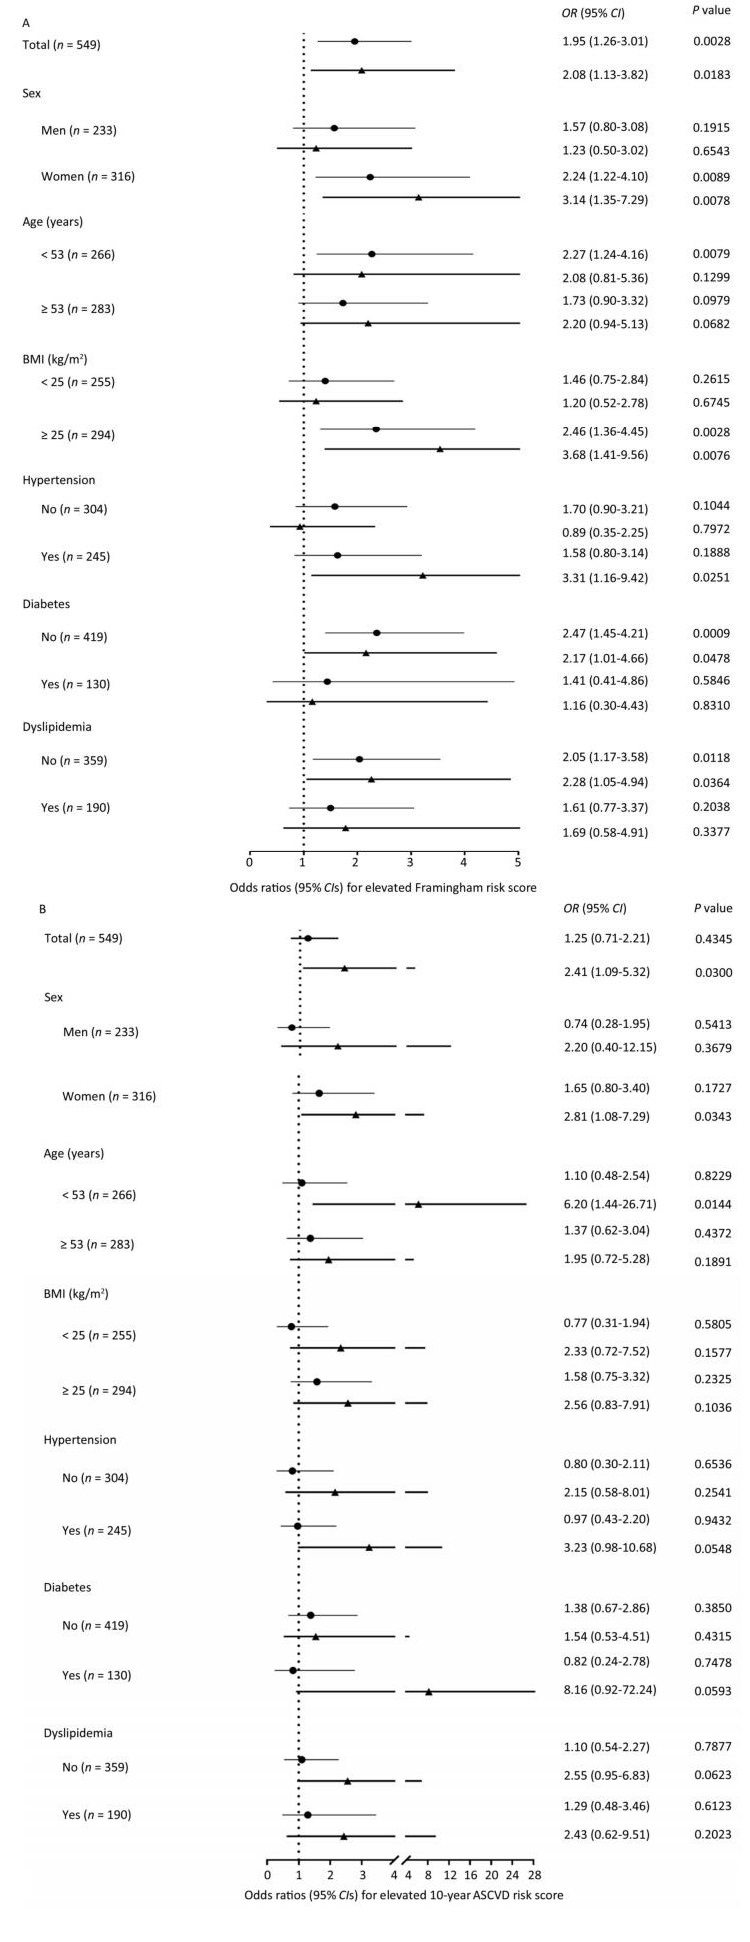
Using participants without plaques as the reference, both noncalcified plaques and calcified or mixed plaques were associated with increased FRS levels and an elevated likelihood of having FRS ≥ 5.60% (Table 2). After adjustment for conventional CVD risk factors, participants with noncalcified plaques had a 95% increase [odds ratio (OR) 1.95; 95% confidence interval (CI) 1.26-3.01] and participants with calcified or mixed plaques had a 108% increase (OR 2.08; 95% CI 1.13-3.82) in the likelihood of having elevated FRS compared with participants without plaques. Similar findings were observed for CV risks evaluated by the 10-year ASCVD score (Table 3). After adjustment for conventional CVD risk factors, participants with calcified or mixed plaques had a 141% increase (OR 2.41; 95% CI 1.09-5.32) in the likelihood of having elevated ASCVD score compared with participants without plaques. However, although noncalcified plaques were positively associated with ASCVD score in linear regression models, they were not significantly associated with an increased likelihood of having elevated ASCVD score in logistic regression models after adjustment. Furthermore, associations were generally consistent, and no significant interactions were found between subgroups (Figure 3, all P values for interaction > 0.05).
Models Log-transformed Framingham Risk Score Elevated Framingham Risk Score β ± SE P value OR (95% CI) P value Model 1 No plaques 0.000 (reference) 1.00 (reference) Noncalcified plaques 0.140 ± 0.028 < 0.0001 2.61 (1.79-3.80) < 0.0001 Calcified or mixed plaques 0.218 ± 0.037 < 0.0001 3.06 (1.82-5.15) < 0.0001 Model 2 No plaques 0.000 (reference) 1.00 (reference) Noncalcified plaques 0.087 ± 0.024 0.0003 2.23 (1.48-3.35) 0.0001 Calcified or mixed plaques 0.136 ± 0.033 < 0.0001 2.25 (1.28-3.95) 0.0048 Model 3 No plaques 0.000 (reference) 1.00 (reference) Noncalcified plaques 0.055 ± 0.023 0.0173 1.95 (1.26-3.01) 0.0028 Calcified or mixed plaques 0.112 ± 0.031 0.0003 2.08 (1.13-3.82) 0.0183 Note. Linear regression models were used with the log-transformed Framingham risk score as the dependent variable. Logistic regression models were used with the Framingham risk score ≥ 5.60% as the dependent variable. Model 1: unadjusted. Model 2: adjusted for age and sex. Model 3: adjusted for age, sex, education above high school level, current drinking, physical activity level, overweight or obesity, increased low-density lipoprotein cholesterol, increased triglycerides, and insulin resistance. SE, standard error; OR, odds ratio; CI, confidence interval. Table 2. Associations between Plaque Status and the 10-year Coronary Heart Disease Risk
Models Log-transformed 10-year ASCVD Risk Score Elevated 10-year ASCVD Risk Score β ± SE P value OR (95% CI) P value Model 1 No plaques 0.000 (reference) 1.00 (reference) Noncalcified plaques 0.216 ± 0.041 < 0.0001 2.10 (1.45 -3.04) < 0.0001 Calcified or mixed plaques 0.335 ± 0.056 < 0.0001 3.32 (1.96-5.62) < 0.0001 Model 2 No plaques 0.000 (reference) 1.00 (reference) Noncalcified plaques 0.095 ± 0.026 0.0004 1.61 (0.97-2.69) 0.0682 Calcified or mixed plaques 0.168 ± 0.036 < 0.0001 2.78 (1.38-5.56) 0.0042 Model 3 No plaques 0.000 (reference) 1.00 (reference) Noncalcified plaques 0.050 ± 0.024 0.0399 1.25 (0.71-2.21) 0.4345 Calcified or mixed plaques 0.125 ± 0.033 0.0001 2.41 (1.09-5.32) 0.0300 Note. Linear regression models were used with the log-transformed 10-year ASCVD risk score as the dependent variable. Logistic regression models were used with the 10-year ASCVD risk score ≥ 3.82% as the dependent variable. Model 1: unadjusted. Model 2: adjusted for age and sex. Model 3: adjusted for age, sex, education above high school level, current drinking, physical activity level, overweight or obesity, elevated diastolic blood pressure, increased low-density lipoprotein cholesterol, increased triglycerides, and insulin resistance. ASCVD, atherosclerotic cardiovascular disease; SE, standard error; OR, odds ratio; CI, confidence interval. Table 3. Associations between Plaque Status and the 10-year ASCVD Risk
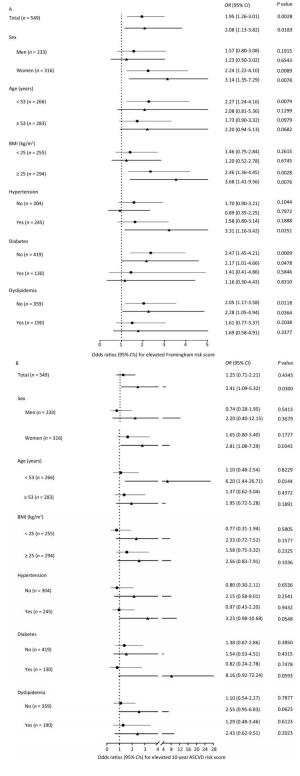
Figure 3. The likelihood of (A) elevated Framingham risk score and (B) elevated 10-year atherosclerotic cardiovascular disease (ASCVD) risk score in association with plaque composition in the overall population and in subgroups. (A) Logistic regression models were adjusted for age, sex, education above high school level, current drinking, physical activity level, overweight or obesity, increased low-density lipoprotein cholesterol (LDL-C), increased triglycerides, and insulin resistance. (B) Logistic regression models were adjusted for age, sex, education above high school level, current drinking, physical activity level, overweight or obesity, elevated diastolic blood pressure, increased LDL-C, increased triglycerides, and insulin resistance. Lines with a point indicate odds ratios (95% CIs) of noncalcified plaques vs. no plaques. Lines with a triangle indicate odds ratios (95% CIs) of calcified or mixed plaques vs. no plaques. BMI, body mass index; OR, odds ratio; CI, confidence interval.
-
In the current study, we found significant associations of coronary calcified or mixed plaques with elevated likelihood of having CVD evaluated by the FRS and 10-year ASCVD risk score in a middle-aged community-dwelling Chinese population without previous CVD history or overt myocardial ischemia. Coronary noncalcified plaques were significantly associated with an elevated FRS but not with an elevated 10-year ASCVD score.
The lifetime risk of CVD is substantial. Coronary events occur after long periods of subclinical atherosclerosis[18], and the condition is often silent or may occur without warning, underlining the importance of prevention. Several risk prediction tools that synthesize conventional cardiovascular risk factors were developed to estimate the absolute individual CVD risk. Among them, the FRS was developed in 1998 based on the Framingham Heart Study to estimate the 10-year risk of developing coronary heart disease[17]. Meanwhile, the new Pooled Cohort Risk Assessment Equations were published in 2013 based on pooled data from five large National Institutes of Health-funded cohorts to estimate the 10-year risk of developing ASCVD[15, 16]. It should be noted that the FRS estimates risk for a combination of coronary heart disease outcomes including angina pectoris, myocardial infarction, coronary insufficiency, and coronary heart disease-related death. On the other hand, the 10-year ASCVD risk score estimates risk for ASCVD events including myocardial infarction, stroke, and coronary heart disease- or stroke-related death. This difference may potentially explain different findings with regard to associations between coronary plaques and elevated FRS or elevated 10-year ASCVD score, suggesting closer associations between coronary plaques and risks of coronary heart disease compared with risks of ASCVD events.
Previous studies have reported coronary plaque subtypes in prediction of developing CVD such as myocardial ischemia, acute coronary syndrome, and stroke[19-22]. Findings from our study add to existing knowledge by demonstrating significant associations of plaque composition with the likelihood of having CVD evaluated by the FRS and ASCVD risk score. It was reported that the amount of calcified plaques is highly related to the overall plaque burden[23]. Calcified plaques are generally present in advanced stages of atherosclerosis, whereas noncalcified plaques often appear in early atherosclerosis[24]. While calcified plaques do not response well to interventions targeting atherosclerotic risk factors, mixed plaques have substantially elevated CV risks because of plaque vulnerability and tendency to rupture compared with noncalcified plaques[21, 25-27].
Previous studies have also examined associations between coronary plaque subtypes and traditional CVD risk factors. Large-scale long-term cohort studies such as the Multi-Ethnic Study of Atherosclerosis have reported that coronary calcification increased with age[28, 29]. Women tended to have more noncalcified plaques and less calcified or mixed plaques compared with men[30, 31]. Calcified or mixed plaques were more frequent in patients with hypertension or diabetes[32, 33]. These are consistent with findings from our study. As is shown in Table 1, age and the proportions of men, hypertension, or diabetes increased substantially across the groups of participants without plaques, with noncalcified plaques, and with calcified or mixed plaques. It indicates that promoting lifestyle modifications to reduce CVD risk factors might be helpful to prevent subclinical atherosclerosis[34].
Currently, coronary CT angiography is not recommended by the American Heart Association in patients who have no signs or symptoms suggestive of CAD (Class Ⅲ, level of evidence C)[35], due to concerns of unnecessary radiation, use of contrast material, lack of outcome data, and risk of triggering downstream testing and procedures. However, other guidelines recommend imaging patients at intermediate or high CAD risk, even without symptoms[36]. Therefore, there are conflicting recommendations on risk assessment by imaging of asymptomatic CAD[37]. In our study of a middle-aged community-dwelling Chinese population without previous CVD history or symptomatic myocardial ischemia, approximately 90% of the participants had at least one cardiovascular risk factor, such as cigarette smoking, family CAD history, overweight/obesity, hypertension, diabetes, or dyslipidemia. In addition, the presence of coronary plaques is common, and this is associated with a significant increase in the likelihood of having CVD evaluated by the FRS and 10-year ASCVD risk score, especially in cases of calcified or mixed coronary plaques. Therefore, findings from our study might lend support to noninvasive coronary imaging in intermediate- or high-risk asymptomatic patients.
The current study has several important limitations. First, participants were selected to have higher proportions of prediabetes and diabetes than the general population, that is, individuals with high CV risks might be overrepresented in the study population, although individuals with previous CVD history or symptoms of myocardial ischemia were excluded. Second, CV risks were assessed using risk scores rather than clinical CVD outcomes. Although the FRS and 10-year ASCVD risk score have been validated and widely used, their predictive value can be limited because it was reported that approximately 20% of CVD events occur in the absence of any major risk factors[38]. In addition, validation of the scores, especially the ASCVD score in the Chinese population, is yet to be done. Third, although coronary CT angiography detects noncalcified, calcified, and mixed coronary plaques, intravascular ultrasonography does better in discrimination of individual plaque components. Fourth, the small sample size and the limited number of coronary plaques in the current study have limited further analysis, and analysis in subgroups provided little information. However, the power of the current sample size to detect differences in percentages of elevated FRS among participants without plaques, with noncalcified plaques, and with calcified or mixed plaques was above 90%. Fifth, because of limited information, we could not examine calcified and mixed plaques separately and subdivide noncalcified plaques into lipid-rich or fibrous plaques. In addition, only a single senior radiologist read CT scan images. A second radiologist should have been used to minimize observer bias. Other limitations included the cross-sectional nature, uncontrolled confounding, and limited generalizability to populations of other ethnic or age groups.
In conclusion, using coronary CT angiography to assess subclinical CAD in middle-aged community-dwelling Chinese adults has a markedly increased likelihood of having CVD evaluated by the FRS and the 10-year ASCVD risk score in participants with calcified or mixed plaques. Coronary noncalcified plaques were significantly associated with elevated FRS but not with elevated 10-year ASCVD score. Prospective cohort studies with follow-up data on CVD events are warranted to validate our findings and to elucidate the role of different plaque subtypes in risk predictions and outcome interventions.
-
LI Lin and XU Yu were responsible for the concept and design of the analysis, the acquisition, analyses and interpretation of the data, and the drafting of the manuscript. WANG Long and LIU Shan Shan took part in the acquisition, analyses, and interpretation of the data. ZHAO Zhi Yun, LI Mian, WANG Tian Ge, XU Min, LU Jie Li, CHEN Yu Hong, WANG Shuang Yuan, DAI Meng, HOU Ya Nan, WU Xue Yan, and MA Li Na helped with the acquisition of the data. BI Yu Fang and WANG Wei Qing critically revised the manuscript for important intellectual content.
-
We declare that we have no conflicts of interest.

 Quick Links
 DownLoad: