


HTML
-
Bronchial asthma is a common chronic inflammatory disease of the airway. It is estimated that there are more than 300 million patients with asthma worldwide and that more than 250, 000 deaths per year are attributable to the disease. The incidence of asthma has been steadily increasing in recent years, such that it is now necessary to explore its pathogenesis in more depth to find new and effective therapeutic targets[1, 2]. A prominent feature of asthma is its heterogeneity. In recent years, researchers have proposed the classification of inflammatory phenotypes according to the characteristics of the inflammatory cells in the airway, as follows: eosinophilic asthma, neutrophilic asthma, and paucigranulocytic asthma[3]. These inflammatory phenotypes differ in their pathogenesis and response to steroid therapy. For example, eosinophilic asthma responds well to corticosteroids whereas neutrophilic asthma responds poorly, and there is a high proportion of the neutrophilic subtype in patients with severe asthma[4], which potentially necessitates the use of macrolides[5]. The intrinsic cytologic and molecular biological mechanisms of the different inflammatory subtypes need further study. The mechanism of inflammation in the airway of a patient with asthma is complex and involves many different types of cells and a large number of pathways in which various metabolites produced by cells involved in the metabolic process play multiple roles[6, 7]. Metabolomics can be used to further explore the mechanisms and classification of diseases and provide an in-depth understanding of their biomarkers.
Glycerophospholipid is a major component of cell membranes and is a storage material for biologically active substances and precursors of informational molecules. It has an important physiologic role in cell growth, migration, signal recognition and transduc- tion, and apoptosis[6-8]. Our previous research and several other studies have shown that patients with asthma have a serum metabolic glycerophospholipid profile that is significantly different from that of healthy controls, and that glycerophospholipid may be a relatively specific biomarker for the diagnosis of asthma and its treatment[6-9]. The glycerophospholipid levels in the different inflammatory subtypes of asthma have not been reported. In this study, we investigated the metabolic profile of serum glycerophospholipids in patients with eosinophilic asthma and with neutrophilic asthma to reveal the pathophysiologic mechanisms in the different inflammatory subtypes of asthma and provide a basis for targeted drugs and precise treatment.
-
This cross-sectional study included 51 patients with asthma who were treated at our hospital between January 2015 and December 2015. All of these patients met the diagnostic criteria for asthma, as specified in the Guidelines for Prevention and Management of Bronchial Asthma[1]. Patients with complicated chronic obstructive pulmonary disease, bronchiectasis, pneumonia, obstructive sleep apnea-hypopnea syndrome, malignant disease, acute or chronic respiratory failure, or severe cardiovascular disease were excluded. The study was approved by the Ethics Committee of the Peking University Third Hospital (approval number 2014071). All participating patients provided written informed consent.
-
Demographic data, including sex and age, body mass index, inhaled steroid doses, and Asthma Control Test (ACT) scores were recorded. All subjects underwent standard pulmonary function tests using spirometry (Elite series, MGC Diagnostics, St Paul, MN, USA). The percent predicted forced expiratory volume in 1 second (FEV1%pred) and FEV1/forced vital capacity (FVC) were recorded. The eosinophil count was measured as part of routine peripheral blood testing, and 2 mL of peripheral blood was collected to detect the serum phospholipid profile. Induced sputum was also obtained for cell and differential counts.
-
Preparation of Serum Two milliliters of peripheral venous blood was collected without anticoagulant. The serum was separated (3, 000 r/min, centrifugal radius 13 cm, 5 min) and stored in a refrigerator at −80 ℃. The patients were fasted for more than 12 h before collection of samples and completed a food frequency questionnaire for analysis of the influence of diet on the test results.
Lipid Extraction First, 100 μL of plasma was taken (10 μL of the storage solution of the lipidomic internal standard mixture were added), mixed with 400 μL of frozen methanol (75%), and sonicated for 2 min. Next, 1 mL of methyl t-butyl ether (MTBE) was added. The sample was then vortexed for 1 h at room temperature, after which 250 μL of H2O was added, and the sample was allowed to stand for 10 min to separate. The sample was then centrifuged at 12, 000 ×g for 10 min at 4 ℃. Next, the supernatant was removed and blown dry in a new tube. Finally, the supernatant was dissolved in 100% methanol, filtered, and placed into sample bottles. The storage solution of the lipidomic internal standard mixture consisted of 20 μg/mL each of phosphatidylcholine (PC, 17:0/17:0), phosphatidylethanolamine (PE, 17:0/17:0), phosphatidylglycerol (PG, 17:0/17:0), phosphatidylinositol (PI, 17:0/17:0), phosphatidic acid (17:0/17:0), and phosphatidylserine (17:0/17:0).
Determination of the Serum Phospholipid Profile by Liquid Chromatography-mass Spectrometry An Acquity UPLC liquid chromatograph and an UPLC BEH C18 column (1.7 μm, 100 × 2.1 mm id; Waters, Milford, MA, USA) were used, with a column temperature of 25 ℃ and a flow rate of 0.25 mL/min. Solution A contained 60% acetonitrile (5 mmol/L ammonium acetate) and solution B contained isopropanol:acetonitrile (9:1); gradient: 0-3 min 15% B; 3-15 min 15%-99% B; 15-17 min 99% B; 17-19 min 99%-15% B; and 19-20 min 15% B. A 5500 QTRAP mass spectrometer (AB Sciex, Farmingham, MA, USA) was used, and the ion source was Turbo V Ion Spray electrospray ionization. The scan mode was multiple reaction monitoring and the ion source parameters were as follows: CUR, 40 psi; GS1, 30 psi; GS2, 30 psi; IS, −4500 V; CAD, medium; and temperature, 350 ℃. The scanning strategy used for multiple reactions monitoring of the glycerophospholipids is shown in Table 1.
LC-MS/ MS Run Lipid Class Internal Standards Parent Ion Daughter Ion CE 1 Phosphatidylcholine (PC) PC 17:0/17:0 [M+H]+ 184.1 45 1 Alkyl-phosphatidylcholine [PC(O)] PC 17:0/17:0 [M+H]+ 184.1 45 1 Phosphatidylcholineplasmalogen (PCP) PC 17:0/17:0 [M+H]+ 184.1 45 1 Phosphatidylethanolamine (PE) PE 17:0/17:0 [M+H]+ NL141 31 1 Alkylphosphatidylethanolamine [PE(O)] PE 17:0/17:0 [M+H]+ NL141 31 1 Phosphatidylethanolamineplasmalogen (PEP) PE 17:0/17:0 [M+H]+ NL141 31 1 Phosphatidylserine (PS) PS 17:0/17:0 [M+H]+ NL185 29 1 Phosphatidylglycerol (PG) PG 17:0/17:0 [M+NH4] NL189 25 1 Phosphatidylinositol (PI) PI 17:0/17:0 [M+NH4] NL277 43 1 Lysophosphatidylcholine (LPC) PC 17:0/17:0 [M+H]+ 184.1 31 2 Lysophosphatidylethanolamine (LPE) PE 17:0/17:0 [M-H]- 196.0 -29 2 Lysophosphatidylserine (LPS) PS 17:0/17:0 [M-H]- NL87 -22 2 Lysophosphatidylglycerol (LPG) PG 17:0/17:0 [M-H]- NL228 -26 2 Lysophosphatidylinositol (LPI) PI 17:0/17:0 [M-H]- NL316 -40 Note.LC-MS/MS, liquid chromatography-tandem mass spectrometry. Table 1. Glycerophospholipid Scanning Strategy Using Liquid Chromatography-mass Spectrometry
-
The steps used for sputum induction cytology[10] were as follows. Before nebulization, the patients were instructed to gargle with water, blow their nose, inhale nebulized sodium chloride 3%, and expectorate into a sterile sputum container after 20-30 min. An equivalent volume of dithiothreitol 0.4% was added, and the sample was incubated at 37 ℃ for 30 min. The sample was centrifuged for 5 min at 2, 000 r/min (centrifugal radius 13 cm). The cells were sorted after Wright-Giemsa staining.
-
Asthma was divided into the following groups[3]: eosinophilic type (≥ 3%) and non-eosinophilic type (< 3%) according to the ratio of eosinophils to leukocytes in induced sputum; eosinophilic type (≥ 3%) and non-eosinophilic type (< 3%) according to the ratio of eosinophils to leukocytes in blood; eosinophilic type (≥ 300 cells/μL) and non- eosinophilic type (< 300 cells/μL) according to the absolute value of eosinophils in blood; and neutrophilic type (≥ 71%) and non-neutrophilic type (< 71%) according to the ratio of neutrophils to leukocytes in induced sputum.
-
The metabolomics analysis tools[11] on the http://www.metaboanalyst.ca/ website were used to compare the metabolic profiles of glycerophospholipids between the different inflammatory subtypes of asthma. Partial least squares discriminant analysis (PLS-DA) was performed on the patients' samples. The different metabolites were screened by methods including variable importance in projection and loading weights. All statistical analyses were performed using the SPSS 19.0 software package (IBM Corp. Armonk, NY, USA). The asthma type diagnostic accuracy was evaluated using the subject working curve method. A P-value ≤ 0.05 was considered statistically significant.
Patients
Collection of Demographic and Clinical Data
Serum Phospholipid Tests
Sputum Induction Cytology
Classification of Inflammatory Subtypes of Asthma
Statistical Analysis
-
Fifty-one patients with asthma and an average age of 43.3 ± 14.0 years were included. The FEV1%pred was 92.3% ± 16.0%, and the FEV1/FVC was 73.3% ± 10.8% (Table 2). One hundred and twenty-nine phospholipids in 14 categories were detected as follows: 21 types of phosphatidylcholine (PC), 15 types of alkylphosphatidylcholine [PC(O)], 8 types of phosphatidylcholine plasmalogen (PCP), 12 types of phosphatidylethanolamine (PE), 4 types of alkylphosphatidylethanolamine [PE(O)], 2 types of phosphatidylethanolamine plasmalogen (PEP), two types of phosphatidylglycerol (PG), 11 types of phosphatidylinositol (PI), 11 types of lysophosphatidylcholine (LPC), 12 types of lysophosphatidylethanolamine (LPE), 5 types of hemolytic phosphatidylserine (LPS), 11 types of lysophosphatidylglycerol (LPG), 9 types of lysophosphatidylinositol (LPI), and 6 types of lysoalkylphosphatidylcholine [LPC(O)].
Variables Results Sex (male/female), n 17/34 Age, years 42.0 ± 13.5 Body mass index (kg/m2) 23.8 ± 3.0 ACT score 18.3 ± 5.7 FEV1%pred (%) 92.3 ± 16.0 FEV1/FVC (%) 73.3 ± 10.8 Note.ACT, Asthma Control Test; FEVl, forced expiratory volume in 1 second; FEV1%pred, FEVl expressed as a% of the predicted value; FVC, forced vital capacity. Continuous variables are shown as the mean ± standard deviation. Table 2. Patient Demographics and Disease Severity
-
Thirty-nine of the 51 patients enrolled underwent a sputum induction test. According to the sputum cell count, eosinophils accounted for ≥ 3% of leukocytes in the sputum of 23 subjects and for < 3% in 16 subjects. The ACT scores were lower in the eosinophilic group than in the non-eosinophilic group; the difference was not statistically significant (P = 0.062; Table 3).
Variables Inflammatory Subtypes P-value EOS in sputum ≥ 3% (n = 23) EOS in sputum < 3% (n = 16) Sex (male/female), n 6/17 7/9 0.250 Age, years 42.2 ± 15.0 41.6 ± 12.7 0.888 ACT score 16.7 ± 6.3 20.3 ± 5.0 0.062 ICS (regular/irregular), n 14/7 10/6 0.793 Blood EOS (%) > 3 15 6 < 3 6 8 Blood EOS (/μL) > 300 9 2 > 300 12 11 EOS in blood ≥ 3% (n = 29) EOS in blood < 3% (n = 17) Sex (male/female), n 11/18 5/12 0.672 Age, years 42.7 ± 14.3 42.8 ± 12.0 0.986 ACT score 17.3 ± 6.1 18.8 ± 5.3 0.424 Inhaled ICS (regular/irregular), n 19/8 10/5 0.895 EOS in blood ≥ 300 cells/μL (n = 17) EOS in blood < 300 cells/μL (n = 29) Sex (male/female), n 4/13 12/17 0.372 Age, years 44.9 ± 13.2 41.5 ± 13.5 0.405 ACT score 15.5 ± 5.3 19.2 ± 5.6 0.033 Inhaled ICS (regular/irregular), n 10/6 19/7 0.712 Sputum neutrophils ≥ 71% (n = 19) Sputum neutrophils < 71% (n = 20) Sex (male/female), n 7/12 6/14 0.651 Age, years 43.5 ± 11.7 40.5 ± 16.0 0.514 ACT score 18.1 ± 6.0 18.4 ± 6.2 0.901 Inhaled ICS (regular/irregular), n 12/7 12/6 0.823 Note.Twelve patients had no sputum cell differential count results. Five patients did not have blood routine tests. The data are shown as the mean ± standard deviation except for patient sex. EOS, eosinophils; ACT, Asthma Control Test; ICS, inhaled corticosteroids. Table 3. Patient Demographics and Disease Severity between Different Inflammatory Subtypes
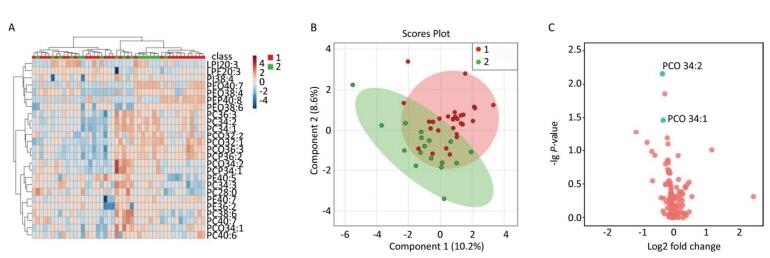
Multivariate statistical analysis of the serum glycerophospholipid results in the sputum eosinophilic group (≥ 3%) and non-eosinophilic group (< 3%) was performed. A heat map (Figure 1A) showed the metabolic profiles of the glycerophospholipid in each sample; hierarchical cluster analysis showed that there was no obvious similarity in the metabolic profiles in each group, and there was no significant difference between the two subgroups. The PLS-DA score plot (Figure 1B) showed that the two groups could not be separated perfectly by the PLS model, indicating that the difference between the two groups was not reflected in the whole glycerophospholipid metabolism proflie. Therefore, we performed a univariate analysis. A volcano plot (Figure 1C) showed that there were three glycerophospholipid species with significant changes: PC(O) 32:0, LPG 22:6, and LPG 20:5, indicating a significant difference between the two subgroups. A receiver-operating curve (ROC) curve analysis (Figure 1D) was performed with the three major significantly different glycerophospholipids as the test variables and sputum eosinophils ≥ 3% as the state variable. The areas under the curve (AUCs) were 34.8% [95% CI (17.4%, 52.1%)], 72.0% [95% CI (56.0%, 88.1%)], and 74.7% [95% CI (57.4%, 92.0%)], respectively. The AUCs for LPG 22:6 and LPG 20:5 were ≥ 70%; therefore, they can be considered as biomarkers for a diagnosis of eosinophilic asthma. The ROC curve was shown in Figure 1D (Figure 1E for the histogram). The results of the comparison are shown in Table 4.

Figure 1. (A) Heat map. (B) Partial least squares discriminant analysis score chart. (C) Volcano map. (D) Receiver-operating characteristic curve for LPG 22:6 and LPG 20:5. (E) Histogram. Group 1 and 2 represent asthmatic patients with sputum eosinophils (EOS) ≥ 3% and < 3% respectively. The heat map in (A) compares the glycerophospholipid profiles of patients in the asthma subgroups with sputum EOS ≥ 3% and < 3%. Each square represents a glycerophospholipid, and the color indicates the content of glycerophospholipid in the serum. The higher the serum content, the darker the color (red is upregulated, and blue is downregulated). The PLS-DA score plot in (B) shows an overall difference in the metabolic glycerophospholipid profiles of patients in the asthma subgroups with sputum EOS ≥ 3% and < 3%. The red dots represent the group with sputum sputum EOS ≥ 3%, and the green dots represent the group with sputum EOS < 3%. The volcano plot in (C) shows the glycerophospholipids with significant differences between the subgroups with sputum EOS ≥ 3% and < 3%. The glycerophospholipids with significant changes in this figure are PC-O 32:0, LPG 22:6, PC 38:5, and LPG 20:5. The ROC curve for LPG 22:6 and LPG 20:5 in (D) and has an AUC ≥ 70%. (E) Is a histogram showing LPG 22:6 and LPG 20:5 in the asthma groups with sputum EOS ≥ 3% and < 3% (*P < 0.05).
Glycerophospholipid FC Log2 (FC) P-value EOS in sputum ≥ 3% (n = 23) EOS in sputum < 3% (n = 16) PC (O 32:0) 0.593 -0.754 0.009 LPG 22:6 3.572 1.836 0.022 PC 38:5 0.845 -0.243 0.029 LPG 20:5 1.387 0.471 0.039 EOS in blood ≥ 3% (n = 29) EOS in blood < 3% (n = 17) PC (O 34:2) 0.785 -0.348 0.007 PC 34:3 0.826 -0.276 0.014 PCP 34:1 0.796 -0.324 0.033 PE (O 40:7) 0.446 -1.155 0.052 EOS in blood ≥ 300 cells/μL (n = 17) EOS in blood < 300 cells/μL (n = 29) LPS 20:4 0.434 -1.204 0.014 PEP 40:6 2.148 1.103 0.023 LPI 18:0 2.616 1.387 0.024 PG 34:2 1.333 0.414 0.036 PI 40:5 2.110 1.078 0.037 LPG 22:6 2.591 1.374 0.040 PC 34:3 0.865 -0.209 0.060 Note.Twelve patients had no sputum cell differential count results. Five patients did not have blood routine tests. LPG, lysophosphatidylglycerol; PC, phosphatidylcholine; PC(O), alkylphosphatidylethanolamine; PE(O), alkylphosphatidylethanolamine; PCP, phosphatidylcholine plasmalogen; LPE, lysophosphatidylethanolamine; LPI, lysophosphatidylinositol; PEP, phosphatidylethanolamine plasmalogen; PG, phosphatidylglycerol; PI, phosphatidylinositol. Table 4. Comparison of Serum Glycerophospholipids between Patients with Different Inflammatory Subtypes
-
Forty-six of the 51 patients underwent routine blood tests. Blood eosinophils accounted for ≥ 3% of total leukocytes in 29 patients and < 3% in 17 patients (Table 3).
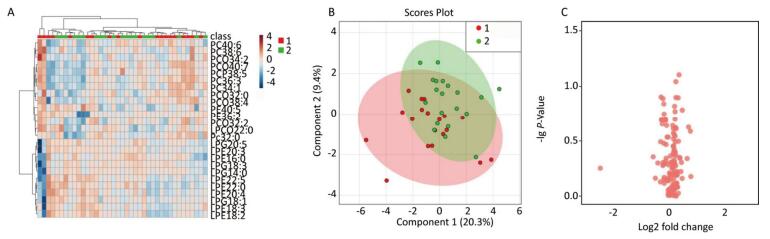
A multivariate statistical analysis of the serum glycerophospholipid results in the blood eosinophilic group (≥ 3%) and non-eosinophilic group (< 3%) was performed. A heat map (Figure 2A) shows the metabolic profiles of glycerophospholipid in each sample; hierarchical cluster analysis showed that there was no obvious similarity in the metabolic profiles of each group, and there was no significant difference between the two subgroups. The PLS-DA score plot (Figure 2B) showed that the two groups could not be separated by the PLS model, indicating that the difference between the two groups was not reflected in the whole glycerophospholipid metabolism spectrum. Therefore, we performed the following univariate analysis. A volcano plot (Figure 2C) showed that PC(O 34:2), PC 34:3, PCP 34:1, and PE(O 40:7) were significantly different between the two subgroups. ROC curve nalysis was performed using these four major significantly different glycerophospholipids as the test variables and blood eosinophils ≥ 3% as the state variable. The AUCs were 34.2% [95% CI (21.7%, 52.3%)], 34.3% [95% CI (25.8%, 57.6%)], 34.1% [95% CI (23.2%, 54.3%)], and 40.7% [95% CI (22.4%, 54.4%)], respectively, and did not reach the 70% threshold. A comparison of these results is shown in Table 4.
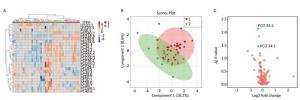
Figure 2. (A) Heat map. (B) Partial least squares discriminant analysis score chart. (C) Volcano map. Group 1 and 2 represent asthmatic patients with blood eosinophilis (EOS) ≥ 3% and < 3% respectively. The heat map in (A) compares the metabolic profiles of glycerophospholipids in patients with blood EOS ≥ 3% and < 3%. The PLS-DA score plot in (B) shows the overall differences in the metabolic glycerophospholipid profiles in patients with blood EOS ≥ 3% and < 3%. The volcano plot in (C) shows the glycerophospholipids with significant differences between the subgroups with blood EOS ≥ 3% and < 3%. The phospholipids that vary significantly in this figure are PC(O 34:2), PC 34:3, PCP 34:1, and PE (O 40:7).
-
Seventeen patients had an absolute eosinophil value ≥ 300 cells/μL and 29 had a value < 300 cells/μL. The ACT level in the blood eosinophilic group was significantly lower than that in the blood non-eosinophilic group (P < 0.05; Table 3).
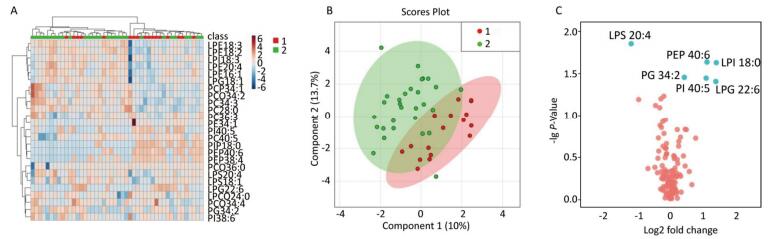
A multivariate statistical analysis of the serum glycerophospholipid results in the blood eosinophilic group (≥ 300 cells/μL) and non-eosinophilic group (< 300 cells/μL) was performed. A heat map (Figure 3A) showed the metabolic profiles of the glycerophospholipids in each sample, but the hierarchical cluster analysis showed that there was no obvious similarity in the metabolic profiles of each group, and there was no significant difference between the two subgroups. The PLS-DA score plot (Figure 3B) showed that the two groups could not be separated by the PLS model, indicating that the difference between the two groups was not reflected in the whole glycerophospholipid metabolism profile. Therefore, we performed a univariate analysis. A volcano plot (Figure 3C) showed a significant difference in LPS 20:4, PEP 40:6, LPI 18:0, PG 34:2, PI 40:5, LPG 22:6, and PC 34:3 between the two subgroups. An ROC curve analysis was performed using these seven major significantly different glycerophospholipids as the test variables and blood eosinophils ≥ 300 cells/μL as the state variable. The AUCs were 32.8% [95% CI (16.4%, 49.2%)], 66.8% [95% CI (50.6%, 83.0%)], 61.8% [95% CI (45.1%, 78.4%)], 66.2% [95% CI (50.7%, 81.6%)], 63.0% [95% CI (46.6%, 79.3%)], 61.1% [95% CI (43.8%, 78.3%)], and 43.9% [95% CI (26.6%, 61.3%)], respectively, and did not reach the 70% threshold. A comparison of these results is shown in Table 4.
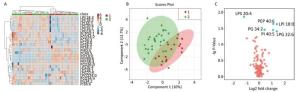
Figure 3. (A) Heat map. (B) Partial least squares discriminant analysis score chart. (C) Volcano map. Group 1 and 2 represent asthmatic patients with blood eosinophils (EOS) ≥ 300 cells/μL and < 300 cells/μL respectively. The heat map in (A) compares the metabolic profiles of glycerophospholipids in patients with blood EOS ≥ 300 cells/μL and < 300 cells/μL. The PLS-DA score plot in (B) indicates an overall difference in the metabolic glycerophospholipid profiles between the two subgroups. The volcano plot in Figure (C) shows significant differences in LPS 20:4, PEP 40:6, LPI 18:0, PG34:2, PI 40:5, LPG 22:6, and PC 34:3 between the two subgroups.
-
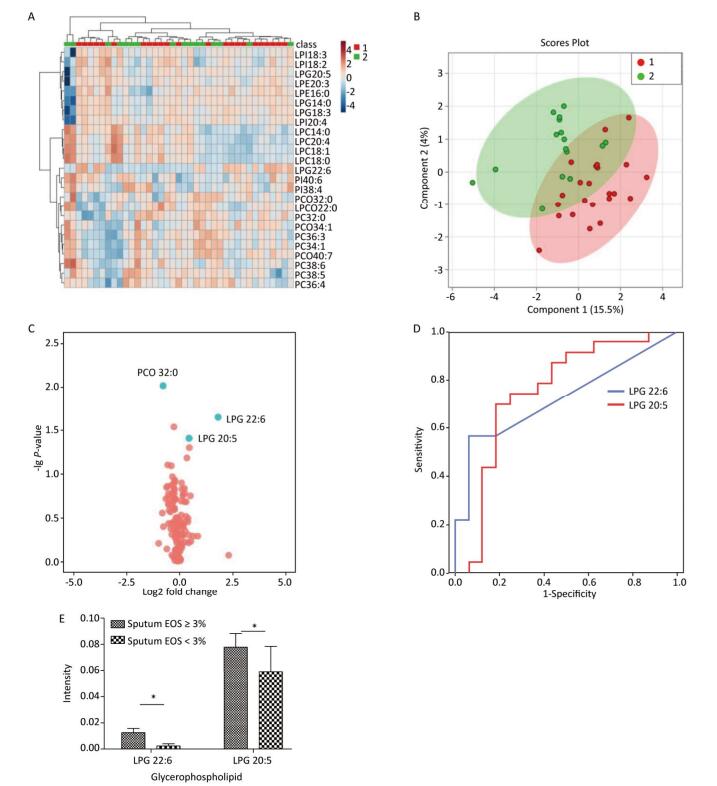
Among the 39 patients who underwent a sputum induction test, sputum neutrophils accounted for ≥ 71% of total leukocytes in 19 patients and < 71% in 20 patients (Table 3). A multivariate analysis of the serum glycerophospholipid results in the sputum neutrophilic group (≥ 71%) and sputum non-neutrophilic group (< 71%) was performed. A heat map (Figure 4A) shows the metabolic glycerophospholipid profiles in each sample; the hierarchical cluster analysis showed that there was no obvious similarity in the metabolic profiles in each group, and there was no significant difference between the two subgroups. The PLS-DA score plot (Figure 4B) showed that the two groups could not be separated by the PLS model, indicating that the difference between the two groups was not reflected in the entire metabolic glycerophospholipid spectrum. Therefore, we performed a univariate analysis. A volcano plot (Figure 4C) showed that there was no significant difference between the two subgroups.
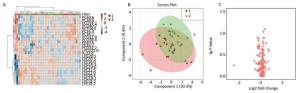
Figure 4. (A) Heat map. (B) Partial least squares discriminant analysis score chart. (C) Volcano map. Group 1 and 2 represent asthmatic patients with sputum neutrophils (NEU) ≥ 71% and < 71% respectively. The heat map in (A) compares the metabolic glycerophospholipid profiles in patients with sputum NEU ≥ 71% and < 71%. The PLS-DA score plot in (B) shows the overall differences in the metabolic glycerophospholipid profile between the two subgroups. The volcano plot in (C) shows no significant difference in the metabolic glycerophospholipid profile between the two subgroups.
Comparison of Serum Glycerophospholipid Profiles between the Sputum Eosinophilic and Non-Eosinophilic Groups
Comparison of Serum Glycerophospholipids between the Blood Eosinophilic (≥ 3%) and Non-Eosinophilic (< 3%) Subgroups
Comparison of Serum Glycerophospholipids between the Blood Eosinophilic (≥ 300 cells/μL) and Non-Eosinophilic (< 300 cells/μL) Subgroups
Comparison of Serum Glycerophospholipid Profiles between the Sputum Neutrophilic and Non-Neutrophilic Groups
-
Asthma is a heterogeneous disease with various inflammatory subtypes. According to the proportions of leukocytes in induced sputum, asthma can be classified as eosinophilic, neutrophilic, mixed, or paucigranulocytic asthma[5, 12]. Inflammatory subtypes differ in their mechanisms of action, and clinical manifestations, and treatment options[5]. Eosinophilic asthma is the most common inflammatory subtype, accounting for approximately 50% of all asthma cases. In this subtype, an imbalance in Th1/Th2, activation of Th2-type cells, and secreted Th2 cytokines such as interleukin (IL)-4, IL-5, and IL-13 are generally accepted as key factors inducing differentiation, migration, and recruitment of eosinophils to the airway and lung tissue. Eosinophils are relatively sensitive to corticosteroids. Neutrophilic asthma accounts for approximately 40% of asthma cases and is likely to be severe, refractory to therapy, and associated with chronic airway remodeling[4]. It also has a complex pathogenesis. Recent studies have suggested a relationship between neutrophilic asthma and a Th17-mediated immune response[4, 5].
Emerging metabolomics, especially mass spectrometry-based metabolomics, accurately classify diseases and disease subtypes[13-16]. Some studies have shown that glycerophospholipids may be involved in the pathogenesis of asthma[6, 17], but their level in the different asthma subtypes has not been reported. In this study, we performed a metabolomic analysis of glycerophospholipids for the main inflammatory subtypes of asthma. In total, 157 glycerophospholipids in 14 categories were analyzed, and significant differences in the metabolic glycerophospholipid profiles were found between eosinophilic and non-eosinophilic asthma. In eosinophilic asthma, when the proportion of sputum eosinophils was ≥ 3%, the level of LPG (22:6 and 20:5) was significantly increased and the area under the ROC curve was ≥ 70%. This suggests that LPG may be an important biomarker of eosinophilic asthma.
Lysophospholipids, which are produced from phospholipid molecules by either phospholipase A1 (PLA1) or PLA2, are potential lipid mediators. Lysophospholipids are monoacyl hydrolysates of diacyl glycerophospholipid precursor molecules and are called lysophospholipids because of their detergent-like ability to lyse erythrocytes[18]. In addition to changing the physical structure of the cell lipid bilayer, lysophospholipids can regulate cell signaling pathways by directly binding to G-protein-coupled receptors (GPCRs) on the membrane and indirectly affecting receptors on the membrane. The main lysophospholipids are LPA, LPS, LPG, and LPC.
Previous studies have found that LPG exerts biological effects as a lipid, and participates in tissue remodeling and wound healing processes. Migration of endothelial cells is an important component of vascular remodeling and wound healing[19]. LPG acts on human umbilical vein endothelial cells to promote chemotaxis, tubular formation, and activation of the ERK pathway[20]. In addition, like LPA, LPG has a role in promoting the proliferation of tumor cells[21].
In a previous study, we showed that the serum LPG level was significantly higher in patients with asthma than in healthy controls (unpublished data). Further studies of the inflammatory subtypes of asthma found that LPG was highly expressed in eosinophilic asthma, with ROC curve analysis showing an AUC > 70%. This suggests that LPG may be an important biomarker for eosinophilic asthma. To our knowledge, this is the first report on the LPG level in eosinophilic asthma. Th1/Th2 imbalance exists in asthma[22], and in vitro research has shown that LPG may participate in the Th2 inflammatory response in asthma[23-25] by promoting chemotaxis in natural killer (NK) cells[23-26], and that it can stimulate extracellular signal-regulated kinase (ERK) and protein kinase B activity in these cells[23]. NK cells are very important lymphocytes in the immune system, participating in and maintaining the stability of the immune environment and normal immune function. Recent studies have shown that NK cells are important effector cells in asthma, interact with T lymphocytes, and participate in promotion of the Th2 inflammatory response[26, 27]. The proportion of IL-4+ NK cells in the peripheral blood of patients with asthma is significantly higher than that in the blood of healthy controls, and correlates negatively with pulmonary function[28]. Animal studies by Wright et al. also showed that NK cells have increased IL-5 expression and promote infiltration of eosinophils after an allergen challenge; after intervention with the NK cell antibody, expression of IL-5 was significantly reduced and eosinophilic inflammation was alleviated[29]. Therefore, we speculate that LPG may increase Th2 levels by stimulating chemotaxis in NK cells, thereby promoting accumulation of eosinophils. Attraction of LPG to NK cells via chemotaxis may be inhibited by Ki16425, an LPA (1/3) selective receptor antagonist[23], whereas LPA is involved in Th2-induced inflammation in asthma by acting on the GPCRs. This suggests that LPG may exert a chemotactic effect on NK cells through Ki16425-sensitive GPCRs, thereby inducing chemotaxis of eosinophils[23].
In an in vitro study, Park et al. found that intervention with LPG can stimulate ovarian cancer (OVCAR-3) cells, regulate intracellular signals, activate phospholipase C, activate Ca2+ channels, stimulate an increase in intracellular calcium, and induce ERK and protein kinase B phosphorylation pathways[30]. Zhang et al. also found that LPG induced a concentration-dependent increase in [Ca2+] in vascular smooth muscle cells[31]. IP3R-mediated Ca2+ release can suppress IL-17 production[32], while IL-17 plays an important role in neutrophilia inflammation of asthma[33, 34]. Further study is needed to investigate the role of LPG in different inflammatory asthma subtypes through calcium signaling.
Subsequently, researchers found that the effect of LPG is closely related to formyl peptide receptor-like (FPRL)-1[21]. FPRL-1 is a classical chemokine receptor in the GPCR family. It is expressed on the surface of neutrophils, monocytes, and dendritic cells, and promotes intracellular signal transduction by conjugating with G-protein. G-protein is sensitive to pertussis toxin, thereby regulating chemotaxis and the body's resistance to pathogenic bacteria[35]. MMK-1 (a potent and specific FPRL-1 agonist found in peptide libraries) and serum amyloid A can activate FPRL-1, promoting chemotaxis of neutrophils and monocytes. After activation of FPRL-1, LPG can inhibit chemotactic migration of neutrophils and monocytes and production of IL-1β mediated by MMK-1 and serum amyloid A[21]. Further investigation is required into the possible chemotactic effect of LPG on inflammatory cells via FPRL-1 in patients with eosinophilic asthma.
The classification of the inflammatory subtypes of asthma is mostly based on cell counts in sputum, and the proportion of sputum eosinophils ≥ 3% is a well-recognized threshold for the diagnosis of eosinophilic asthma. Whether peripheral blood eosinophils can predict eosinophilic inflammation in the airway is controversial. Peripheral eosinophilia is mostly defined as eosinophils accounting for ≥ 3% of leukocytes, or as an eosinophil count ≥ 300/μL in the peripheral blood. Although peripheral blood eosinophils are associated with airway eosinophils, some studies have reported that they can suggest eosinophilic inflammation in the airway[36], while others yielded different results[37]. Therefore, in this study, we also compared subgroups with and without peripheral eosinophilia and found that although the profiles for some glycerophospholipids such as PEP 40:6, LPI 18:0, PG 34:2, and PI 40:5 differed between subgroups, the area under the ROC curve was consistently < 70%, indicating that they may not be able to predict eosinophilic inflammation accurately.
Neutrophilic asthma has attracted considerable attention in recent years. In this study, we found no significant difference in the serum metabolic glycerophospholipid profiles between neutrophilic and non-neutrophilic asthma groups.
This study has several limitations. First, it was mainly exploratory in nature, with a small sample size. Second, our study population had received prior medical treatment that might have interfered with our analysis of airway inflammation and determination of biochemical metabolites. Third, the level of glycerophospholipids in the peripheral blood in our patients resulted from a systemic response to asthma as chronic airway inflammation, and does not fully characterize the local environment of the bronchi and lungs. In the next research step, a larger sample size will be necessary for further validation of the relationship between LPG and eosinophilic asthma.
In conclusion, according to the theoretical basis of metabolomics, we used liquid chromatography- mass spectrometry in this study to obtain metabolic profiles of serum phospholipids in the different inflammatory subtypes of asthma. LPG may be involved in eosinophilic asthma. In future, the treatment of asthma is likely to develop rapidly in the direction of phenotype specificity and individualized therapy.
the Returned Overseas Chinese Scholars Startup Fund Y81484-02
the National Natural Science Foundation of China Youth Fund Project 81400017
the National Natural Science Foundation of China Emergency Management Project 81641153

 Quick Links
 DownLoad: