


HTML
-
With the increase in obesity, diabetes and other metabolic diseases, atherosclerotic cardiovascular disease (ASCVD) has been globally considered a serious public health issue. The accurate assessment of individual risk plays an important role in the prevention and management of ASCVD. As a result, accurate risk assessment tools are continuously being explored and developed[1, 2]. In China, risk prediction equations for coronary heart disease (CHD) and ischemic cardiovascular disease (CVD) were developed over 14 years ago[3]. However, with the rapid economic expansion of China in the past few decades, there were dramatic demographic changes. Thus, the CVD risk evaluation for the Chinese population needed to be updated accordingly. Recently, a new Prediction for ASCVD Risk in China (China-PAR) equation was published[4].
Since no assessment tool unique to the Chinese population initially existed, most surveys of the CVD risk in large-scale Chinese populations used foreign tools[5], which may have overestimated or underestimated the overall CVD risk[4]. To address the gap and provide timely information for the prevention and treatment of CVD in China, the present study was designed to assess the 10-year ASCVD risk score of eastern Chinese adults by using the China-PAR equation, which may more accurately reflect their current CVD risk. Additionally, the desire to discover additional ASCVD risk factors that might enhance risk assessment continues. Consequently, we also inspected the association between CVD risk score and risk factors not included in the China-PAR equation, which may provide theoretical support for precise intervention and management of CVD-associated risk factors.
-
For this study, the data were reviewed of 171, 326 adults (18-85 years) who received routine physical examinations in eastern China (Shanghai Municipality, Zhejiang Province, and Jiangsu Province) between November 2015 and May 2018. A total of 72, 129 subjects (35-74 years) without history of clinical ASCVD and with sufficient data to complete the China-PAR equation were were included in the current analysis. Ethical approval was obtained from the local ethics committee.
-
Demographic characteristics, CVD risk factors, anthropometric examinations, and blood pressure (BP) data were collected. Blood pressure was measured using an Omron automatic blood pressure meter. After at least 5 min of rest, three readings were taken at 1-min intervals and then averaged. Biochemical indicators included fasting plasma glucose (FPG), plasma uric acid (UA), liver enzymes [alanine aminotransferase (ALT), aspartate aminotransferase (AST), and alkaline phosphatase (ALP)], total cholesterol (TC), triglycerides (TG), low-density lipoprotein cholesterol (LDL-C), and high-density lipoprotein cholesterol (HDL-C). The above biochemical indicators were measured using the photoelectric biochromic principle of the automatic biochemical analyzer. Body-mass index (BMI) was calculated as weight divided by height in meters squared, waist to hip ratio (WHR) was calculated as waist circumference (WC) divided by hip circumference (HC), and WC divided by height provided the waist-height ratio (WHtR). Non-HDL-C was calculated as HDL-C subtracted from TC, and TC divided by the HDL-C equated to the TC/HDL-C ratio.
-
The estimated 10-year risk of the first ASCVD event in an individual is formally calculated as $1 - {{\rm{S}}_{10}}^{{\rm{e}}\left( {{\rm{IndX'B}} - {\rm{MeanX'B}}} \right)} $. S10 is the survival rate for ASCVD at 10 years (0.97 for men and 0.99 for women). The calculation methods of IndX'B and MeanX'B are located in the references[4]. The China-PAR equation included the following variables: sex, age, SBP, TC, HDL-C, WC, current smoking status, diabetes history, geographic region, urbanization, hypertension treatment, and family history of ASCVD. The 10-year CVD risk scores were classified into three categories: < 5% as low-risk, 5%-10% as moderate-risk, and ≥ 10% as high-risk.
-
Hypertension was defined as a systolic blood pressure (SBP) ≥ 140 mmHg and/or a diastolic blood pressure (DBP) ≥ 90 mmHg or self-reported current antihypertensive medication use; general overweight or obesity was defined as a BMI ≥ 24 kg/m2 according to Chinese standards; and abdominal overweight or obesity was defined as WC ≥ 85 cm in men and ≥ 80 cm in women, WHR ≥ 0.9 in men and ≥ 0.85 in women, or WHtR ≥ 0.5[6].
Abnormal glucose metabolism was defined as a FPG ≥ 6.1 mmol/L according to 2018 American Diabetes Association (ADA) criteria[7]. The cut-off points of dyslipidemia were TG ≥ 1.7 mmol/L, TC ≥ 5.2 mmol/L, LDL-C ≥ 3.4 mmol/L, HDL-C < 1.0 mmol/L, non-HDL-C ≥ 4.1 mmol/L, and TC/HDL-C ≥ 5.0[8]. Hyperuricemia was classified as a UA ≥ 420 μmol/L for men and postmenopausal women and ≥ 350 μmol/L for premenopausal women[9]; aspartate aminotransferase (AST) and alanine aminotransferase (ALT), markers for nonalcoholic fatty liver disease (NAFLD) and liver fat content, had no established upper limits, so we listed their mean values[10].
-
Data are expressed as numbers (percentages) or means ± SD. Statistical analysis was performed using SPSS 20.0 (SPSS Inc., Chicago, IL, USA). Categorical variables were analyzed using the Chi-square test, and continuous variables were analyzed using the t-test. The chi-square test was used for univariate analysis, and a unadjusted odds ratio (OR) with a confidence interval (CI) of 95% and probability value (P < 0.05) was used to evaluate the strength of associations between variables. Then, the bivariate logistic regression model was utilized. The 10-year CVD risk scores were transformed into dichotomous variables (< 5% as low-risk and ≥ 5% as moderate or high-risk). Other variables were also divided into 2 or three levels. Multiple logistic regression were adjusted for age, gender, traditional anthropometric indices, biochemical indicators, smoking status, basic diseases, and medication. A P-value < 0.05 was considered significant.
Participants
Data Collection
10-year CVD Risk Assessment
Definitions
Statistical Analysis
-
There were 72, 129 individuals (male/female = 63.1%/36.9%) who met all conditions required for the China-PAR equation. Basic characteristics of the individuals who satisfied the calculation conditions are presented in Supplementary Table S1 (available in www.besjournal.com). The average age of the individuals was 49.8 ± 9.6 years, all lived and worked south of the Yangtze River for at least three years, and the vast majority lived in cities (96.7%).
There were more male than female smokers (35.5% vs. 0.14%). The medical history was entirely self-reported, and 9% (male/female = 11.6%/4.7%) reported having diabetes, 1.6% (male/female = 1.4%/1.9%) reported taking statins, 12.2% (male/female = 14.6%/8.2%) reported receiving antihypertensive treatment, and 5.7% (male/female = 7.5%/2.7%) reported having a family history of ASCVD.
-
The mean China-PAR 10-year CVD risks are presented in Supplementary Table S2 (available in www.besjournal.com). The mean 10-year CVD risk score of the total population was 2.89% ± 3.38%, and the risk scores of males and females were 3.82% ± 3.76% and 1.30% ± 1.65%, respectively. The mean risk scores for the three age subgroups were 0.94% ± 1.59%, 3.48% ± 3.13%, and 8.43% ± 4.39%, respectively.
The proportion of participants in each risk category based on sex is presented in Figure 1. Of the total 72, 129 individuals evaluated, 13.9% had moderate 10-year CVD risk, and 4.7% were high-risk. The proportions of intermediate-risk and high-risk individuals in the male subgroup were 20% and 7.3%, respectively, and 3.5% and 0.3% in the female subgroup.
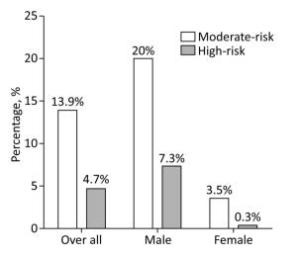
Figure 1. The proportion of moderate-risk and high-risk categories. White bar indicates the percentage of moderate-risk (5%-10%); Gray bar indicates the percentage of high-risk (≥ 10%).
-
The risk factor profile of the study population in each risk categorization is shown in Table 1. Among the risk factors used in the China-PAR, the average or proportion of individuals with a given risk factor tended to be higher in each subsequent risk classification, but the percentages of current smokers and those with a family history of ASCVD were not significantly different between the intermediate- and high-risk groups. Similar to the risk factors used in the China-PAR, the average value of additional risk factors evaluated outside of the equation also increased as the CVD risk level increased except for BMI and AST.
Characteristics < 5% (n = 58, 696) 5%-10% (n = 10, 037) ≥ 10% (n = 3, 395) Risk factors used in equation Age, y 47.3 ± 8.2 59.5 ± 7.2 63.3 ± 8.2 Male, n (%) 33, 089 (56.4) 9, 100 (90.7) 3, 306 (97.4) SBP (mmHg) 120.6 ± 14.8 139.1 ± 14.2 154.4 ± 16.2 TC (mmol/L) 4.81 ± 0.87 4.96 ± 0.94 5.12 ± 1.08 HDL-C (mmol/L) 1.51 ± 0.34 1.38 ± 0.31 1.32 ± 0.29 WC (cm) 79.7 ± 10.4 86.9 ± 8.3 88.7 ± 24.7 Current smoking, n (%) 10, 847 (18.5) 3, 969 (39.5)* 1, 365 (40.2)* Diabetes mellitus, n (%) 2, 266 (3.9) 2, 458 (24.5) 1, 799 (53.0) Hypertension treatment, n (%) 2, 959 (5.0) 3, 765 (37.5) 2, 096 (61.7) Urban, n (%) 57, 193 (97.4) 9, 514 (94.7) 3, 027 (89.2) Southern China, n (%) 58, 696 (100) 10, 037 (100) 3, 395 (100) Family history of ASCVD, n (%) 2, 483 (4.2) 1, 214 (12.1)* 437 (12.9)* Risk factors not used in equation BMI (kg/m2) 23.7 ± 3.0 25.6 ± 3.1* 25.9 ± 3.1* WHR 0.84 ± 0.08 0.91 ± 0.05 0.93 ± 0.25 WHtR 0.48 ± 0.05 0.51 ± 0.04 0.53 ± 0.15 DBP (mmHg) 75.2 ± 10.7 85.3 ± 10.8 89.7 ± 12.5 UA (μmol/L) 336.1 ± 87.1 381.8 ± 82.4 384.4 ± 85.3 FPG (mmol/L) 5.64 ± 0.94 6.51 ± 1.74 7.49 ± 2.35 TG (mmol/L) 1.51 ± 1.14 2.01 ± 1.63 2.41 ± 2.37 LDL-C (mmol/L) 2.71 ± 0.74 2.78 ± 0.81 2.83 ± 0.88 Non-HDL-C (mmol/L) 3.31 ± 0.87 3.58 ± 0.93 3.8 ± 1.09 TC/HDL-C 3.33 ± 0.88 3.72 ± 0.99 4.05 ± 1.42 ALT (U/L) 26.9 ± 20.1 29.9 ± 19.8 30.6 ± 19.5 AST (U/L) 21.8 ± 10.5 23.7 ± 10.8* 24.3 ± 10.2* ALP (U/L) 64.7 ± 18.4 70.1 ± 19.0 72.0 ± 20.4 Note.*Asterisk represents no statistical difference between the two groups. ASCVD, atherosclerotic cardiovascular disease; BMI, body mass index; WC, waist circumference; WHR, waist to hip ratio; WHtR, waist height ratio; SBP, systolic blood pressure; DBP, diastolic blood pressure; UA, plasma uric acid; FPG, fasting plasma glucose; TC, total cholesterol; TG, triglyceride; HDL-C, high-density lipoprotein cholesterol; LDL-C, low-density lipoprotein cholesterol; Non-HDL-C, calculated as TC- HDL-C; TC/HDL-C, calculated as TC divided by the HDL-C; ALT, alanine aminotransferase; AST, aspartate aminotransferase; ALP, alkaline phosphatase. Table 1. The Value of Risk Factors in the Three 10-year ASCVD Risk Categorization
The characteristics of CVD risk factors are shown in Table 2. The proportion of overweight/ obesity and metabolic abnormalities in both 10-year CVD risk categorizations were compared using a chi-square test. The results show that the intermediate/high-risk group has a higher proportion of individuals with general and abdominal overweight/obesity classifications, hypertension, hyperuricemia, and glycolipid abnormalities.
aParameters < 5% (n = 58, 696) ≥ 5% (n = 13, 432) Overweight/obesity, n(%) BMI ≥ 24 kg/m2 45.0% 71.3% WC ≥ 85/80 cm 17.2% 40.2% WHR ≥ 0.9/0.85 30.3% 61.3% WHtR ≥ 0.5 34.6% 66.7% Hypertension, n(%) SBP ≥ 140 mmHg 9.9% 55.4% DBP ≥ 90 mmHg 9.4% 38.0% Abnormal glucose metabolism, n(%) FPG ≥ 6.1 mmol/L 15.6% 51.8% Dyslipidemia, n(%) TC ≥ 5.2 mmol/L 30.0% 38.7% TG ≥ 1.7 mmol/L 28.1% 46.9% HDL-C < 1.0 mmol/L 1.7% 4.5% LDL-C ≥ 3.4 mmol/L 16.5% 21.9% Non-HDL-C ≥ 4.1 mmol/L 17.0% 27.6% TC/HDL-C ≥ 5.0 3.7% 9.4% Hyperuricemia, n(%) UA ≥ 420/350 μmol/L 18.4% 30.0% Note. BMI, body mass index; WC, waist circumference; HC, hip circumference; WHR, waist to hip ratio; WHtR, waist height ratio; SBP, systolic blood pressure; DBP, diastolic blood pressure; UA, plasma uric acid; FPG, fasting plasma glucose; TC, total cholesterol; TG, triglyceride; HDL-C, high-density lipoprotein cholesterol; LDL-C, low-density lipoprotein cholesterol; Non-HDL-C, calculated as TC-HDL-C; TC/HDL-C, calculated as TC divided by the HDL-C; WC ≥ 85 cm in men and ≥ 80 cm in women; WHR ≥ 0.9 in men and ≥ 0.85 in women; UA ≥ 420 μmol/L in men and postmenopausal women, and ≥ 350 μmol/L in premenopausal women. Table 2. The Proportion of Overweight/obesity and Metabolic Abnormalities in the Two 10-year CVD Risk Categorization
-
Univariate regression analysis showed that all risk factors, whether or not components of the China-PAR equation, were significantly associated with 10-year CVD risk. However, the adjusted OR of WC decreased to 0.91 (CI 95% = 0.83-1.00) when analyzed together with other variables (P = 0.049). Similarly, BMI was no longer associated with intermediate or high CVD risk (P = 0.057) after further adjustment for other CVD risk factors. The adjusted OR of both WHR and WHtR was 1.16 with statistically significant differences in P-values when multiple regression analysis was performed (Table 3).
Variables Simple Logistic Regression Analysis Multiple Logistic Regression Analysis β Unadjusted OR (95% CI) P Values β Adjusted OR (95% CI) P Values Risk factors used in equation Age 2.457 11.67 (11.08-12.28) < 0.001 3.670 39.26 (35.73-43.14) < 0.001 Female -2.236 0.10 (0.10-0.11) < 0.001 -4.204 0.01 (0.01-0.01) < 0.001 SBP 2.420 11.24 (10.76-11.74) < 0.001 2.574 13.12 (12.06-14.27) < 0.001 TC 0.389 1.47 (1.42-1.53) < 0.001 0.119 1.12 (1.01-1.24) 0.021 HDL-C 1.012 2.75 (2.48-3.05) < 0.001 0.512 1.66 (1.38-2.01) < 0.001 WC 1.171 3.22 (3.09-3.35) < 0.001 -0.093 0.91 (0.83-1.00) 0.049 Current smoking 1.067 2.90 (2.79-3.02) < 0.001 0.650 1.91 (1.78-2.05) < 0.001 Diabetes 2.447 11.55 (10.93-12.21) < 0.001 2.108 8.23 (7.41-9.13) < 0.001 Hypertension treatment 2.680 14.58 (13.86-15.33) < 0.001 2.358 10.57 (9.74-11.46) < 0.001 Family history of ASCVD 1.155 3.17 (2.97-3.38) < 0.001 0.606 1.83 (1.62-2.06) < 0.001 Risk factors not used in equation BMI 1.109 3.03 (2.90-3.15) < 0.001 -0.084 0.91 (0.84-1.00) 0.057 WHR 1.294 3.64 (3.50-3.79) < 0.001 0.149 1.16 (1.06-1.26) < 0.001 WHtR 1.328 3.77 (3.62-3.92) < 0.001 0.151 1.16 (1.05-1.28) 0.002 DBP 1.772 5.88 (5.62-6.15) < 0.001 0.542 1.72 (1.58-1.86) < 0.001 UA 0.645 1.90 (1.82-1.98) < 0.001 -0.030 0.97 (0.90-1.04) 0.427 FPG 1.760 5.81 (5.58-6.05) < 0.001 0.375 1.45 (1.34-1.57) < 0.001 TG 0.815 2.25 (2.17-2.34) < 0.001 0.066 1.06 (0.99-1.14) 0.069 LDLc 0.353 1.42 (1.35-1.49) < 0.001 0.226 1.25 (1.13-1.38) < 0.001 Non-HDL-C 0.618 1.85 (1.77-1.93) < 0.001 0.211 1.23 (1.09-1.39) 0.001 TC/HDL-C 0.994 2.70 (2.51-2.90) < 0.001 0.523 1.68 (1.46-1.94) < 0.001 Note. OR, Odds ratio; CI, confidence interval; ASCVD, atherosclerotic cardiovascular disease; BMI, body mass index; WC, waist circumference; WHR, waist to hip ratio; WHtR, waist height ratio; SBP, systolic blood pressure; DBP, diastolic blood pressure; UA, plasma uric acid; FPG, fasting plasma glucose; TC, total cholesterol; triglyceride; HDL-C, high-density lipoprotein cholesterol; LDL-C, low-density lipoprotein cholesterol; Non-HDL-C, calculated as TC-HDL-C; TC/HDL-C, calculated as TC divided by the HDL-C. Table 3. Simple and Multiple Regression Analysis of Risk Factors for 10-year ASCVD Risk
The adjusted ORs of TC and HDL-C were 1.12 (CI 95% = 1.01-1.24) and 1.66 (CI 95% = 1.38-2.01), and the adjusted ORs of LDL-C, non-HDL-C, and TC/HDL-C were 1.25 (CI 95% = 1.13-1.38), 1.23 (CI 95% = 1.09-1.39), and 1.68 (CI 95% = 1.46-1.94), respectively, which are all higher than that of TC. FPG and DBP were significantly associated with CVD risk with adjusted ORs of 1.45 (CI 95% = 1.34-1.57) and 1.72 (CI 95% = 1.58-1.86), respectively. The risk factors of UA and TG were excluded from the binary logistic regression model when analyzed together with other variables (P-values were 0.427 and 0.069, respectively) (Table 3).
Participants Characteristics
10-year CVD Risk Score
The Value and Characteristics of Risk Factors in Each Risk Categorization
Association between the Risk Factors and CVD Risk
-
This is a large-scale study to estimate the 10-year CVD risk using the China-PAR equation, which is a newly released CVD risk prediction tool for the Chinese population. In addition, the association between specific risk factors and overall CVD risk was explored. Our findings can be summarized as follows: 1) men are more likely than women to have intermediate/high 10-year CVD risk; 2) WHR, WHtR, non-HDL-C, and TC/HDL-C are significantly associated with 10-year CVD risk.
Different CVD risk prediction models obtain different absolute risk values[11]. Because this is the newly large-scale study to estimate the 10-year CVD risk using the China-PAR equation, it is not possible to compare the absolute risk values with those of other studies. Nevertheless, the proportion of participants in each risk category is comparable across different studies. The Community Intervention of Metabolic Syndrome in China (CIMIC) classified 26.9% of participants as moderate-risk and 18.2% as high- or very-high-risk[12]. In the current study, 13.9% of individuals were moderate-risk, and 4.7% were high-risk. The reason for this difference is related to the regional differences in the study populations. CIMIC was a national survey, but participants in this study were all from south of the Yangtze River where there is a lower incidence of CVD than in the north[4]. In addition, the population selected in this study consisted of individuals who participated in routine physical examinations, often had higher incomes, and had access to superior medical welfare and resources. As a result, the observed proportion of individuals in the moderate/high-risk category was lower in this study.
In this study, 27.3% of males had moderate/high 10-year CVD risk, which is significantly higher than 3.8% of females. The huge difference of CVD scores between men and women might be related to gender heterogeneity of CVD risk factors. The proportion of male smokers and diabetes were significantly higher than that of females in the present study. Other than that, males are consistently more susceptible to CVD than females[13]. The observed ASCVD event rates in the CIMIC study were 4.5% in men and 2.8% in women[4]. The sex differences of CVD prediction risk calculated using predictive tools were also similar to the above incidence of ASCVD events[5, 14]. As previously mentioned, the individuals included in this study have relatively stable jobs and incomes. However, the men in particular also suffer from the negative consequences of a modern lifestyle. Men are more likely to smoke, consume high-calorie foods, have more sedentary time and less exercise, and withstand enormous work stressors. These extragenetic factors contribute substantially to the higher CVD risk of men[15]. Therefore, sex-specific prevention and treatment strategies for CVD are needed.
BMI is a widely used anthropometric index of overweight/obesity categorizations, but it can only reflect overall body mass and not body fat distribution. In addition, the ability of BMI to distinguish between fat and muscle is also weak, especially for Asian populations[16]. Thus, the China-PAR equation does not include BMI[4]. Alternatively, many studies have revealed that abdominal obesity indices are superior to BMI in predicting CVD risk[17, 18]. As a result, the China-PAR equation includes WC in the formula for the first time[4].
Although this study found that WHR is significantly associated with CVD risk, some studies show that WHR has the weakest association with CVD risks when compared to WC and WHtR[19]. This inconsistency may be related to the nature of WHR itself because it may remain constant when weight fluctuates. Nonobese individuals thus theoretically have the same WHR as obese ones[20]. This characteristic of WHR necessitates future prospective research to determine its true relationship to CVD risk. In comparison to WC and WHR, WHtR takes variations in body size more into consideration. Existing research shows that WHtR is strongly associated with CVD risk. Some studies have demonstrated that WHtR is superior to WC in identifying CVD risk in both Asian and Caucasian populations[21, 22]. Some meta-analyses further support these findings[23, 24]. The results of this study also show that WHtR is more strongly associated with CVD risk than WC. This finding implies that WHtR is potentially a favorable screening tool for the management of CVD risk. It is thus beneficial to promote the simple public health message 'keep your WC to less than half your height' in clinical practice.
Dyslipidemia is a strong predictor of CVD, making the measurement of lipoproteins a primary tool for assessment and monitoring of CVD. TC and HDL-C are commonly used conventional lipid parameters and are key risk factors used in established CVD risk prediction tools including the China-PAR equation[4]. Although LDL-C and TG levels are not included in the equation, they are associated with cardiovascular events[25, 26]. In the present study, LDL-C amount but not TG level was significantly associated with CVD risk. Adjustment for other lipid parameters may weaken the level of association between fasting TG levels and CVD risk because it may not correlate as strongly with remnant lipoproteins with regards to the non-fasting TG concentration[27]. The inconsistent results of TG-lowering agents on CVD outcomes indicate the uncertainty of a causal role of TG levels in CVD development[28]. In fact, lowering LDL-C to the recommended level does not necessarily reduce the risk of CVD, which indicates that elevated levels of other lipoprotein subclasses may partially explain CVD risk[29]. Consequently, the relationship between some nontraditional lipid profiles and CVD risk has become a subject of intense study in recent years.
Plasma TC is the sum of several classes of lipoproteins, and subtracting HDL-C from TC equates to non-HDL-C, which is an index of cholesterol in all apoB-containing atherogenic lipoproteins. Several studies have confirmed that non-HDL-C is superior to LDL-C in predicting CVD[30]. In this study, non-HDL-C was significantly associated with CVD risk, which is consistent with the findings of previous studies. Currently, some guidelines use non-HDL-C as a secondary control target for dyslipidemia[31]. TC/HDL-C is a simple indicator of atherogenic particle burden and may provide information related to particle concentration and size[32]. The latest research also suggests that TC/HDL-C may offer additional information beyond what LDL-C and non-HDL-C provide[33]. TC/HDL-C has been strongly associated with CVD risk[30], which was also observed in this study. Therefore, TC/HDL-C and non-HDL-C, easily obtainable atherogenic markers, may be superior to the single lipid profile in assessing CVD risk.
Not surprisingly, FPG and DBP were also significantly associated with CVD risk in this study. Because diabetes history and SBP have been added to the China-PAR equation, the close relationship between both FPG and DBP and CVD is not repeated here. This study failed to demonstrate a significant association between hyperuricemia and CVD risk (OR = 0.97 and P = 0.427). Although the relationship between UA and CVD is a widely researched topic, the results are still controversial. Several large-scale studies and meta-analyses showed that increased serum UA was associated with coronary heart disease (CHD) or increased mortality[34]. In contrast, other studies have been unable to confirm such associations[35]. The inconsistent findings may result from the fact that the circulating UA concentration is highly impacted by other CVD risk factors, such as adiposity, diabetes, and hypertension[36]. In aggregate, the question of whether UA is an independent CVD risk factor remains unanswered, and more research is needed to explore the relationship[37].
Our study has several limitations. First, this study was not a strict epidemiological investigation, and all participants included were individuals who regularly receive physical examinations, so we could not generalize the findings to the wider Chinese population. In China, routine physical examinations are not covered by government health insurance. Many enterprises and institutions organize their employees each year for routine physical examinations as a kind of welfare benefit. Therefore, most of the research subjects in this study belong to occupational groups, who still have certain representativeness in the sample. Second, this is not a longitudinal study, so it cannot show a causal association between risk factors and CVD risk score. An additional large, prospective epidemiologic study is needed to confirm this finding. Furthermore, it is also worth studying whether interventions targeting these risk factors can reduce the incidence of CVD.
In conclusion, we identified a considerable proportion (27.3%) of men in eastern China who had moderate/high 10-year CVD risk according to the China-PAR equation. Thus, sex-specific prevention and treatment strategies for CVD are needed in the male population. In addition, the results of this analysis demonstrate that certain new anthropometric measures of the body adiposity index (WHR and WHtR) and nontraditional lipid profiles (non-HDL-C and TC/HDL-C) have higher associations with CVD risk than BMI, WC, and TC. These CVD risk factors are easily determined in routine physical examinations at no additional cost and may be effective in supplementing and improving CVD risk management.
-
In the preparation and implementation of this study, we get a lot of selfless help. All of our authors thank all those who have helped us.
-
No conflicts of interest to disclose.
Shanghai Changning District Health Planning Commission Project 20144Y007
National Natural Science Foundation of China 81170738
Shanghai Changning District Science and Technology Commission Fund Project ZNKW2016Z03

 Quick Links
 DownLoad: