


HTML
-
Heat stress affects chicken immunity, causing tissue damage and thus reducing performance. When tissues and cells suffer thermal stress, heat stress protein (HSP) expression increases dramatically, thereby enhancing cellular survival. Small heat shock proteins (sHSPs) range in size from 12 to 42 kD and contain an α-crystalline domain. They have been proposed to play roles in the first line of resistance to various stresses in an ATP-independent manner[1]. Some scholars have studied the function of sHSPs in cellular protection, such as in inhibiting apoptosis and binding cytoskeleton proteins[2-4]. Eleven sHSP genes have been entered in the GenBank database (NCBI): HSPB1 (HSP27), HSPB2 (myotonic dystrophy protein kinase-binding protein, MKBP), HSPB3, HSPB4 (αA-crystallin), HSPB5 (αB-crystallin), HSPB6 (HSP20, p20), HSPB7 (cardiovascular heat shock protein, cvHsp), HSPB8 (HSP22), HSPB9 (HSP25), HSPB10 (outer dense fiberof sperm tails, ODF), and HSPB11 (C1orf41). Some studies have shown that HSPB1 is an important pro-survival protein in mammalian cells, which enhances the catalytic activity of protease particles and resists the apoptosis of cells[5, 6]. HSP27 inhibits apoptosis by either inhibiting the release of mitochondrial cytochrome c or by binding directly to cytochrome c[7]. In our previous research, Luo et al. used genome-wide expression profile chip technology and found that application of heat stress to the chicken brain, liver, and leg muscle, significantly induced many genes in the HSP family, where HSPB9 was the most significant differentially expressed gene[8]. The chicken HSPB9 gene has 993 bp and is located on chromosome 27. The HSPB9 mRNA sequence contains an open reading frame of 582 bp with no intron sequence and 194 encoded amino acids (obtained from the NCBI Gallus gallus genome database), with the characteristic structure of the sHSPs, a conserved C-terminal α-crystallin domain of 80-100 residues that has an IgG-like fold and an N-terminal domain that is more variable in sequence and length[9, 10]. The dynamic and open structure of the sHSPs, combined with the presence of accessible hydrophobic surfaces and polar C-terminal extensions, are essential for their chaperone-like properties[11]. This includes the in vitro ability to bind unfolded proteins and keep them in solution. Bound proteins are preserved in a folding-competent state and can be refolded in conjunction with HSP70[12-14].
Chicken HSPB9 is not expressed in the absence of stress and is highly induced by heat shock in all the tissues in the developing chicken embryo[15]. According to multiple alignments and phylogenetic trees, the α-crystallin domain in sHSPs is highly conserved, but there are also distinct variations in the N-terminal domain among species. In particular, the N-termini of avian sHSPs differ significantly from those of human, mouse, salmon, and frog sHSPs. Thus, HSPB9 and HSP30CL in avian species are quite different from those of other vertebrates[1]. Katoh et al. found that overexpression of HSPB9 in HeLa cells promotes the formation of inclusions, whereas the expression of HSPB1 did not induce inclusions[16]. Inclusion formation triggered collapsed mitochondrial potential and cellular quiescence, and deactivated apoptosis[17]. Thus, HSPB9 has functions that differ from those of other sHSPs during the formation of protein aggregates. Additionally, in mammals, HSPA1 and HSPA6 are important members of the HSP70 family, but no information on the HSPA1 and HSPA6 genes in chickens was found in the NCBI database. The mammalian HSPA1 and HSPA2 have high sequence similarity; therefore, we have selected the currently published chicken HSPA2 gene as one of the indicators of heat stress protein detection. The HSP70 family member HSPA2 can bind to misfolded proteins to prevent aggregate generation[2-4]. Therefore, these HSPs do not predominantly accumulate in the aggresomes[16]. HSP70 also suppresses the cleavage of proapoptotic protein Bid and cytochrome c release from mitochondria through inhibition of JNK activity[18]. It can bind to the apoptosis-inducing factor (AIF) leading to the inhibition of caspase-independent apoptosis[19]. HSPB9 might preferentially bind to non-native proteins and maintain them in a fold-competent state, ready for refolding by HSP70 systems, such as HSPB1[12, 20]. Chichester et al. found that insulin entering the body could result in the overexpression of HSP70 to inhibit cell apoptosis by inhibiting the activation of caspase-3 and caspase-9[21]. Other researchers also found that down-regulation of HSP70 promoted the apoptosis of the cells[22]. Radons and Inoue et al. verified that the interaction of HSP70 with cells was closely related to the mitochondrion, implying that HSP70 would primarily regulate cell apoptosis via the mitochondrion pathway[23, 24]. We found that both HSPA2 and HSPB9 are highly expressed during germ cell development and in sperm function. Moreover, HSPA2 and HSPB9 along with HSPB1 play an important role in apoptosis. To date, three signal transduction pathways have been identified that lead to cell apoptosis: the death receptor signaling pathway, mitochondrion pathway, and the stress pathway of the endoplasmic reticulum (ER). All three pathways involve the activation of caspases, indicating that caspase is a key factor in many apoptosis regulatory pathways. In particular, caspase-3, a key protease during cell apoptosis, is activated via the proteolysis-induced removal of a sequence at the amino terminal, and subsequently activates DNA fragmentation factor and endonuclease, which in turn decrease the cytoskeletal proteins and nucleoproteins, thereby facilitating cell apoptosis[25, 26]. In apoptotic cells, caspase-3 can be activated by extrinsic (death ligand) and intrinsic (mitochondrial) pathways[27, 28]. Exogenous activation triggers the signature caspase cascade of apoptotic pathways, led by caspase-3[29]. During intrinsic activation, cytochrome c from mitochondria combined together with caspase-9, apoptotic activating factor 1 (Apaf-1), and ATP process procaspase-3[30-32]. The Inhibtor of apoptosis family of proteins (IAPs family), upstream of caspase-3, can inhibit caspase-3[33]. Bcl-2 is located in the mitochondrial outer membrane, and the proapoptotic proteins Bax and Bak in the family act to promote the permeabilization and release of cytochrome c and ROS by acting on the mitochondrial membrane to induce the caspase cascade signal of apoptosis[34]. Therefore, the expression of caspase-3 is closely associated with cell apoptosis.
To better understand the biological function and expression patterns of HSPB9, we knocked down HSPB9 and overexpressed HSPB9 to varying degrees in a chicken fibroblast cell line to identify its influences on HSPB1 and HSPA2 expression and apoptosis. Therefore, our aim was to explore whether HSPB9 is preferentially expressed under heat stress and affects the expression of other HSP genes as well as explore the effect of HSPB9 overexpression on apoptosis. This would provide a theoretical basis for the breeding of avian stress-resistant traits.
-
Based on the sequence of the chicken HSPB9 gene (cHSPB9, Gene ID: 428310) published in GenBank (http://www.ncbi.nlm.nih.gov/), we constructed interference fragments (Table 1) with different target locations (siRNA-cHSPB9-276, siRNA-cHSPB9-344, and siRNA-cHSPB9-809) and a negative control (siRNA-NC). The chicken HSPB9 gene coding region (CDs: 520 bp) was amplified by PCR (Table 2), and then connected and transformed by pEASY-T1 Simple Cloning Reagent (TAKARA, Japan). We used a pcDNA3.1(+) plasmid to build the chicken HSPB9 overexpression vector (pcDNA3.1-cHSPB9). According to the genetic sequences published by the NCBI database for HSPB1 (Gene ID: 396227), HSPA2 (Gene ID: 423504), and caspase-3 (Gene ID: 395476), other primers were designed separately.
mRNA Target Sense/anti-sense siRNA Sequence (5'-3') siRNA-cHSPB9-276 sense GGAUGCACCUCGCUCCAUUTT anti-sense AAUGGAGCGAGGUGCAUCCTT siRNA-cHSPB9-344 sense CCGCACGCAGAGACCAUCUTT anti-sense AGAUGGUCUCUGCGUGCGGTT siRNA-cHSPB9-809 sense GCAGCCAAGGAUGGAGCUGTT anti-sense CAGCUCCAUCCUUGGCUGCTT siRNA-NC sense UUCUCCGAACGUGUCACGYTT anti-sense ACGUGACACGUUCGGAGAATT Table 1. siRNA-cHSPB9 Interference Fragment Package Information
Genes Primer Sequence (5'-3') Ta Opt (℃) Product Length (bp) CDs-cHSPB9-F CACAACGCTCCCAACTCC 61.2 761 CDs-cHSPB9-R CGATGCAGACCGTTGTTCC Table 2. The Amplified Primer of Chicken HSPB9 Gene CDs
-
The anchorage-dependent cells, chicken fibroblast cell lines (DF-1), were cultured in DMEM culture medium (Gibco) and supplemented with 10% fetal bovine serum (FBS, Invitrogen) at 37 ℃ with 5% CO2. Chicken DF-1 cell line was treated at 45 ℃ heat stress (5% CO2) for 0, 1, 2, 3, and 6 h, or transfected after cultivation for 45 h at 37 ℃ and then 3 h at 45 ℃.
-
Cells were plated at 1 × 10⁵ cells/well in 6-well plates. Transfection of siRNAs and pcDNA3.1-cHSP25 into cells was performed using Lipofectamine 3, 000 (Invitrogen) and Opti-MEM culture medium, respectively.
-
Total RNA was extracted from the cells using TRIzol (TAKARA) reagent and reverse-transcribed to cDNA using the PrimeScript® 1st Strand cDNA Synthesis Kit. The reaction mixtures included cDNA, primers (Table 3), ddH2O, and SYBR® Green Realtime PCR Master Mix, which were added into a 96-well real-time PCR plate with three repetitions and processed using the qPCR procedure.
Genes Primer Sequence (5'-3') GenBank Registration Number Product Length (bp) HSPB9-F AGAGACCATCTTCAGCGAGC NM_001010842.2 177 HSPB9-R TTCTTCACATCCTGGCAGACG HSPB1-F CGGCAAACACGAGGAGAA NM_205290.1 139 HSPB1-R GGCCTCCACTGTCAGCATC HSPA2-F GCGCCAGGCCACCAAAGATG NM_001006685.1 135 HSPA2-R GCCCCCTCCCAAGTCAAAGATG Caspase-3-F CCATGGCGATGAAGGACTCT NM_204725.1 179 Caspase-3-R CATCTGGTCCACTGTCTGCT GAPDH-F CGTTGACGTGCAGCAGGAACACT NM_204305 110 GAPDH-R CTTTGCCAGAGAGGACGGCAGG Table 3. Primers of Fluorescence Quantitative PCR for Target Genes and Internal Reference Genes
-
Protein was harvested from chicken fibroblast cells using a DNA/RNA/Protein Isolation Kit (OMEGA). Protein concentrations were quantified using a BCA Protein Assay Kit (Thermo). Equivalent amounts of proteins were separated by 8% SDS-polyacrylamide gel electrophoresis and transferred onto PVDF membranes. The membranes were blocked with 5% non-fat dried milk in PBST buffer (PBS, pH 8.0, and 0.1% Tween 20) for 90 min at room temperature and then incubated with the HSPB9 or caspase-3 primary antibody (Invitrogen, 1:1, 000) overnight at 4 ℃. Next, they were incubated with the secondary antibody (Invitrogen, 1:30, 000 dilution d for 60 min at 37 ℃. The reactive bands were measured with an ECL image-detecting system.
-
Apoptosis was detected using the One Step Tunel Apoptosis Assay Kit (Beyotime) according to the manufacturer's instructions. Anchorage dependent cells were washed with PBS, then fixed with 4% paraformaldehyde for 30 min. Next, the cells were washed with PBS again and incubated with 0.3% Triton X-100 PBS for 5 min at room temperature. After washing twice with PBS, the cells were incubated with Tunel solution, avoiding light for 60 min at 37 ℃. After washing with PBS three times, we used a fluorescence microscope to observe the cells under 450-500 nm excitation wavelength and 515-565 nm emission wavelength (green fluorescence).
-
Cells were collected at a rate of (1-5) × 106 per mL. After washing with PBS, we used ethidium bromide (PI), Annexin V Binding Buffer, and other relative reagents to incubate the cells, avoiding light, and then used flow cytometry to detect apoptosis.
-
Statistical analysis of the data was performed using t-test by Statistical Product and Service Solutions 24.0 software (SPSS 24.0, IBM, Chicago, USA) and GraphPad Prism (7.04). Differences were considered statistically significant at P < 0.05. Data are representative of three independent experiments performed in triplicate.
Reagents
Cell Culture and Heat Stress
Cell Transfection
RT-qPCR Assays
Western Blot Assays
Tunel Assays
Flow Cytometry Assays
Statistical Analysis
-
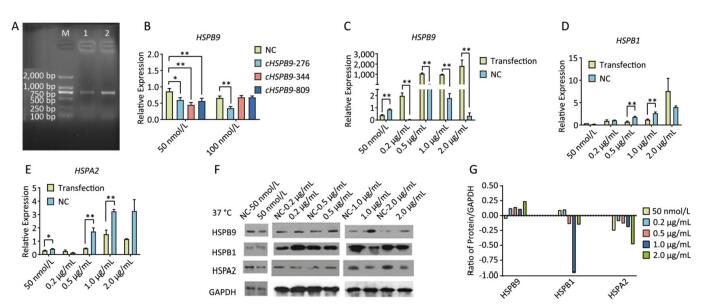
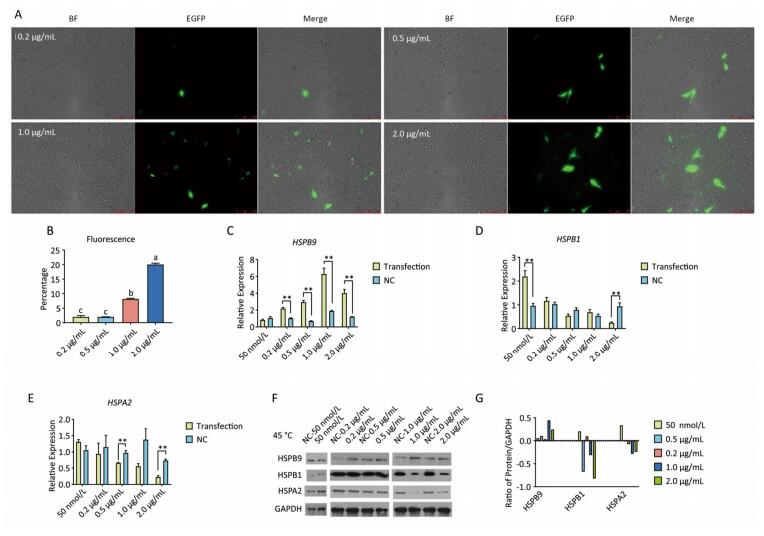
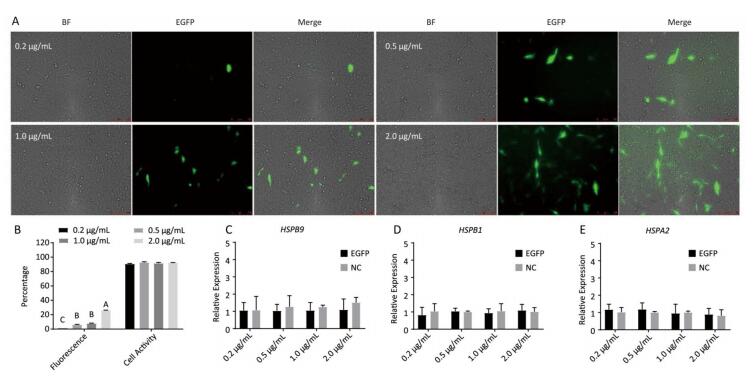
Chicken fibroblast cells (DF-1) in 24-well plates were transfected with HSPB9 overexpression vector DNA (the pcDNA3.1-cHSPB9 plasmid was verified by CDs-cHSPB9-F/R primers as shown in Figure 1A) and pcDNA3.1-EGFP, at DNA concentrations ranging from 0.2 μg/mL to 2.0 μg/mL and then cultivated at 37 ℃ for 48 h. Using a fluorescence microscope, we found that the number of fluorescent cells increased at moderate and high concentrations (0.5-2.0 μg/mL) of pcDNA3.1-EGFP (Figure 1A, B), but the cell activity and the expression of HSPB9, HSPB1, and HSPA2 genes were not affected (Figure 1B, C, D, E). The cells were transfected with 50 nmol/L and 100 nmol/L HSPB9 interference fragments. We found that the optimal interference was obtained by using 50 nmol/L siRNA-cHSPB9-344 interference fragment; the interference efficiency was approximately 50% as detected by RT-qPCR (Figure 2B). In addition, expression of the HSPB9 gene increased with increasing concentrations of HSPB9 overexpression vector DNA, as detected by RT-qPCR (Figure 2C). We also found that as HSPB9 gene expression increased, HSPB1 and HSPA2 gene expression significantly decreased in the 0.5 μg/mL and 1.0 μg/mL groups (Figure 2D, E). We immunodetected the HSPs and determined that HSPB9 increased by a relatively smaller degree (from 0.5 to 2.0 μg/mL), HSPA2 expression decreased in all groups, and HSPB1 expression drastically reduced in the 0.5-2.0 μg/mL groups (Figure 2F, G). This indicates that under non-heat stress, HSPB1, which is also a sHSP, was more sensitive to negative HSPB9 regulation than that of HSPA2.
Figure 1. The pcDNA3.1-EGFP vector transfected into chicken DF-1 cells at concentrations ranging from 0.2 μg/mL to 2.0 μg/mL. (A) The cells were detected under fluorescence microscope (200×); (B) the proportion of fluorescent cells (different superscript English letters indicate that P < 0.01) and cell activity; and (C-E) the HSPB9, HSPB1, and HSPA2 gene transcription levels in different concentrations (0.2-2.0 μg/mL) of pcDNA3.1-EGFP transfection (in contrast with the negative control, the pcDNA3.1 empty vector).
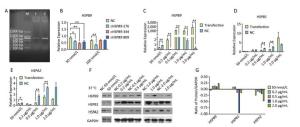
Figure 2. Under non-heat stress, HSPB9 inhibited HSPB1 and HSPA2 gene expression. (A) Verification of HSPB9 gene in the pcDNA3.1-cHSPB9 plasmid (M: 2, 000 bp Marker; 1: PCR recovery product of chicken HSPB9; 2: PCR product of pcDNA3.1-cHSPB9 plasmid). (B) The transcriptional level of chicken HSPB9 in DF-1 cells transfected with HSPB9 interference fragments (cHSPB9-276, cHSPB9-344, and cHSPB9-809 compared to the negative control, siRNA-NC) at concentrations of 50 nmol/L and 100 nmol/L. (C, D, E) HSPB9, HSPB1, and HSPA2 gene transcription levels after transfection with different concentrations (0.2-2 μg/mL) of pcDNA3.1-cHSPB9. All the RT-qPCR data are presented as mean ± SE, n = 6, *P < 0.05, **P < 0.01 versus the negative control group. (F) Western blotting for HSPB9, HSPB1, and HSPA2 in different transfection groups. (G) The expression change trend of the HSPB9, HSPB1, and HSPA2 proteins. Subtracting negative control (NC) group values from the transfection group yield values shows that the higher (than zero) the value, the higher was the rise, while the lower (than zero) the value, the higher was the decrease.
-
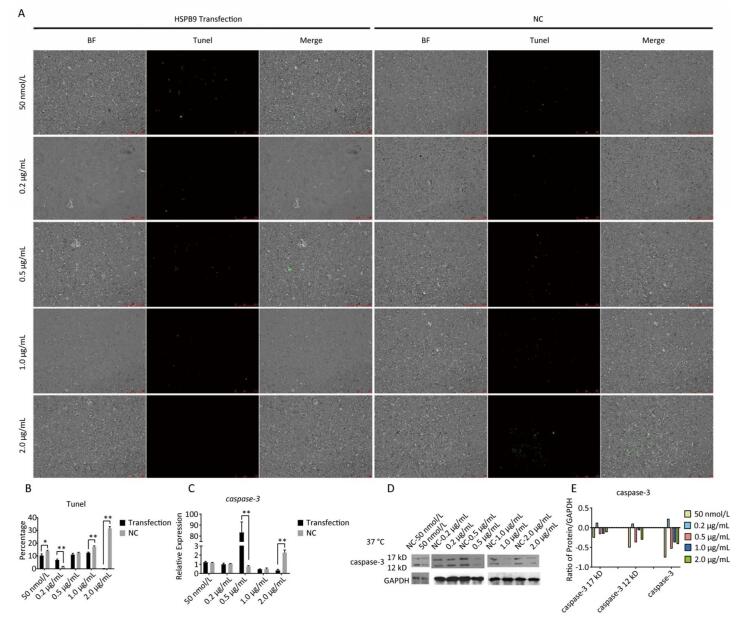
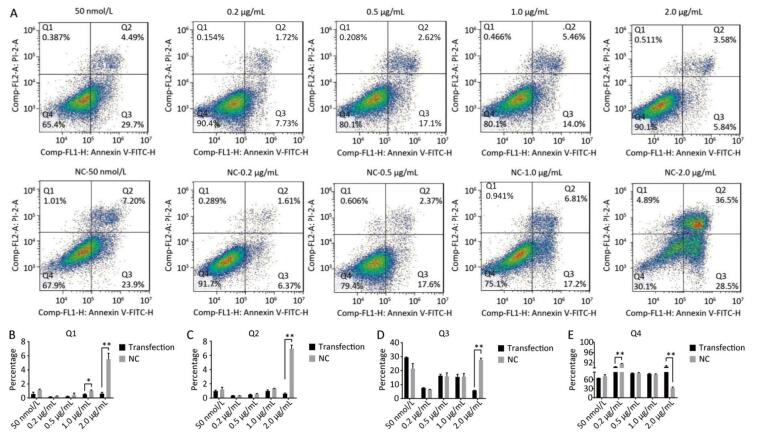
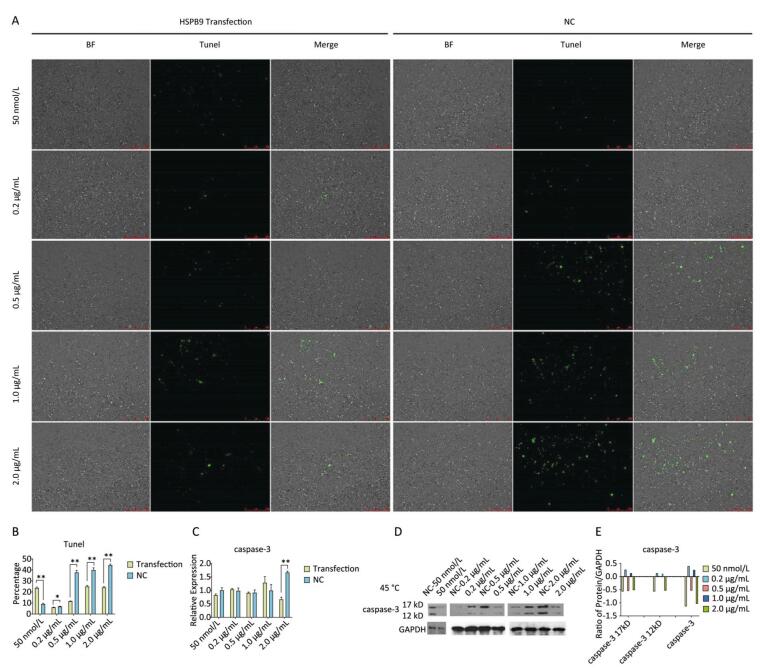
Using Tunel assay, we found that the number of apoptotic cells increased in the 0.2 μg/mL group but reduced in the higher-concentration group (1.0-2.0 μg/mL) (Figure 3A, B). We also detected the transcript levels of caspase-3 and found that in the 0.5 μg/mL group, caspase-3 gene expression drastically increased, but in the 2.0 μg/mL group, it significantly decreased (Figure 3C), which is consistent with the results of the Tunel assay. In the Western blot assay, we found that caspase-3 was degraded into two subunits of 17 kD and 12 kD and showed a decreasing trend (Figure 3D, E) after the 0.2 μg/mL group, in which caspase-3 expression increased with a small peak. Flow cytometry assay showed that the proportion of early-stage apoptotic cells significantly increased in the 0.2 μg/mL group (Figure 4A, D), while the proportion of living cells significantly decreased (Figure 4E). The results of flow cytometry were consistent with the results of the western blot assay. As HSPB9 expression reached its highest level (2.0 μg/mL), the proportions of dead cells, late-stage apoptotic cells, and early-stage apoptotic cells significantly decreased (Figure 4B, C, D), while the proportion of living cells significantly increased (Figure 4E). To summarize, under non-heat stress, with the increasing concentration of negative control (pcDNA3.1-EGFP vector), the apoptotic cells or death cells increased gradually. However, HSPB9 overexpression in low levels (0.2-0.5 μg/mL) promoted early-stage apoptosis, whereas HSPB9 overexpression protected the cells from apoptosis.
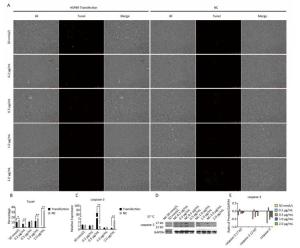
Figure 3. The effect of HSPB9 on cell apoptosis under non-heat stress condition. (A) Tunel assay was used to test the apoptosis of DF-1 cells in each transfection group (100×). (B) The proportion of fluorescent cells in Tunel assay in different groups. All the cell data are presented as mean ± SD, n = 3, *P < 0.05, **P < 0.01 versus the negative control group (NC). (C) qRT-PCR was used to detect transcription levels of caspase-3. All the RT-qPCR data are presented as mean ± SE, n = 6, *P < 0.05, **P < 0.01 versus the negative control group. (D) Western blotting was used to detect changes in caspase-3 protein level. (E) The change in gray value of caspase-3 protein. When the negative control (NC) group value is subtracted from the transfection group, the larger the value (more than zero), the higher was the rise, and the smaller the value (less than zero), the higher the decrease.

Figure 4. Cell apoptosis was detected by flow cytometry. (A) FACS dot-plot of different groups. (B) Q1 shows death cell. (C) Q2 shows later-stage apoptotic cells. (D) Q3 shows early-stage apoptotic cells. (E) Q4 shows living cells. All the apoptosis data are presented as mean ± SD, n = 3, *P < 0.05, **P < 0.01 vs. the negative control group (NC).
With HSPB9 overexpression, HSPB9 moderately suppressed expression of other HSP family members. When HSPB9 was overexpressed at the highest level, it downregulated caspase-3 expression, protecting cells from apoptosis.
-
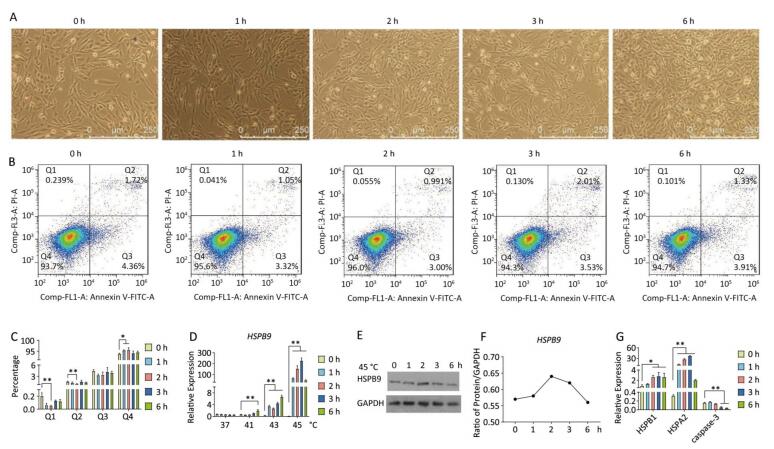
Under heat stress of 45 ℃, the number of abnormal or dead cells showing bright spots under the microscope increased. The number of cells decreased under 45 ℃ heat stress for 3 h, while cell proliferation was recovered at 45 ℃ at 6 h (Figure 5A). HSPB9 was expressed at a high level under 45 ℃ heat stress from 2 to 3 h (Figure 5D). As the heat stress continued, HSPB1 transcriptional levels gradually rose, HSPA2 transcriptional levels rose until they began to fall at 6 h, and caspase-3 transcription levels declined significantly from 3 to 6 h (Figure 5G). From the flow cytometry assay, we found that the proportions of dead cells and late-stage apoptotic cells declined significantly under 45 ℃ heat stress for 2 h, while the proportion of living cells was significantly increased at the same time (Figure 5B, C). We speculated that nearly all HSPs, especially HSPB9, were increased, and the highest expression peaks under 45 ℃ heat stress for 3 h, led to a significant decrease in caspase-3 in the later period of heat stress (3-6 h) and induced negative feedback to adjust the high level of HSPs and reduced expression at 6 h.
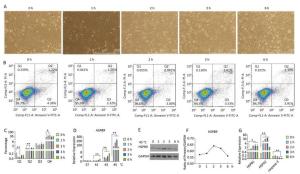
Figure 5. The effect of heat stress on the chicken DF-1 cells. (A) Cell morphology of the chicken DF-1 cell line at 45 ℃ heat stress for 0, 1, 2, 3, and 6 h (200×). (B) FACS dot-plot of different groups. (C) Flow cytometry assay was used to detect the apoptosis of cells under 45 ℃ heat stress. All the cell data are presented as mean ± SD, n = 3, *P < 0.05, **P < 0.01 versus the negative control group (NC). (D) HSPB9 transcription level changes at different temperatures (37, 41, 43, and 45 ℃) and time. All the RT-qPCR data are presented as mean ± SE, n = 6, *P < 0.05, **P < 0.01 versus the negative control group. (E, F) Western blot assay was used to detect changes in HSPB9 protein levels under 45 ℃ heat stress. (G) qRT-PCR was used to detect transcription levels of HSPBA, HSPA2, and caspase-3 under 45 ℃ heat stress.
-
Under a fluorescence microscope, we found that at moderate and high concentrations (0.5-2.0 μg/mL), the number of fluorescent cells increased under 45 ℃ heat stress for 3 h (Figure 6A, B). In contrast to the non-heat stress state, only HSPB9 overexpression in 2.0 μg/mL group inhibited both HSPB1 and HSPA2 expression under heat stress (Figure 6C-G). We inferred that owing to the inhibition of caspase-3 expression by all the HSPs expressed at high level under heat stress, HSPB1 and HSPA2 are difficult to be inhibited unless HSPB9 is expressed at a higher level (2.0 μg/mL). Although HSPB9 expression of the interference group was not expected to achieve significant levels under heat stress, HSPB1 expression increased significantly after HSPB9 was disturbed. The expression of HSPB1, which is the same as that of HSPB9 for sHSPs, increased when HSPB9 was expressed inadequately. Only high expression level of HSPB9 inhibited HSPB1 and HSPA2 expression under heat stress.

Figure 6. Under heat stress, HSPB9 inhibited other gene expression of the heat stress protein. (A) The pcDNA3.1-EGFP vector was transfected into chicken DF-1 cells ranging from 0.2 μg/mL to 2.0 μg/mL. and cultivated for 45 h at 37 ℃ before 3 h at 45 ℃ (200×). (B) The proportion of fluorescent cells after transfection (different superscript English letters indicate that P < 0.01). (C, D, E) qRT-PCR was used to detect HSPB9, HSPB1, and HSPA2 gene transcription levels in different transfection groups after heat stress. (F, G) Western blot tests for HSPB9, HSPB1, and HSPA2 in different transfection groups after heat stress. Subtracting negative control (NC) group values from the transfection group shows that the greater (than zero) the value, the higher the rise, while the smaller (than zero) the value, the greater the decrease. All the RT-qPCR data are presented as mean ± SE, n = 6, *P < 0.05, **P < 0.01 vs. negative control group.
-
Tunel assay showed that with the negative control concentration of transfection increasing, the apoptotic cells or death cells were increased gradually, but the number of apoptotic cells markedly decreased at a high level of overexpression of HSPB9 (Figure 7A, B). We also detected the transcript levels of caspase-3 and found that in the 2.0 μg/mL group of pcDNA3.1-HSPB9 expression vector, caspase-3 gene expression significantly decreased (Figure 7C), which was consistent with the results of the Tunel assay. In the western blot assay, we found that caspase-3 expression pattern was not clear (Figure 7D, E), but 2.0 μg/mL group showed a decrease in caspase-3 expression consisting with the results of qRT-PCR and the Tunel assay. Further, we analyzed the results of flow cytometry assay, which showed that the proportion of apoptotic cells decrease gradient-wise (Figure 8A). The early-stage apoptotic cells significantly increased in the HSPB9 interference group (Figure 8D), while the proportions of late-stage apoptotic cells (Figure 8C) and dead cells (Figure 8B) significantly decreased in the HSPB9 interference group. In the 0.2, 0.5, and 2.0 μg/mL groups, the proportion of early-stage apoptotic cells significantly decreased (Figure 8D), while living cell proportions increased (Figure 8E) at the same time. To summarize, when HSPB9 was expressed insufficiently (50 nmol/L group) under heat stress (Figure 6C), the expression of HSPB1, another sHSP, increased as compensation (Figure 6D), which probably induced the transformation from late-stage apoptotic cells to early-stage apoptotic cells. When HSPB9 was overexpressed under heat stress, it protected cells from apoptosis. Under heat stress HSPB9 could reduce the proportion of early-stage apoptotic cell, promoting cell survival.
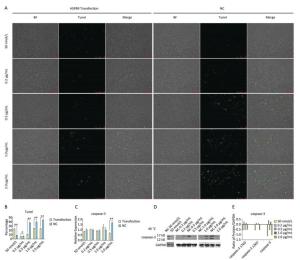
Figure 7. The effect of HSPB9 on cell apoptosis under heat stress condition. (A) Tunel assay was used to test the apoptosis of DF-1 cells in each transfection group after heat stress (100×). (B) The proportion of fluorescent cells of Tunel assay in different groups. All the cell data are presented as mean ± SD, n = 3, *P < 0.05, **P < 0.01 versus the negative control group (NC). (C) qRT-PCR was used to detect transcription levels of caspase-3. All the RT-qPCR data are presented as mean ± SE, n = 6, *P < 0.05, **P < 0.01 versus the negative control group. (D) Western blotting was used to detect changes in caspase-3 protein level. (E) Change in gray value of caspase-3 protein. When the negative control (NC) group value is subtracted from that of the transfection group, the larger the value (more than zero), the higher the rise, and the smaller the value (less than zero), the higher the decrease.
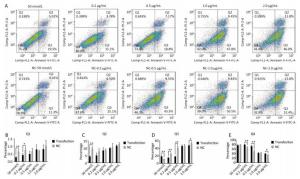
Figure 8. After heat stress, cell apoptosis was detected by flow cytometry. (A) FACS dot-plot of different groups. The effect of HSPB9 on apoptosis under heat stress. (A) qRT-PCR was used to detect transcription levels of caspase-3. (B) Q1 shows death cell. (C) Q2 shows later-stage apoptotic cells. (D) Q3 shows early-stage apoptotic cells. (E) Q4 shows living cells. All the apoptosis data are presented as mean ± SD, n = 3, *P < 0.05, **P < 0.01 versus the negative control group (NC).
Moderate HSPB9 Overexpression Suppresses HSPB1 and HSPA2 Expression under Non-heat Stress
As HSPB9 Expression Increased, It First Induced Cell Apoptosis and Then Inhibited Apoptosis Under Non-heat Stress
HSPB9 Expression Level Was Higher than That of HSPB1 and HSPA2, Improving the Viability of Cells at Early Stages of Heat Stress
Only High Levels of HSPB9 Overexpression Inhibited HSPB1 and HSPA2 Expression under Heat Stress
Under Heat Stress HSPB9 Reduced the Proportion of Early-stage Apoptotic Cell, Promoting Cell Survival
-
When ribosomes synthesize new proteins, substantial amounts of proteins are misfolded and degraded. Molecular chaperones facilitate the folding of the newly synthesized proteins. Heat shock causes aggregation of misfolded proteins, giving riseto aggresomes, microtubule-dependent cytoplasmic inclusion bodies[35, 36]. The HSPs are associated with misfolded proteins and prevent aggregate formation caused by proteasome- inhibition in avian cells[37, 38]. Khan et al. found that small heat shock protein is associated with aggresome-like inclusion bodies[39]. In addition, Katoh et al. found that chicken HSP25 predominantly accumulates in aggresomes called perinuclear inclusions, while HSP90, HSP70, and HSP24 do not dominantly accumulate in aggresomes[16]. Our results showed that under non-heat stress, HSPB9 overexpression at low levels (0.2-0.5 μg/mL) induced caspase-3 expression, and early-stage apoptotic cells increased rather than inhibiting apoptosis (Figure 3). Since, to our knowledge, there are no studies that show HSPB9 promoting apoptosis, we speculated that because the transfection of 0.2 μg/mL concentration vector (NC group) did not significantly induce apoptosis, the cells were in a normal state. Hence there was little misfolded protein and heat stress protein expression in the cells. A low HSPB9 expression caused aggregation, but HSPB1 and HSPA2 expression was inhibited, which enabled induction of the degradation machinery and then apoptosis. When HSPB9 was expressed in large amounts (2.0 μg/mL), the transfection of 2.0 μg/mL concentration vector (NC group) significantly induced apoptosis, the number of apoptotic cells significantly decreased, and the number of living cells significantly increased in HSPB9 group. The sHSPs are ATP-independent, contain an α-crystallin domain, and prevent the irreversible denaturation of other proteins. They are known to be responsible for the transfer of other proteins to the ATP-dependent chaperones, such as HSP70[40-42], or to the protein degradation machinery, such as proteasomes or autophagosomes[43]. Chicken HSPB1, a homolog of human HSP27[44], can form large perinuclear aggregates under heat stress conditions[45, 46]. Additionally, HSP70 (including HSPA2) can also bind to misfolded proteins to prevent aggregate generation[2-4]. Therefore, these HSPs do not predominantly accumulate in the aggresomes[16]. HSPB9 might preferentially bind to non-native proteins and maintain them in a fold-competent state, ready for refolding by HSP70 systems such as HSPB1[12, 20]. Therefore, HSPB9 is transcribed and translated prior to HSPA2 and HSPB1. In this study, we simulated HSPB9 expression to varying degrees by transfection of the overexpression vector and found that a moderate level of HSPB9 overexpression suppressed HSPB1 and HSPA2 expression (Figure 2). This may explain why HSPB9 preferentially binds to non-native proteins. The lack of introns in chicken HSPB9 facilitates rapid expression without disturbance by stressors that could interfere with RNA splicing[47]. In addition, HSPB9 is the most significant sHSP expressed in the testes, brain, liver, and egg muscle of adult egg-laying and broiler chickens in response to acute heat stress exposure[48, 49]. Thus, among the sHSPs in chicken, HSPB9 could be the first line of cellular defense against environmental stresses.
Members of the HSP70 family, including HSPA2, and HSPB1 are involved in the formation of inclusions. Inclusion formation triggers collapsed mitochondrial potential and cellular quiescence, and deactivates apoptosis[17]. Aggregates, in particular soluble oligomers, have been reported to be proteotoxic[50-53]. Aggregates might also be toxic because of sequestration of critical factors required for normal growth and viability, such as transcription factors[54], chaperones[55], and nuclear-cytoplasmic transport machinery[56]. Inclusions might also arise from (or cause) a more general collapse of proteostasis[57].
Under heat stress, a large amount of polymers is formed around the nucleus[45, 46] by HSPs enriching aggregates[35, 37, 38]. Because HSPs use the same conservative area of the small segment to combine the aggregates, the HSPs can combine with the misfolded proteins and form a polymer. The sHSPs have been shown to form a large number of 200-800 kD compounds, and these compounds dramatically enlarge to approximately 1, 300 kD under high temperatures[58]. In particular, HSPB9 forms a large structure to prevent irreversible effects in misfolded proteins[45, 46], which can be restored after the temperature returns to normal. In the heat stress experiment (Figure 5), the number of intracellular misfolded proteins may increase and form aggregates after heat stress. By this time, the clipping process of ATP-independent HSPB9 without any introns could be expressed preferentially. HSPB9 combined with misfolded proteins or aggregates, forming a fold-competent state ready for refolding by the HSP70 system, which was needed for ATP-dependent HSPA2 expression. Abundant HSPA2 and HSPB1 acted as chaperones to facilitate the formation of the inclusion body and in the proteasome to degrade harmful proteins, thereby reducing intracellular stress and promoting cell survival.
HSPB9, HSPA2, and HSPB1 expression increased under heat stress. When we continued to upregulate HSPB9 artificially, a slight increase in the overexpression of HSPB9 yielded a significant reduction in the proportion of early-stage apoptotic cells and a significant increase in living cells (Figure 8). This suggested a quick process by which HSPB9 deals with intracellular misfolded proteins and cell protection. In addition, a greater increase in the overexpression of HSPB9 inhibited HSPA2 and HSPB1 expression. We speculated that HSPB9, HSPA2, and HSPB1 were sufficient to deal with misfolded proteins at this time, and as HSPB9 expression increased, the excess HSPB9 might have provided negative feedback to HSPs by regulatory factors like HSF, thereby reducing HSP transcripts, including HSPA2 and HSPB1. Therefore, if HSPB9 were deficient, the expression of HSPB1 and HSPA2 was not inhibited and their high expression under heat stress would alleviate apoptosis, with a late-stage apoptotic cell changed to an early-stage apoptotic cell.
-
In conclusion, chicken DF-1 cells showed early-stage apoptosis in the early stages of HSPB9 overexpression, and in the later stages, as HSPB9 expression increased, they showed inhibition of apoptosis. When the cells were under heat stress, HSPB9 expression was much higher and faster than HSPB1 and HSPA2 expression and provided negative feedback to these two HSPs, thereby decreasing the early stages of apoptosis and promoting cell survival. Meanwhile, our findings may also provide evidence for enhancing cell survival under heat stress by the first line HSP, HSPB9 by regulating the interaction between other HSPs and apoptosis protein caspases.
the National Science and Technology Support Program of China 2014BAD08B08
National Natural Science Foundation of China 30972093

 Quick Links
 DownLoad: