


HTML
-
With an average prevalence rate of 3.5%, hepatitis B virus (HBV) infection is a major public health problem worldwide. As per a WHO report[1], there were 257 million patients chronically infected with HBV in 2015 and complications of chronic hepatitis B contributed two thirds of the total (1.34 million) deaths from viral hepatitis. The prevalence rate of hepatitis B surface antigen (HBsAg) was estimated to be 4% for Chinese women aged 15 to 29 and 5.6% for women in rural areas[2], and slightly lower than that in the general Chinese population (6.1%)[3]. Mother-to-child (intrauterine, intrapartum, and postpartum) transmission is one of the major routes of infection. The mother-to-child transmission rate was 5%-30% for HBsAg-positive mothers, and 70%-100% for mothers dually positive for HBsAg and hepatitis B e antigen (HBeAg)[1]. Based on this rate, and the newborn population in 2017 (17.23 million) as an annual average, there would be at least 689, 000 newborns from HBsAg-positive Chinese mothers each year, and 34, 000 of them would be infected with hepatitis B. Therefore, blocking mother-to-child transmission of HBV infection is of utmost urgency and importance. Since the commencement of hepatitis B vaccination, intrapartum and postpartum transmission of HBV infection has been well controlled. However, there is so far no effective way to block intrauterine transmission, the most important mother-to-child transmission pathway[4]. Equally troubling is that the mechanism of HBV intrauterine transmission is still unknown.
Recent studies have shown that HBV-infected maternal peripheral blood mononuclear cells (PBMC) may lead to HBV intrauterine transmission in neonates[5-7]. As a hepadnavirus, HBV can persist in extrahepatic spaces without easily detectable signs of hepatic replication[8]. In fact, a few studies have detected HBV in PBMCs[9, 10]. Interestingly, the covalently closed circular deoxyribonucleic acid (cccDNA) and mRNA of HBV were detected in PBMCs[11, 12], suggesting that PBMCs may serve as the extrahepatic replication sites for HBV. HBV cccDNA, the intermediate format of HBV genome replication, is a key factor for persistent HBV infection and a specific marker of HBV infection and replication[13, 14]. An increasing number of studies have used the level of PBMC HBV cccDNA to monitor the status of PBMC HBV infection and replication[15, 16]. Focusing on the relationship between maternal PBMC HBV DNA and HBV intrauterine transmission, some researchers found that the HBV-infected PBMCs of mothers can enter the fetal blood stream resulting in HBV intrauterine transmission[5, 17]. Our previous work described maternal PBMC HBV cccDNA as a risk factor for intrauterine transmission[18]. However, it only found that the risk of HBV intrauterine transmission was higher in PBMC HBV cccDNA positive group than in the negative group, and lacked an analysis of the relationship between PBMC HBV cccDNA and HBV infection and replication markers. Moreover, some studies found that serum HBeAg and HBV DNA in HBsAg-positive mothers were closely related to intrauterine transmission of HBV[19-21].
In this work, we sought to combine information on serum HBV DNA, HBeAg, and HBV serological patterns to further investigate the association between PBMC HBV cccDNA and HBV intrauterine transmission. We focused on PBMC from extrahepatic replication sites and investigated the relationship between PBMC HBV cccDNA and serological patterns. We combined this with other indicators of HBV infection and replication including serum HBV DNA, HBeAg, and serological patterns to further explore the relationship between PBMC HBV cccDNA and HBV intrauterine transmission.
-
From June 2011 to July 2013, 399 newborns and their HBsAg-positive mothers were recruited at the Department of Obstetrics and Gynecology, the Third People's Hospital of Taiyuan City. Of them, 290 were included in this study. All the included mothers had singleton pregnancies without any history of hepatitis C virus (HCV), human immunodeficiency virus (HIV) or other viral infections. Mothers who took antiviral drugs during pregnancy were excluded. The study was approved by the Ethics Committee of Shanxi Medical University, and all subjects signed informed consent forms.
All relevant information of the mothers and newborns were collected through case enquiries and face-to-face questionnaires after delivery. Venous blood (3 mL each, with or without anticoagulant) was collected from each mother's elbow vein before delivery and from the femoral vein of every newborn within 24 hours after birth, before active and passive immunization. Sera were made from blood samples without anticoagulant and PBMCs were extracted from those with anticoagulant. Both sera and PBMC preparations were stored at -80 ℃.
-
Detection of HBV cccDNA in PBMCs PBMCs of HBsAg-positive mothers were extracted from anticoagulant blood by Ficoll-Paque Plus (Shanghai Sangon Biotech Co. Ltd., China) and washed three times with 10 mL of Hank's solution. Nucleic acids were extracted as follows. Fifty microliters of nucleic acid extract B was added to the PBMCs which were then held at 100 ℃ for 10 min. The mixture was then centrifuged at 13, 000 ×g for 3 min and treated with PSAD enzyme (ZhongBei LinGe Biotechnology Ltd., Beijing). PBMC HBV cccDNA was detected with a real-time PCR-TaqMan kit (Beijing Suoao Biotechnology Co. Ltd). The total volume of the reaction mixture was 30 μL, consisting of 4 μL of sample, 24 μL of HBV-cPCR Mix, and 2 μL of Taq enzyme system. PCR conditions were as follows: 40 cycles of 2 min at 94 ℃, followed by 93 ℃ for 30 s and 55 ℃ for 45 s. According to the manufacturer's standard, HBV cccDNA ≥ 5 × 10² copies/mL was defined as positive[22].
Detection of HBV DNA in Serum HBV DNA in serum of newborns or HBsAg-positive mothers was detected with another real-time PCR-TaqMan kit (DAAN Gene Co. Ltd., Sun Yat-sen University, Guangdong). DNA was extracted as described in the kit. Fifty microliters of DNA extract I and 4 μL of internal standard solution were added to 200 μL serum. The mixture was mixed for 15 s and then centrifuged for approximately two seconds. It was then heated to 100 ℃ for 10 min and centrifuged at 14, 010 ×g for 5 min. HBV DNA ≥ 100 IU/mL was defined as positive as per the manufacturer's standard[23].
Detection of HBV Serological Markers Maternal HBV serological markers, including HBsAg, antibodies to hepatitis B surface antigen (anti-HBs), HBeAg, antibodies to hepatitis B e antigen (anti-HBe), and antibodies to hepatitis B core antigen (anti-HBc) were detected with an electrochemiluminescence immunoassay (ECLIA) (Roche Diagnostics GmbH, Germany).
-
Newborn serum collected within 24 hours after birth, prior to primary immunization and passive immunization that was HBsAg positive and/or HBV DNA positive was defined as HBV intrauterine transmission[24].
-
Database creation and data entry were performed using Epidata 3.1, and the data was collated and analyzed using SPSS 17.0. Qualitative data was compared using the Chi-square test or Fisher exact probability method. Correlation analysis of non-compliance with normal distribution variables and categorical variables was performed using Spearman rank correlation analysis. P < 0.05 indicates that the difference was statistically significant. The 'bnlearn' Bayesian network software package in R3.3.4 was used to analyze confounding factors and the relationship among the factors acting in HBV intrauterine transmission, with the tabu search algorithm used to learn the Bayesian network structure, and the maximum likelihood estimation method used for parameter learning. The Bayesian network and conditional probability distribution tables were drawn using the Netica software program.
Subjects and Specimens
Laboratory Testing
HBV Intrauterine Transmission Criteria
Statistical Analysis
-
General Demographic Data A total of 290 pairs of newborns and their HBsAg-positive mothers were included and their demographic data are shown in Table 1 (Total column). The rate of HBV intrauterine transmission was 11.72% (34/290).
Group Total n (%) (N = 290) HBV Intrauterine Transmission, n (%) χ2 P Value Yes (n = 34) No (n = 256) Mothers Age (y) 8.56 0.014 18-23 77 (26.55) 16 (20.78) 61 (79.22) 24-29 153 (52.76) 14 (9.15) 139 (90.85) 30-48 60 (20.69) 4 (6.67) 56 (93.33) Education level 3.50 0.174 Junior secondary school and below 115 (39.66) 14 (12.17) 101 (87.83) High school and junior college 116 (38.80) 17 (14.66) 99 (85.34) Undergraduate and above 59 (20.34) 3 (5.08) 56 (94.92) Family history of HBV infection 0.02 0.089 Yes 108 (37.24) 13 (12.04) 95 (87.96) No 182 (62.76) 21 (11.54) 161 (88.46) Hepatitis B Vaccine injection 1.000a Yes 2 (0.69) 0 (0.00) 2 (100.00) No 288 (99.31) 34 (11.81) 254 (88.19) HBIG injectionb 0.530a Yes 6 (2.11) 1 (16.67) 5 (83.33) No 284 (97.93) 33 (11.62) 251 (88.38) PBMC HBV cccDNA 9.28 0.002 Positive 49 (16.90) 12 (24.49) 37 (75.51) Negative 241 (83.10) 22 (9.13) 219 (90.87) Serum HBV DNA 0.63 0.430 Positive 167 (57.59) 22 (13.17) 145 (86.83) Negative 123(42.41) 12 (9.76) 111 (90.24) Serum HBeAg 10.10 0.001 Positive 115 (39.66) 22 (19.13) 93 (80.87) Negative 175 (60.34) 12 (6.86) 163 (93.14) Serological patternsc 12.38 0.002 A 99 (34.14) 21 (21.21) 78 (78.79) B 173 (59.66) 12 (6.94) 161 (93.06) Others 18 (6.20) 1 (5.56) 17 (94.44) Mode of delivery 12.88 < 0.001 Vaginal delivery 138 (47.59) 26 (18.84) 112 (81.16) Cesarean section 152 (52.41) 8 (5.26) 144 (94.74) Newborn Characteristics Gestational weeks 0.715a 35-36 20 (6.90) 3 (15.00) 17 (85.00) 37-41 270 (93.10) 31 (11.48) 239 (88.52) Gender 0.15 0.700 Boy 154 (53.10) 17 (11.04) 137 (88.96) Girl 136 (46.90) 17 (12.50) 119 (87.50) Birth weight (g) 0.709a 2, 500-3, 999 271 (93.45) 33 (12.18) 238 (87.82) 4, 000-5, 000 19 (6.55) 1 (5.26) 18 (94.74) Birth length (cm) 45-53 288 (99.31) 34 (11.81) 254 (88.19) 1.000a 54-55 2 (0.69) 0 (0.00) 2 (100.00) Note. aresults from Fisher's Exact Test; bHBIG, hepatitis B immunoglobulin; cPattern A is 'HBsAg (+), HBeAg (+), anti-HBc (+)' and pattern B is 'HBsAg (+), anti-HBe (+), anti-HBc (+)'. The details of serological patterns are presented in Table 3. Table 1. Summary of the Demographic Feature of the Mothers and Newborns
The Association of PBMC HBV cccDNA with Serum HBV DNA and Serum HBeAg As shown in Table 2, the PBMC HBV cccDNA positive group had significantly more HBV DNA positive serum than in the negative group (χ2 = 13.96, P < 0.001), and serum HBeAg positivity in the PBMC HBV cccDNA positive group was significantly higher than in the negative group (χ2 = 47.74, P < 0.001).
HBV Replication Markers PBMC HBV cccDNA, n (%) Total χ2 P Value Positive Negative HBV DNA 13.96 < 0.001 Positive 40 (81.63) 127 (52.70) 167 Negative 9 (18.37) 114 (47.30) 123 Total 49 241 290 HBeAg Positive 41 (83.67) 74 (30.71) 115 47.74 < 0.001 Negative 8 (16.33) 167 (60.29) 175 Total 49 241 290 Serological patternsa 48.48 < 0.001 A 37 (75.51) 62 (25.73) 99 B 8 (16.33) 165 (68.46) 173 Others 4 (8.16) 14 (5.81) 18 Total 49 241 290 Note.aPattern A is 'HBsAg (+), HBeAg (+), anti-HBc (+)' and pattern B is 'HBsAg (+), anti-HBe (+), anti-HBc (+)'. The details of serological patterns are presented in Table 3. Table 2. The Relationship between PBMC HBV cccDNA and Serological Markers in HBsAg-positive Mothers
The values of PBMC HBV cccDNA, HBV DNA and HBeAg were transformed logarithmically, and Pearson linear correlation analysis was used to analyze the association of PBMC HBV cccDNA with serum HBV DNA and HBeAg. Our results revealed that the number of positive cases of PBMC HBV cccDNA was positively correlated with that of HBV DNA (r = 0.436, P < 0.001) and HBeAg (r = 0.403, P < 0.001).
The Relationship between HBV cccDNA of PBMC and HBV Serological Patterns Six HBV serological patterns are summarized (Table 3) from data on the 290 HBsAg-positive mothers. Pattern A 'HBsAg (+), HBeAg (+), anti-HBc (+)' accounted for 34.14% (99/290) of the cases, while 59.66% (173/290) were pattern B 'HBsAg (+), anti-HBe (+), anti-HBc (+)' with the remaining four patterns accounting for 6.21%.
Serological Patterns HBV Serological Markers n (%) HBsAg Anti-HBs HBeAg Anti-HBe Anti-HBc A + - + - + 99 (34.14) B + - - + + 173 (59.66) C + + + - + 6 (2.07) D + + - + + 2 (0.69) E + - + + + 9 (3.10) F + - + - - 1 (0.34) Note. '+' positive; '-' negative. Table 3. Serological Patterns of 290 HBsAg-positive Mothers
Of note the case distribution of HBV serological pattern A and B between PBMC HBV cccDNA positive and negative group was significantly different (χ2 = 48.48, P < 0.001), with the PBMC HBV cccDNA positive group accounting for the majority of pattern A and the negative group accounting for the majority of pattern B (Table 2).
-
Factors Influencing HBV Intrauterine Transmission Of the maternal characteristics listed in Table 1, our analysis revealed that PBMC HBV cccDNA, serum HBV DNA, HBeAg, serological patterns, mode of delivery, and age were significantly associated with HBV intrauterine transmission.
The Effect of PBMC HBV cccDNA and HBV Infection Status on HBV Intrauterine Transmission We combined the data on maternal serum HBV DNA and HBeAg with the PBMC HBV cccDNA data to further analyze the relationship between PBMC HBV cccDNA and HBV intrauterine transmission. The results are shown in Table 4. Taking serum HBeAg and PBMC HBV cccDNA double negativity as a control, our analysis demonstrated that the risk of intrauterine transmission was 2.43 times higher (OR = 2.43, 95% CI: 1.02-5.78) when either HBeAg or HBV cccDNA was positive, and 5.20 times higher when they were both positive. The Mantel-Haenszel test also showed a greater risk of HBV intrauterine transmission when HBeAg and HBV cccDNA were both positive (χ2 = 13.71, P < 0.001). For the same reason, the risk of HBV intrauterine transmission was much higher when HBV DNA and HBV cccDNA were both positive (OR = 3.39, 95% CI: 1.24-9.27; χ2 = 6.01, P = 0.014). When the HBeAg and HBV DNA data were combined to analyze the relationship between PBMC HBV cccDNA and HBV intrauterine transmission, it was found that the risk of HBV intrauterine transmission was highest in the 'HBeAg (+) HBV DNA (+) cccDNA (+)' group (OR = 3.69, 95% CI: 1.30-10.42); χ2 = 8.08, P = 0.004).
HBV Replication Markers HBV Intrauterine Transmission χ2 P Value OR (95% CIa) Yes No HBeAg (-) HBV cccDNA (-) 11 (32.35) 156 (60.94) 13.71 < 0.001 HBeAg (+) / HBV cccDNA (+) 12 (35.30) 70 (27.34) 2.43 (1.02, 5.78) HBeAg (+) HBV cccDNA (+) 11 (32.35) 30 (11.72) 5.20 (2.07, 13.08) HBV DNA (-) HBV cccDNA (-) 9 (26.47) 105 (41.02) 6.01 0.014 HBV DNA (+) / HBV cccDNA (+) 16 (47.06) 120 (46.87) 1.56 (0.66, 3.67) HBV DNA (+) HBV cccDNA (+) 9 (26.47) 31 (12.11) 3.39 (1.24, 9.27) HBeAg (-) HBVDNA (-) cccDNA (-) 8 95 8.08 0.004 Other cccDNA (-)b 14 124 1.34 (0.54, 3.33) Other cccDNA (+)c 3 8 4.45 (0.98, 20.17) HBeAg (+) HBV DNA (+) cccDNA (+) 9 29 3.69 (1.30, 10.42) Note. aCI, confidence interval. bOther cccDNA (-) is HBeAg (+) HBVDNA (-) cccDNA (-), HBeAg (-) HBVDNA (+) cccDNA (-), HBeAg (+) HBVDNA (+) cccDNA (-). cHBeAg (+) HBVDNA (-) cccDNA (+), HBeAg (-) HBVDNA (+) cccDNA (+), HBeAg (-) HBVDNA (-) cccDNA (+). Table 4. The Relationship between Maternal PBMC HBV cccDNA, HBV DNA, and HBeAg and HBV Intrauterine Transmission
As shown in Table 5, the risk of HBV intrauterine transmission was highest (OR = 5.89, 95% CI: 2.36-14.72) when the subject was PBMC HBV cccDNA positive and exhibited serological pattern A, suggesting the critical role of PBMC HBV cccDNA in HBV intrauterine transmission.
HBV cccDNA Pattern A HBV Intrauterine Transmission P Value OR (95% CI) Yes No - - 12 (35.30) 167 (65.23) 1.00 - + 10 (29.41) 52 (20.31) 0.026 2.67 (1.09, 6.34) + - 1 (2.94) 11 (4.30) 0.582a 1.27 (0.15, 10.64) + + 11 (32.35) 26 (10.16) < 0.001 5.89 (2.36, 14.72) Note.aIndicates the use of Fisher's Exact Test. Table 5. The Relationship between Maternal PBMC HBV cccDNA and Serological Pattern A on HBV Intrauterine Transmission
The Bayesian Network of HBV Intrauterine Transmission Factors statistically significant in univariate analysis and HBV DNA except for serum HBeAg were put into a Bayesian model. It was excluded because it was already covered by serological pattern. As shown in Figure 1, the Bayesian network model revealed that maternal PBMC HBV cccDNA was directly related to HBV intrauterine transmission whereas maternal serum
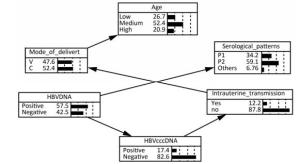
Figure 1. The bayesian network of HBV intrauterine transmission. Age: Low means 18-23, Medium means 24-29, and High means 30-48. Mode_of_delivery: V means vaginal delivery, and C means cesarean section. Serological patterns: P1 means pattern A ['HBsAg (+), HBeAg (+), anti-HBc (+)'], and P2 means pattern B ['HBsAg (+), anti-HBe (+), anti-HBc (+)'].
HBV DNA was indirectly related to HBV intrauterine transmission via maternal PBMC HBV cccDNA. The possibility of HBV intrauterine transmission was much higher when PBMC HBV cccDNA was positive (25.49%) than when it was negative (9.47%), according to the conditional probability distribution.
The Relationship between PBMC HBV cccDNA and HBV Serological Markers in HBsAg-positive Mothers
The Effect of PBMC HBV cccDNA on HBV Intrauterine Transmission
-
Intrauterine transmission, the most important mode of HBV vertical transmission[25] caused by HBsAg-positive mothers, is an ongoing issue with a huge impact. In the current study, we found that the rate of HBV intrauterine transmission was 11.72% in a group of 290 HBsAg-positive mothers, which is consistent with results from other studies[20, 26, 27], demonstrating that intrauterine transmission has not yet been effectively blocked.
Both HBV DNA and HBeAg are indicators of HBV infection and replication while HBV cccDNA is an intermediate structure during HBV genome replication. Several studies focusing on chronic hepatitis B (CHB) patients reported that HBV cccDNA in liver tissue was significantly and positively correlated with serum HBV DNA and HBeAg[28-30], suggesting that PBMC HBV cccDNA and HBeAg might be related, but their association was not statistically significant. Similar to liver HBV cccDNA[28-30], PBMC HBV cccDNA was also found to be significantly and positively correlated with serum HBV DNA[31, 32].
As a special intermediate during replication, HBV cccDNA is first formed when the host is infected with HBV, and then serves as the transcriptional template for different sizes of mRNA, including pre-genomic RNA, which is reverse transcribed to form HBV DNA and pre-core mRNA encoding the HBeAg protein[33]. Therefore, HBV DNA and HBeAg could be the downstream products of HBV cccDNA. The current study showed that the PBMC HBV cccDNA of HBsAg-positive mothers was significantly and positively correlated with serum HBV DNA and HBeAg, suggesting there might be a relationship between HBV infection replication indicators and that PBMC HBV cccDNA could function as a useful marker of the replication status of HBV, expanding the repertoire of the current clinical indicators.
Along with the status of viral replication, infection and outcome, the presentation of various serological markers can form various patterns. Therefore, HBV serological pattern is often used to judge the HBV infection and replication status in vivo. It is well accepted that pattern A ['HBsAg (+), HBeAg (+), anti-HBc (+)'] represents the most active state of HBV replication, followed by pattern B ['HBsAg (+), anti-HBe (+), anti-HBc (+)']. In this study, six serological marker patterns were found in HBsAg-positive mothers, with patterns A and B predominating, a result consistent with those of Cui FQ et al.[34]. Some previous studies also commented that serum HBV DNA might be closely associated with some serological patterns[35, 36], in line with our unpublished data. Importantly, we found that the distribution of HBV serological patterns varied significantly between the PBMC HBV cccDNA positive and negative groups, uncovering a potential link between PBMC HBV cccDNA and serological patterns. Interestingly, we found that the PBMC HBV cccDNA positive group was mainly associated with pattern A, suggesting that the HBV infection and replication could be more active in mothers that are PBMC HBV cccDNA positive. In addition, PBMC HBV cccDNA could be a better marker to show HBV replication. A literature search found that this was the first report to investigate the relationship between PBMC HBV cccDNA and serological patterns on HBV intrauterine transmission. Lei Z et al. pointed out that maternal HBsAg, HBeAg, and HBV DNA may not pass through the the placenta to the newborn[37], which might confirm that these indicators might be transmitted through PBMCs. These results suggested that infected PBMCs might be the gateway to intrauterine transmission of HBV. It may be that not only can HBV DNA in PBMC be transcribed and translated independently, but that DNA can also be adsorbed from peripheral blood by PBMCs[38]. Therefore, the more active the HBV replication and the higher the serum level of replication indicators, the greater the risk of HBV intrauterine transmission.
Bayesian model multivariate analysis suggested that maternal PBMC HBV cccDNA might be a risk factor for HBV intrauterine transmission, a finding not previously seen in the literature. One can speculate that maternal HBV DNA might first infect a PBMC, before replicating and being transcribed, and eventually causing HBV intrauterine transmission through that infected PBMC. Our results also showed that serum HBV DNA might influence the HBV serological patterns because markers of each pattern might be the downstream proteins transcribed and translated from the DNA template[33]. Although the Bayesian model did not show a direct relationship between PBMC HBV cccDNA and serological pattern, it did show that PBMC HBV cccDNA and serological pattern were both related to serum HBV DNA, suggesting that serum DNA might serve as a link between PBMC HBV cccDNA and the serological pattern.
In conclusion, PBMC HBV cccDNA in HBsAg- positive mothers may be a direct risk factor for intrauterine transmission which can be higher when PBMC HBV cccDNA coexists with other confounding factors. Therefore, it is valuable to combine serological and PBMC-related indicators during prenatal testing to better understand and predict the risk of HBV intrauterine transmission. Some limitations of this study were that the sample size of newborns with intrauterine transmission in this study was small (only 34) and that the amount of PBMCs prevented us from testing pre-genome RNA.
the State Key Laboratory of Infectious Disease Prevention and Control 2018SKLID310
the National Natural Science Foundation of China 81872677
the State Key Laboratory of Infectious Disease Prevention and Control 2017SKLID306
the National Natural Science Foundation of China 81573212

 Quick Links
 DownLoad: