


-
Until now, although comprehensive management strategies have improved treatment, there are no treatments to alleviate symptoms and slow disease progression[1]. In the past few decades, there has been increasing evidence that inflammation plays a very important role in silicosis. Injury-induced inflammation is an effective strategy to remove harmful stimuli and initiate a healing process. However, it might be harmful to the organism and result in a permanent disease state if the inflammation is prolonged[2]. Modified glasgow prognostic score (mGPS)[3], C-reactive protein/albumin ratio (CAR), neutrophil/lymphocyte ratio (NLR) and platelet/lymphocyte ratio (PLR) are reported as indicators of inflammation assessment, The mGPS was assigned according to the following conditions: score 0 (good prognosis): CRP ≤ 10 mg/L and albumin ≥ 3.5 g/dL, or CRP ≤ 10 mg/L and albumin < 3.5 g/dL; score 1 (intermediate prognosis): CRP > 10 mg/L and albumin ≥ 3.5 g/dL; score 2 (poor prognosis): CRP > 10 mg/L and albumin < 3.5 g/dL. It has been proved they are closely related to the prognosis of psoriasis[4], schizophrenia[5] and cerebral venous thrombosis[6], but there is a few reports on the prognostic effects of silicosis. Pulmonary function is a classic indicator for assessing the severity of silicosis. Therefore, our study aimed to explore the value of mGPS, PLR, CAR, NLR, forced vital capacity (FVC) and forced expiratory flow in 1 s/ forced vital capacity (FEV1/FVC) in the evaluation of prognosis of silicosis.
In our study, the diagnosis of silicosis was based on the diagnosis criteria of occupational pneumoconiosis (GBZ70-2015)[7]. Furthermore, the silicosis is divided into three stages according to the diagnostic criteria: stage Ⅰ, stage Ⅱ, and stage Ⅲ. The stage of the disease is consistent with the severity of the disease. Those who had chronic illness (infectious diseases, hypertension, diabetes mellitus, autoimmune disease) were excluded from the study. A total of 148 patients (male) diagnosed with silicosis were included in the study. The control group included 120 age and sex matched volunteers without allergic disease or renal disease, who were engaged in dust-related works.
We used the Sysmex XN-2000 Haematology Analyzer (Sysmex, Milton Keynes, UK) to detect leukocyte (WBC), lymphocytes(L), neutrophils (N) and platelets (PLT), erythrocyte sedimentation rate (ESR) were detected by using ALIFAX automatic blood sedimentation instrument (Roller20), C-reactive protein (CRP) and albumin (ALB) were detected by using Hitachi 7600 Automatic Biochemistry Analyzer (Hitachi, Ltd).
Table 1 shows the clinical and biochemical characteristics of the study subjects. No differences were observed in age (P = 0.724) and body mass index (BMI) (P = 0.945) among the four groups. According to the characteristics of the occupation, all the patients selected in this study were males. The serum WBC, N%, N, L%, L, PLT, ESR, and FVC, FEV1/FVC levels were significantly different in the four groups (P < 0.0001). Meanwhile, stage Ⅲ silicosis patients had higher WBC, N%, N, and PLT levels compared with stage Ⅰ silicosis patients and controls. Furthermore, stage Ⅲ silicosis patients had lower L%, and L level compared with stage Ⅰ silicosis patients and controls. Stage Ⅲ silicosis patients had higher WBC, N, and PLT levels compared with stage Ⅱ silicosis patients. Stage Ⅱ silicosis patients had higher N%, N, and lower L% and L level compared with stage Ⅰ silicosis patients, However, stage Ⅱ and stage Ⅲ silicosis patients had shorter illness duration compared with stage Ⅰ silicosis patients. The differences in MPV, ALB, and CRP levels were not significant between silicosis groups and control group (P > 0.05).
Characteristics Healthy Controls Stage Ⅰ Silicosis Group Stage Ⅱ Silicosis Group Stage Ⅲ Silicosis Group P Value Subjects, n 120 48 46 54 Age (year) 57 ± 10 58 ± 8 54 ± 13 55 ± 9 0.724 BMI (kg/m2) 21.40 ± 1.71 22.40 ± 2.10 22.50 ± 2.30 22.60 ± 1.80 0.945 Illness time 11.9 ± 6.10 6.32 ± 2.95bb 5.61 ± 2.76bb < 0.0001 WBC (109/L) 6.96 ± 1.58 6.53 ± 1.59 7.04 ± 2.34 8.22 ± 2.96aabbcc < 0.0001 N% 55.25 ± 3.45 62.37 ± 10.54aa 65.94 ± 10.43aab 67.67 ± 11.49aabbcc < 0.0001 N (109/L) 3.45 ± 0.91 4.17 ± 1.59 4.78 ± 2.50 5.77 ± 3.00aabbcc < 0.0001 L% 33.86 ± 3.55 27.46 ± 9.38a 22.51 ± 7.51 21.78 ± 9.48aabb < 0.0001 L (109/L) 2.10 ± 0.51 1.71 ± 0.54aa 1.48 ± 0.46aa 1.65 ± 0.68aa < 0.0001 PLT (109/L) 222.43 ± 44.37 220.17 ± 55.68 237.04 ± 89.29 272.11 ± 70.35abbc 0.010 MPV (fl) 9.61 ± 1.1 10.41 ± 0.98 10.56 ± 1.34 10.51 ± 1.54 0.924 ALB (g/L) 47.24 ± 1.87 41.43 ± 4.13 39.15 ± 4.25b 39.82 ± 4.53 0.182 CRP (mg/L) 12.31 ± 4.21 12.36 ± 4.31 18.92 ± 7.62 0.367 ESR (mm/h) 14.42 ± 6.11 23.92 ± 5.043 32.6 ± 7.7bb 0.024 mGPS 0.53 ± 0.39 0.82 ± 0.43b 1.02 ± 0.67bb 0.037 NLR 1.65 ± 0.17 3.51 ± 1.03 4.10 ± 2.01a 4.91 ± 2.64aab 0.006 PLR 114.89 ± 44.68 144.28 ± 68.88 180.72 ± 71.35a 204.64 ± 61.01aab 0.001 CAR 0.33 ± 0.12 0.34 ± 0.14 0.51 ± 0.25 0.435 FVC 86.48 ± 12.04 91.23 ± 25.37 78.70 ± 21.21b 70.56 ± 21.02aabbc < 0.0001 FEV1/FVC 92.53 ± 7.49 66.40 ± 13.23aa 68.93 ± 15.03aa 62.43 ± 17.80aa < 0.0001 Note. Data mean ± SD. P value comparisons among four groups by one-way ANOVA, avs. Healthy control group, aP < 0.05, aaP < 0.01, bvs. Stage Ⅰ silicosis group, bP < 0.05, bbP < 0.01, cvs. stage Ⅱ silicosis group, cP < 0.05, ccP < 0.01. Table 1. Clinical and Biochemical Characteristics of the Study Subjects
As shown in Figure 1, compared with healthy controls, stage Ⅲ silicosis patients exhibited significantly higher serum NLR and PLR levels (P < 0.01). Furthermore, compared with stage Ⅰ silicosis patients, stage Ⅲ silicosis patients exhibited higher serum mGPS, NLR and PLR levels (P < 0.05). Meanwhile, stage Ⅱ silicosis patients exhibited higher serum mGPS, NLR and PLR levels compared with stage Ⅰ silicosis patients (P < 0.05). However, the differences in CAR level had no significance among the silicosis patients in three groups (P > 0.05).
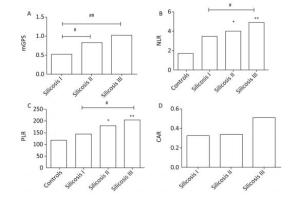
Figure 1. The concentrations of mGPS, NLR, PLR, and CAR in four groups. *P < 0.05, **P < 0.01, compared with controls. #P < 0.05, ##P < 0.01, between two groups indicated by horizontal line.
Table 2 shows that the calculated NLR was positively correlated with PLR, CRP, ESR, and mGPS in silicosis groups (r = 0.755, P < 0.01; r = 0.240, P < 0.05; r = 0.218, P < 0.05; and r = 0.204, P < 0.05, respectively), we observed that PLR was positively correlated with CRP, ESR, and mGPS in silicosis groups (r = 0.238, P < 0.05; r = 0.360, P < 0.01; and r = 0.291, P < 0.01, respectively), Besides, mGPS was positively correlated with PLR, CRP, and ESR in silicosis groups (r = 0.291, P < 0.01; r = 0.707, P < 0.01; r = 0.543, P < 0.01, respectively), In addition, FVC was negatively correlated with NLR, PLR, mGPS and CRP in silicosis groups (r = -0.258, P < 0.01; r = -0.31, P < 0.01; r = -0.323, P < 0.01; and r = -0.287, P < 0.01, respectively), FEV1/FVC was negatively correlated with NLR (r = -0.230, P < 0.01).
Variables NLR PLR mGPS CAR r P r P r P r P PLR 0.755 < 0.01 0.291 < 0.01 CRP 0.240 < 0.05 0.238 < 0.05 0.707 < 0.01 ESR 0.218 < 0.05 0.360 < 0.01 0.543 < 0.01 0.612 < 0.01 mGPS 0.204 < 0.05 0.291 < 0.01 FVC -0.258 < 0.01 -0.31 < 0.01 -0.323 < 0.01 -0.287 < 0.01 FEV1/FVC -0.230 < 0.01 -0.18 > 0.05 -0.14 > 0.05 -0.105 > 0.05 Note. PLR, platelet/lymphocyte; CRP, C-reactive protein; ESR, erythrocyte sedimentation rate; mGPS, modified glasgow prognostoc score; FVC, forced vital capacity; FEV1/VC, forced expiratory flow in 1 s/foned votal capacity; NLR, neutrophil/lymphocyte ratio; CAR, C-reactive protein/albumin ratio. Table 2. Correlation Analysis of NLR, PLR, and mGPS with Clinical Factors
As shown in Figure 2, the ROC curve was drawn to evaluate whether they can be used as an effective indicators for assessing the severity of silicosis. The area under the curve of the NLR was 0.866 (95% CI: 0.811-0.922, P < 0.001), and the area under the curve of PLR the area was 0.731 (95% CI: 0.663⁃0.799, P < 0.001), The ROC curves proved that NLR and PLR have certain values in assessing the severity of silicosis patients and NLR is more sensitive than PLR for assessing disease activity.
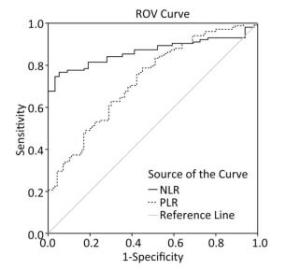
Figure 2. ROC curve of NLR and PLR evaluating disease activity in patients with silicosis.
In summary, Our study mainly revealed the characteristics of some common clinical inflammation index and some calculated inflammation indicators (mGPS, NLR, PLR, and CAR) in patients with silicosis. According to the characteristics of the occupation, all the subjects selected in this study were males. The stage Ⅱ and stage Ⅲ silicosis groups had shorter illness duration than stage Ⅰ silicosis group, we speculate that silicosis is progressing faster than other types of pneumoconiosis. The specific reasons need further research. In our study, WBC, N%, N, PLT, ESR, NLR, PLR, and mGPS measurements were significantly higher in silicosis patients than in controls (P < 0.05). L% and L level were significantly lower in silicosis patients than in controls (P < 0.05). The increase of NLR might be due to the increase of neutrophil or decrease of lymphocytes in silicosis patients. The increase of PLR might be due to the increase of platelet or decrease of lymphocytes in silicosis patients. These observations suggested that NLR, PLR and mGPS indicators can be used to evaluate the disease activity in patients with silicosis. These results are similar to Lin's results that the inflammatory response in sarcopenia is associated with the neutrophil/lymphocyte and platelet/lymphocyte ratios in operable gastric cancer patients[8]. Grieshober's research also showed a better understanding of the role of methylation-derived NLR in lung cancer etiology might improve the prevention and detection of lung cancer[9] In this study, CAR was found to be useful to evaluate the disease activity of silicosis.
Of these values, a positive correlation was found between NLR with PLR, CRP, ESR, and mGPS in the silicosis groups, we observed that PLR was, positively correlated with CRP, ESR, and mGPS in silicosis groups, besides, mGPS was positively correlated with PLR, CRP, and ESR (P < 0.05). In addition, FVC was negatively correlated with NLR, PLR, CRP, and mGPS, FEV1/FVC was negatively correlated with NLR. CRP, and SR is the routine laboratory tests used to indicate inflammation. Generally, in silicosis patients, the lung function is negatively correlated with the severity of silicosis. These proved that NLR, PLR, and mGPS levels are closely related to inflammatory status in silicosis patients. This may be beneficial for clinicians to evaluate the disease status and assessment of the inflammatory response before and after treatment.
In addition, we have derived ROC curve of NLR and PLR in silicosis patients. The ROC curve proved that NLR and PLR have certain value in assessing the severity of silicosis patients and NLR is more sensitive than PLR for assessing disease activity.
In clinical practice, the detection of inflammation indicators is cumbersome and costly and single white blood cell indicators are sensitive to dehydration/hydration, dilution of blood samples and the impact of factors such as blood sample processing[10], so NLR and PLR as a combination of other inflammatory indicators for the assessment of silicosis disease are more stable.
In summary, PLR, NLR, and mGPS scores can be used as indicators of inflammatory state and severity to evaluate the clinical prognosis of patients with silicosis. NLR is more sensitive to assessing disease activity compared with PLR.
Modified Glasgow Prognostic Score, and Neutrophil/lymphocyte and Platelet/lymphocyte Ratios in Different Stages of Silicosis
doi: 10.3967/bes2019.050
- Received Date: 2019-01-09
- Accepted Date: 2019-04-28
| Citation: | HE La Gu, WU Peng Fei, PENG Yan Hua, FENG Juan, ZHONG Dai Ming, ZHANG Gui Hua, ZENG Lei, ZHONG Yu Min, WANG Xiao Ye, YUAN Hua Min. Modified Glasgow Prognostic Score, and Neutrophil/lymphocyte and Platelet/lymphocyte Ratios in Different Stages of Silicosis[J]. Biomedical and Environmental Sciences, 2019, 32(5): 376-379. doi: 10.3967/bes2019.050

|

 Quick Links
 DownLoad:
