SONG Peng Kun, MAN Qing Qing, LI Hong, PANG Shao Jie, JIA Shan Shan, LI Yu Qian, HE Li, ZHAO Wen Hua, ZHANG Jian. Trends in Lipids Level and Dyslipidemia among Chinese Adults, 2002-2015[J]. Biomedical and Environmental Sciences, 2019, 32(8): 559-570. doi: 10.3967/bes2019.074
Citation: SONG Peng Kun, MAN Qing Qing, LI Hong, PANG Shao Jie, JIA Shan Shan, LI Yu Qian, HE Li, ZHAO Wen Hua, ZHANG Jian. Trends in Lipids Level and Dyslipidemia among Chinese Adults, 2002-2015[J]. Biomedical and Environmental Sciences, 2019, 32(8): 559-570. doi: 10.3967/bes2019.074

Trends in Lipids Level and Dyslipidemia among Chinese Adults, 2002-2015

doi: 10.3967/bes2019.074
Funds:  This work was supported by the National Health and Family Planning Commission (formerly the Ministry of Health of the People's Republic of China) Medical Reform Major Program:China Nutrition and Health Surveillance (2010-2012) and Chinese Adults Chronic Diseases and Nutrition Surveillance (2015)
More Information
  • Author Bio:

    SONG Peng Kun, female, born in 1982, PhD, majoring in nutritional epidemiology and chronic disease prevention and control

  • Corresponding author: ZHAO Wen Hua, Tel:86-10-66237006, E-mail:zhaowh@chinacdc.cn; ZHANG Jian, Tel:86-10-66237147, E-mail:zhangjian6708@aliyun.com
  • Received Date: 2019-07-19
  • Accepted Date: 2019-08-01
  • Objective To investigate the trends of lipid profiles and dyslipidemia among Chinese adults from 2002 to 2015. Methods Data were collected from three nationally representative cross-sectional surveys. Fasting venous blood samples were collected and serum lipids were tested by biochemical analysis and enzymatic determination. Lipid levels and the prevalence of dyslipidemia among adults were analyzed with complex sampling weighting adjustment for age and gender. Results The weighted means of TC, TG, and LDL-c significantly increased linearly from 3.93, 1.12, and 2.12 mmol/L in 2002 to 4.59, 1.41, and 2.78 mmol/L in 2010 and then to 4.63, 1.47, and 2.87 mmol/L in 2015, respectively; by contrast, HDL-c levels decreased significantly from 1.30 mmol/L to 1.26 mmol/L over the same period. Similar trends in mean non-HDL-c and lipid-related ratios were observed. The weighted dyslipidemia prevalence linearly increased; in particular, hypercholesterolemia increased from 1.6% to 5.6% and then to 5.8%, hypertriglyceridemia increased from 5.7% to 13.6% and then to 15.0%, low HDL-c increased from 18.8% to 35.5% and then to 24.9%, and high LDL-c increased from 1.3% to 5.6% and then to 7.2% (P for trend < 0.001). Conclusion Dyslipidemia increased among Chinese adults from 2002 to 2015. Development of a comprehensive strategy to decrease lipid levels in this population is urgently required.
  • Developments in economy and acceleration of urbanization combined with population aging in China over the last 30 years have resulted in a dramatic increase in the risk of cardiovascular disease (CVD). Annual cardiovascular events are predicted to show a > 50% increase from 2010 to 2030. Changes in serum lipids and lipoproteins are a well-established risk factor for CVD morbidity and mortality. Dyslipidemia is characterized by increased levels of blood total cholesterol (TC), triglycerides (TG), and low-density lipoprotein cholesterol (LDL-c) and decreased levels of high-density lipoprotein cholesterol (HDL-c). Many studies have demonstrated that non-HDL-c levels and some lipid-related ratios, such as TC/HDL-c, TG/HDL-c, and LDL-c/HDL-c, exert greater influences on the morbidity and severity of coronary heart disease (CHD) than individual lipid and lipoprotein concentrations. Therefore, diagnosing and preventing CHD by analyzing these indicators is meaningful. However, little national information has been reported on the trends of non-HDL-c and lipid ratio levels among the Chinese population. Given the very low usage of cholesterol-lowering medication and high morbidity of CVD in China, investigating the status of dyslipidemia in the country is an important undertaking.

    The criteria for dyslipidemia have been modified several times over the last 20 years; thus, reanalyzing national lipid profiles and the prevalence of dyslipidemia with the same criteria and standard population data is necessary. In the present study, we aimed to investigate whether the trends of lipid profiles and dyslipidemia prevalence differ among regions, genders, and age groups in China.

    The study data were obtained from three nationwide cross-sectional surveys, namely, the Chinese Adults Nutrition and Chronic Diseases Surveillance in 2015 (CANCDS2015), Chinese Nutrition and Health Surveillance in 2010 (CNHS2010), and the Chinese Nutrition and Health Survey in 2002 (CNHS2002). The three surveys were conducted in 31 provinces, autonomous regions, and municipalities directly under the central government throughout China (except Taiwan, Hong Kong, and Macau). A stratified multistage cluster sampling method was used.

    In the 2002 survey, the country was divided into six strata (large cities, medium and small cities, class 1-4 rural areas) based on geographic characteristics, economy, and social development information provided by the China National Bureau of Statistics and the China Ministry of Health Statistics. The first stage of sampling involved a random selection of 22 districts (urban) or counties (rural) from the six strata. In the second stage, random selection of three neighborhoods (urban) or townships (rural) from each of the selected districts/counties was conducted; two residential committees (urban) or villages (rural) were then randomly selected from each of the neighborhoods or townships. Thirty households were randomly sampled from each neighborhood committee or village.

    In the 2010 survey, a multistage stratified with proportional to the population cluster random sampling method was conducted at 150 survey sites of four types, including 34 large cities, 41 medium and small cities, 45 general rural areas, and 30 poor rural areas, according to economy and social development. Random sample selection of six neighborhood committees (urban) or villages (rural) equal to the proportion of the local population was conducted. Thirty households were randomly sampled from each neighborhood committee or village.

    The 2015 survey was based on the national mortality surveillance system. Multistage stratified cluster random sampling was conducted in 302 surveillance sites of eight strata according to the proportion of the urban population (high/low), overall population size (high/low), and mortality rate (high/low). The first stage of sampling involved systematic sampling of population size ranking of three towns (streets or regiments). In the second stage of sampling, two villages (neighborhood committee or company) in each town were randomly selected by systematic sampling of population size ranking. In the third stage, 45 households were randomly sampled in each community or village. All three surveys were approved by the Ethical Committee of the Chinese Center for Disease Control and Prevention, and all participants provided written informed consent.

    Similar survey questionnaires and fasting blood measurements were conducted all in studies. A standard questionnaire was conducted by face-to-face interviews at the participants' home, and anthropometric measurements were measured at a community health center; both activities were conducted by trained staff. The questionnaire included general demographic information, such as age, education level, marital status, income, and lifestyle behaviors, including smoking and alcohol consumption. An overnight fasting blood sample was collected by qualified nurses by venipuncture from the antecubital vein before breakfast. Samples were allowed to stand for 30-60 minutes and then centrifuged at 1, 500 rpm for 10 minutes. The centrifuged serum samples were transported to a laboratory and stored at -80 ℃. The blood collection procedure, processing, and determination were identical in the three surveys. Serum TC, LDL-c, HDL-c, and TG were measured by a Hitachi 7600 automatic biochemical analyzer (Hitachi Inc., Tokyo, Japan) with reagents obtained from Wako Pure Chemical Industries Ltd. (Tokyo, Japan) at the central laboratory of the Beijing CDC and National Institute for Nutrition and Health, China CDC. Non-HDL-c was calculated by the equation TC − HDL-c. According to the guidelines of Chinese adult dyslipidemia prevention and treatment (2016 revised edition), a serum TC concentration greater than 6.22 mmol/L (240 mg/dL) is considered hypercholesterolemia, TG greater than 2.26 mmol/L (200 mg/dL) is considered hypertriglyceridemia, LDL-c greater than 4.14 mmol/L (160 mg/dL) is considered high LDL-c, and HDL-c lower than 1.04 mmol/L (40 mg/dL) is considered low HDL-c.

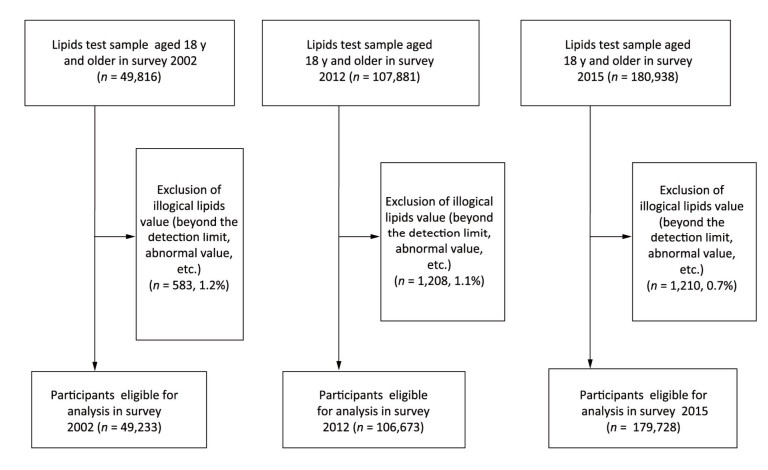
    In these surveys, participants aged 18 years and above and who were healthy and able to walk freely to the survey location were included in the survey. Those with missing values of basic demographic information, lysed blood samples, or samples with missing or illogical data were excluded following unified data cleansing rules. Figure 1 showed the flow diagram summarizing the three surveys.

    Figure 1.  Flow diagram summarizing the study population.

    All data in the three surveys were collected using specialized software, and data analyses were performed using SAS (Statistical Analysis System) for Windows v9.3.2 (SAS Institute, Cary, NC, USA). As the age, gender, and district distribution of the Chinese population differed among the years 2002, 2010, and 2015, a sampling weight was assigned to each participant based on the study design. During analysis of the prevalence of dyslipidemia and mean levels of lipids, we calculated standardized age and gender values, respectively, based on the 2010 national census data. Specifically, weighted serum TC, TG, HDL-c, and LDL-c, lipid-related ratios, and the prevalence of dyslipidemia in all three surveys were adjusted by using data from the sixth census of the National Bureau of Statistics conducted in 2010. The PROC SURVEYMEANS and PROC SURVEYFREQ procedures in SAS were used to calculate means and proportions, and 95% confidence intervals (95% CIs) were used to reflect the complex sampling design and weights of these surveys, as well as provide nationally representative estimates. A general linear model was used to estimate P for the trend of mean level of lipid profiles, and the chi-squared test was used to calculate P for the trend of prevalence of dyslipidemia. Bilateral P-values < 0.05 were considered statistically significant.

    Table 1 shows the demographic characteristics of participants in the three surveys. The final sample sizes were 49, 233 in the 2002 survey (16, 828 in urban areas; 32, 405 in rural areas), 106, 673 in the 2010 survey (54, 016 in urban areas; 52, 657 in rural areas), and 179, 728 (73, 443 in urban areas; 106, 285 in rural area) in the 2015 survey. No statistical difference in genders was found among the three surveys.

    Table 1.  Demographic Characteristic Information of Participants in 2002, 2010, and 2015
     | Show Table
    DownLoad: CSV

    In the 2002 survey, the mean age was 45.3 years (47.4 years in urban areas; 44.2 years in rural areas). Participants of Han descent accounted for 90.0% of the population (94.7% of the population in urban areas; 87.6% of the population in rural areas). Most participants completed junior or senior high school in urban areas; in rural areas, 50.2% of the participants attended primary school or below and only 2.6% had gone to college or above. The annual income of most participants was below 5, 000 RMB (44.7% in urban areas; 85.3% in rural areas).

    The mean age in the 2010 survey was 52.0 years (50.5 years in urban areas; 52.3 years in rural areas) while that in the 2015 survey was 52.2 years (52.3 years in urban areas; 52.1 years in rural areas). An increasing trend of age was observed in the three surveys (P < 0.001). The number of participants with higher education levels and annual income significantly increased over the years (P < 0.001).

    The total proportion of smokers was 26.6% (24.3% in urban areas; 27.7% in rural areas) in 2002, but no trend of smoking was observed among the three surveys. A significant decreasing trend of total proportion of drinkers from 22.3% in 2002 (23.1% in urban areas; 21.9% in rural areas) to 24.5% in 2010 (23.6% in urban area; 25.5% in rural areas) and then to 19.2% in 2015 (17.7% in urban areas; 20.0% in rural areas) (P < 0.001) was noted. By contrast, mean BMI showed a significant increasing trend from 23.2 kg/m2 in 2002 to 23.9 kg/m2 in 2010 and then to 24.2 kg/m2 in 2015 (P < 0.001). The proportions of low body weight (< 18.5 kg/m2), normal weight (18.5-23.9 kg/m2), overweight (24.0-27.9 kg/m2), and obese (≥ 28.0 kg/m2) participants significantly differed among the surveys (P < 0.001). Although the number of participants who had taken lipid control measures significantly increased from 2.4% in 2002 to 4.6% in 2010 and then to 4.5 in 2015 (P < 0.001), the overall proportion was still very low.

    The trends of weighted adjustment Measurement of lipid control of lipid profiles among Chinese adults are demonstrated in Table 2. Total mean TC level and their 95% CIs significantly increased from 3.93 (3.87-3.99) mmol/L in 2002 to 4.59 (4.54-4.63) mmol/L in 2010 and then to 4.63 (4.59-4.67) mmol/L in 2015 (P < 0.001). Mean TG levels and their 95% CIs also significantly increased from 1.12 (1.10-1.15) mmol/L to 1.41 (1.39-1.44) mmol/L and then to 1.47 (1.45-1.50) mmol/L. However, mean HDL-c levels and their 95% CIs significantly decreased from 1.30 (1.28-1.31) mmol/L to 1.18 (1.16-1.20) mmol/L and then to 1.26 (1.24-1.27) mmol/L. Mean LDL-c levels and 95% CIs significantly increased from 2.12 (2.08-2.17) mmol/L to 2.78 (2.75-2.82) mmol/L and then to 2.87 (2.84-2.90) mmol/L (P < 0.001). Between the 2002 and 2010 surveys, mean levels of lipids, such as TC, TG and LDL-c, were higher in urban areas than in rural areas, but HDL-c concentrations were similar. However, in the 2015 surveys, TG and LDL-c levels were higher in urban areas than in rural areas; moreover, TC levels between urban and rural areas differed but HDL-c levels were higher in rural areas than in urban area. TG levels were much higher in males than in females in all three surveys. Increasing trends of TC, TG, and LDL-c levels were observed in males from 2002 to 2015; in females, the change in HDL-c was not significant. TC, TG, and LDL-c levels almost increased significantly with increasing age; in the 75-year-old group, a slight fluctuation of HDL-c level with no significant difference was observed during the period. Longitudinally, regardless of area, gender, or BMI, TC, TG, and LDL-c levels consistently increased whereas HDL-c levels decreased from 2002 to 2015 (P < 0.001). Weighted adjusted means of non-HDL-c levels in Table 3 showed an increasing trend in all age groups and both genders. An increasing trend of mean non-HDL-c levels was observed in urban and rural areas from 2002 to 2015. Similarly, the ratios of TC/HDL-c, TG/HDL-c, and LDL-c/HDL-c showed increasing trends among all genders, districts, ages, and BMIs (P < 0.001).

    Table 2.  Lipids Profiles among Participants in Survey 2002, 2010, and 2015 [mean (95% CI)]
     | Show Table
    DownLoad: CSV
    Table 3.  Non-HDL-c and Lipid-related Ratios among Participants in Survey 2002, 2010, and 2015 [mean (95% CI)]
     | Show Table
    DownLoad: CSV

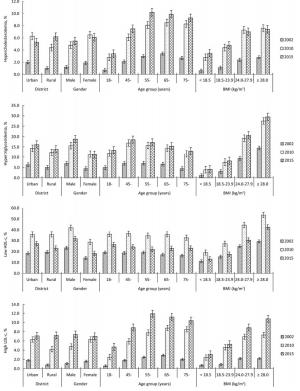
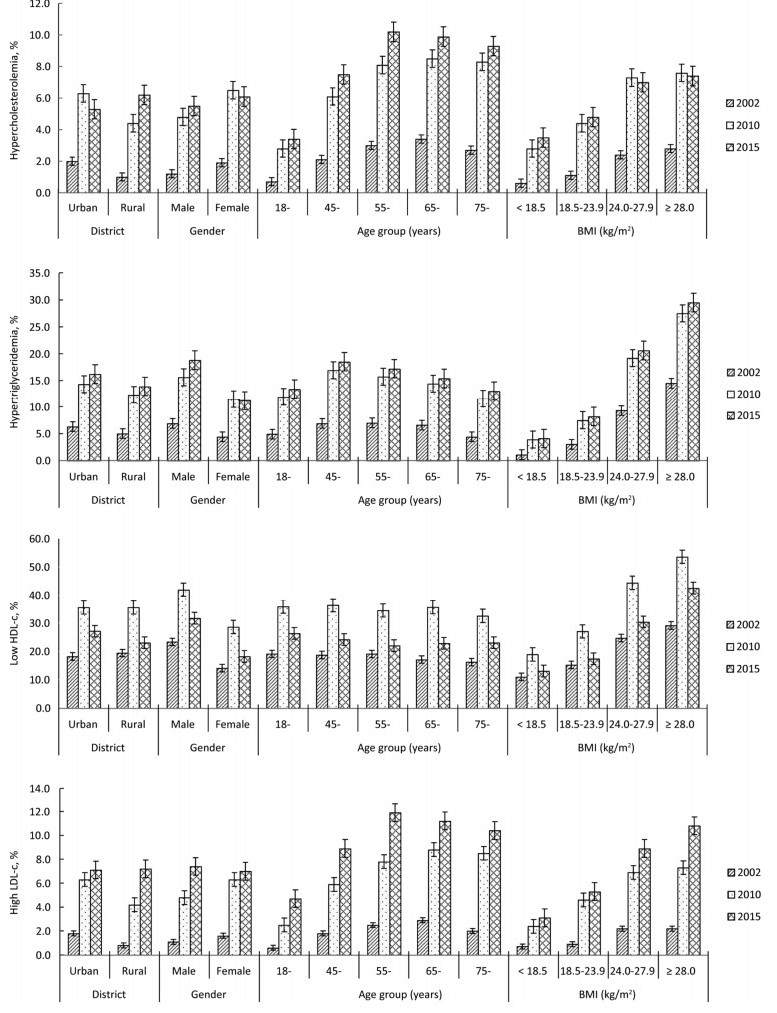
    Figure 2 shows the prevalence of dyslipidemia among Chinese adults from 2002 to 2015. The total weighted adjusted prevalence of hypercholesterolemia was 1.6% (95% CI: 1.3%-1.8%) in 2002, increased to 5.6% (95% CI: 5.1%-6.1%) in 2010, and then increased to 5.8% (95% CI: 5.3%-6.3%) in 2015 (P for trend < 0.001). Hypertriglyceridemia prevalence dramatically increased from 5.7% (95% CI: 5.1%-6.3%) to 13.6% (95% CI: 12.9%-14.2%) and then to 15.0% (95% CI: 14.3%-15.7%). Low HDL-c prevalence changed remarkably over these years, increasing from 18.8% (95% CI: 17.0%-20.6%) to 35.5% (95% CI: 33.3%-37.6%) and then to 24.9% (95% CI: 23.5%-26.4%). Similarly, LDL-c prevalence increased from 1.3% to 5.6% and then to 7.2% over the 13-year interval. Among urban and rural participants, the prevalence of hypercholesterolemia were much higher in the former than in the latter in the 2002 and 2010 surveys; however, in 2015, hypercholesterolemia prevalence was slightly higher in rural areas than in urban areas. Furthermore, in 2002, hypercholesterolemia prevalence was higher in females than in males, and it increased from 0.7% in the 18-year-old group to 3.4% in the 65-year-old group but then decreased to 2.7% in the 75-year-old group. Similar distributions of hypercholesterolemia were observed in the 2010 and 2015 surveys. From a longitudinal perspective, the prevalence of hypercholesterolemia from 2002 to 2015 remarkably increased in rural areas from 1.0% to 4.4% and then to 6.2%; interestingly, however, this prevalence in urban areas increased from 2.0% to 6.3% but then declined to 5.3%. About high LDL-c similar results with hypercholesterolemia was observed in both urban and rural areas, as well as in all genders, age groups, and BMI groups. However, hypertriglyceridemia prevalence was higher in males than in females, higher in urban areas than in rural areas, and higher in middle-aged adults than in their elderly counterparts. Longitudinally, an increasing trend of hypertriglyceridemia prevalence could be observed from 2002 to 2015. Low HDL-c prevalence was much higher in the dyslipidemia type. Moreover, HDL-c prevalence was higher in rural areas than in urban areas in 2002, while this prevalence was similar between areas in 2010 and then higher in urban areas than in rural areas in 2015. Interestingly, in the age groups of 55 years and above, the trends of low HDL-c prevalence were not statistically significant among the three survey years.

    Figure 2.  Prevalence of dyslipidemia among participants in survey 2002, 2010, and 2015.

    In this study, blood lipid data from three nationally representative surveys were analyzed. We found that dyslipidemia increased rapidly from 2002 to 2015. However, slight differences in trend among areas, genders, ages, and BMI were found. Due to differences in geographical distribution and lifestyle in China, some gap in public health services and strategies for the prevention and control of chronic diseases remain between urban and rural areas. Urban residents are more likely to develop healthy living habits than their rural counterparts to reduce the risk-factors of CVDs. As rural residents become more affluent, they may develop unhealthy lifestyle behaviors and psychosocial problems. Urbanization of China may bring about great challenge to the country's CVD burden.

    Declining TC and LDL-c levels have been reported in some developed countries, such as the United States of America (USA) and Japan, as well as in a number of European countries. Data from the USA show mean levels of TC, TG, LDL-c, and non-HDL-c higher than those in China, although TC, TG, and non-HDL-c levels reveal a decreasing trend whereas mean HDL-c levels reveal a linear increase. These favorable trends of lipids and lipoproteins may generally be attributed to the consistent use of lipid-lowering medication. A study conducted in Kuwait from 1998 to 2009 showed an increasing trend until 2006-2007 (56.0% in males and 53.6% in females) except in 2002-2003, after which a significant decline was recorded for in both genders (33.7% of men; 30.6% of women). Studies conducted in other Asia-Pacific and Middle Eastern regions, such as Tehran and Pakistan, also show similar trends. A favorable trend of all lipid components was observed in Tehran adults after two decades of follow-up; such improvements were attributed to the increased use of lipid-lowering medication and wider knowledge of the adverse influence of hydrogenated oil. In Pakistan, low HDL-c (17.2%) and Hypertriglyceridemia (11.2%) are the most prevalent form of dyslipidemia, similar to the Chinese population. Because of the inconspicuous symptoms of dyslipidemia, as well as their lack of knowledge, survey participants in China tended not to actively test for blood lipids until their cardiovascular system had been damaged. Considering that high lipids level and maintained dyslipidemia are significant risk factors for CHD events, it will be much more severe in CVD burden especially in China.

    In contrast to other Western countries, low HDL-c is the major subtype of dyslipidemia in China, likely due to the carbohydrate-dominant diet of the country and related increases in obesity and diabetes. This study found that the prevalence of low HDL-c in males is much higher than that in females, although similar trends of prevalence of low HDL-c were noted in both genders over the 13-year period considered in this work. The changes in HDL-c levels and low-HDL-c prevalence observed in this study may be attributed to changes in lifestyle. Besides genetic factors, some drugs, obesity, inactivity, cigarette smoking, and long-term heavy drinking are known to contribute to decreased serum HDL-c levels; a poly-unsaturated fat-rich or low-carbohydrate diet may improve these levels. The proportion of total fat in total calories increased but carbohydrate intake decreased in Chinese men, and the rate of physical activity with more than moderate degree showed a decreasing trend within the period. Undesirable lifestyle behaviors, such as smoking and alcohol consumption, in combination with decreased physical activity, can also elevate TC, LDL-c and TG levels. Study reported that heavier cigarette smoking leads to significantly higher TG and lower HDL-c levels; thus, cessation of smoking could benefit normal lipid maintenance. Although moderate alcohol drinking may increase HDL-c levels, such consumption is not generally recommended as a protective factor for dyslipidemia on account of its potential risk to health. Inactive lifestyles increase plasma insulin levels, insulin resistance, the waist circumference, and visceral fat and decrease adiponectin levels. Obesity, which increases cardiovascular risk by increasing plasma triglycerides and promoting high LDL-c and low HDL-c, is also common among the middle-aged and older population. These lipid abnormalities are typical features of metabolic syndrome.

    As the second most common dyslipidemic abnormality, hypertriglyceridemia is widely prevalent, especially in China. Elevated plasma TG levels often lead to both LDL-c and HDL-c metabolic disorders, and it is a strong risk factor for the development of atherosclerotic CVD. A one standard deviation increase in log-transformed blood TG concentration has been associated with a 20% increase in CHD. In the present study, TG levels and hypertriglyceridemia among residents living in urban and rural communities linearly increased over the years. However, low TG levels and hypertriglyceridemia were more prevalent in females than in males, in accordance with findings in previous studies. This difference in gender may be attributed to the increased participation of women in healthy lifestyle activities and a greater awareness of health in this gender. Therefore, health programs promoting dyslipidemia awareness among males could be implemented.

    Interesting trends of lipids and dyslipidemia among the elderly, especially in the age group of 75 years and above, were noted over the survey years. TC, TG, LDL-c, and non-HDL-c levels, as well as dyslipidemia, increased from the younger- to the middle-aged subgroups but then decreased in the 75-years-and-above subgroup. As age increases, basal metabolism slows down and calorie intake is stored as fat in the body. Increased use of medication for chronic diseases among older participants may have also influenced the decreasing level of lipids found. Lipid prevention and control in the elderly is complicated, and further studies are needed. Statins are regarded as effective drugs for lowering blood lipids, and several large studies have confirmed the efficacy and safety of statins in the primary or secondary prevention of CHD. The use of statins for hypercholesterolemia has been attempted in clinical trials in Japan and Korea; indeed, many clinical trials on statins have also been conducted in China. However, in epidemic studies, the treatment rate was only 6.8% in adults and 14.4% in middle-aged and older within dyslipidemia subjects and only 3.5% to 4.9% was controlled in China, all of the trends in each subgroup are consistent with weak awareness and inadequate control rate of dyslipidemia, so it should be controlled strictly to prevent macro-vascular or micro-vascular complications in middle-aged population.

    Our study presents several limitations. First, all of the data were based on three cross-sectional surveys over a 13-year period; thus, the effect of genetic factors on lipid profiles was not considered. Secondly, although our analyses included various districts, genders, and age groups, the data obtained are insufficient to analyze the factors influencing lipids over the same survey period. Third, the measurement methods for lipids and lipoproteins in the three surveys were similar but used different test reagents and instruments and were operated by different technicians; these variations may contribute systematic errors to our work. However, despite these limitations, the surveys we utilized, which are known to provide nationally representative data, enabled us to estimate the current health status of Chinese adults. Further data from longitudinal surveys are needed to verify these trends; examination of the influence of various lifestyle factors is also recommended for future research.

    Nationwide surveys conducted in 2002, 2010, and 2015 revealed an increasing trend in the prevalence of dyslipidemia among Chinese adults. Increasing trends of TC, TG, LDL-c, and non-HDL-c levels and lipid-related ratios were observed in all gender, area, and BMI groups; however, dyslipidemia prevalence, especially low HDL-c levels, did not show similar tendencies among the age subgroups. These findings demonstrate that an enhanced strategy is needed to control dyslipidemia and prevent CVDs among Chinese adults.

    The authors' contributions are as follows: SONG Peng Kun conceived and designed the study; SONG Peng Kun, MAN Qing Qing, LI Hong, PANG Shao Jie, JIA Shan Shan, and LI Yu Qian conducted the research and collected and supervised the samples; SONG Peng Kun analyzed the data and wrote the manuscript; HE Li, ZHAO Wen Hua, and ZHANG Jian supervised the study. All authors have read and approve of the final manuscript.

    We acknowledge all participants and staff of National Institute for Nutrition and Health, China Center for Disease Control and Prevention, all members of the project team, and all participants for their support and cooperation.

    None of the researchers or technicians have conflicts of interest to declare.

  • [1] Moran A, Gu D, Zhao D, et al. Future cardiovascular disease in china:Markov model and risk factor scenario projections from the coronary heart disease policy model-china. Circ Cardiovasc Qual Outcomes, 2010; 3, 243-52. doi:  10.1161/CIRCOUTCOMES.109.910711
    [2] Force M, Catapano AL, Graham I, et al. 2016 esc/eas guidelines for the management of dyslipidaemias:The task force for the management of dyslipidaemias of the european society of cardiology (esc) and european atherosclerosis society (eas) developed with the special contribution of the european assocciation for cardiovascular prevention & rehabilitation (eacpr). Atherosclerosis, 2016; 253, 281-344. doi:  10.1016/j.atherosclerosis.2016.08.018
    [3] Rosenberg K. High ldl-c, non-hdl-c levels associated with higher cvd death risk, even in those at low cvd risk. Am J Nurs, 2018; 118, 67. http://www.onacademic.com/detail/journal_1000041622544999_8f6b.html
    [4] Wang K, Shan S, Zheng H, et al. Non-hdl-cholesterol to hdl-cholesterol ratio is a better predictor of new-onset non-alcoholic fatty liver disease than non-hdl-cholesterol:A cohort study. Lipids Health Dis, 2018; 17, 196. doi:  10.1186/s12944-018-0848-8
    [5] Yokoyama K, Tani S, Matsuo R, et al. Increased triglyceride/high-density lipoprotein cholesterol ratio may be associated with reduction in the low-density lipoprotein particle size:Assessment of atherosclerotic cardiovascular disease risk. Heart Vessels, 2019; 34, 227-36. doi:  10.1007/s00380-018-1247-9
    [6] Song PK, Li H, Man QQ, et al. Trends in determinants of hypercholesterolemia among chinese adults between 2002 and 2012:Results from the national nutrition survey. Nutrients, 2017; 9, 279. doi:  10.3390/nu9030279
    [7] Joint committee for the revision of guidelines for the prevention and treatment of dyslipidemia in Chinese adults. Guidelines for the prevention and treatment of dyslipidemia in chinese adults (2016 revision). Chinese Circulation Journal, 2016; 31, 937-53. (In Chinese)
    [8] National Bureau of Statistics. Tabulation on the 2010 population census of the people's republic of china. China Statistics Press, Beijing, 2012.
    [9] Carroll MD, Lacher DA, Sorlie PD, et al. Trends in serum lipids and lipoproteins of adults, 1960-2002. JAMA, 2005; 294, 1773-81. doi:  10.1001/jama.294.14.1773
    [10] Ferrieres J, Bongard V, Dallongeville J, et al. Trends in plasma lipids, lipoproteins and dyslipidaemias in french adults, 1996-2007. Arch Cardiovasc Dis, 2009; 102, 293-301. doi:  10.1016/j.acvd.2009.02.002
    [11] Cohen JD, Cziraky MJ, Cai Q, et al. 30-year trends in serum lipids among United States adults:results from the National Health and Nutrition Examination Surveys Ⅱ, Ⅲ, and 1999-2006. Am J Cardiol, 2010; 106, 969-75. doi:  10.1016/j.amjcard.2010.05.030
    [12] Danaei G, Finucane MM, Lu Y, et al. National, regional, and global trends in fasting plasma glucose and diabetes prevalence since 1980:Systematic analysis of health examination surveys and epidemiological studies with 370 country-years and 2.7 million participants. Lancet, 2011; 378, 31-40. doi:  10.1016/S0140-6736(11)60679-X
    [13] Carroll MD, Kit BK, Lacher DA, et al. Trends in lipids and lipoproteins in us adults, 1988-2010. Jama, 2012; 308, 1545-54. doi:  10.1001/jama.2012.13260
    [14] Okamura T. Dyslipidemia and cardiovascular disease:A series of epidemiologic studies in japanese populations. J Epidemiol, 2010; 20, 259-65. doi:  10.2188/jea.JE20100060
    [15] Mercado CI, Gregg E, Gillespie C, et al. Trends in lipid profiles and descriptive characteristics of U. S. adults with and without diabetes and cholesterol-lowering medication use-national health and nutrition examination survey, 2003-2012, United States. PloS One, 2018; 13, e0193756. doi:  10.1371/journal.pone.0193756
    [16] Ahmed F, Waslien C, Al-Sumaie M, et al. Trends and risk factors of hypercholesterolemia among Kuwaiti adults:National Nutrition Surveillance Data from 1998 to 2009. Nutrition, 2014; 28, 917-23. http://www.sciencedirect.com/science/article/pii/S0899900712000056
    [17] Baghbani-Oskouei A, Tohidi M, Asgari S, et al. Serum Lipids during 20 years in the Tehran Lipid and Glucose Study:Prevalence, trends and impact on non-communicable diseases. Int J Endocrinol Metab, 2018; 16, e84750.
    [18] Zaid M, Hasnain S. Plasma lipid abnormalities in Pakistani population:trends, associated factors, and clinical implications. Braz J Med Biol Res. 2018; 51, e7239. https://www.onacademic.com/detail/journal_1000040509475810_cd36.html
    [19] Nejat A, Mirbolouk M, Mohebi R, et al. Changes in lipid measures and incident coronary heart disease:Tehran lipid & glucose study. Clin Biochem, 2014; 47, 1239-44. doi:  10.1016/j.clinbiochem.2014.03.004
    [20] Zhao WH, Zhang J, Zhai Y, et al. Blood lipid profile and prevalence of dyslipidemia in chinese adults. Biomed Environ Sci, 2007; 20, 329-35. http://www.wanfangdata.com.cn/details/detail.do?_type=perio&id=bes200704013
    [21] Nakamura Y, Okuda N, Turin TC, et al. Fatty acids intakes and serum lipid profiles:NIPPON DATA90 and the national nutrition monitoring. J Epidemiol, 2010; 20, S544-8. doi:  10.2188/jea.JE20090223
    [22] Kong C, Nimmo L, Elatrozy T, et al. Smoking is associated with increased hepatic lipase activity, insulin resistance, dyslipidaemia and early atherosclerosis in Type 2 diabetes. Atherosclerosis, 2001; 156, 373-8. doi:  10.1016/S0021-9150(00)00664-X
    [23] Wood AM, Kaptoge S, Butterworth AS, et al. Risk thresholds for alcohol consumption:combined analysis of individual-participant data for 599 912 current drinkers in 83 prospective studies. Lancet, 2018; 391, 1513-23. doi:  10.1016/S0140-6736(18)30134-X
    [24] Joshi SR, Anjana RM, Deepa M, et al. Prevalence of dyslipidemia in urban and rural India:the ICMR-INDIAB study. PLoS One, 2014; 9, e96808. doi:  10.1371/journal.pone.0096808
    [25] Klop B, Elte JW, Cabezas MC. Dyslipidemia in obesity:mechanisms and potential targets. Nutrient, 2013; 5, 1218-40. doi:  10.3390/nu5041218
    [26] Miller M, Stone NJ, Ballantyne C, et al. Triglycerides and cardiovascular disease:A scientific statement from the american heart association. Circulation, 2011; 123, 2292-333. doi:  10.1161/CIR.0b013e3182160726
    [27] Nordestgaard BG, Varbo A. Triglycerides and cardiovascular disease. Lancet, 2014; 384, 626-35. doi:  10.1016/S0140-6736(14)61177-6
    [28] Chapman MJ, Ginsberg HN, Amarenco P, et al. Triglyceride-rich lipoproteins and high-density lipoprotein cholesterol in patients at high risk of cardiovascular disease:evidence and guidance for management. Eur Heart J, 2011; 32, 1345-61. doi:  10.1093/eurheartj/ehr112
    [29] Huang Y, Gao L, Xie X, et al. Epidemiology of dyslipidemia in chinese adults:Meta-analysis of prevalence, awareness, treatment, and control. Popul Health Metr, 2014; 12, 28. doi:  10.1186/s12963-014-0028-7
    [30] Pan L, Yang Z, Wu Y, et al. The prevalence, awareness, treatment and control of dyslipidemia among adults in china. Atherosclerosis, 2016; 248, 2-9. doi:  10.1016/j.atherosclerosis.2016.02.006
    [31] Baigent C, Keech A, Kearney PM, et al. Efficacy and safety of cholesterol-lowering treatment:prospectivemeta-analysis of data from 90, 056 participants in 14 randomised trials ofstatins. Lancet, 2005; 366, 1267-78. doi:  10.1016/S0140-6736(05)67394-1
    [32] Nicholls SJ, Brandrup-Wognsen G, Palmer M, et al. Meta-analysis of comparative efficacy of increasing dose of Atorvastatin versus Rosuvastatin versus Simvastatin on lowering levels of atherogenic lipids (from VOYAGER). Am J Cardiol, 2010; 105, 69-76. doi:  10.1016/j.amjcard.2009.08.651
    [33] Kong SH, Koo BK, Moon MK. Efficacy of Moderate Intensity Statins in the Treatment of Dyslipidemia in Korean Patients with Type 2 Diabetes Mellitus. Diabetes Metab J, 2017; 41, 23-30. doi:  10.4093/dmj.2017.41.1.23
    [34] Otsuka T, Mizuno K, Shinozaki T, et al. Preventive effect of pravastatin on the development of hypertension in patients with hypercholesterolemia:A post-hoc analysis of the Management of Elevated Cholesterol in the Primary Prevention Group of Adult Japanese (MEGA) Study. J Clin Lipidol, 2017; 11, 998-1006. doi:  10.1016/j.jacl.2017.05.015
    [35] Ang J, Li LJ, He YC, et al. An exploring study on the pharmacodynamics of rosuvastatin in Chinese hypercholesterolemic patients. Chin J Clin Pharm Ther, 2010; 15, 894-900. http://d.old.wanfangdata.com.cn/Periodical/zglcylxyzlx201008012
    [36] Zhao S, Peng D. Efficacy and safety of rosuvastatin versus atorvastatin in high-risk Chinese patients with hypercholesterolemia:a randomized, double-blind, active-controlled study. Curr Med Res Opin, 2018; 34, 227-35. doi:  10.1080/03007995.2017.1371584
    [37] Wu LX. Efficacy and safety of rosuvastatin in aged patients with coronary heart disease and hypercholesterolemia. Chin Mod Med, 2013; 20, 70-1. http://www.wanfangdata.com.cn/details/detail.do?_type=perio&id=zhongguoyy201107003
    [38] Li JH, Wang LM, Mi SQ, et al. Awareness rate, treatment rate and control rate of dyslipidemia in chinese adults, 2010. Chin J Prev Med, 2012; 46, 687-91. (In Chinese) http://www.wanfangdata.com.cn/details/detail.do?_type=perio&id=zhyfyx201208004
    [39] Song P, Zha M, Yang X, et al. Socioeconomic and geographic variations in the prevalence, awareness, treatment and control of dyslipidemia in middle-aged and older chinese. Atherosclerosis, 2019; 282, 57-66. (In Chinese) doi:  10.1016/j.atherosclerosis.2019.01.005
    [40] Zhang FL, Xing YQ, Wu YH, et al. The prevalence, awareness, treatment, and control of dyslipidemia in northeast china:A population-based cross-sectional survey. Lipids Health Dis, 2017; 16, 61. doi:  10.1186/s12944-017-0453-2
  • 加载中
  • Cited by

    Periodical cited type(86)

    1. Jia, H., Wei, L., Geng, Y. et al. Prevalence of dyslipidemia and influencing factors in HIV-infected people before starting antiretroviral therapy in China, 2018-2023 | [2018-2023年中国HIV感染者启动抗病毒治疗前的血脂异常特征及影响因素分析]. Chinese Journal of Epidemiology, 2025, 46(1): 95-100. doi:10.3760/cma.j.cn112338-20240902-00546
    2. Liu, M., He, X., Yang, X. et al. Interpretation of Report on Cardiovascular Health and Diseases in China 2023 | [《中国心血管健康与疾病报告 2023》要点解读]. Chinese General Practice, 2025, 28(1): 20-38. doi:10.12114/j.issn.1007-9572.2024.0293
    3. Zhu, L., Fang, Z., Huang, M. et al. Association Between ERBB2 and ERBB3 Polymorphisms and Dyslipidaemia and Serum Lipid Levels in a Chinese Population. Biochemical Genetics, 2025. doi:10.1007/s10528-025-11048-9
    4. Zeng, B., Yin, F. Application of a high-performance grey prediction model to predict the cardiovascular disease mortality in elderly Chinese residents. Applied Mathematical Modelling, 2025, 137: 115664. doi:10.1016/j.apm.2024.115664
    5. Zhang, X., Hu, H., He, L. et al. Association between triglyceride to high-density lipoprotein cholesterol ratio and microalbuminuria in the Chinese population. Scientific Reports, 2024, 14(1): 30960. doi:10.1038/s41598-024-82084-5
    6. Yang, T., Li, W., Chen, W. et al. Protocol for a systematic review and meta-analysis of the combination of ezetimibe and statins for hyperlipidemia. PLoS ONE, 2024, 19(12): e0312588. doi:10.1371/journal.pone.0312588
    7. Zhao, M., Cheng, Y., Li, M. et al. Temporal changes in lipid concentrations and the prevalence of dyslipidemia among individuals with diabetes, prediabetes, and normal blood glucose from 2011 to 2015. Lipids in Health and Disease, 2024, 23(1): 394. doi:10.1186/s12944-024-02375-8
    8. Yang, C., You, N., Chen, Y. et al. Helicobacter pylori infection increases the risk of dyslipidemia in Chinese diabetic Population: a retrospective cross-sectional study. BMC Infectious Diseases, 2024, 24(1): 730. doi:10.1186/s12879-024-09597-2
    9. Zheng, C., Liu, Y., Xu, C. et al. Association between obesity and the prevalence of dyslipidemia in middle-aged and older people: an observational study. Scientific Reports, 2024, 14(1): 11974. doi:10.1038/s41598-024-62892-5
    10. Wang, X.-Y., Ye, X.-F., Wang, W.-Y.-Y. et al. Fasting hypertriglyceridemia in relation to mortality in an elderly male Chinese population. Journal of Clinical Hypertension, 2024, 26(10): 1163-1170. doi:10.1111/jch.14887
    11. Li, X., Wang, L., Zhang, G. Progress in the study of the correlation between dyslipidemia and demyelinating diseases of the nervous system | [血脂异常与神经系统脱髓鞘疾病的相关性研究进展]. Chinese Journal of Preventive Medicine, 2024, 58(9): 1295-1301. doi:10.3760/cma.j.cn112150-20240110-00042
    12. [无可用作者姓名]. Report on Cardiovascular Health and Diseases in China 2023: An Updated Summary. Biomedical and Environmental Sciences, 2024, 37(9): 949-992. 本站查看
    13. Zhao, W., Wang, Y., Li, J. et al. Efficacy and safety of omega-3-acid ethyl acetate 90 capsules in severe hypertriglyceridemia: A randomized, controlled, multicenter study. Lipids, 2024, 59(5): 145-157. doi:10.1002/lipd.12406
    14. Zhou, H., Zhang, W., Cai, X. et al. Unraveling the link between hypertriglyceridemia, dampness syndrome, and chronic diseases: A comprehensive observational study. Medicine (United States), 2024, 103(33): e39207. doi:10.1097/MD.0000000000039207
    15. Wu, Q., Wei, H., Lu, C. et al. Establishment of precise prevention strategies for the occurrence and progression of coronary atherosclerotic heart disease using machine learning. Heliyon, 2024, 10(15): e35797. doi:10.1016/j.heliyon.2024.e35797
    16. Su, W., Zhang, Y., Ma, S. Trend and Prediction Analysis of the Changing Disease Burden of Ischemic Heart Disease in China and Worldwide from 1990 to 2019 | [1990—2019 年中国和全球缺血性心脏病疾病负担变化趋势与发病预测分析]. Chinese General Practice, 2024, 27(19): 2375-2381 and 2387. doi:10.12114/j.issn.1007-9572.2023.0498
    17. [无可用作者姓名]. Report on Cardiovascular Health and Diseases in China 2023: an Updated Summary | [中国心血管健康与疾病报告 2023 概要]. Chinese Circulation Journal, 2024, 39(7): 625-660. doi:10.3969/j.issn.1000-3614.2024.07.001
    18. Wang, T., Xu, X., Guo, Z. et al. Stropharia Rugosoannulata Polysaccharides Alleviated Hyperlipidemia Via Lkb1/Ampk Signaling Pathway in Hepatocytes. Current Topics in Nutraceutical Research, 2024, 22(2): 806-817. doi:10.37290/ctnr2641-452X.22:806-817
    19. Jin, M., Qin, X., Maliya, A. et al. Status and Influencing Factors of Dyslipidemia,Hypertension and Diabetes Comorbidities among Kazakhs in Xinjiang | [新疆哈萨克族血脂异常、高血压和糖尿病共病现状及影响因素研究]. Chinese General Practice, 2024, 27(12): 1438-1444. doi:10.12114/j.issn.1007-9572.2023.0625
    20. Peng, W., Chen, S., Chen, X. et al. Trends in major non-communicable diseases and related risk factors in China 2002–2019: an analysis of nationally representative survey data. The Lancet Regional Health - Western Pacific, 2024, 43: 100809. doi:10.1016/j.lanwpc.2023.100809
    21. Liu, M., He, X., Yang, X. et al. Interpretation of Report on Cardiovascular Health and Diseases in China 2023 | [《中国心血管健康与疾病报告2023》要点解读]. Journal of Clinical Cardiology, 2024, 40(8): 599-616. doi:10.13201/j.issn.1001-1439.2024.08.002
    22. Wang, Y., Yan, T., Yang, Y. et al. Association between changes in high-density lipoprotein cholesterol and risk of cardiovascular disease. Journal of Clinical Lipidology, 2024. doi:10.1016/j.jacl.2024.09.001
    23. Cao, F., Yang, J., Zhou, Y. What Promotes Residents' Health? Identifying the Direct and Indirect Impacts of Community Environment on Residents' Health. International Review for Spatial Planning and Sustainable Development, 2024, 12(1): 117-134. doi:10.14246/IRSPSD.12.1_117
    24. Hu, S.-S.. Cardiovascular Risk Factors in China. Journal of Geriatric Cardiology, 2024, 21(2): 153-199. doi:10.26599/1671-5411.2024.02.008
    25. Qi, T., Ge, J. Research progress of therapeutic exercise therapy for metabolic disorder | [代谢紊乱运动疗法研究进展]. Chinese Journal of Health Management, 2024, 18(1): 73-77. doi:10.3760/cma.j.cn115624-20231023-00215
    26. Zhao, Y., Zhang, H., Cheng, J. et al. Association between Dyslipidaemia and Cognitive Impairment: A Meta-Analysis of Cohort and Case-Control Studies. Journal of Integrative Neuroscience, 2024, 23(2): 40. doi:10.31083/j.jin2302040
    27. Wang, X., Wu, Y., Miao, J. et al. Factors associated with eating behaviors in older adults from a socioecological model perspective. BMC Public Health, 2023, 23(1): 1726. doi:10.1186/s12889-023-16651-2
    28. Zhu, Q., Yu, L., Li, Y. et al. Association between dietary approaches to stop hypertension (DASH) diet and hyperuricemia among Chinese adults: findings from a nationwide representative study. Nutrition Journal, 2023, 22(1): 21. doi:10.1186/s12937-023-00845-w
    29. [无可用作者姓名]. Report on Cardiovascular Health and Diseases in China 2022: an Updated Summary. Biomedical and Environmental Sciences, 2023, 36(8): 669-701. 本站查看
    30. Fang, R., Leng, Q., Wang, Y. et al. Clinical characteristics of benign paroxysmal positional vertigo in the oldest old | [老老年良性阵发性位置性眩晕患者的临床特征分析]. Chinese Journal of General Practitioners, 2023, 22(8): 790-795. doi:10.3760/cma.j.cn114798-20230226-00164
    31. Zou, Q., Su, C., Du, W. et al. The Mediation and Moderation Effect Association among Physical Activity, Body-Fat Percentage, Blood Pressure, and Serum Lipids among Chinese Adults: Findings from the China Health and Nutrition Surveys in 2015. Nutrients, 2023, 15(14): 3113. doi:10.3390/nu15143113
    32. Ding, X., Li, J., Zhao, L.-Y. et al. Long maternal working hours were linked to obesity, underweight and stunting in children under age 5 in China. International Journal of Social Welfare, 2023, 32(3): 320-333. doi:10.1111/ijsw.12600
    33. Lan, Y.-M., Ci, C.-H., An, Y. et al. Structural characteristics of intestinal microflora in Yugur population with dyslipidemia | [裕固族血脂异常人群肠道菌群结构特征分析]. Chinese Journal of Microecology, 2023, 35(6): 621-629. doi:10.13381/j.cnki.cjm.202306001
    34. [无可用作者姓名]. Report on Cardiovascular Health and Diseases in China 2022: an Updated Summary | [中国心血管健康与疾病报告 2022 概要]. Chinese Circulation Journal, 2023, 38(6): 583-612. doi:10.3969/j.issn.1000-3614.2023.06.001
    35. [无可用作者姓名]. Multidisciplinary Expert Consensus on the Clinical Management of Hypertriglyceridemia | [高甘油三酯血症临床管理多学科专家共识]. Chinese Circulation Journal, 2023, 38(6): 621-633. doi:10.3969/j.issn.1000-3614.2023.06.003
    36. Hu, S.-S.. Report on cardiovascular health and diseases in China 2021: an updated summary. Journal of Geriatric Cardiology, 2023, 20(6): 399-430. doi:10.26599/1671-5411.2023.06.001
    37. Abid, F.M., Jasim, N.A., Aljeboree, A.M. et al. Adult Normal Value and Deficiency Percentage of Serum Zinc in both Sexes Iraqi Healthy Population, using Atomic Absorption Spectrophotometer (AAS). Journal of Chemical Health Risks, 2023, 13(2): 275-281. doi:10.22034/jchr.2022.695108
    38. Wu, X., Pan, J., Yu, J.J. et al. DiDang decoction improves mitochondrial function and lipid metabolism via the HIF-1 signaling pathway to treat atherosclerosis and hyperlipidemia. Journal of Ethnopharmacology, 2023, 308: 116289. doi:10.1016/j.jep.2023.116289
    39. Miao, K., Cao, W., Lyu, J. et al. A descriptive analysis of hyperlipidemia in adult twins in China | [中国成年双生子高脂血症的分布特征]. Chinese Journal of Epidemiology, 2023, 44(4): 544-551. doi:10.3760/cma.j.cn112338-20221007-00859
    40. ZHANG, M., PENG, K., ZHANG, X. et al. Geographic Variations in the Prevalence, Awareness, Treatment, and Control of Dyslipidemia among Chinese Adults in 2018–2019: A Cross-sectional Study. Biomedical and Environmental Sciences, 2023, 36(4): 313-323. doi:10.3967/bes2023.037
    41. Li, J., Liu, M., Liu, F. et al. Age and Genetic Risk Score and Rates of Blood Lipid Changes in China. JAMA Network Open, 2023, 6(3): E235565. doi:10.1001/jamanetworkopen.2023.5565
    42. [无可用作者姓名]. Chinese Guidelines for Lipid Management (2023) | [中国血脂管理指南(2023 年)]. Chinese Circulation Journal, 2023, 38(3): 237-271. doi:10.3969/j.issn.1000-3614.2023.03.001
    43. [无可用作者姓名]. Chinese guidelines for lipid management (2023) | [中国血脂管理指南(2023 年)]. Chinese Journal of Cardiology, 2023, 51(3): 221-255. doi:10.3760/cma.j.cn112148-20230119-00038
    44. Zhang, T., Xie, T., Deng, Y.-J. et al. Effects of obesity changes on cardiovascular risk factors in people with Dyslipidemia | [血脂舁常人群中体质指数变化对心血管病危险因素的影响]. Modern Preventive Medicine, 2023, 50(3): 385-390. doi:10.20043/j.cnki.MPM.202207187
    45. He, J., Zhuo, T., Teng, Y. et al. A colorimetric assay for cholesterol based on the encapsulation of multienzyme in leaf-shape crossed ZIF-L. Chinese Chemical Letters, 2023, 34(2): 107510. doi:10.1016/j.cclet.2022.05.024
    46. Li, J.-M., Yang, H.-Y., Wu, S.-H. et al. The associations of particulate matter short-term exposure and serum lipids are modified by vitamin D status: A panel study of young healthy adults. Environmental Pollution, 2023, 317: 120686. doi:10.1016/j.envpol.2022.120686
    47. Li, J.-J., Zhao, S.-P., Zhao, D. et al. 2023 China Guidelines for Lipid Management. Journal of Geriatric Cardiology, 2023, 20(9): 621-663. doi:10.26599/1671-5411.2023.09.008
    48. Li, J.-J., Zhao, S.-P., Zhao, D. et al. 2023 Chinese guideline for lipid management. Frontiers in Pharmacology, 2023, 14: 1190934. doi:10.3389/fphar.2023.1190934
    49. Li, Q., Jiang, Y., Song, A. et al. The Association Between Chronological Age and Dyslipidemia: A Cross-Sectional Study in Chinese Aged Population. Clinical Interventions in Aging, 2023, 18: 667-675. doi:10.2147/CIA.S406237
    50. Belete, A.K., Kassaw, A.T., Yirsaw, B.G. et al. Prevalence of Hypercholesterolemia and Awareness of Risk Factors, Prevention and Management Among Adults Visiting Referral Hospital in Ethiopia. Vascular Health and Risk Management, 2023, 19: 181-191. doi:10.2147/VHRM.S408703
    51. Zou, Q., Su, C., Du, W. et al. Longitudinal Association between Physical Activity, Blood Lipids, and Risk of Dyslipidemia among Chinese Adults: Findings from the China Health and Nutrition Surveys in 2009 and 2015. Nutrients, 2023, 15(2): 341. doi:10.3390/nu15020341
    52. Zhao, R., Zhao, L., Yang, F. et al. Dietary Fat Intake among Chinese Adults and Their Relationships with Blood Lipids: Findings from China Nutrition and Health Surveillance and Comparison with the PURE Study. Nutrients, 2022, 14(24): 5262. doi:10.3390/nu14245262
    53. Peng, L., Liu, L., Ma, N. et al. The dose-response relationship of serum uric acid with Dyslipidaemia and its components: a cross-sectional study of a Chinese multi-ethnic cohort. Lipids in Health and Disease, 2022, 21(1): 36. doi:10.1186/s12944-022-01647-5
    54. Li, Z., Hu, Q., Ji, W. et al. Prevalence of stroke and associated risk factors: A population-based cross-sectional study from the Qinghai-Tibet Plateau of China. BMJ Open, 2022, 12(11): e065605. doi:10.1136/bmjopen-2022-065605
    55. Liu, C., Li, Y., Li, J. et al. The Effect of Psychological Burden on Dyslipidemia Moderated by Greenness: A Nationwide Study from China. International Journal of Environmental Research and Public Health, 2022, 19(21): 14287. doi:10.3390/ijerph192114287
    56. Zhang, M., Wan, Z.-C., Lv, Y.-M. et al. Ten-year Time-trend Analysis of Dyslipidemia Among Adults in Wuhan. Current Medical Science, 2022, 42(5): 1099-1105. doi:10.1007/s11596-022-2630-4
    57. Qian, J., Li, Z., Zhang, X. et al. Efficacy and Tolerability of Ezetimibe/Atorvastatin Fixed-dose Combination Versus Atorvastatin Monotherapy in Hypercholesterolemia: A Phase III, Randomized, Active-controlled Study in Chinese Patients. Clinical Therapeutics, 2022, 44(10): 1282-1296. doi:10.1016/j.clinthera.2022.08.013
    58. Ma, L., Wang, Z., Fan, J. et al. An Essential Introduction to the Annual Report on Cardiovascular Health and Diseases in China(2021) | [《中国心血管健康与疾病报告 2021》要点解读]. Chinese General Practice, 2022, 25(27): 3331-3346. doi:10.12114/j.issn.1007-9572.2022.0506
    59. Miao, C.-Y., Ye, X.-F., Zhang, W. et al. Serum triglycerides concentration in relation to total and cardiovascular mortality in an elderly Chinese population. Journal of Geriatric Cardiology, 2022, 19(8): 603-609. doi:10.11909/j.issn.1671-5411.2022.08.007
    60. Yuan, K., Yu, X., Zhao, C. et al. Effects of hyperuricemia on the prevalence of dyslipidemia in the elderly: an empirical study based on propensity score matching | [高尿酸血症对老年人血脂异常患病的影响:基于倾向性评分匹配的实证研究]. Chinese Journal of Evidence-Based Medicine, 2022, 22(7): 785-790. doi:10.7507/1672-2531.202203006
    61. [无可用作者姓名]. Report on Cardiovascular Health and Diseases in China 2021: An Updated Summary. Biomedical and Environmental Sciences, 2022, 35(7): 573-603. 本站查看
    62. Du, J., Chen, Y., Zhou, N. et al. Associations between self-reported sleep duration and abnormal serum lipids in eastern China: a population-based cross-sectional survey. Sleep Medicine, 2022, 95: 1-8. doi:10.1016/j.sleep.2022.04.004
    63. [无可用作者姓名]. Report on Cardiovascular Health and Diseases in China 2021: an Updated Summary | [中国心血管健康与疾病报告 2021 概要]. Chinese Circulation Journal, 2022, 37(6): 553-578. doi:10.3969/j.issn.1000-3614.2022.06.001
    64. Mingyan, M., Xuelian, C., Zuo, C. et al. Investigation on status of dyslipidemia in Chinese females aged 35 years or above | [我国≥35 岁女性血脂异常现状调查]. Chinese Journal of Cardiology, 2022, 50(5): 486-493. doi:10.3760/cma.j.cn112148-20211201-01035
    65. Yuan, K., Zhao, C., Yang, Y. et al. Burden trend analysis of disease attributable to high low density lipoprotein cholesterol in Chinese population from 1990 to 2019 | [中国人群 1990—2019 年高低密度脂蛋白胆固醇归因疾病负担趋势分析]. Chinese Journal of Evidence-Based Medicine, 2022, 22(4): 444-449. doi:10.7507/1672-2531.202112052
    66. Zhu, Q., Yu, L., Li, Y. et al. Association between Dietary Fiber Intake and Hyperuricemia among Chinese Adults: Analysis of the China Adult Chronic Disease and Nutrition Surveillance (2015). Nutrients, 2022, 14(7): 1433. doi:10.3390/nu14071433
    67. Wei, L., Sun, J., Xie, H. et al. Interaction Analysis of Abnormal Lipid Indices and Hypertension for Ischemic Stroke: A 10-Year Prospective Cohort Study. Frontiers in Cardiovascular Medicine, 2022, 9: 819274. doi:10.3389/fcvm.2022.819274
    68. Chen, J., Ye, C., Yang, Z. et al. Effects of Erchen Decoction on Oxidative Stress-Related Cytochrome P450 Metabolites of Arachidonic Acid in Dyslipidemic Mice with Phlegm-Dampness Retention Syndrome: A Randomized, Controlled Trial on the Correspondence between Prescription and Syndrome. Evidence-based Complementary and Alternative Medicine, 2022, 2022: 1079803. doi:10.1155/2022/1079803
    69. Zhang, M., Zuo, H.-J., Yang, H.-X. et al. Trends in conventional cardiovascular risk factors and myocardial infarction subtypes among young Chinese men with a first acute myocardial infarction. Clinical Cardiology, 2022, 45(1): 129-135. doi:10.1002/clc.23770
    70. Liu, B., Chen, G., Zhao, R. et al. Temporal trends in the prevalence of metabolic syndrome among middle-aged and elderly adults from 2011 to 2015 in China: the China health and retirement longitudinal study (CHARLS). BMC Public Health, 2021, 21(1): 1045. doi:10.1186/s12889-021-11042-x
    71. Li, Y.-Q., Jia, S.-S., Liu, B.-B. Dyslipidemia among 12 – 17 years children in western region of China: a cross-sectional analysis, 2016 – 2017 | [中国西部地区 12~17 岁儿童 2016 — 2017 年血脂异常流行状况分析]. Chinese Journal of Public Health, 2021, 37(10): 1508-1513. doi:10.11847/zgggws1131893
    72. Song, P., Man, Q., Li, Y. et al. Association between dietary patterns and low hdl-c among community-dwelling elders in north china. Nutrients, 2021, 13(10): 3308. doi:10.3390/nu13103308
    73. Ma, X., Guo, Y., Li, P. et al. Association Between ApoE Status, Circulating Vitamin A and Vitamin E Levels with Dyslipidemia in Aging Adults. Archives of Medical Research, 2021, 52(7): 703-712. doi:10.1016/j.arcmed.2021.04.007
    74. Miao, C.-Y., Ye, X.-F., Zhang, W. et al. Association between dyslipidemia and antihypertensive and antidiabetic treatments in a China multicenter study. Journal of Clinical Hypertension, 2021, 23(7): 1399-1404. doi:10.1111/jch.14264
    75. [无可用作者姓名]. Report on Cardiovascular Health and Diseases Burden in China: an Updated Summary of 2020 | [中国心血管健康与疾病报告 2020 概要]. Chinese Circulation Journal, 2021, 36(6): 521-545. doi:10.3969/j.issn.1000-3614.2021.06.001
    76. Li, J., Yao, Y., Xie, W. et al. Association of long-term exposure to PM2.5 with blood lipids in the Chinese population: Findings from a longitudinal quasi-experiment. Environment International, 2021, 151: 106454. doi:10.1016/j.envint.2021.106454
    77. Liu, X.-B., Lu, J.-X., Wang, L.-J. et al. Evaluation of serum zinc status of pregnant women in the china adult chronic disease and nutrition surveillance (Cacdns) 2015–2016. Nutrients, 2021, 13(4): 1375. doi:10.3390/nu13041375
    78. Song, P., Man, Q., Li, Y. et al. Trends of Underweight Malnutrition Among Chinese Residents Aged 60 Years and Above — China, 1992−2015. China CDC Weekly, 2021, 3(11): 232-236. doi:10.46234/ccdcw2021.066
    79. Yang, F., Ma, Q., Ma, B. et al. Dyslipidemia prevalence and trends among adult mental disorder inpatients in Beijing, 2005–2018: A longitudinal observational study. Asian Journal of Psychiatry, 2021, 57: 102583. doi:10.1016/j.ajp.2021.102583
    80. Dong, J., Yang, S., Zhuang, Q. et al. The Associations of Lipid Profiles With Cardiovascular Diseases and Death in a 10-Year Prospective Cohort Study. Frontiers in Cardiovascular Medicine, 2021, 8: 745539. doi:10.3389/fcvm.2021.745539
    81. Barreto, S.G., Habtezion, A., Gukovskaya, A. et al. Critical thresholds: Key to unlocking the door to the prevention and specific treatments for acute pancreatitis. Gut, 2021, 70(1): 194-203. doi:10.1136/gutjnl-2020-322163
    82. Huo, S., Sun, L., Zong, G. et al. Genetic susceptibility, dietary cholesterol intake, and plasma cholesterol levels in a Chinese population. Journal of Lipid Research, 2020, 61(11): 1504-1511. doi:10.1194/jlr.RA120001009
    83. Jin, J.-L., Zhang, H.-W., Cao, Y.-X. et al. Long-term prognostic utility of low-density lipoprotein (LDL) triglyceride in real-world patients with coronary artery disease and diabetes or prediabetes. Cardiovascular Diabetology, 2020, 19(1): 152. doi:10.1186/s12933-020-01125-1
    84. [无可用作者姓名]. Report on Cardiovascular Health and Diseases in China 2019: an Updated Summary | [中国心血管健康与疾病报告 2019 概要]. Chinese Circulation Journal, 2020, 35(9): 833-854. doi:10.3969/j.issn.1000-3614.2020.09.001
    85. Wang, Y.-J., Li, Z.-X., Gu, H.-Q. et al. China Stroke Statistics 2019: A Report from the National Center for Healthcare Quality Management in Neurological Diseases, China National Clinical Research Center for Neurological Diseases, the Chinese Stroke Association, National Center for Chronic and Non-communicable Disease Control and Prevention, Chinese Center for Disease Control and Prevention and Institute for Global Neuroscience and Stroke Collaborations. Stroke and Vascular Neurology, 2020, 5(3): 211-239. doi:10.1136/svn-2020-000457
    86. Xi, Y., Niu, L., Cao, N. et al. Prevalence of dyslipidemia and associated risk factors among adults aged ≥35 years in northern China: A cross-sectional study. BMC Public Health, 2020, 20(1): 1068. doi:10.1186/s12889-020-09172-9

    Other cited types(4)

通讯作者: 陈斌, bchen63@163.com
  • 1. 

    沈阳化工大学材料科学与工程学院 沈阳 110142

  1. 本站搜索
  2. 百度学术搜索
  3. 万方数据库搜索
  4. CNKI搜索

Figures(2)  / Tables(3)

Article Metrics

Article views(7328) PDF downloads(676) Cited by(90)

Proportional views
Related

Trends in Lipids Level and Dyslipidemia among Chinese Adults, 2002-2015

doi: 10.3967/bes2019.074
Funds:  This work was supported by the National Health and Family Planning Commission (formerly the Ministry of Health of the People's Republic of China) Medical Reform Major Program:China Nutrition and Health Surveillance (2010-2012) and Chinese Adults Chronic Diseases and Nutrition Surveillance (2015)

Abstract:  Objective To investigate the trends of lipid profiles and dyslipidemia among Chinese adults from 2002 to 2015. Methods Data were collected from three nationally representative cross-sectional surveys. Fasting venous blood samples were collected and serum lipids were tested by biochemical analysis and enzymatic determination. Lipid levels and the prevalence of dyslipidemia among adults were analyzed with complex sampling weighting adjustment for age and gender. Results The weighted means of TC, TG, and LDL-c significantly increased linearly from 3.93, 1.12, and 2.12 mmol/L in 2002 to 4.59, 1.41, and 2.78 mmol/L in 2010 and then to 4.63, 1.47, and 2.87 mmol/L in 2015, respectively; by contrast, HDL-c levels decreased significantly from 1.30 mmol/L to 1.26 mmol/L over the same period. Similar trends in mean non-HDL-c and lipid-related ratios were observed. The weighted dyslipidemia prevalence linearly increased; in particular, hypercholesterolemia increased from 1.6% to 5.6% and then to 5.8%, hypertriglyceridemia increased from 5.7% to 13.6% and then to 15.0%, low HDL-c increased from 18.8% to 35.5% and then to 24.9%, and high LDL-c increased from 1.3% to 5.6% and then to 7.2% (P for trend < 0.001). Conclusion Dyslipidemia increased among Chinese adults from 2002 to 2015. Development of a comprehensive strategy to decrease lipid levels in this population is urgently required.

SONG Peng Kun, MAN Qing Qing, LI Hong, PANG Shao Jie, JIA Shan Shan, LI Yu Qian, HE Li, ZHAO Wen Hua, ZHANG Jian. Trends in Lipids Level and Dyslipidemia among Chinese Adults, 2002-2015[J]. Biomedical and Environmental Sciences, 2019, 32(8): 559-570. doi: 10.3967/bes2019.074
Citation: SONG Peng Kun, MAN Qing Qing, LI Hong, PANG Shao Jie, JIA Shan Shan, LI Yu Qian, HE Li, ZHAO Wen Hua, ZHANG Jian. Trends in Lipids Level and Dyslipidemia among Chinese Adults, 2002-2015[J]. Biomedical and Environmental Sciences, 2019, 32(8): 559-570. doi: 10.3967/bes2019.074
  • Developments in economy and acceleration of urbanization combined with population aging in China over the last 30 years have resulted in a dramatic increase in the risk of cardiovascular disease (CVD). Annual cardiovascular events are predicted to show a > 50% increase from 2010 to 2030. Changes in serum lipids and lipoproteins are a well-established risk factor for CVD morbidity and mortality. Dyslipidemia is characterized by increased levels of blood total cholesterol (TC), triglycerides (TG), and low-density lipoprotein cholesterol (LDL-c) and decreased levels of high-density lipoprotein cholesterol (HDL-c). Many studies have demonstrated that non-HDL-c levels and some lipid-related ratios, such as TC/HDL-c, TG/HDL-c, and LDL-c/HDL-c, exert greater influences on the morbidity and severity of coronary heart disease (CHD) than individual lipid and lipoprotein concentrations. Therefore, diagnosing and preventing CHD by analyzing these indicators is meaningful. However, little national information has been reported on the trends of non-HDL-c and lipid ratio levels among the Chinese population. Given the very low usage of cholesterol-lowering medication and high morbidity of CVD in China, investigating the status of dyslipidemia in the country is an important undertaking.

    The criteria for dyslipidemia have been modified several times over the last 20 years; thus, reanalyzing national lipid profiles and the prevalence of dyslipidemia with the same criteria and standard population data is necessary. In the present study, we aimed to investigate whether the trends of lipid profiles and dyslipidemia prevalence differ among regions, genders, and age groups in China.

  • The study data were obtained from three nationwide cross-sectional surveys, namely, the Chinese Adults Nutrition and Chronic Diseases Surveillance in 2015 (CANCDS2015), Chinese Nutrition and Health Surveillance in 2010 (CNHS2010), and the Chinese Nutrition and Health Survey in 2002 (CNHS2002). The three surveys were conducted in 31 provinces, autonomous regions, and municipalities directly under the central government throughout China (except Taiwan, Hong Kong, and Macau). A stratified multistage cluster sampling method was used.

    In the 2002 survey, the country was divided into six strata (large cities, medium and small cities, class 1-4 rural areas) based on geographic characteristics, economy, and social development information provided by the China National Bureau of Statistics and the China Ministry of Health Statistics. The first stage of sampling involved a random selection of 22 districts (urban) or counties (rural) from the six strata. In the second stage, random selection of three neighborhoods (urban) or townships (rural) from each of the selected districts/counties was conducted; two residential committees (urban) or villages (rural) were then randomly selected from each of the neighborhoods or townships. Thirty households were randomly sampled from each neighborhood committee or village.

    In the 2010 survey, a multistage stratified with proportional to the population cluster random sampling method was conducted at 150 survey sites of four types, including 34 large cities, 41 medium and small cities, 45 general rural areas, and 30 poor rural areas, according to economy and social development. Random sample selection of six neighborhood committees (urban) or villages (rural) equal to the proportion of the local population was conducted. Thirty households were randomly sampled from each neighborhood committee or village.

    The 2015 survey was based on the national mortality surveillance system. Multistage stratified cluster random sampling was conducted in 302 surveillance sites of eight strata according to the proportion of the urban population (high/low), overall population size (high/low), and mortality rate (high/low). The first stage of sampling involved systematic sampling of population size ranking of three towns (streets or regiments). In the second stage of sampling, two villages (neighborhood committee or company) in each town were randomly selected by systematic sampling of population size ranking. In the third stage, 45 households were randomly sampled in each community or village. All three surveys were approved by the Ethical Committee of the Chinese Center for Disease Control and Prevention, and all participants provided written informed consent.

  • Similar survey questionnaires and fasting blood measurements were conducted all in studies. A standard questionnaire was conducted by face-to-face interviews at the participants' home, and anthropometric measurements were measured at a community health center; both activities were conducted by trained staff. The questionnaire included general demographic information, such as age, education level, marital status, income, and lifestyle behaviors, including smoking and alcohol consumption. An overnight fasting blood sample was collected by qualified nurses by venipuncture from the antecubital vein before breakfast. Samples were allowed to stand for 30-60 minutes and then centrifuged at 1, 500 rpm for 10 minutes. The centrifuged serum samples were transported to a laboratory and stored at -80 ℃. The blood collection procedure, processing, and determination were identical in the three surveys. Serum TC, LDL-c, HDL-c, and TG were measured by a Hitachi 7600 automatic biochemical analyzer (Hitachi Inc., Tokyo, Japan) with reagents obtained from Wako Pure Chemical Industries Ltd. (Tokyo, Japan) at the central laboratory of the Beijing CDC and National Institute for Nutrition and Health, China CDC. Non-HDL-c was calculated by the equation TC − HDL-c. According to the guidelines of Chinese adult dyslipidemia prevention and treatment (2016 revised edition), a serum TC concentration greater than 6.22 mmol/L (240 mg/dL) is considered hypercholesterolemia, TG greater than 2.26 mmol/L (200 mg/dL) is considered hypertriglyceridemia, LDL-c greater than 4.14 mmol/L (160 mg/dL) is considered high LDL-c, and HDL-c lower than 1.04 mmol/L (40 mg/dL) is considered low HDL-c.

  • In these surveys, participants aged 18 years and above and who were healthy and able to walk freely to the survey location were included in the survey. Those with missing values of basic demographic information, lysed blood samples, or samples with missing or illogical data were excluded following unified data cleansing rules. Figure 1 showed the flow diagram summarizing the three surveys.

    Figure 1.  Flow diagram summarizing the study population.

  • All data in the three surveys were collected using specialized software, and data analyses were performed using SAS (Statistical Analysis System) for Windows v9.3.2 (SAS Institute, Cary, NC, USA). As the age, gender, and district distribution of the Chinese population differed among the years 2002, 2010, and 2015, a sampling weight was assigned to each participant based on the study design. During analysis of the prevalence of dyslipidemia and mean levels of lipids, we calculated standardized age and gender values, respectively, based on the 2010 national census data. Specifically, weighted serum TC, TG, HDL-c, and LDL-c, lipid-related ratios, and the prevalence of dyslipidemia in all three surveys were adjusted by using data from the sixth census of the National Bureau of Statistics conducted in 2010. The PROC SURVEYMEANS and PROC SURVEYFREQ procedures in SAS were used to calculate means and proportions, and 95% confidence intervals (95% CIs) were used to reflect the complex sampling design and weights of these surveys, as well as provide nationally representative estimates. A general linear model was used to estimate P for the trend of mean level of lipid profiles, and the chi-squared test was used to calculate P for the trend of prevalence of dyslipidemia. Bilateral P-values < 0.05 were considered statistically significant.

  • Table 1 shows the demographic characteristics of participants in the three surveys. The final sample sizes were 49, 233 in the 2002 survey (16, 828 in urban areas; 32, 405 in rural areas), 106, 673 in the 2010 survey (54, 016 in urban areas; 52, 657 in rural areas), and 179, 728 (73, 443 in urban areas; 106, 285 in rural area) in the 2015 survey. No statistical difference in genders was found among the three surveys.

    Table 1.  Demographic Characteristic Information of Participants in 2002, 2010, and 2015

    In the 2002 survey, the mean age was 45.3 years (47.4 years in urban areas; 44.2 years in rural areas). Participants of Han descent accounted for 90.0% of the population (94.7% of the population in urban areas; 87.6% of the population in rural areas). Most participants completed junior or senior high school in urban areas; in rural areas, 50.2% of the participants attended primary school or below and only 2.6% had gone to college or above. The annual income of most participants was below 5, 000 RMB (44.7% in urban areas; 85.3% in rural areas).

    The mean age in the 2010 survey was 52.0 years (50.5 years in urban areas; 52.3 years in rural areas) while that in the 2015 survey was 52.2 years (52.3 years in urban areas; 52.1 years in rural areas). An increasing trend of age was observed in the three surveys (P < 0.001). The number of participants with higher education levels and annual income significantly increased over the years (P < 0.001).

    The total proportion of smokers was 26.6% (24.3% in urban areas; 27.7% in rural areas) in 2002, but no trend of smoking was observed among the three surveys. A significant decreasing trend of total proportion of drinkers from 22.3% in 2002 (23.1% in urban areas; 21.9% in rural areas) to 24.5% in 2010 (23.6% in urban area; 25.5% in rural areas) and then to 19.2% in 2015 (17.7% in urban areas; 20.0% in rural areas) (P < 0.001) was noted. By contrast, mean BMI showed a significant increasing trend from 23.2 kg/m2 in 2002 to 23.9 kg/m2 in 2010 and then to 24.2 kg/m2 in 2015 (P < 0.001). The proportions of low body weight (< 18.5 kg/m2), normal weight (18.5-23.9 kg/m2), overweight (24.0-27.9 kg/m2), and obese (≥ 28.0 kg/m2) participants significantly differed among the surveys (P < 0.001). Although the number of participants who had taken lipid control measures significantly increased from 2.4% in 2002 to 4.6% in 2010 and then to 4.5 in 2015 (P < 0.001), the overall proportion was still very low.

    The trends of weighted adjustment Measurement of lipid control of lipid profiles among Chinese adults are demonstrated in Table 2. Total mean TC level and their 95% CIs significantly increased from 3.93 (3.87-3.99) mmol/L in 2002 to 4.59 (4.54-4.63) mmol/L in 2010 and then to 4.63 (4.59-4.67) mmol/L in 2015 (P < 0.001). Mean TG levels and their 95% CIs also significantly increased from 1.12 (1.10-1.15) mmol/L to 1.41 (1.39-1.44) mmol/L and then to 1.47 (1.45-1.50) mmol/L. However, mean HDL-c levels and their 95% CIs significantly decreased from 1.30 (1.28-1.31) mmol/L to 1.18 (1.16-1.20) mmol/L and then to 1.26 (1.24-1.27) mmol/L. Mean LDL-c levels and 95% CIs significantly increased from 2.12 (2.08-2.17) mmol/L to 2.78 (2.75-2.82) mmol/L and then to 2.87 (2.84-2.90) mmol/L (P < 0.001). Between the 2002 and 2010 surveys, mean levels of lipids, such as TC, TG and LDL-c, were higher in urban areas than in rural areas, but HDL-c concentrations were similar. However, in the 2015 surveys, TG and LDL-c levels were higher in urban areas than in rural areas; moreover, TC levels between urban and rural areas differed but HDL-c levels were higher in rural areas than in urban area. TG levels were much higher in males than in females in all three surveys. Increasing trends of TC, TG, and LDL-c levels were observed in males from 2002 to 2015; in females, the change in HDL-c was not significant. TC, TG, and LDL-c levels almost increased significantly with increasing age; in the 75-year-old group, a slight fluctuation of HDL-c level with no significant difference was observed during the period. Longitudinally, regardless of area, gender, or BMI, TC, TG, and LDL-c levels consistently increased whereas HDL-c levels decreased from 2002 to 2015 (P < 0.001). Weighted adjusted means of non-HDL-c levels in Table 3 showed an increasing trend in all age groups and both genders. An increasing trend of mean non-HDL-c levels was observed in urban and rural areas from 2002 to 2015. Similarly, the ratios of TC/HDL-c, TG/HDL-c, and LDL-c/HDL-c showed increasing trends among all genders, districts, ages, and BMIs (P < 0.001).

    Table 2.  Lipids Profiles among Participants in Survey 2002, 2010, and 2015 [mean (95% CI)]

    Table 3.  Non-HDL-c and Lipid-related Ratios among Participants in Survey 2002, 2010, and 2015 [mean (95% CI)]

    Figure 2 shows the prevalence of dyslipidemia among Chinese adults from 2002 to 2015. The total weighted adjusted prevalence of hypercholesterolemia was 1.6% (95% CI: 1.3%-1.8%) in 2002, increased to 5.6% (95% CI: 5.1%-6.1%) in 2010, and then increased to 5.8% (95% CI: 5.3%-6.3%) in 2015 (P for trend < 0.001). Hypertriglyceridemia prevalence dramatically increased from 5.7% (95% CI: 5.1%-6.3%) to 13.6% (95% CI: 12.9%-14.2%) and then to 15.0% (95% CI: 14.3%-15.7%). Low HDL-c prevalence changed remarkably over these years, increasing from 18.8% (95% CI: 17.0%-20.6%) to 35.5% (95% CI: 33.3%-37.6%) and then to 24.9% (95% CI: 23.5%-26.4%). Similarly, LDL-c prevalence increased from 1.3% to 5.6% and then to 7.2% over the 13-year interval. Among urban and rural participants, the prevalence of hypercholesterolemia were much higher in the former than in the latter in the 2002 and 2010 surveys; however, in 2015, hypercholesterolemia prevalence was slightly higher in rural areas than in urban areas. Furthermore, in 2002, hypercholesterolemia prevalence was higher in females than in males, and it increased from 0.7% in the 18-year-old group to 3.4% in the 65-year-old group but then decreased to 2.7% in the 75-year-old group. Similar distributions of hypercholesterolemia were observed in the 2010 and 2015 surveys. From a longitudinal perspective, the prevalence of hypercholesterolemia from 2002 to 2015 remarkably increased in rural areas from 1.0% to 4.4% and then to 6.2%; interestingly, however, this prevalence in urban areas increased from 2.0% to 6.3% but then declined to 5.3%. About high LDL-c similar results with hypercholesterolemia was observed in both urban and rural areas, as well as in all genders, age groups, and BMI groups. However, hypertriglyceridemia prevalence was higher in males than in females, higher in urban areas than in rural areas, and higher in middle-aged adults than in their elderly counterparts. Longitudinally, an increasing trend of hypertriglyceridemia prevalence could be observed from 2002 to 2015. Low HDL-c prevalence was much higher in the dyslipidemia type. Moreover, HDL-c prevalence was higher in rural areas than in urban areas in 2002, while this prevalence was similar between areas in 2010 and then higher in urban areas than in rural areas in 2015. Interestingly, in the age groups of 55 years and above, the trends of low HDL-c prevalence were not statistically significant among the three survey years.

    Figure 2.  Prevalence of dyslipidemia among participants in survey 2002, 2010, and 2015.

  • In this study, blood lipid data from three nationally representative surveys were analyzed. We found that dyslipidemia increased rapidly from 2002 to 2015. However, slight differences in trend among areas, genders, ages, and BMI were found. Due to differences in geographical distribution and lifestyle in China, some gap in public health services and strategies for the prevention and control of chronic diseases remain between urban and rural areas. Urban residents are more likely to develop healthy living habits than their rural counterparts to reduce the risk-factors of CVDs. As rural residents become more affluent, they may develop unhealthy lifestyle behaviors and psychosocial problems. Urbanization of China may bring about great challenge to the country's CVD burden.

    Declining TC and LDL-c levels have been reported in some developed countries, such as the United States of America (USA) and Japan, as well as in a number of European countries. Data from the USA show mean levels of TC, TG, LDL-c, and non-HDL-c higher than those in China, although TC, TG, and non-HDL-c levels reveal a decreasing trend whereas mean HDL-c levels reveal a linear increase. These favorable trends of lipids and lipoproteins may generally be attributed to the consistent use of lipid-lowering medication. A study conducted in Kuwait from 1998 to 2009 showed an increasing trend until 2006-2007 (56.0% in males and 53.6% in females) except in 2002-2003, after which a significant decline was recorded for in both genders (33.7% of men; 30.6% of women). Studies conducted in other Asia-Pacific and Middle Eastern regions, such as Tehran and Pakistan, also show similar trends. A favorable trend of all lipid components was observed in Tehran adults after two decades of follow-up; such improvements were attributed to the increased use of lipid-lowering medication and wider knowledge of the adverse influence of hydrogenated oil. In Pakistan, low HDL-c (17.2%) and Hypertriglyceridemia (11.2%) are the most prevalent form of dyslipidemia, similar to the Chinese population. Because of the inconspicuous symptoms of dyslipidemia, as well as their lack of knowledge, survey participants in China tended not to actively test for blood lipids until their cardiovascular system had been damaged. Considering that high lipids level and maintained dyslipidemia are significant risk factors for CHD events, it will be much more severe in CVD burden especially in China.

    In contrast to other Western countries, low HDL-c is the major subtype of dyslipidemia in China, likely due to the carbohydrate-dominant diet of the country and related increases in obesity and diabetes. This study found that the prevalence of low HDL-c in males is much higher than that in females, although similar trends of prevalence of low HDL-c were noted in both genders over the 13-year period considered in this work. The changes in HDL-c levels and low-HDL-c prevalence observed in this study may be attributed to changes in lifestyle. Besides genetic factors, some drugs, obesity, inactivity, cigarette smoking, and long-term heavy drinking are known to contribute to decreased serum HDL-c levels; a poly-unsaturated fat-rich or low-carbohydrate diet may improve these levels. The proportion of total fat in total calories increased but carbohydrate intake decreased in Chinese men, and the rate of physical activity with more than moderate degree showed a decreasing trend within the period. Undesirable lifestyle behaviors, such as smoking and alcohol consumption, in combination with decreased physical activity, can also elevate TC, LDL-c and TG levels. Study reported that heavier cigarette smoking leads to significantly higher TG and lower HDL-c levels; thus, cessation of smoking could benefit normal lipid maintenance. Although moderate alcohol drinking may increase HDL-c levels, such consumption is not generally recommended as a protective factor for dyslipidemia on account of its potential risk to health. Inactive lifestyles increase plasma insulin levels, insulin resistance, the waist circumference, and visceral fat and decrease adiponectin levels. Obesity, which increases cardiovascular risk by increasing plasma triglycerides and promoting high LDL-c and low HDL-c, is also common among the middle-aged and older population. These lipid abnormalities are typical features of metabolic syndrome.

    As the second most common dyslipidemic abnormality, hypertriglyceridemia is widely prevalent, especially in China. Elevated plasma TG levels often lead to both LDL-c and HDL-c metabolic disorders, and it is a strong risk factor for the development of atherosclerotic CVD. A one standard deviation increase in log-transformed blood TG concentration has been associated with a 20% increase in CHD. In the present study, TG levels and hypertriglyceridemia among residents living in urban and rural communities linearly increased over the years. However, low TG levels and hypertriglyceridemia were more prevalent in females than in males, in accordance with findings in previous studies. This difference in gender may be attributed to the increased participation of women in healthy lifestyle activities and a greater awareness of health in this gender. Therefore, health programs promoting dyslipidemia awareness among males could be implemented.

    Interesting trends of lipids and dyslipidemia among the elderly, especially in the age group of 75 years and above, were noted over the survey years. TC, TG, LDL-c, and non-HDL-c levels, as well as dyslipidemia, increased from the younger- to the middle-aged subgroups but then decreased in the 75-years-and-above subgroup. As age increases, basal metabolism slows down and calorie intake is stored as fat in the body. Increased use of medication for chronic diseases among older participants may have also influenced the decreasing level of lipids found. Lipid prevention and control in the elderly is complicated, and further studies are needed. Statins are regarded as effective drugs for lowering blood lipids, and several large studies have confirmed the efficacy and safety of statins in the primary or secondary prevention of CHD. The use of statins for hypercholesterolemia has been attempted in clinical trials in Japan and Korea; indeed, many clinical trials on statins have also been conducted in China. However, in epidemic studies, the treatment rate was only 6.8% in adults and 14.4% in middle-aged and older within dyslipidemia subjects and only 3.5% to 4.9% was controlled in China, all of the trends in each subgroup are consistent with weak awareness and inadequate control rate of dyslipidemia, so it should be controlled strictly to prevent macro-vascular or micro-vascular complications in middle-aged population.

    Our study presents several limitations. First, all of the data were based on three cross-sectional surveys over a 13-year period; thus, the effect of genetic factors on lipid profiles was not considered. Secondly, although our analyses included various districts, genders, and age groups, the data obtained are insufficient to analyze the factors influencing lipids over the same survey period. Third, the measurement methods for lipids and lipoproteins in the three surveys were similar but used different test reagents and instruments and were operated by different technicians; these variations may contribute systematic errors to our work. However, despite these limitations, the surveys we utilized, which are known to provide nationally representative data, enabled us to estimate the current health status of Chinese adults. Further data from longitudinal surveys are needed to verify these trends; examination of the influence of various lifestyle factors is also recommended for future research.

  • Nationwide surveys conducted in 2002, 2010, and 2015 revealed an increasing trend in the prevalence of dyslipidemia among Chinese adults. Increasing trends of TC, TG, LDL-c, and non-HDL-c levels and lipid-related ratios were observed in all gender, area, and BMI groups; however, dyslipidemia prevalence, especially low HDL-c levels, did not show similar tendencies among the age subgroups. These findings demonstrate that an enhanced strategy is needed to control dyslipidemia and prevent CVDs among Chinese adults.

  • The authors' contributions are as follows: SONG Peng Kun conceived and designed the study; SONG Peng Kun, MAN Qing Qing, LI Hong, PANG Shao Jie, JIA Shan Shan, and LI Yu Qian conducted the research and collected and supervised the samples; SONG Peng Kun analyzed the data and wrote the manuscript; HE Li, ZHAO Wen Hua, and ZHANG Jian supervised the study. All authors have read and approve of the final manuscript.

  • We acknowledge all participants and staff of National Institute for Nutrition and Health, China Center for Disease Control and Prevention, all members of the project team, and all participants for their support and cooperation.

  • None of the researchers or technicians have conflicts of interest to declare.

Reference (40)

Catalog

/

DownLoad:  Full-Size Img  PowerPoint
Return
Return