


-
The prevalence of overweight and obesity among women of child-bearing age has increased sharply worldwide[1-3]. According to the Blue Book on Obesity Prevention and Control in China (2017), the overweight and obesity prevalence in adults were 30% and 12% respectively[4]. Overweight during pregnancy increases the risk of complications for the mother, including emergency cesarean section, gestational hypertension, and pre-eclampsia[5-7]. The long-term impact of obesity on adult health begins early in life. Pre-pregnancy maternal obesity is associated with adverse outcomes in offspring at birth and later in life, including dystocia, macrosomia, and developmental retardation[8, 9]. Human epidemiological studies and animal experiments have provided evidence that the risk of atypical neural development of the newborn is significantly enhanced following prenatal and/or perinatal maternal exposure to stress, infection and/or immune activation, nutritional deficiencies, extremes of pre-pregnancy body mass index (BMI), and obstetric complications[10-12].
A child’s early experiences provide a critical foundation for the entire life course. This is because early child development is critical for health, physical, social/emotional, and language/cognitive domains[13]. The first 1,000 days, which is defined as the period from conception to 2 years old, is the most important stage for physical and mental development of offspring[14, 15]. The density of short-term synaptic connections of nerve cells peaks, and these connections depend on input from the environment that reaches the brain[16]. As the most rapid period of physical and psychological development, this stage is particularly important for establishing models of emotion, cognition, and social function[17]. Previous studies in the United States have shown that maternal pre-pregnancy BMI ≥ 35 kg/m2 is associated with increased attention-deficit hyperactivity disorder (ADHD) symptoms and problems of executive self-regulation of behavior (inhibitory control and attention) in preschool children, compared with mothers with BMI < 25 kg/m2[18]. Further, maternal pre-pregnancy BMI ≥ 30 kg/m2 is associated with increased behavioral problems in children at 10-year-old, compared with mothers with BMI of 22 kg/m2[19].
Hence, it is necessary to verify the associations between fetal neural development and maternal BMI. To the best of our knowledge, few studies have focused on this issue in the Chinese child population. Accordingly, this study explored the possible association between maternal pre-pregnancy BMI, age of children and neuropsychological development of children in China. This is the only human study to track the neuropsychological development characteristics of Chinese children from 1 month to 24 months, and it reports neurodevelopmental variation in this age range according to different maternal pre-pregnancy BMI.
-
This birth cohort study recruited mothers after childbirth who had their first postnatal check-ups at two District Women and Children Health and Family Planning Service Centers in Tianjin, China, between July 2015 and March 2017. The investigators collected and measured the developmental status of the child at 1, 12, and 24 months of age. As of May 2018, there were 2,563 mother-child pairs with follow-up visits. According to previous literatures, participant information was collected via questionnaires at the first postnatal check-ups, including maternal age (in years), education level, family monthly income (Chinese Yuan, CNY), smoking and alcohol consumption during pregnancy, gestation weeks, delivery pattern, parity, height (cm), pre-pregnancy weight (kg), antenatal weight (kg), and birth weight of the newborn. Women were excluded if they self-reported having gestational diabetes, pre-eclampsia or poor birth outcomes, or used drugs during pregnancy. Finally, 2,253 mother-child pairs were included in this study. All participants provided informed consent in writing. The protocol of this study was approved by the Ethics Committee of the Tianjin Medical University (No. 2015005).
-
Pre-pregnancy BMI is calculated by dividing maternal pre-pregnancy weight (in kg) by height (in m) squared, and is universally expressed in units of kg/m2[20, 21]. Maternal pre-pregnancy weight and height were collected via questionnaires at the first postnatal check-ups. The data was confirmed by reference to medical records during pregnancy, which listed maternal weight and height at their mother’s first pre-natal visit. The 2,253 women in this study were grouped by BMI, using the cut-offs recommended by the WHO: 1,871 women with BMI < 25 kg/m2, 323 overweight women (25 kg/m2 ≤ BMI < 30 kg/m2), and 59 women with obesity (BMI ≥ 30 kg/m2). The sample size of obesity was very small, and the uneven sample sizes of the different BMI groups could have affected the reliability of the results. Thus, overweight and obesity were combined into one group (BMI ≥ 25 kg/m2), and BMI < 25 kg/m2 was defined as a healthy range for reference[18, 22, 23]. The associations between pre-pregnancy BMI and offspring neuropsychological development were systematically analyzed by BMI class (BMI < 25 kg/m2 and BMI ≥ 25 kg/m2).
-
The China Developmental Scale for Children, which was published by the Capital Pediatrics Research Institute in China, has been used to assess the developmental quotients (DQs) children aged 0-6 years since 1980[24, 25]. As the first standardized instrument for assessing the neuropsychological development of children in China, Cronbach’s α for the reliability is 0.91, and the scale is highly correlated with the Gesell Developmental Schedule, with a correlation coefficient of 0.954[26, 27]. This scale has proven reliable and practical in clinical practice for the intelligent diagnosis of infants and young children. For decades, the scale has been used for the early identification and quantification of developmental delay and to determine eligibility for early intervention services for infants in China. It is of great utility for improving rehabilitation opportunities[24, 27].
The China Developmental Scale for Children allows differential diagnosis of initial suspicions of developmental disorder by providing independent standard scores for different scales and subtests (gross motor, fine motor, adaptive, language, and social). Specifically, motor behavior (gross motor and fine motor) includes balance, walking, and hand control; adaptive behavior includes imitation, discriminative performance, and perception; language behavior is assessed in terms of vocabulary, word comprehension, and conversation; and social behavior includes reactions to persons, personal habits, and acquired information. For infants at 1 month of age, this scale consists of six items organized into one gross motor item, one fine motor item, two adaptive items, one language item, and one social behavior item; for infants at 12 months of age, there are eight items organized into two gross motor items, two fine motor items, one adaptive item, two language items, and one social behavior item; for infants at 24 months of age, there are seven items organized into one gross motor item, one fine motor item, two adaptive items, two language items, and one social behavior item. The raw scores can be transformed into DQ [total DQ = (raw scores of five domains/5/current age in months) × 100]. Then, children can be classified as outstanding (total DQ scores ≥ 130), well developed (total DQ scores 115-129), normal (total DQ scores 85-114), moderately delayed (total DQ scores 70-84), or severely delayed (total DQ scores < 70)[26, 27].
In this study, one pediatrician estimated the current neurodevelopment age (expressed in months) for each of the five specific domains, which were also adjusted by month age to ensure comparability among individuals. To ensure that the five domains and total DQ could be represented in the same graph, the five domains were adjusted by an order of magnitude, i.e., multiplied by 100. In the present study, the neurodevelopmental test was conducted at 1-, 12-, and 24-month-old by trained pediatricians in a quiet room of the District Women and Children Health and Family Planning Service Centre and in the presence of a parent. To minimize examiner variability, every effort was made to maximize reliability of scoring by performing standardized training procedures and regular self-checking.
-
The sample size for the average time difference was calculated as follows:
$$ M = \frac{{{{\left( {{z_{1 - \alpha /2}} + {z_{1 - \beta }}} \right)}^2}\left[ {1 + \left( {n - 1} \right)\rho } \right]{s^2}}}{{n\left( {1 - \pi - {\pi ^2}} \right){d^2}}}{\text{,}^{[28]}} $$ Where α is the type I error rate, β is the type II error rate, s is the estimate of the standard deviation, d is the smallest meaningful time-averaged difference to be detected, n is the number of repeated observations per subject, ρ is the correlation between measures within an individual, m1 and m2 are the number of subjects in BMI ≥ 25 kg/m2 group and BMI < 25 kg/m2 group, respectively, π is the proportion of subjects within group 1 (m1/M) and M is the total number of subjects in the design.
By entering the parameter values (α = 0.05, β = 0.1, power = 1-β = 0.9, s = 20, d = 0.5, n = 3, ρ = 0.8, π = 30%) into the formula, sample size was obtained as follows: M = m1 + m2 = 276; m1 (BMI ≥ 25 kg/m2 group) = πM = 83; m2 (BMI < 25 kg/m2 group) = (1−π)M = 193. Assuming sample attrition of 30%, the sample size was increased to 359, with m1 (BMI ≥ 25 kg/m2 group) = 108 and m2 (BMI < 25 kg/m2 group) = 251; the samples collected in this study were larger than the estimated values.
-
Statistical analysis was performed using Statistical Analysis System (SAS) version 9.4 software. Values were presented as means and standard deviations (SDs). Categorical variables were presented as n (%). Histograms were used to describe the DQ at different time points within different maternal pre-pregnancy BMI groups. ANOVA, Kruskal-Wallis, and Chi-square tests were used to compare the characteristics of the enrolled children and mothers between pre-pregnancy BMI groups. The significance level for all tests was P < 0.05 (two-tailed).
Mixed models[29] were used to explore the associations between child DQ and pre-pregnancy BMI. The number of months of follow-up in this study differed among individuals (Table 1); mixed models can accommodate unbalanced data patterns and use all available observations in the analysis. In this study, a mixed model was used to analyze how offspring neuropsychological development from 1 to 24 months was affected by the interaction between the mother’s pre-pregnancy BMI and the child’s age. Selected potential confounders were entered as covariates, including mother's age, change in BMI during pregnancy (∆BMI), education level, family monthly income, whether the mother smoked or consumed alcohol before or during pregnancy, delivery pattern, gestation weeks, parity, and child's sex and birth weight. The significance level for all tests was P < 0.05 (two-tailed). Post-hoc analysis with Sidak correction for multiple comparisons was used to assess differences in child DQ between the maternal pre-pregnancy BMI groups at each age (1, 12, and 24 months).
Age (mo) n (%) Total BMI < 25 kg/m2 BMI ≥ 25 kg/m2 1 1,623 (82.51) 344 (17.49) 1,967 12 1,091 (80.64) 262 (19.36) 1,353 24 398 (76.10) 125 (23.90) 523 Table 1. The sample size of offspring with different maternal pre-pregnancy BMI groups at eachfollow-up period
-
Maternal and offspring characteristics at birth for the 2,253 mother-child pairs included in the study are listed in Table 2. The mean age of mothers was 31.04 ± 4.08 years (range 18-45 years). The mean pre-pregnancy BMI of mothers was 21.88 ± 3.42 kg/m2; pre-pregnancy BMI ≥ 25 kg/m2 was present in 16.96% of the mothers. The group with BMI < 25 kg/m2 was slightly younger than the group with pre-pregnancy BMI ≥ 25 kg/m2 (P < 0.001). Mothers with pre-pregnancy BMI ≥ 25 kg/m2 had lower ∆BMI, education, and family income, and higher baby birth weight (P < 0.001). Additionally, mothers in the group with BMI ≥ 25 kg/m2 were more often multiparity and a higher rate of cesarean section compared to the group with BMI < 25 kg/m2 (P < 0.05).
Variables BMI < 25 kg/m2 BMI ≥ 25 kg/m2 Total Pa (n = 1,871) (n = 382) (n = 2,253) Age (y) 30.89 ± 4.01b 31.08 ± 4.28 31.04 ± 4.08 < 0.001 Pre-pregnancy BMI (kg/m2) 20.69 ± 2.15 27.72 ± 2.29 21.88 ± 3.42 < 0.001 ∆BMI (kg/m2) 6.04 ± 2.14 4.44 ± 2.63 5.77 ± 2.31 < 0.001 Gestational Age (weeks) 38.93 ± 1.53 38.83 ± 1.86 38.91 ± 1.59 0.238 Birth Weight (kg) 3.35 ± 0.44 3.47 ± 0.51 3.37 ± 0.46 < 0.001 Gender, n (%) 0.779 Male 973 (52.0) 202 (52.9) 1,175 Female 898 (48.0) 180 (47.1) 1,078 Maternal education level, n (%) < 0.001 Low 229 (12.2) 64 (16.8) 293 Intermediate 1,432 (76.5) 295 (77.2) 1,727 High 210 (11.2) 23 (6.0) 233 Family monthly income (CNY), n (%) < 0.001 < 5,000 450 (24.1) 122 (31.9) 572 5,000- 899 (48.0) 188 (49.2) 1,087 > 10,000 522 (27.9) 72 (18.9) 594 Delivery pattern, n (%) 0.005 Natural delivery 1,036 (55.4) 181 (47.4) 1,217 Cesarean delivery 835 (44.6) 201 (52.6) 1,036 Parity, n (%) 0.003 Primiparity 1,297 (69.3) 235 (61.5) 1,532 Multiparity 574 (30.7) 147 (38.5) 721 Smoking during pregnancy, n (%) 0.343 Nonusers 1,843 (98.5) 379 (99.2) 2,222 Smokers 28 (1.5) 3 (0.8) 31 Alcohol consumption during pregnancy, n (%) 0.393 Nonusers 1,726 (92.3) 358 (93.7) 2,084 Alcohol consumers 145 (7.7) 24 (6.3) 169 Note. aANOVA, Kruskal Wallis and Chi-square test were used to compare the characteristics of the enrolled children and mothers between pre-pregnancy BMI groups. bData represent $\bar x \pm s $ (all such values). BMI, body mass index; ∆BMI, change in BMI during pregnancy; CNY, China Yuan. Table 2. Characteristics of the enrolled children & mothers in relation to pre-pregnancy BMI groups
-
Table 3 shows fixed effects of age and pre-pregnancy BMI on offspring total DQ and five neurobehavioral domains. The mixed-model analysis revealed that pre-pregnancy BMI, month of age, and their interaction had significant effects on total DQ and five neurobehavioral domains after adjustment.
Neurobehavioral domains Pre-pregnancy BMI Age of month Pre-pregnancy BMI × Age of month F P F P F P Total DQ 20.99 < 0.001 586.60 < 0.001 22.63 < 0.001 Gross motor 1.31 < 0.001 228.00 < 0.001 8.95 < 0.001 Fine motor 1.06 < 0.001 153.70 < 0.001 9.40 < 0.001 Adaptive 11.45 < 0.001 231.80 < 0.001 7.01 < 0.001 Language 1.22 < 0.001 401.40 < 0.001 12.30 < 0.001 Social 8.73 < 0.001 472.50 < 0.001 14.29 < 0.001 Note. Adjusted for mother's age, education level, family monthly income, ∆BMI, gestational weeks, delivery pattern, parity, smoking and alcohol consumption, child's sex, birth weight. Table 3. Fixed effects of age and pre-pregnancy BMI on offspring total DQ and five neurobehavioral domains
The estimates and model are shown in Supplementary Table S1 (available in www.besjournal.com). In terms of the interaction, the estimate of pre-preg
nancy BMI ≥ 25 vs. < 25 kg/m2 at 12-month-age was significantly smaller than at 1-month-age for total DQ (β = −10.10, P < 0.001) and five neurobehavioral domains (gross motor: β = −10.31, P < 0.001; fine motor: β = −9, P < 0.001; adaptive: β = −8.9, P = 0.001; language: β = −11.56, P < 0.001; and social: β = −10.82, P < 0.001). The estimate of pre-pregnancy BMI ≥ 25 vs. < 25 kg/m2 at 24-month-age was also significantly smaller than at 1-month-age for total DQ (β = −12.42, P < 0.001) and five neurobehavioral domains (gross motor: β = −11.73, P < 0.001; fine motor: β = −10.87, P < 0.001; adaptive: β = −9.93, P < 0.001; language: β = −15.25, P < 0.001; and social: β = −13.42, P < 0.001). Variables Age of month BMI group Total DQ Gross motor Fine motor Adaptive Language Social β P β P β P β P β P β P Pre-pregnancy BMI < 25 kg/m2 Ref. Ref. Ref. Ref. Ref. Ref. Pre-pregnancy BMI ≥ 25 kg/m2 10.40 < 0.001 10.58 < 0.001 9.03 < 0.001 9.40 < 0.001 12.36 < 0.001 10.82 < 0.001 Age of month 1 Ref. Ref. Ref. Ref. Ref. Ref. Age of month 12 −23.77 < 0.001 −21.60 < 0.001 −14.34 < 0.001 −24.34 < 0.001 −29.88 < 0.001 −30.12 < 0.001 Age of month 24 −26.53 < 0.001 −22.16 < 0.001 −18.10 < 0.001 −25.09 < 0.001 −34.89 < 0.001 −34.07 < 0.001 Pre-pregnancy BMI × Age of month 1 ≥ 25 vs. <25 kg/m2 Ref. Ref. Ref. Ref. Ref. Ref. Pre-pregnancy BMI × Age of month 12 ≥ 25 vs. <25 kg/m2 −10.10 < 0.001 −10.31 < 0.001 −9.00 < 0.001 −8.90 0.001 −11.56 < 0.001 −10.80 < 0.001 Pre-pregnancy BMI × Age of month 24 ≥ 25 vs. <25 kg/m2 −12.42 < 0.001 −11.73 < 0.001 −10.87 < 0.001 −9.93 < 0.001 −15.25 < 0.001 −13.42 < 0.001 Note. Adjusted for mother's age, education level, family monthly income, ∆BMI, gestational weeks, delivery pattern, parity, smoking and alcohol consumption, child's sex, birth weight. Table S1. Estimates of fixed effects on offspring total DQ and five neurobehavioral domains
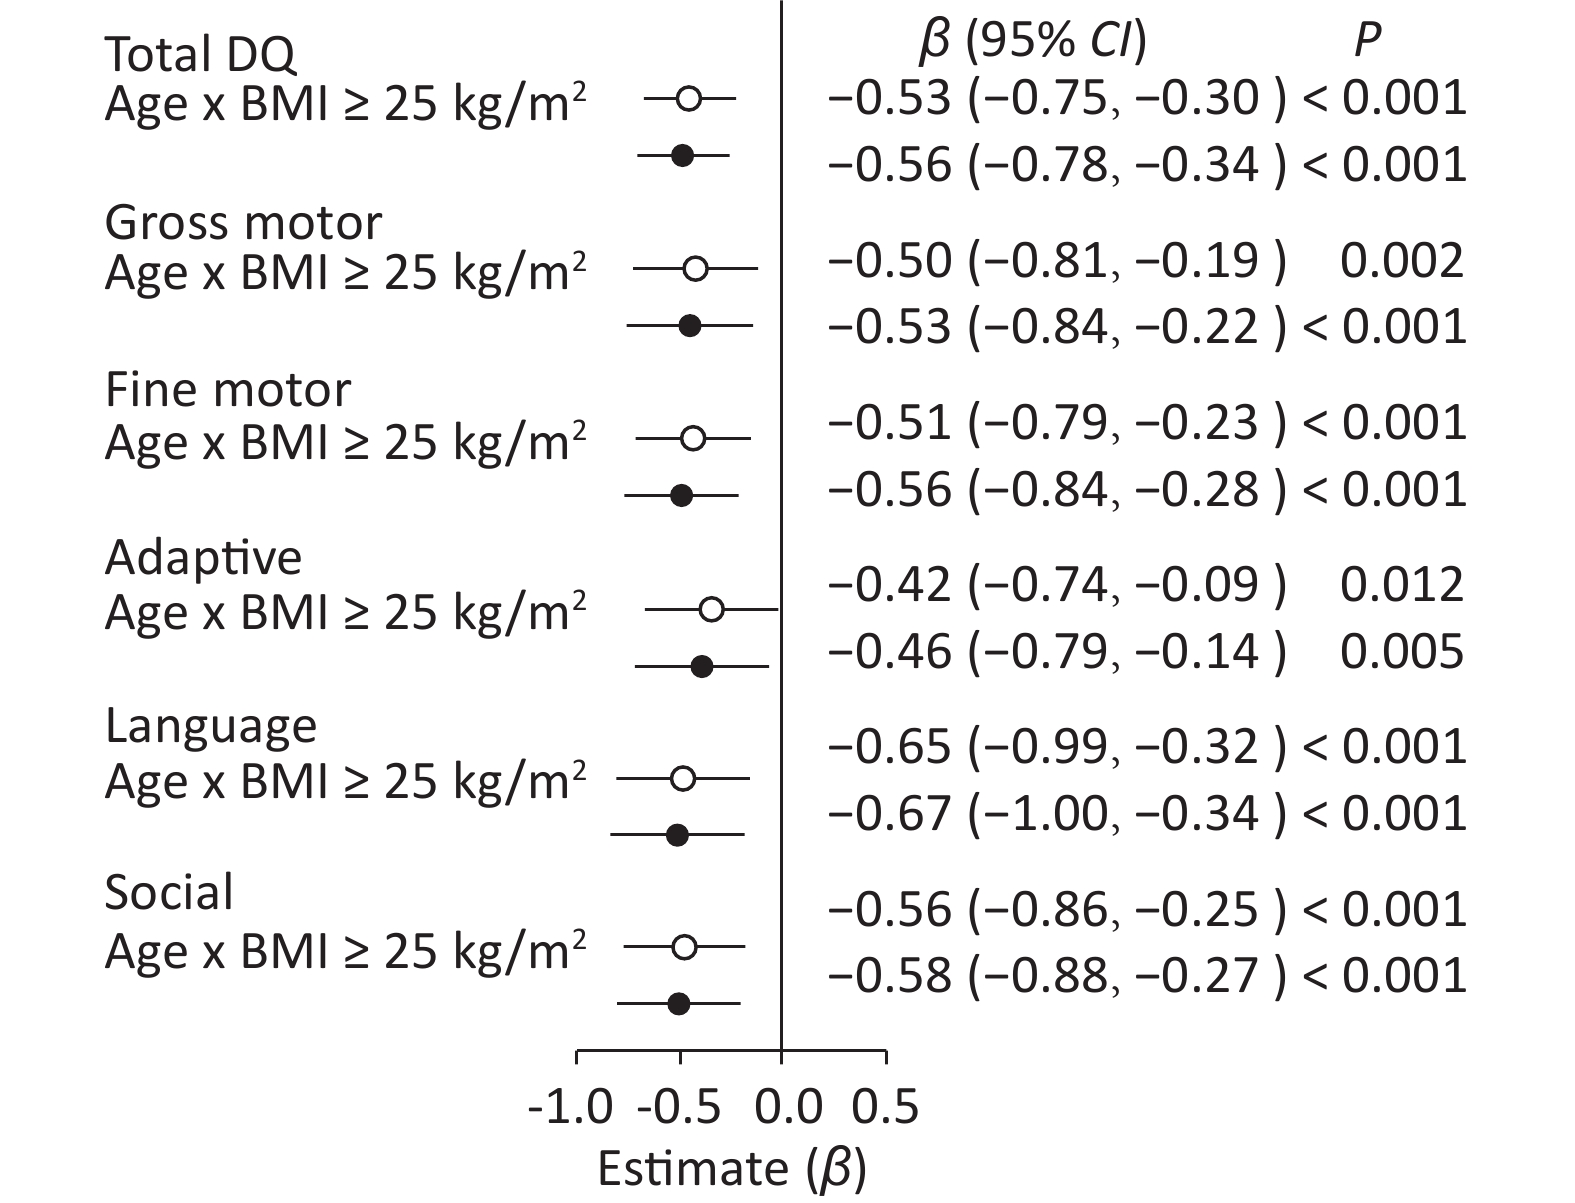
When pre−pregnancy BMI was used as a categorical variable, age × pre−pregnancy BMI ≥ 25 kg/m2 had a negative effect in comparison with age × pre−pregnancy BMI < 25 kg/m2 after adjustment (Figure 1) on total DQ (β = −0.56, 95% CI: −0.78 to −0.34, P < 0.001) and five neurobehavioral domains (gross motor: β = −0.53, 95% CI: −0.84 to −0.22, P < 0.001; fine motor: β = −0.56, 95% CI: −0.84 to −0.28, P < 0.001; adaptive: β = −0.46, 95% CI: −0.79 to −0.14, P < 0.005; language: β = −0.67, 95% CI: −1.00 to −0.34, P < 0.001; and social: β = −0.58, 95% CI: −0.88 to −0.27, P < 0.001).

Figure 1. Forest plots showing the age × pre-pregnancy BMI groups (BMI < 25 kg/m2 vs. BMI ≥ 25 kg/m2) interaction for total DQ and five neurobehavioral domains.○: crude model. ●: adjusted model for mother's age, education level, family monthly income, ∆BMI, gestational weeks, delivery pattern, parity, smoking and alcohol consumption, child's sex, birth weight. Reference variable was age × pre-pregnancy BMI < 25 kg/m2.
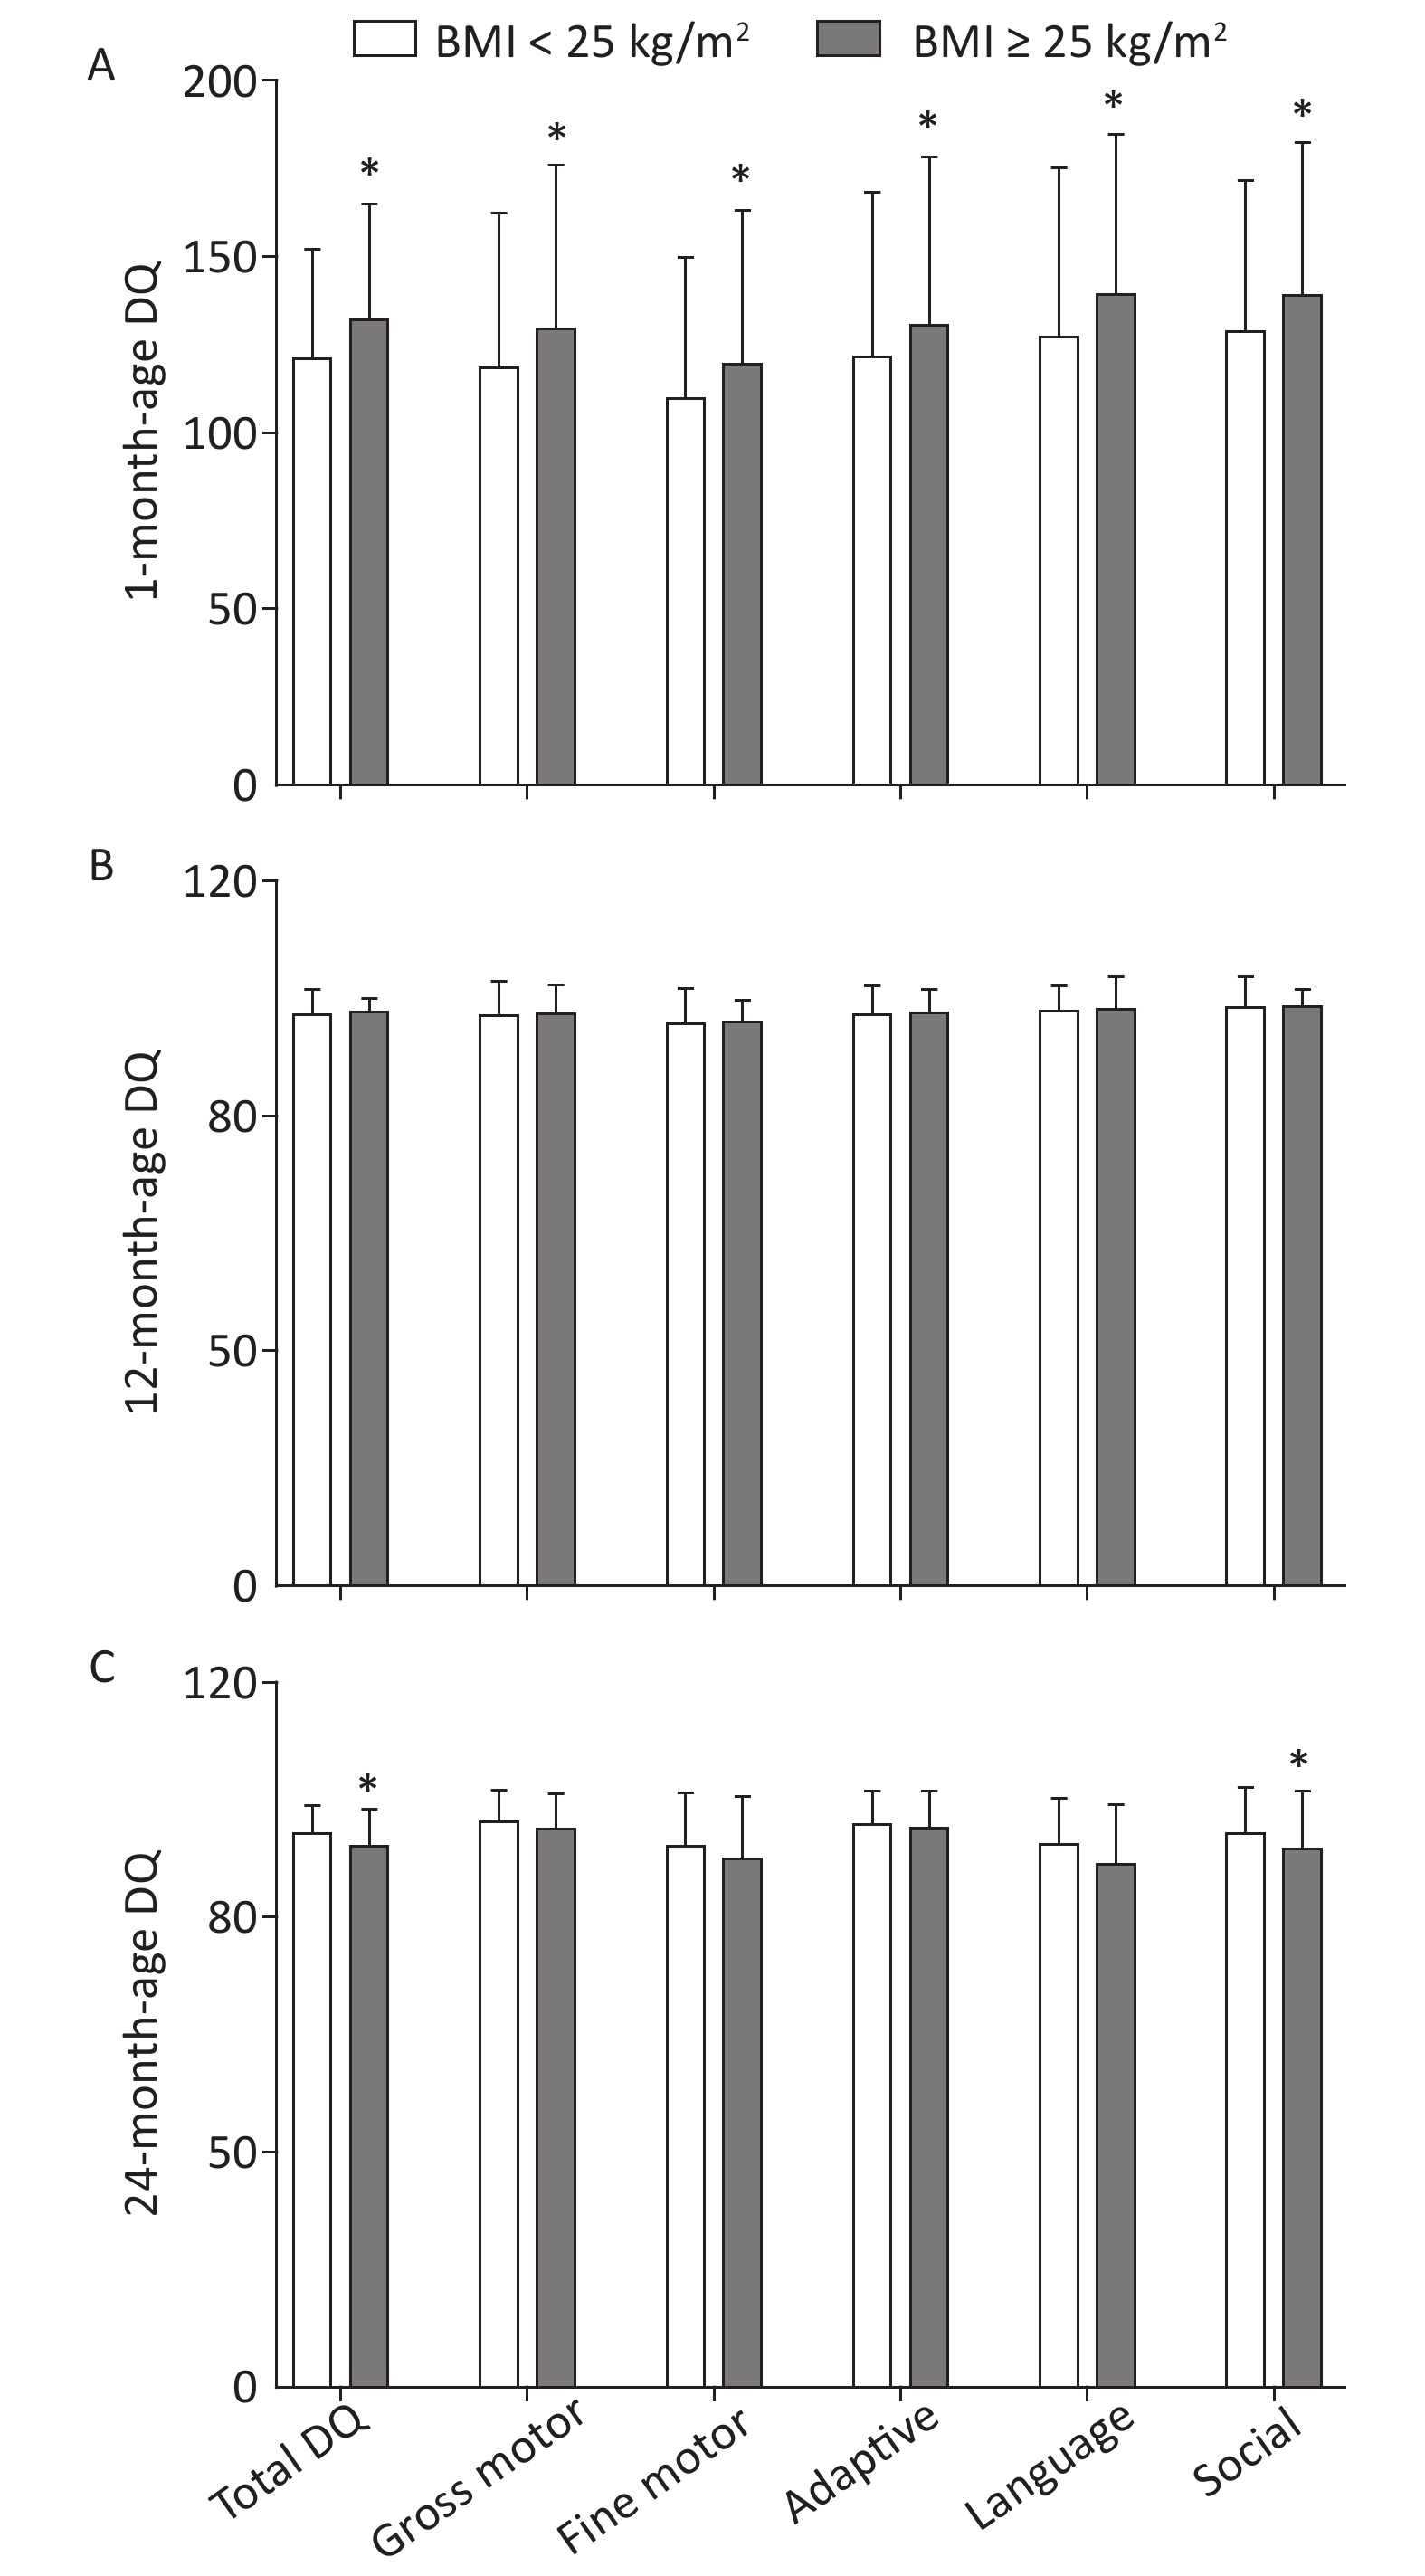
Post-hoc multiple comparisons revealed that children of mothers with pre-pregnancy BMI ≥ 25 kg/m2 were significantly higher in total DQ and five neurobehavioral domains (gross motor, fine motor, adaptive, language, and social) at 1 month of age in comparison with children of mothers with pre-pregnancy BMI < 25 kg/m2 (P < 0.05, Sidak-corrected). A completely opposite result was observed for DQ at 24 months of age, whereby maternal pre-pregnancy BMI ≥ 25 kg/m2 was associated with lower total DQ and five neurobehavioral domains (gross motor, fine motor, adaptive, language, and social) of children; statistically significant differences were found in total DQ and social neurobehavioral domains (P < 0.05). There was no significant difference in offspring neuropsychological development at 12 months of age between maternal pre-pregnancy BMI classes (BMI < 25 kg/m2 vs. BMI ≥ 25 kg/m2; Figure 2).
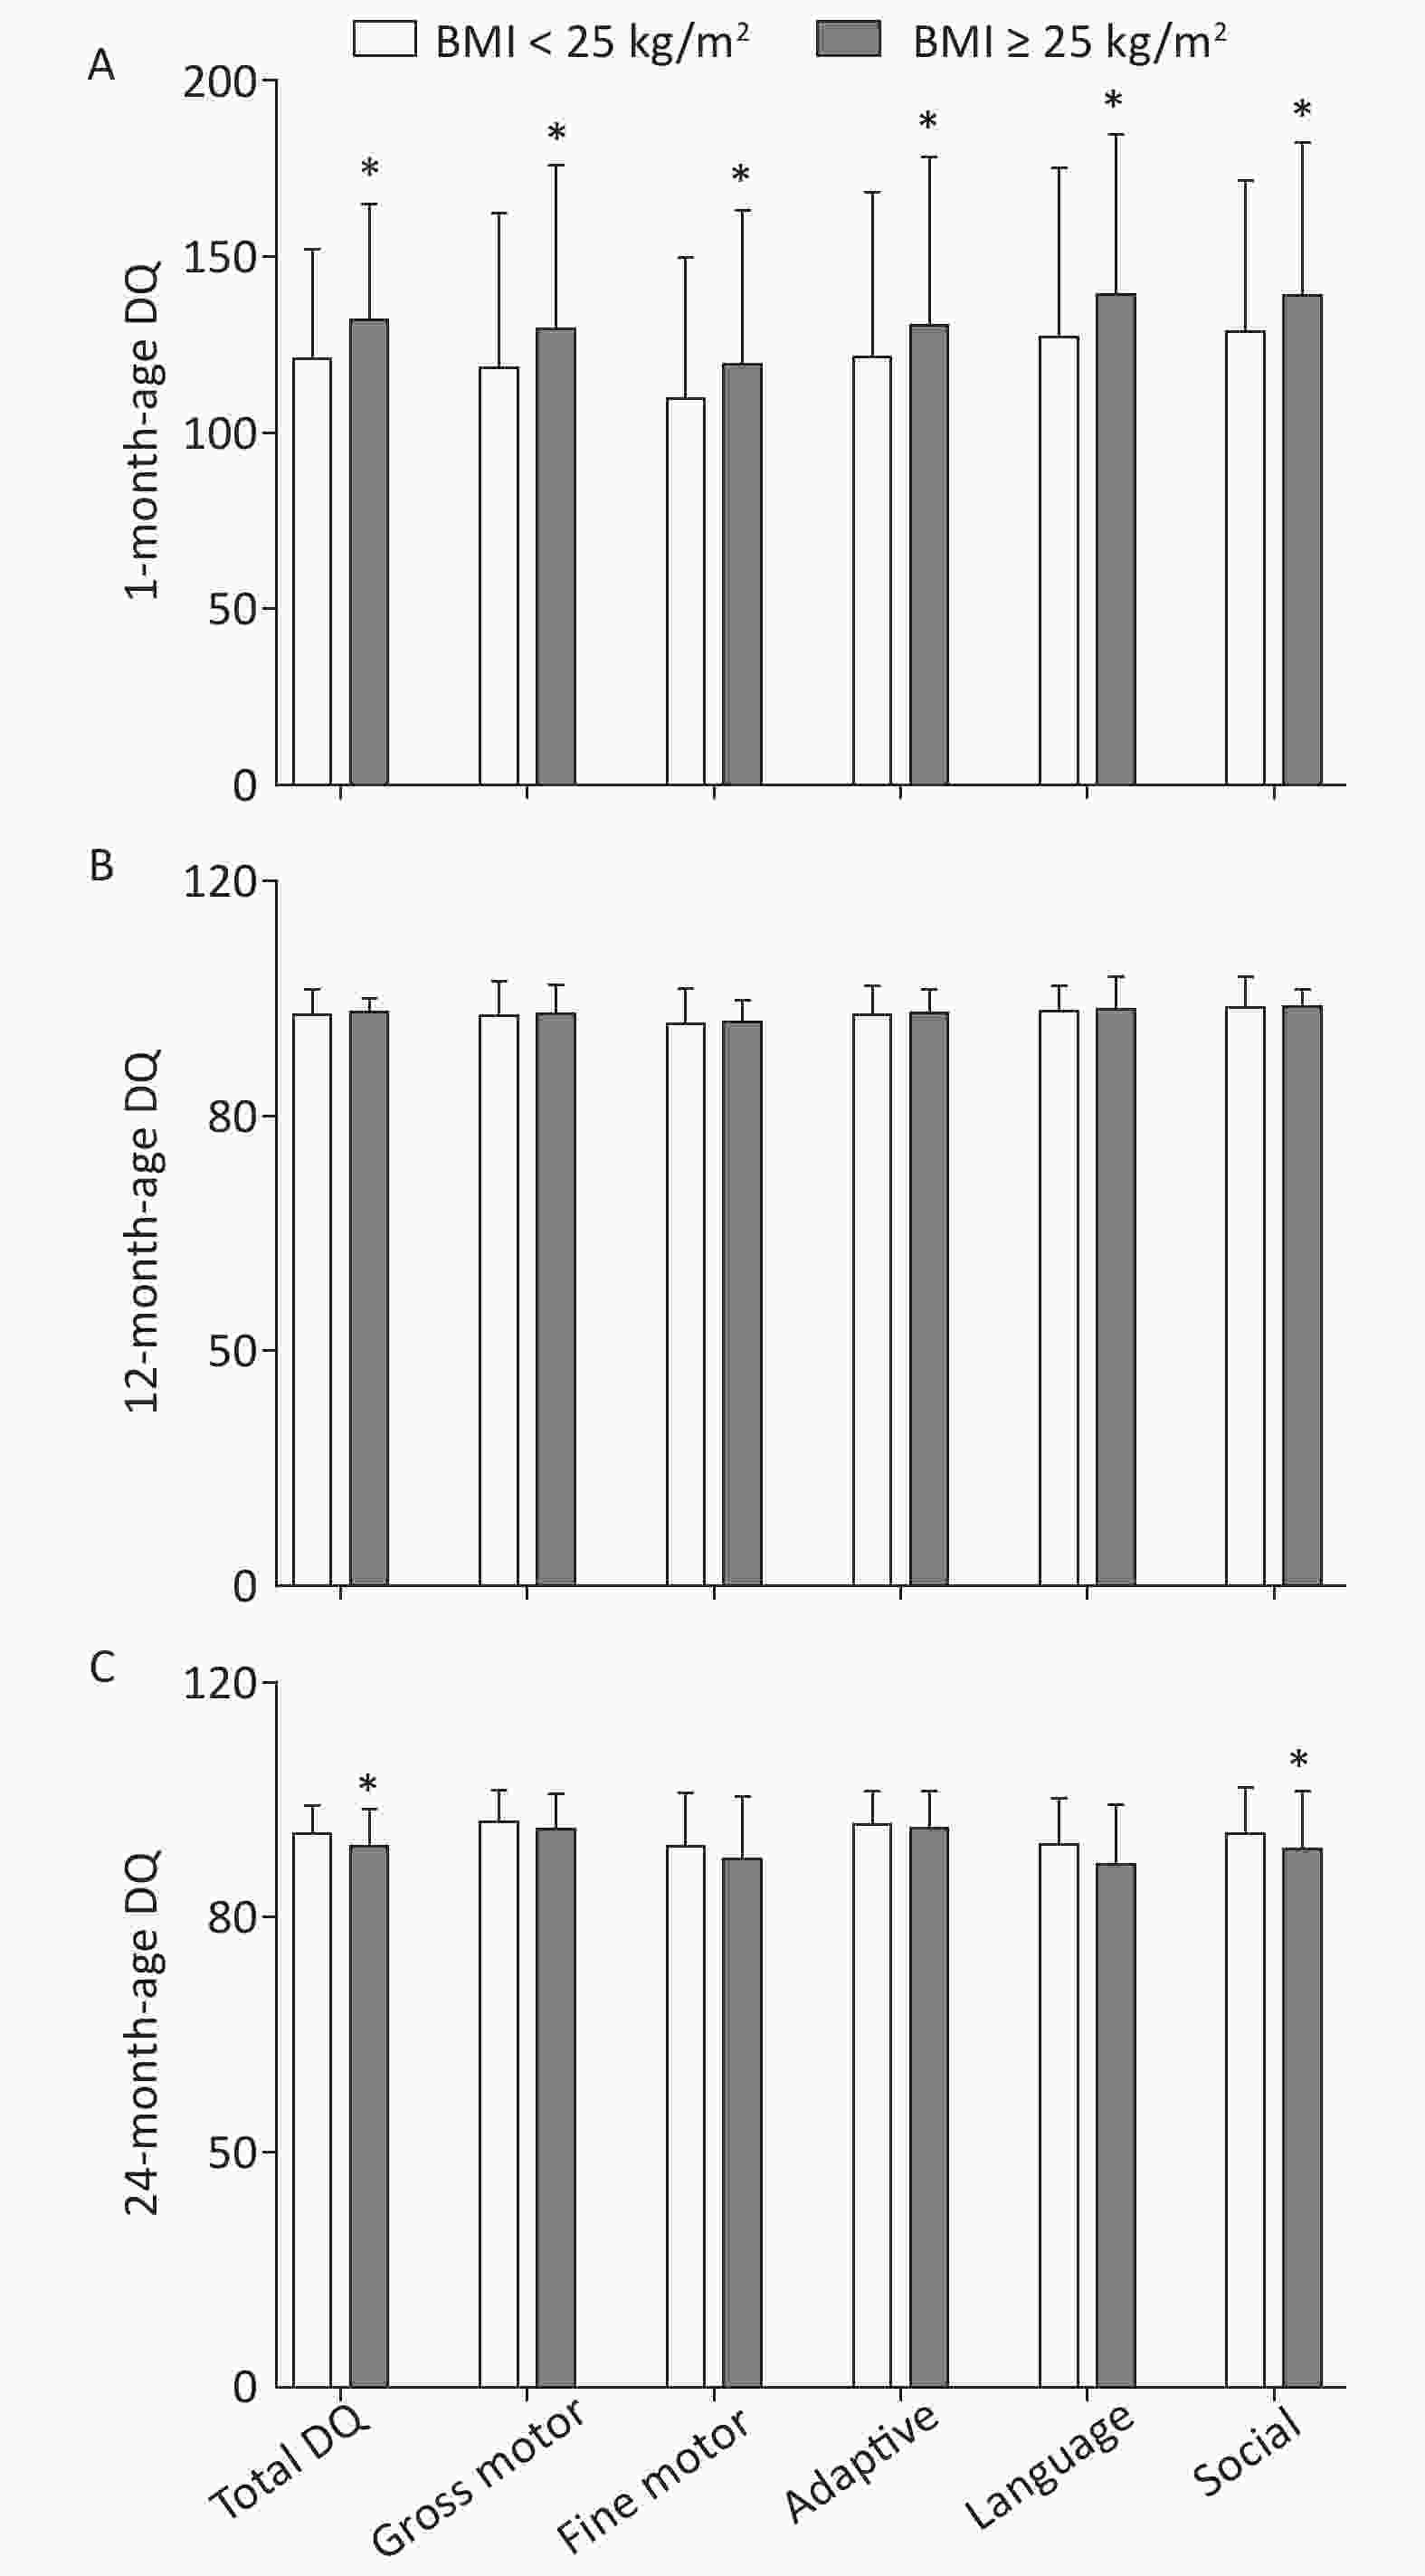
Figure 2. Multiple comparisons for total DQ and five neurobehavioral domains at each age between different maternal pre-pregnancy BMI groups. (A) 1-month-age DQ; (B) 12-month-age DQ; (C) 24-month-age DQ. Data are expressed as
$\bar x \pm s $ . *The significant difference in offspring neuropsychological development at each age between maternal pre-pregnancy BMI groups after adjusted for mother's age, education level, family monthly income, ∆BMI, gestational weeks, delivery pattern, parity, smoking and alcohol consumption, child's sex, birth weight (P < 0.05, Sidak-corrected). -
This is the only study to report neurodevelopmental variation from 1 month to 24 months of age in Chinese children according to different maternal pre-pregnancy BMI. Using the China Developmental Scale for Children, we demonstrated that maternal pre-pregnancy BMI is associated with the child’s DQ and five neurobehavioral domains (motor, adaptive, language, and social development). Indeed, two years after birth is a critical period for a child's neuropsychological development: the coupling of dendrites and synapses and the brain's weight will increase rapidly, promoting new perceptions, cognition, and motor ability. Similarly, most young children begin to speak, forming neural pathways linking listening and behavior[30], gaining self-awareness, and becoming more capable of controlling their emotions and activities[31, 32]. At 2 years of age, children notably develop their cognitive and memory skills[33]. Prior research on maternal pre-pregnancy obesity and achievement of infant motor developmental milestones at 2 years of age has revealed that the former is associated with a slightly longer time for infant to begin to sit and crawl[34]. Other cohort studies of children of approximately 2 years of age showed a significant association between maternal pre-pregnancy BMI and children’s mental and cognitive development[35, 36].
Different from previous studies, our study of maternal pre-pregnancy BMI and offspring neuropsychological outcomes focused on short-term (1-month) postnatal patterns and long-term trends. The current results revealed higher DQ scores at 1 month of age for the pre-pregnancy BMI ≥ 25 kg/m2 group compared to the pre-pregnancy BMI < 25 kg/m2 group, but this did not persist. Subsequently, DQ of the pre-pregnancy BMI ≥ 25 kg/m2 group dropped sharply, resulting in a lower score of the pre-pregnancy BMI < 25 kg/m2 group at 24 months, in complete contrast to the results at 1 month. A prospective case-control study published in 2015 also obtained similar unexpected results concerning short-term advantages of obesity, albeit at the age of 6 months[37]. This may indicate the temporary increase in DQ is a part of a specific neurodevelopmental profile occurring within a few months of birth, whereas maternal overweight and obesity before pregnancy can have a negative long-term impact on child development.
The above evidence is consistent with the gradual and long-term development of the brain. Human brain maturation continues until approximately 20 to 25 years of age. From conception to birth, and even into adulthood when the brain is truly mature, human brain development is a slow process, during which changes in brain physiology are associated with changes in expressed behaviors[38, 39]. One cannot judge a child's long-term prognosis using a single point-in-time assessment. Continuous, patient observation is necessary in the field of pediatrics. More significantly, the results reveal the necessity to define the laws of neurodevelopment so that interventions can occur in timely manner to prevent or reverse the occurrence of adverse effects.
At present, the relevant mechanisms related to pregnancy BMI and brain development have predominately focused on inflammatory factors and epigenetics. BMI is a good marker of body fat in early pregnancy in women with healthy weight, overweight, and obesity[40]. It is biologically plausible that maternal obesity could predispose offspring to neurodegeneration and decreased neurogenesis, primarily via inflammatory responses. Adipocytes accumulate fatty acids, which lead to increased inflammatory cytokines in both maternal and fetal circulation[41, 42]. Epigenetic changes in maternal or paternal germ cells, or in the fetus during a developmentally sensitive period, resulting from environmental perturbations, may alter development[43] and epigenetic variation could influence the expression of genes involved in immunity[44]. In terms of our results, the impact of maternal pre-pregnancy BMI on physically small month-old children represents a quiet period, but effects of pre-pregnancy maternal overweight and obesity appear when the child reaches 2 years of age and may last longer. To further understand the underlying causal relationships, dietary interventions to counter inflammation and epigenetic changes among pregnant women with overweight and obesity have been suggested[9]. Additionally, the first 1000 days initiative has focused heavily on dietary interactions during pregnancy, and on pre- and post-natal health and development of offspring[15]. It is also important to monitor the effects of such interventions at different child ages, and thereby obtain a more accurate assessment of developmental status at each time point.
Among the strengths of the study were its collection of continuous follow-up data, complete information about pregnancy weight, neuropsychological development scores of offspring, and particularly those obtained at one month after birth; this ongoing data collection permitted the characterization of developmental trends over time. However, our study had several limitations. First, recall bias was possible as this is a retrospective birth cohort study. Second, although we adjusted for a wide range of potential risk factors, other confounders or effect modifiers cannot be dismissed (e.g., paternal characteristics and feeding patterns). Moreover, we did not control for nutritional status during the perinatal period. Further studies, which adjust for additional confounders and collect more balanced samples, were needed to determine the specific pathways and determinants of the effects of pre-pregnancy maternal weight on the neuropsychological development of offspring.
-
In summary, the results of the present study supported the age × pre-pregnancy BMI interaction on offspring neuropsychological development. It revealed a short-term beneficial impact of pre-pregnancy maternal BMI ≥ 25 kg/m2 on neuropsychological development of offspring at 1 month of age. Then at 24 months of age, the neuropsychological development of offspring of mothers with pre-pregnancy BMI ≥ 25 kg/m2 decreased significantly, to a lower level than of the pre-pregnancy BMI < 25 kg/m2 group. This result revealed a lag in the negative effects of maternal pre-pregnancy BMI ≥ 25 kg/m2 on the neuropsychological development of children, which was consistent with widespread recommendations to control pre-pregnancy BMI. Therefore, it should be recommended that women of reproductive age should maintain a healthy BMI to promote healthy offspring development.
-
We appreciate all of the mothers and children who enrolled in the cohort study.
-
The authors declare that they have no conflicts of interest.
-
CAO Lu Jia conducted the research and wrote the first draft of the paper. LIN Hong Yan conducted the research and manuscript preparation. LIANG Xuan and CHEN Yong Jie contributed significantly to data analysis. LIU Yu Yan and ZHENG Yu Zhi conducted the research and data collection. WANG Xin Yan and LI Wen provided data interpretation. YAN Jing and HUANG Guo Wei designed the research and subsequently revised the manuscript. All authors contributed to writing and editing the final paper.


Funds:
This research was supported by a grant from the National Natural Science Foundation of China [No.81472967 and No. 81602849]; and Young Elite Scientists Sponsorship Program by CAST [No. 2017QNRC001]

 Quick Links
 DownLoad: