


-
With the increasing prevalence of obesity comes an increased need for therapeutic and preventive strategies [1]. It is evident that the development of obesity is caused by a disorder of lipid metabolism and glucose homeostasis[2]. Thus, the regulation of these two factors could be an important approach to control obesity. Recently, potential natural products or functional supplements from edible resources have emerged as an attractive strategy for weight loss[3, 4]. Barley is a cereal that is often associated with beneficial health effects, particularly due to the attention garnered by whole grains and special dietary grains at domestic and international levels. Barley plays an important role in maintaining body weight and inhibiting obesity[5]. Studies have shown that the β-glucan and phenolic compounds in barley have beneficial effects on body weight, blood cholesterol levels, and glucose metabolism[6-8]. In our previous study, the natural product fermented barley with Lactobacillus plantarum dy-1 (LFBE) was observed to ameliorate diet-induced obesity. Furthermore, Lactobacillus fermentation significantly improved the anti-obesity action of barley[9].
miRNAs are short non-coding RNAs with only 18 to 25 nucleotides. These are known to regulate cellular gene expression at the transcriptional or post-transcriptional level by suppressing translation of protein coding genes or cleaving mRNAs to induce their degradation through imperfect pairing with target miRNAs[10]. In addition, miRNAs play important regulatory roles in many physiological processes such as regulation of cell viability, embryonic development, lipid metabolism, inflammatory response, and autoimmunity[11]. They are also involved in many functional aspects of adipocyte differentiation and may contribute to the pathogenesis of obesity and its related medical complications[2]. Some miRNAs have been proposed to be specifically associated with obesity, such as miR-375[12], miR-34a[13, 14], and miR-122[15].
Therefore, in this paper, we further analyzed the anti-obesity action of LFBE and its underlying mechanism(s) with the broader objective of novel product development to counter obesity. We focused on the anti-obesity and lipid metabolism effects of LFBE in rats with HFD-induced obesity. Further, we used miRNA microarrays to identify differentially expressed miRNAs and characterize their potential roles in the liver on LFBE treatment. Our work provides preliminary insights into the mechanism of anti-obesity action of LFBE at the genetic level, based on which we propose a theoretical framework for its application.
-
Hulled barley (Yang si mai 3) was purchased from Yan Cheng city of China. Normal chow (standard rodent chow diet) was purchased from Xietong Organism Institute (Nanjing, China). Lactobacillus plantarum dy-1 had been previously isolated and assigned the preservation number CGMCC NO. 6016 in the database of the Chinese Common Microbe Bacterial Preservation Administration Center. Powdered LFBE was prepared by fermentation, centrifugation, and lyophilization according to protocols detailed elsewhere [16]. An extract of unfermented raw barley (RBE) was also prepared as described previously [16]. All other reagents and solvents were purchased from Sinopharm Chemical Reagent Co. Ltd. (Shanghai, China) and were of analytical or chromatographic grade.
-
Sprague-Dawley (SD) male rats weighing 200 ± 10 g were obtained from the Laboratory Animal Research Center of Jiangsu University (Zhenjiang, China; code number SCXK [SU] 2013-0011). SD rats, characterized by stable changes in hormone levels and strong drug resistance, are a common model organism in the field of nutrient metabolism research. The rats were caged individually at 22 ± 2 °C and a relative humidity of 40% to 60%, and were artificially exposed to an approximate 12-h light/dark cycle. The frequency of air exchange was about 18 times per hour. The rats were provided with a standard rodent chow diet (Xietong Organism Institute, Nanjing, China) and filtered tap water ad libitum. All experiments were conducted in compliance with the National Institute of Health Guidelines for the Care and Use of Laboratory Animals (NIH Publications No. 80-23, revised in 1996). The Animal Care and Use Committee of Jiangsu University approved this animal study.
After acclimatization, the male SD rats were randomly divided into two groups: normal control (NC) and high fat diet (HFD)-induced obesity model groups. The NC group (n = 12) was fed normal chow (standard rodent chow diet, moisture 10.3 g/100 g, crude protein 18.2 g/100 g, crude fat 6.0 g/100 g, crude ash 6.6 g/100 g, crude fiber 5.0 g/100 g, carbohydrate 53.9 g/100 g, calcium 14.0 g/100 g, total phosphorus 9.0 g/100 g, lysine 8.2 g/100 g, and methionine + L-cystine 5.3 g/100 g) in conjunction with distilled water through intragastric administration. The HFD group was maintained on a high fat diet containing 73.0 g/100 g basic diet, 12.0 g/100 g lard, 10.0 g/100 g sucrose, and 5.0 g/100 g yolk powder. After feeding the NC and HFD rats with the respective diets for 8 weeks, the body weight, body length, and oral glucose tolerance of these rats were determined. The HFD rats were found to weigh 20% more than normal rats, with an increase in Lee's index and reduction in oral glucose tolerance, as expected in the diet-induced obesity model. Then, the HFD rats were randomly separated into two groups: a HFD group (n = 8) which was maintained on HFD in conjunction with distilled water (4 mL/kg) through intragastric administration; and an LFBE group (n = 8) which was maintained on HFD in conjunction with LFBE (1 g/kg·d, body weight) through intragastric administration. The dosage of LFBE was chosen based on previous studies showing that administration of LFBE (1 g/kg·d, body weight) can effectively inhibit lipid accumulation and maintain blood glucose levels. The experimental period lasted for 8 weeks and all groups had ad libitum access to food and water.
During the 8-week treatment period, body weight was measured every 2 weeks and oral glucose tolerance was measured at the beginning and end of the treatment period. After 8 weeks, all animals were anesthetized with chloral hydrate and sacrificed. The viscera, skeletal muscles, and fat tissues were excised, weighed, and then stored at −70 °C. The harvested liver and epididymal fat tissue were fixed in 10% formaldehyde for 2 days and embedded in paraffin for histological studies. Subsequently, these paraffin blocks were sectioned at a thickness of 5 µm and were stained with hematoxylin and eosin (H & E). Blood samples were collected via abdominal aorta puncture and centrifuged at 10,000 xg (Eppendorf, Hamburg, Germany) for 3 min to obtain serum, which was stored at −20 °C until further analysis. The liver samples were ground up and added to normal saline solution using an electric homogenization machine (IKA, Staufen, Germany) and then centrifuged at 10,000 xg (Eppendorf, Hamburg, Germany) for 3 min to obtain the supernatant, which was also stored at −20 °C until further analysis.
-
The serum samples were assayed for TG, TC, high-density lipoprotein cholesterol (HDL-C), and low-density lipoprotein cholesterol (LDL-C) levels with an Olympus AU2700 Clinical Chemistry Analyzer (Olympus Inc., Tokyo, Japan). Insulin levels were determined using commercial rat insulin enzyme-linked immunosorbent assay kits (R&D Systems China Co. Ltd., Shanghai, China).
-
Total RNA was isolated using TRIzol reagent (Invitrogen, Carlsbad, CA, USA) and further purified with a miRNeasy mini kit (Qiagen, Dusseldorf, Germany) according to the manufacturer’s instructions. RNA quality and quantity were checked with a ND-1000 spectrophotometer (Nanodrop Technologies, Houston, TX, USA). An RNA quality control procedure was followed to ensure that only high-quality RNA samples were used for microarray analysis. Spectrophotometry was performed to examine RNA purity, and only samples with OD260/OD280 value of 0-2 and OD260/OD230 value greater than 1.8 were considered acceptable for further experiments. RNA integrity was determined by gel electrophoresis, and only samples with 28S/18S values greater than 2 were utilized for the study.
-
Microarray analysis of miRNAs was assisted by the Kangcheng Bioscience Service Company (Shanghai). Each sample, pooled from three randomly selected rats in each group, was run three times. miRNAs were labeled by the miRCURY LNATM Hy3/Hy5 Power labeling kit (Exiqon, Vedbæk, Denmark) and hybridized on a miRCURY LNATM microRNA Array kit (v.18.0) (Exiqon, Vedbæk, Denmark). The slides were scanned with an Axon GenePix 4000B microarray scanner (Axon Instruments, Foster City, CA, USA). The scanned images were then imported into the GenePix Pro 6.0 software (Axon Instruments, Foster City, CA, USA) for grid alignment and data extraction. Replicated miRNAs were averaged, and miRNAs with intensities of 30 or greater in all samples were chosen for calculation of the normalization factor. The expressed data were normalized using median normalization. After normalization, the differentially expressed miRNAs were determined statistically using Student’s t test. P values of less than 0.05 were considered to indicate statistical significance. A fold change (stress/control) of 1.5 or greater indicated upregulation and that of less than 0.67 indicated downregulation.
-
In vivo, six miRNAs were randomly selected from the deregulated miRNAs for further validation using RT-qPCR. The RT reactions contained 1 μg RNA, 1 μmol/L RT primers, 10 × RT buffer, 2.5 mmol/L each of dNTPs, 200 U/μL reverse transcriptase, and 40 U/μL RNase inhibitor. The 20 μL reactions were incubated for 30 min at 16 °C, 40 min at 42 °C, and then 5 min at 85 °C. The cDNA product was used for the following PCR analysis. The 10 μL reactions included 2 × Master Mix, 10 μmol/L of each primer, and 2 μL cDNA. Reactions were incubated at 95 °C for 10 min, followed by 40 cycles at 95 °C for 10 s and 60 °C for 60 s, on an ABI PRISM 7900 system (Applied Biosystems, Foster City, CA, USA). The primers (sequences are available upon request) were designed by Primer 5.0. All reactions were run in triplicate. The D cycle threshold (Ct) values were obtained for each sample in each group for each miRNA tested. The normalized average value was used for statistics by the 2-ΔΔCt method, and P values of less than 0.05 for each miRNA were considered to indicate statistical significance.
In vitro, approximately 2 × 10⁷ palmitate (PA)-induced hepatocellular carcinoma (HepG2) cells were lysed in TRIzol reagent. Analysis of miR-212 and miR-34a was carried out using a MicroRNA Assay kit (Tiangen Biotech, Beijing, China). Reactions were incubated at 95 °C for 10 min, followed by 40 cycles at 95 °C for 10 s and 60 °C for 60 s on an ABI PRISM 7900 system (Applied Biosystems, Foster City, CA, USA). The U6 small nuclear RNA was used as an internal control.
-
Three target prediction databases (miRBase, miRanda, and TargetScan) were used to identify potential target genes of the differentially expressed miRNAs. The overlapping targets predicted by the three databases were subjected to GO analysis and KEGG pathway analysis. A P value of less than 0.05 was considered to indicate statistical significance.
-
The human HepG2 cells used for our experiments were obtained from the Shanghai Institutes for Biological Sciences of the Chinese Academy of Sciences. The HepG2 cells were cultured as monolayers up to 80% confluence in Dulbecco’s modified Eagle’s medium (DMEM) supplemented with 10% heat-inactivated fetal calf serum (FCS) and 1% penicillin/streptomycin at 37 °C and 5% CO2 in humidified air. Cell counts were determined using a CC-108 micro-cell counter (Sysmex, Kobe, Japan). Cells in the logarithmic phase of growth were used for all studies described below.
-
20 nmol/L of miR-212 mimic, miR-212 inhibitor (anti-miR-212), miR-34a mimic, miR-34a inhibitor (anti-miR-212), and their negative control (NC) were synthesized by Viewsolid Biotech (Beijing, China). HepG2 cells were maintained in DMEM supplemented with 10% fetal bovine serum (FBS) at 37 °C in a humidified incubator with 5% CO2. Cells (1 × 10⁵) were transfected with either 20 nmol/L miR-212 mimic (5’UUCUCCGAACGUGUCACGUTT3’), 20 nmol/L miR-212 inhibitor (5’ACGUGACACGUUCGGAGAATT-3’), or NC using LipofectamineTM 2000 (Sigma-Aldrich, St. Louis, MO, USA) according to the manufacturer’s instructions. At 12 h post-transfection, the transfected cells were transferred into normal growth medium. The efficiency of transfection was evaluated by RT-PCR and fluorescence microscopy.
-
HepG2 cells were cultured in high-glucose DMEM supplemented with 10% FBS. After confluence, cells were cultured in 96-well cluster plates in high-glucose DMEM supplemented with 10% FBS for 24 h and were then treated with 0.15 mmol/L palmitate for 12 h in serum-free and phenol red-free high-glucose DMEM. The cells were then washed twice with high-glucose DMEM and twice with PBS, and added to serum-free and phenol red-free high-glucose DMEM with compounds in different concentrations and incubated for 24 h at 37 °C. After this incubation, glucose content in the culture medium was measured by the glucose oxidase method using a glucose assay kit (Nanjing Jiancheng Bioengineering Institute, Nanjing, China) to determine the amount of glucose remaining in the culture medium. This experiment was for studying changes in glucose consumption of HepG2 cells. Glucose consumption was calculated as glucose concentrations of blank wells subtracted from that of wells plated with cells.
Cells were lysed using cell lysis buffer (20 mmol/L Tris pH 7.5, 150 mmol/L NaCl, 1% Triton X-100, 2.5 mmol/L sodium pyrophosphate, 1 mmol/L EDTA, 1% Na3VO4, 0.5 μg/mL leupeptin, 1 mmol/L phenylmethanesulfonyl fluoride). The lysates were collected and centrifuged at 10,000 xg at 4 °C for 5 min. The supernatants were collected and assayed for TG concentration with assay kits (Nanjing Jiancheng Bioengineering Institute, Jiangsu, China). Cellular protein content was determined using the Bio-Rad protein assay reagent (Bio-Rad, Hercules, CA, USA) as follows: relative content of TG (%) = (TG content of experimental group/corresponding protein concentration) / (TG content of normal group/corresponding protein concentration).
-
Data are expressed as the arithmetic mean ± standard deviation (SD) or standard error of the mean (SEM). Analysis of variance was used to test for differences between the mean values. All statistical analyses were performed with SPSS version 17.0 (SPSS, Chicago, IL, USA).
-
Previous studies have shown that RBE contained 13.94% ± 1.05% crude protein, 56.61% ± 2.34% total sugar, 8.96 ± 0.21 mg/g total phenol (expressed as gallic acid equivalent, mg gallic acid/g dried extract), and 4.83% ± 0.43% β-glucan. Compared to unfermented barley, after 24 h of incubation with Lactobacillus plantarum dy-1 (initial cell density 4 × 10⁸ cfu/g) at 30 °C, the protein content in LFBE showed a significant increase to 34.94% ± 1.51%, and the sugar content markedly decreased to 34.35% ± 2.59%. The total phenol content of LFBE increased to 13.61 ± 0.15 mg/g. In addition, the concentration of β-glucan significantly increased to 13.44% ± 0.63%[16].
-
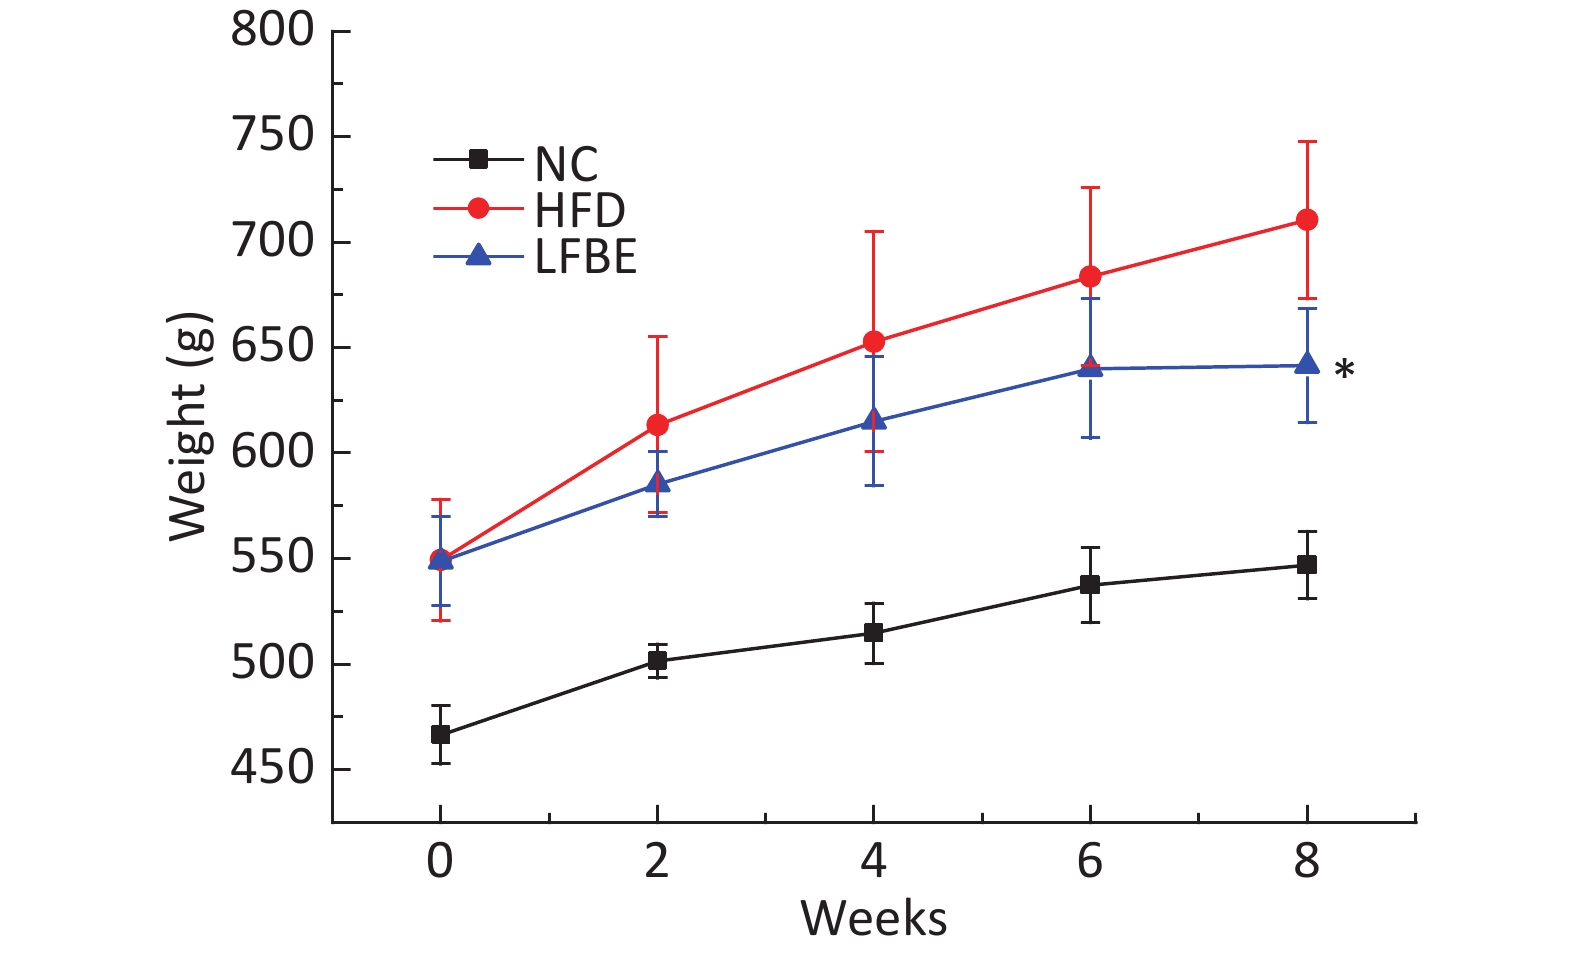
The main compositions of LFBE and RBE are included in Supplementary Table S1 (available in www.besjournal.com). Fermentation changes the components of the aqueous extracts of barley. To study the therapeutic effects of LFBE in obese rats, a diet-induced obesity model was first established. Seven-week-old male SD rats were maintained on HFD for 8 weeks to induce obesity. At the end of the treatment period, the HFD group had gained about 30% more body weight than the NC group (554.01 ± 17.19 g vs. 460.13 ± 15.90 g), indicating that the obesity model has been successfully established. The rats in the diet-induced obesity model were then divided into two groups (HFD group and LFBE group). Combined with our previous study, in which the treatment of 3T3-L1 and HepG2 cells with RBE had no effect on inhibition of adipogenesis (data not shown), and to focus solely on exploring the anti-obesity action and lipid metabolism effects of LFBE in HFD-induced obesity rats, an RBE group was not created. In addition, it was also clearly shown that L. plantarum dy-1 fermentation significantly improves the anti-obesity properties of barley[9]. At the end of the 8-week intervention period, the weight of the NC group was 546.83 ± 15.90 g and that of the rats in the HFD group was 710.50 ± 47.19 g (P < 0.05, as shown in Figure 1). Generally, high-fat diets significantly increase body weight and liver weight, which leads to obesity, hyperlipidemia, and fatty liver. It is worth noting that the group treated with LFBE had significantly lower body weights (641.50 ± 30.49 g) than the HFD group (P < 0.05), as can also be seen from the epididymal fat mass and abdominal fat mass. However, the food intake in all groups did not differ significantly during the experimental period (Table 1). As Table 1 also shows, the liver weight in the rats from the HFD group was statistically (P < 0.05) higher than that in the NC group. However, at the end of the study, the liver weight of the rats treated with LFBE was significantly (P < 0.05) lower than that of the HFD group. As for the kidneys, spleen, and pancreas, no significant differences were seen between the experimental groups. Moreover, body fat was higher in the HFD group (8.52 ± 1.44 g/100 g) than in the NC group (2.83 ± 0.48 g/100 g) but, interestingly, was lower in the LFBE group (6.87 ± 1.05 g/100 g) than in the HFD group (Table 1).
Component RBEa LFBEa Extraction ratio (g/100 g) 8.86 ± 0.48 14.51 ± 0.28 Proteinb (g/100 g) 13.94 ± 1.05 34.94 ± 1.51 Total sugar (g/100 g) 56.61 ± 2.34 34.35 ± 2.59 Total phenols (mg/g) 8.96 ± 0. 21 13.61 ± 0.15 β-glucan (g/100 g) 4.83 ± 0.43 13.44 ± 0.63 Gallic acid (mg/kg) 1.98 ± 0.08 8.30 ± 0.08 Coumaric acid (mg/kg) 5.39 ± 0.05 49.99 ± 0.51 Vanillic acid (mg/kg) 22.35 ± 0.21 117.99 ± 1.15 Caffeic acid (mg/kg) 2.27 ± 0.07 1.31 ± 0.02 Ferulic acid (mg/kg) 23.52 ± 0.07 112.79 ± 1.21 Note. aRBE: aqueous extract of unfermented raw barley; LFBE: aqueous extract of fermented barley with Lactobacillus plantarum dy-1; all samples were freeze-dried into a powder. bConversion factor used to calculate protein: N = 5.83. The results are expressed as the mean (± SD), n = 3. Table S1. Macronutrient and selected micronutrient content of RBE and LFBE (dry-weight)

Figure 1. Effect of LFBE on preventing increase in body weight in rats with HFD-induced obesity. Mean weekly body weight in obese rats from different groups. NC group consisted of normal rats treated with distilled water (4 mL/kg body weight) through gavage administration and fed with control diet. HFD group consisted of diet-induced obesity rats treated with distilled water (4 mL/kg body weight) through gavage administration and fed with HFD. LFBE group consisted of diet-induced obese rats treated with LFBE (1 g/kg body weight) through gavage administration and fed with HFD. During the 8-week treatment, body weight was measured every 2 weeks. Values are expressed as means ± SEM, n = 8 per group. *Significant difference between LFBE group and HFD group (P < 0.05).
Variables NC group HFD group LFBE Food intake (g/d) 27.66 ± 1.83a 28.84 ± 1.98a 28.12 ± 1.48a Fat mass (g) 15.51 ± 1.75c 59.10 ± 6.78a 29.86 ± 3.56b Epididymal fat mass (g) 6.05 ± 0.79c 18.52 ± 2.15a 12.48 ± 1.44b Abdominal fat mass (g) 8.70 ± 0.92c 39.61 ± 4.46a 26.82 ± 2.06b Serum TG (mmol/L) 1.06 ± 0.32c 3.31 ± 0.89a 1.96 ± 0.25b TC (mmol/L) 1.30 ± 0.11b 1.68 ± 0.14a 1.29 ± 0.20b HDL-C (mmol/L) 1.12 ± 0.15a 0.87 ± 0.14b 1.02 ± 0.14ab LDL-C (mmol/L) 0.27 ± 0.05a 0.14 ± 0.06b 0.19 ± 0.06ab Insulin (mIU/L) 17.66 ± 0.82b 21.17 ± 0.89a 18.30 ± 0.67b Liver TG (mmol/gprot) 0.90 ± 0.08c 2.26 ± 0.32a 1.49 ± 0.14b TC (mmol/gprot) 0.42 ± 0.09b 0.67 ± 0.02a 0.42 ± 0.07b HDL-C (mmol/gprot) 1.65 ± 0.06a 0.85 ± 0.04b 1.52 ± 0.07a LDL-C (mmol/gprot) 0.44 ± 0.09c 0.92 ± 0.03a 0.65 ± 0.05b Relative size (g/100 g body weight) Liver 2.49 ± 0.09c 3.02 ± 0.22a 2.68 ± 0.07b Spleen 0.16 ± 0.01a 0.14 ± 0.01a 0.15 ± 0.02a Kidney 0.50 ± 0.03a 0.45 ± 0.02a 0.47 ± 0.04a Pancreas 0.10 ± 0.02a 0.08 ± 0.01a 0.09 ± 0.02a Body fat 2.83 ± 0.48c 8.52 ± 1.44a 6.87 ± 1.05b Epididymal fat 1.12 ± 0.35c 2.60 ± 0.41a 2.10 ± 0.32b Abdominal fat 1.61 ± 0.28c 5.57 ± 0.87a 4.22 ± 0.65b Note. NC: group consisted of normal rats treated with distilled water (4 mL/kg body weight) through gavage administration and fed with control diet; HFD: group consisted of diet-induced obese rats treated with distilled water (4 mL/kg body weight) through gavage administration and fed with HFD; LFBE: group consisted of diet-induced obesity rats treated with LFBE (1 g/kg body weight) through gavage administration and fed with HFD. Values are means ± SEM. n = 8. Different superscript letters indicate a significant difference (P < 0.05). Table 1. Serum, liver lipid contents, and relative size of viscera and total fat of three groups of rats
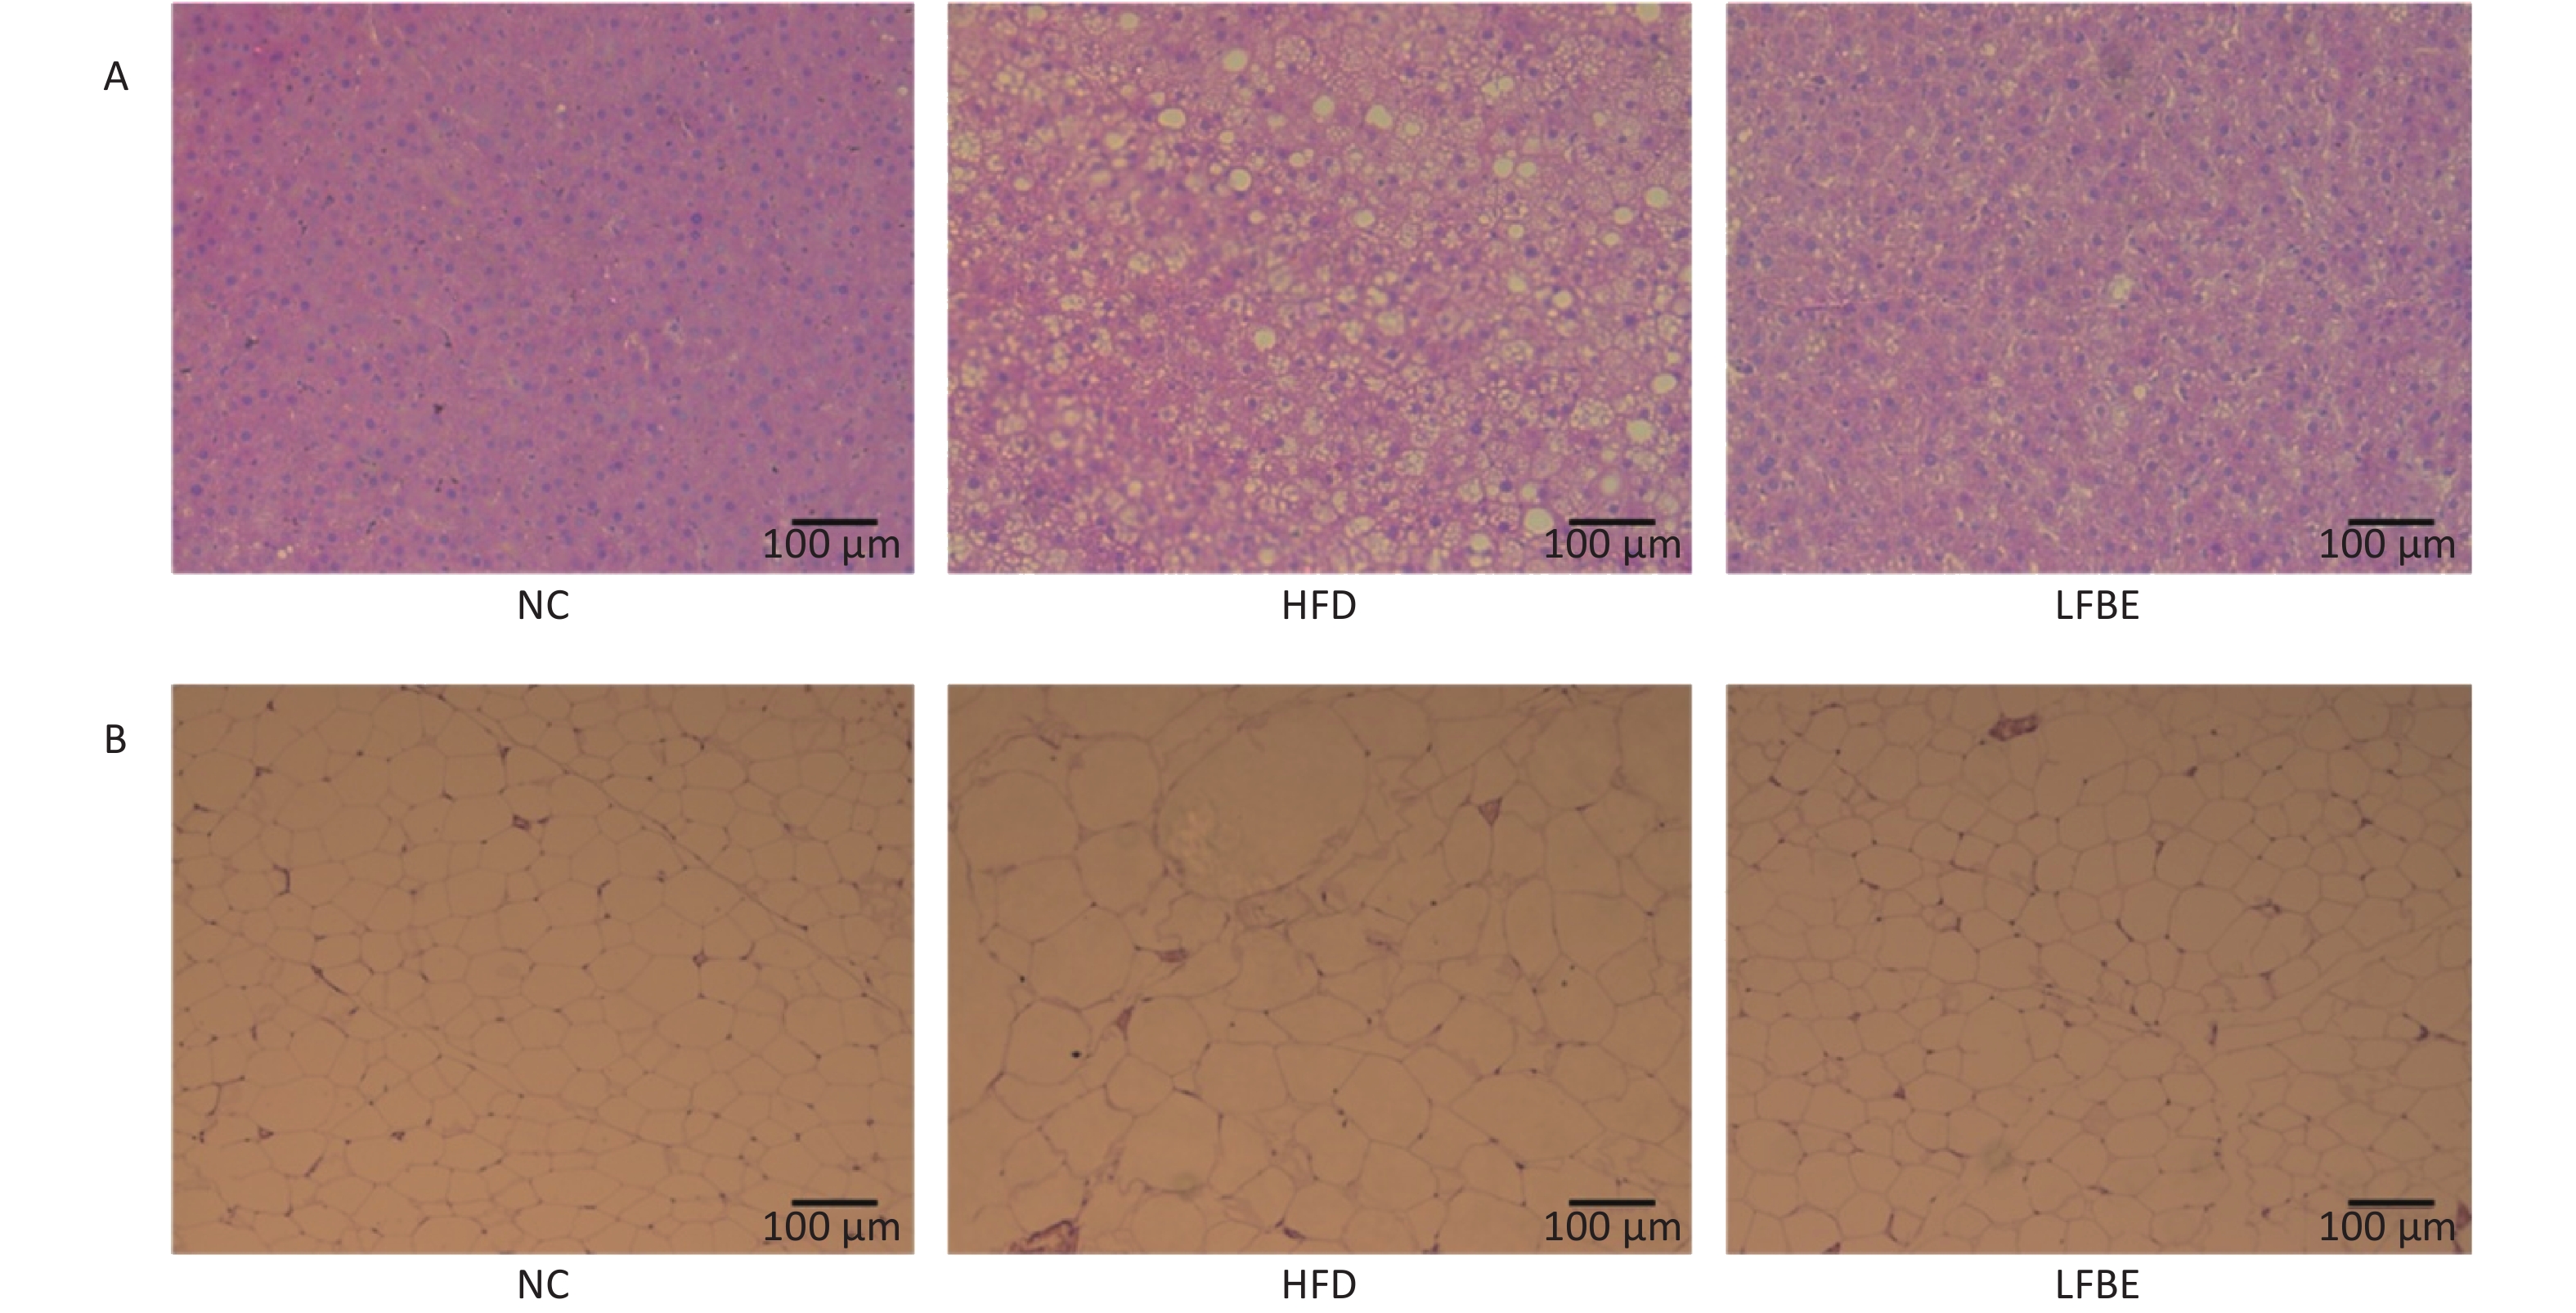
The adipocytes in the LFBE-treated group were also smaller than those in the HFD group (Figure 2A). Furthermore, hepatic steatosis induced by obesity was greatly alleviated in the LFBE-treated group, as shown by H&E staining (Figure 2B). Therefore, we speculate that in addition to its inhibition of diet-induced weight gain, LFBE may reduce the increase in liver size and fat mass by modulation of lipid homeostasis.
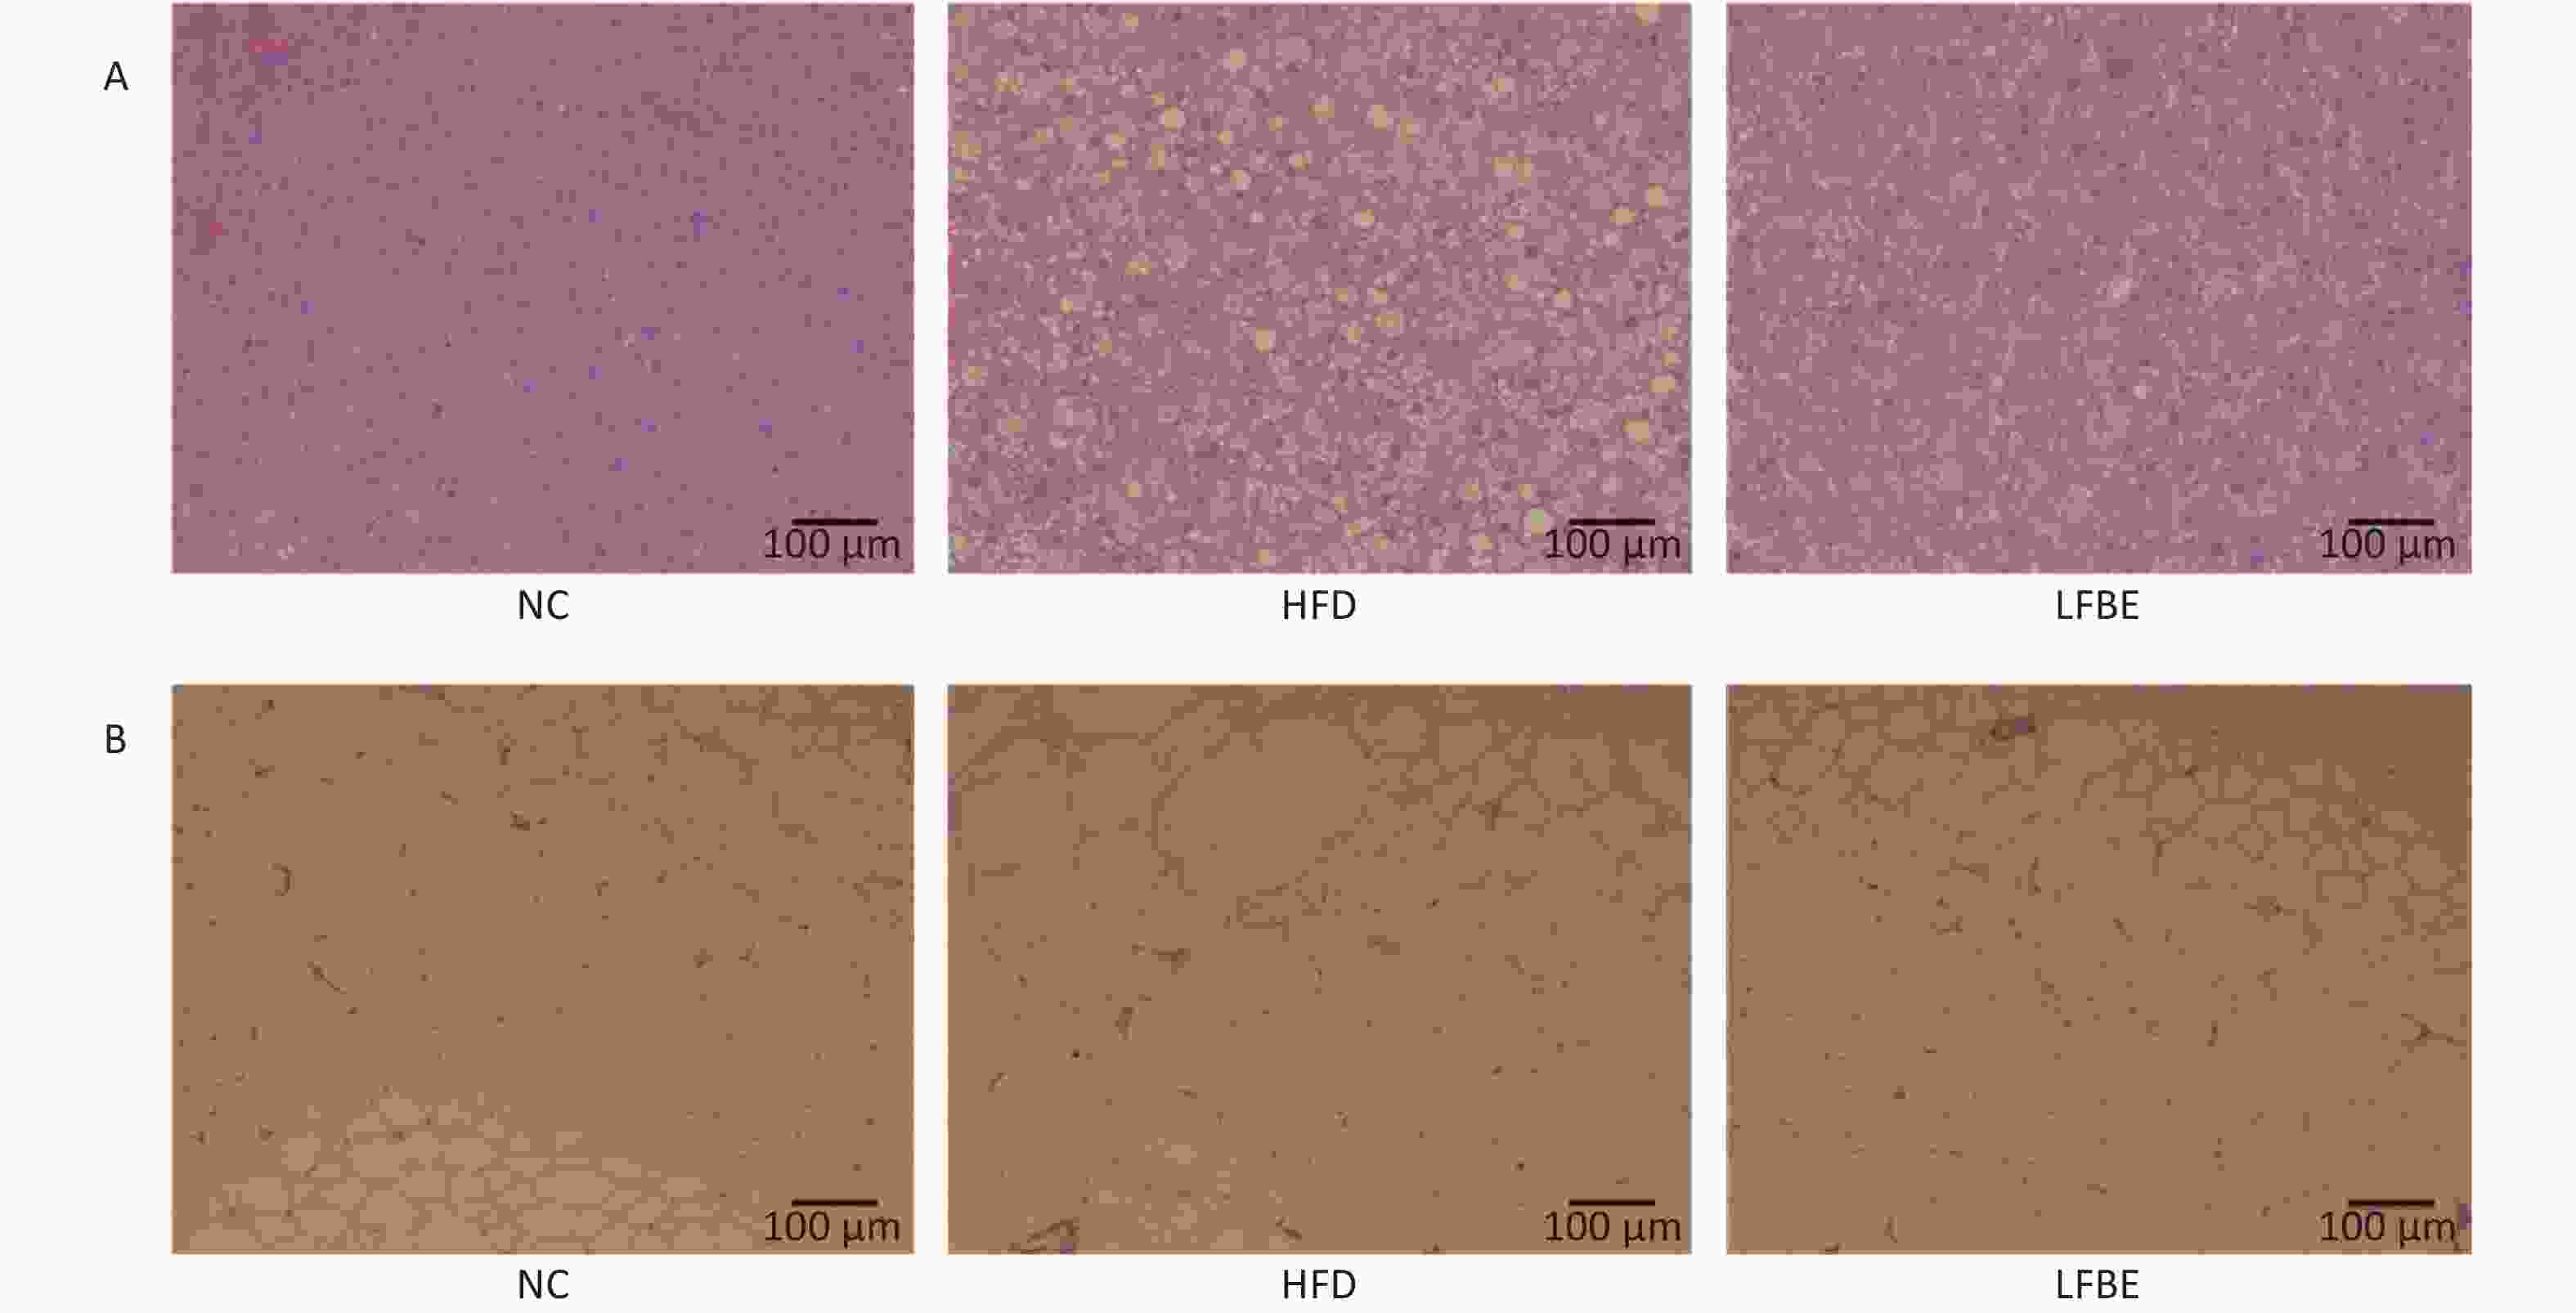
Figure 2. LFBE prevents obesity in diet-induced obese SD rats. (A) Representative H&E sections of epididymal fat tissues and (B) livers from HFD-fed rats. Fat cells from epididymal fat tissues in LFBE were smaller in size than those of control HFD-fed rats as shown by H&E staining (scale bar = 100 μm). Accumulation of lipid in the liver reduced following LFBE treatment (scale bar = 100 μm). NC group consisted of normal rats treated with distilled water (4 mL/kg body weight) through gavage administration and fed with control diet. HFD group consisted of diet-induced obese rats treated with distilled water (4 mL/kg body weight) through gavage administration and fed with HFD. LFBE group consisted of diet-induced obese rats treated with LFBE (1 g/kg body weight) through gavage administration and fed with HFD.
-
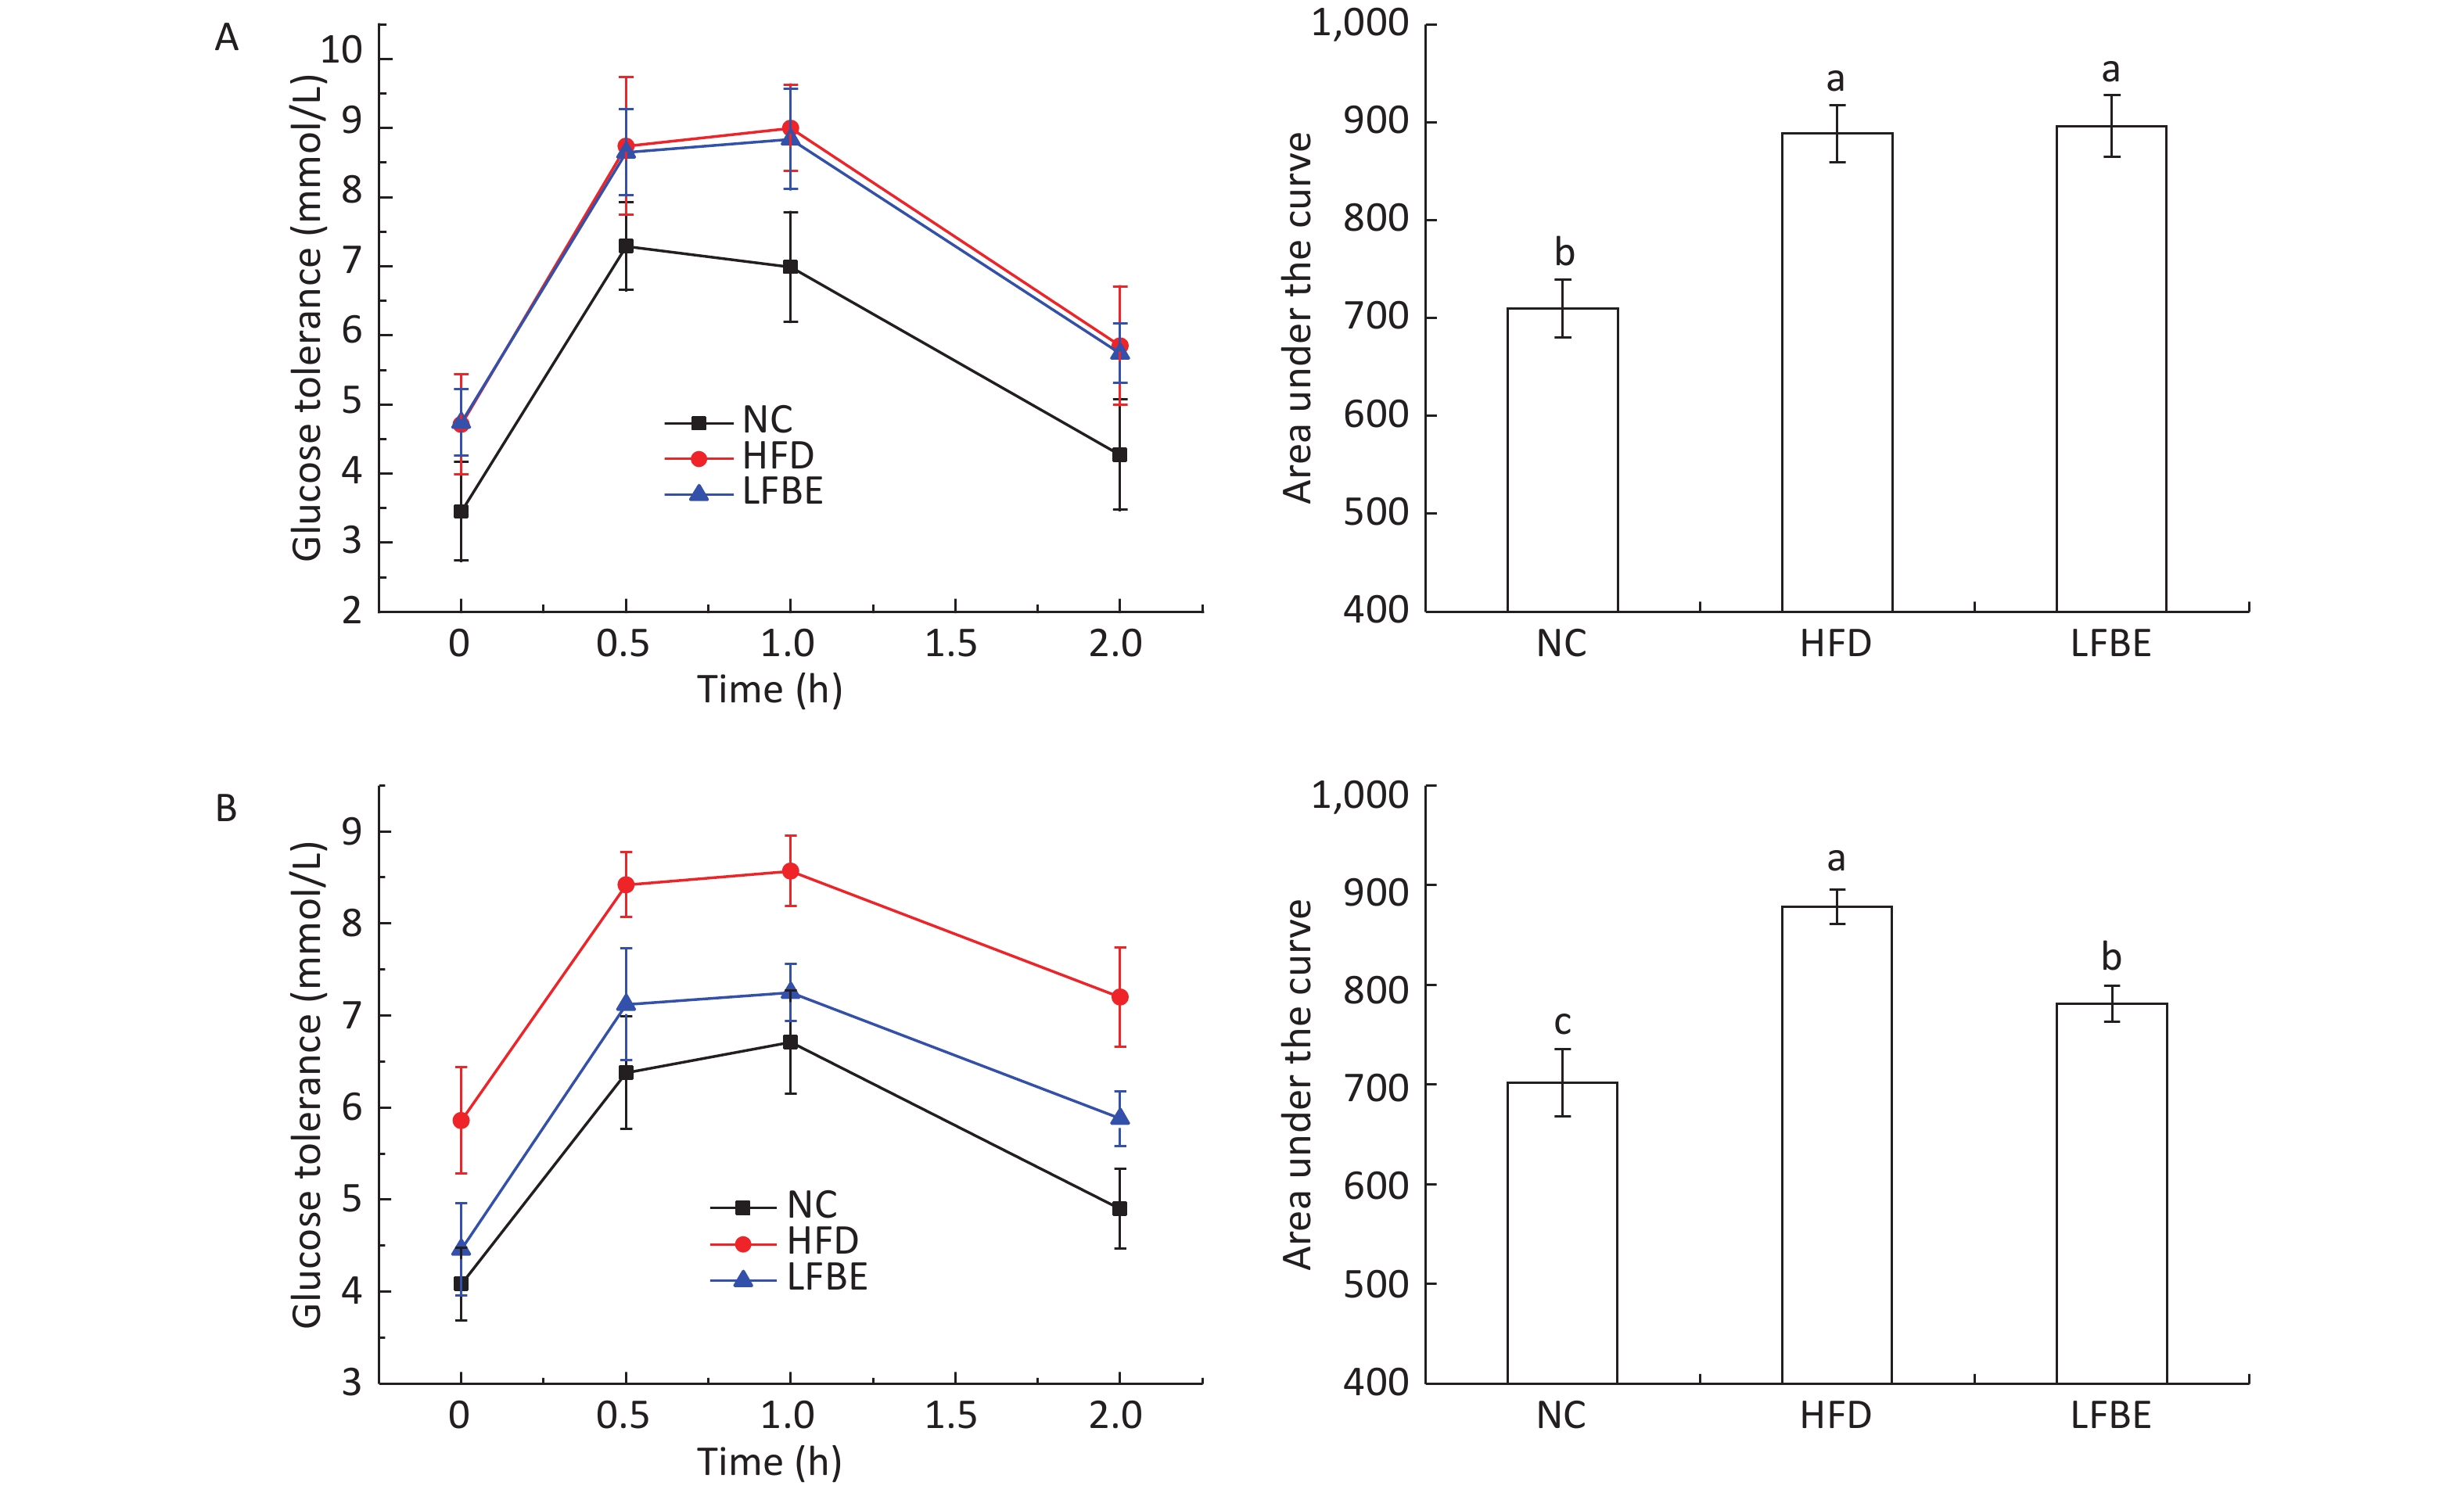
Glucose content is an important indicator of tissue and cells in obesity models. With the aim to assess the effect of oral administration of LFBE on systemic glucose homeostasis, we performed an oral glucose tolerance test (OGTT) in conscious fasted rats. Figure 3 presents the effect of LFBE on OGTT levels. At the beginning of the study, the rats in the HFD and LFBE groups started with similar oral glucose tolerance. The area under the curve for glucose during the OGTT was 710 ± 29 mmol·min/mL in the NC group, 888 ± 29 mmol·min/mL in the HFD group, and 895 ± 31 mmol·min/mL in the LFBE group (Figure 3).
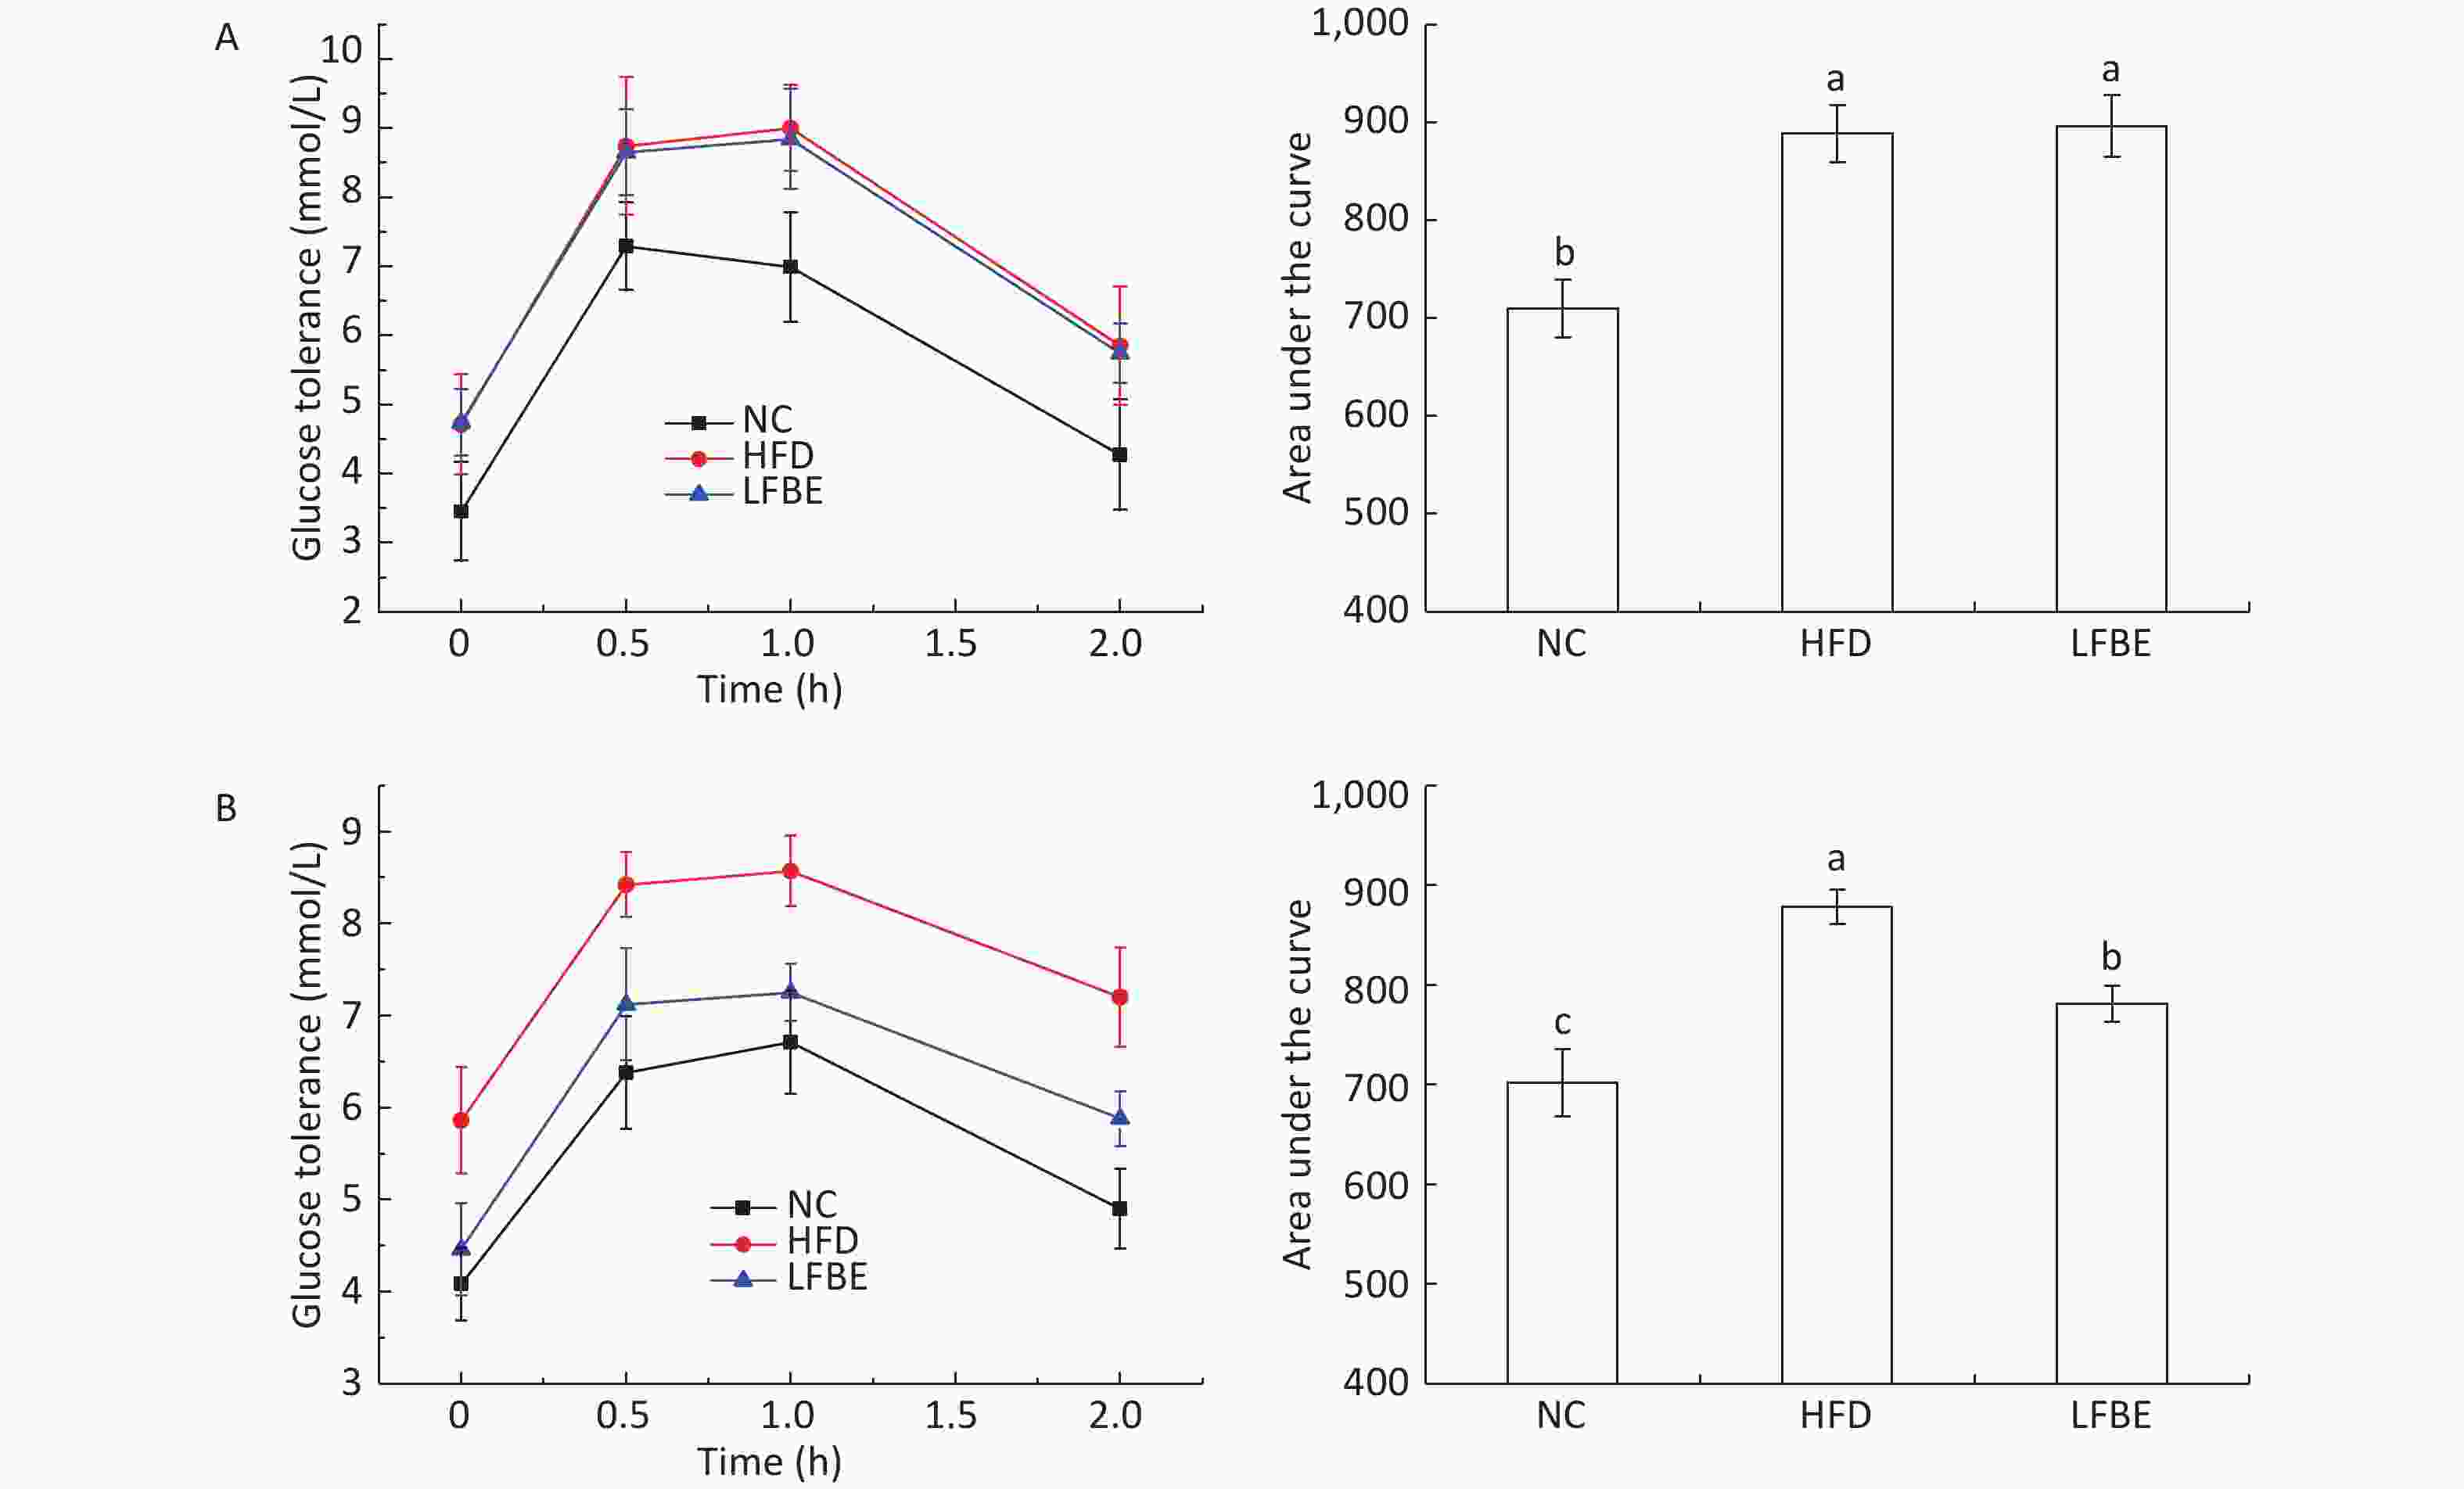
Figure 3. (A) Results of OGTT before supplementation with LFBE. No significant differences in the area under the curve (AUC) of OGTT was observed in the HFD and LFBE treated groups. (B) Results of OGTT supplementation with LFBE for 8 weeks. Significant differences in the area under the curve (AUC) of oral glucose tolerance was seen in the HFD and LFBE treated groups. NC group consisted of normal rats treated with distilled water (4 mL/kg body weight) through gavage administration and fed with control diet. HFD group consisted of diet-induced obese rats treated with distilled water (4 mL/kg body weight) through gavage administration and fed with HFD. LFBE group consisted of diet-induced obese rats treated with LFBE (1 g/kg body weight) through gavage administration and fed with HFD. Data are means ± SEM, n = 8 per group. Data were analyzed by analysis of variance (ANOVA) with different letters (a, b, c) indicating a significant difference (P < 0.05).
After treatment with LFBE for 8 weeks, the serum glucose levels at 0, 30, 60, and 120 min in the HFD group were higher than those in NC group (P < 0.05). The serum glucose levels at 0, 30, 60, and 120 min in the LFBE group were lower than those in the HFD group (Figure 3). The area under the curve for glucose during the OGTT was 701 ± 34 mmol·min/mL in NC group, 878 ± 17 mmol·min/mL in the HFD group, and 781 ± 17 mmol·min/mL in the LFBE group. From these results, we can conclude that oral glucose tolerance of the LFBE rats showed improvement.
-
Because obesity has a positive association with higher serum glucose levels and increased lipid contents, we measured levels of TC, TG, HDL-C, and LDL-C in serum and liver. The serum lipid profile is an important metabolic variable altered in obesity.
The mean changes in TG, TC, HDL-C, LDL-C, and insulin in the different treatment groups are shown in Table 1. There was a tendency toward higher serum and liver TG levels in the HFD group than in the NC group, whereas gavage of LFBE could reduce them. Significantly increased (P < 0.05) levels of serum and liver TC were observed in the HFD-fed rats, but gavage of LFBE significantly decreased (P < 0.05) these levels to values similar to those in the NC group. The HFD group showed a significant reduction in serum HDL-C (P < 0.05) compared with the NC group, and although the difference in serum HDL-C levels between the LFBE and NC groups was not significant (P > 0.05), there was a tendency toward a higher serum HDL-C level in the LFBE group. The HFD group showed a significant increase in serum LDL-C (P < 0.05) compared with the NC group, and although there were no significant differences (P > 0.05) in serum LDL-C levels between the LFBE and control groups, there was a tendency toward a lower serum LDL-C level in the LFBE group. A significantly reduced (P < 0.05) level of liver HDL-C was observed in the HFD group, but gavage with LFBE significantly increased (P < 0.05) this level to values similar to that in the NC group. A significantly increased (P < 0.05) level of liver LDL-C was observed in the HFD group, but gavage with LFBE significantly decreased (P < 0.05) this level similar to that in the NC group. At week 8, the serum levels of insulin were significantly greater in the HFD group (21.17 ± 0.89 mIU/L) than in the NC group (17.66 ± 0.82 mIU/L). After being treated with LFBE for 8 weeks, the LFBE group (18.30 ± 0.67 mIU/L) showed a significant reduction in serum insulin compared with the HFD group.
-
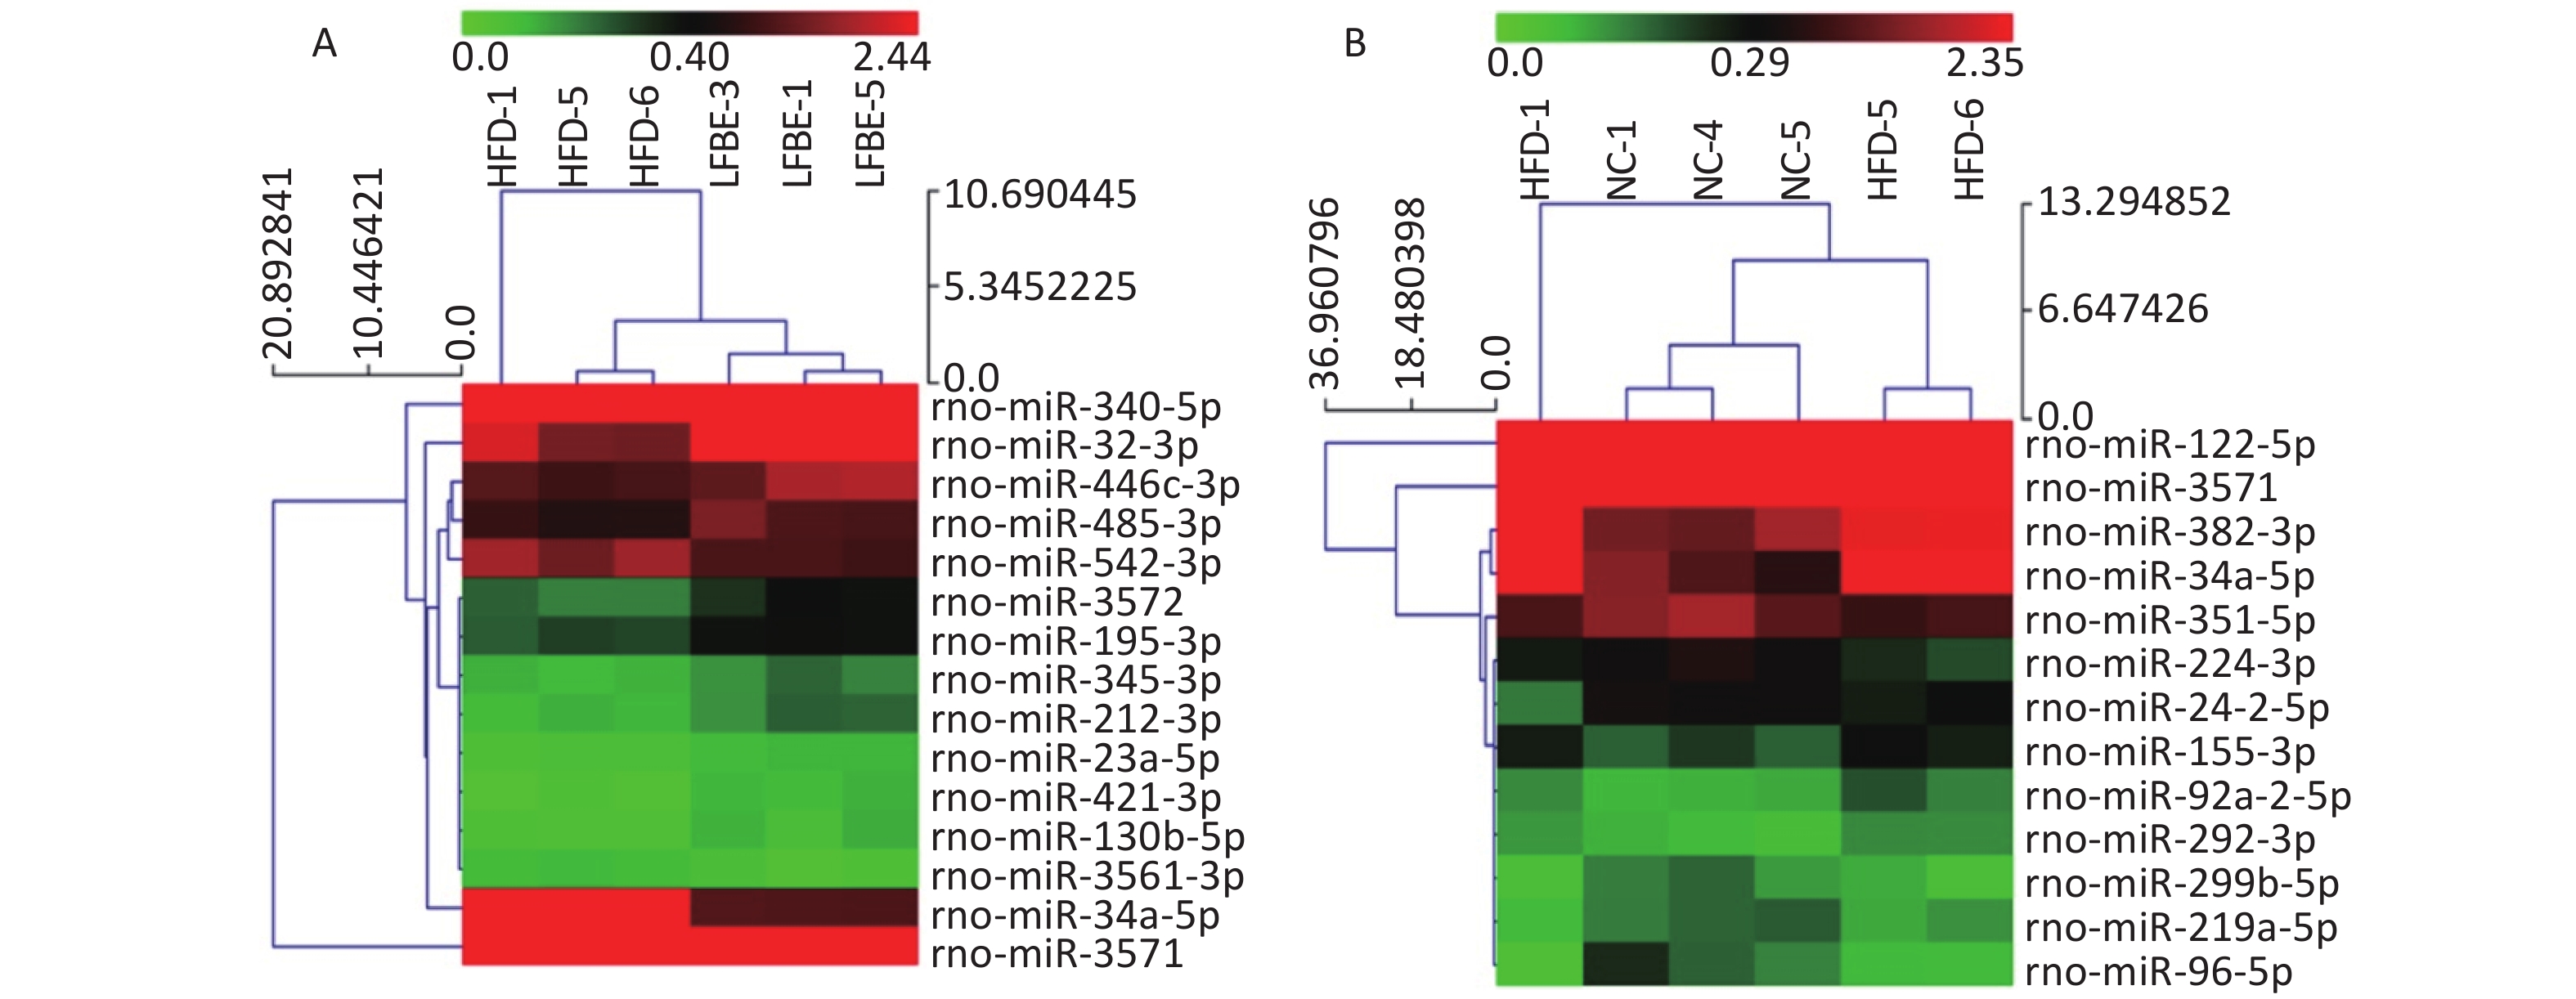
To identify miRNAs associated with the anti-obesity action of LFBE, miRNAs with at least a 1.5-fold change in expression were selected. Subsequent to data processing and analysis, specific miRNAs were identified to be differentially expressed. Ten miRNAs (miR-23a-5p, miR-466c-3p, miR-345-3p, miR-421-3p, miR-212-3p, miR-3572, miR-195-3p, miR-32-3p, miR-130b-5p, and miR-485-3p) were upregulated and five miRNAs (miR-340-5p, miR-542-3p, miR-3561-3p, miR-34a-5p, and miR-3571) were downregulated in the LFBE group compared with the HFD group (Figure 4A). In addition, seven miRNAs (miR-92a-2-5p, miR-292-3p, miR-382-3p, miR-155-3p, miR-122-5p, miR-3571, and miR-34a-5p) were increased and 11 miRNAs (miR-351-5p, miR-210-3p, miR-299b-5p, miR-224-3p, miR-219a-5p, miR-24-2-5p, miR-32-5p, miR-96-5p, miR-33-3p, miR-338-3p, and miR-143-3p) were decreased in the HFD group compared with the NC group (Figure 4B).
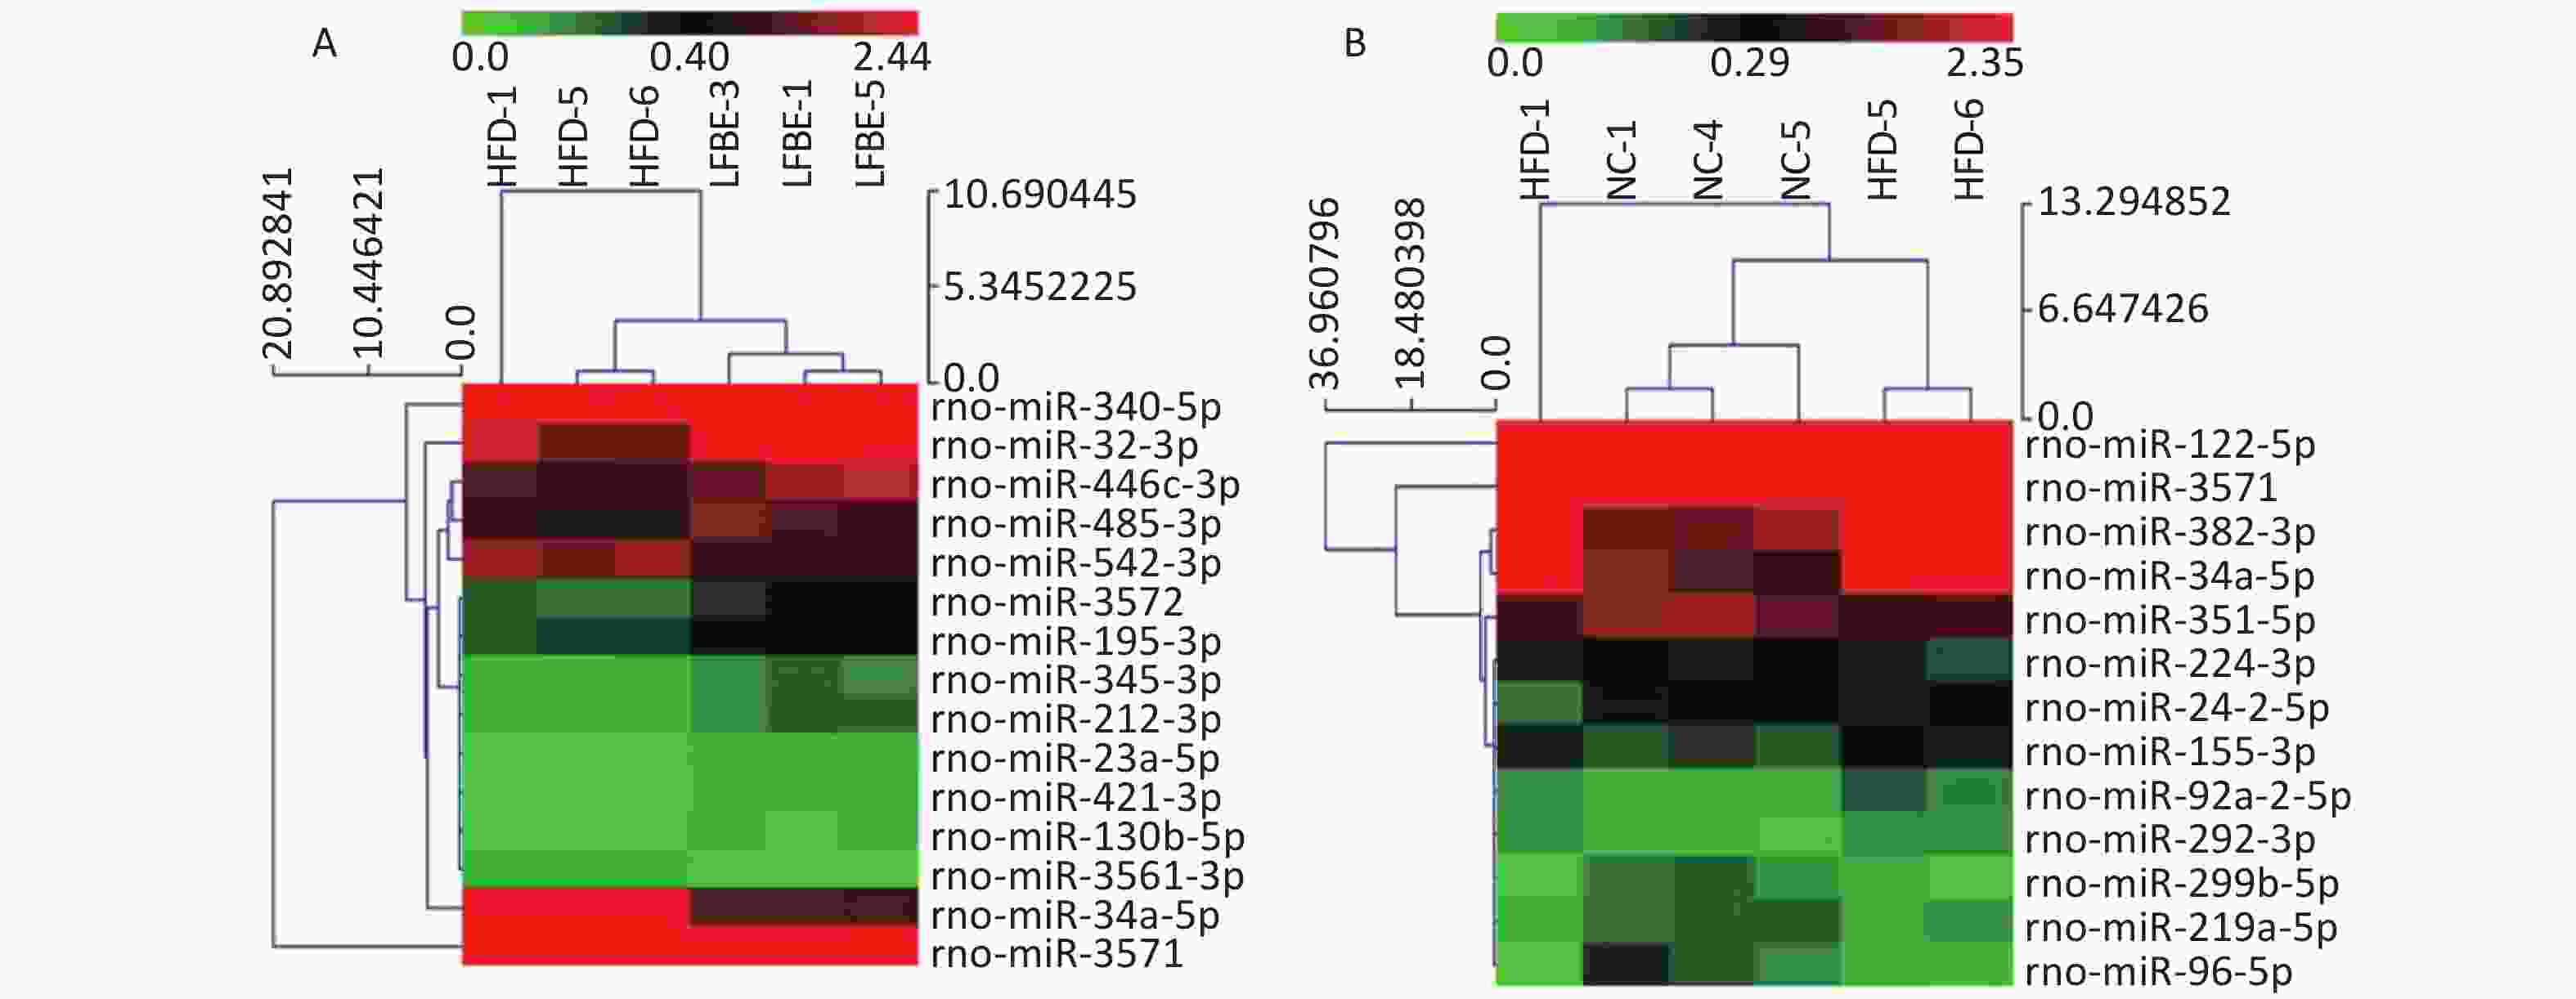
Figure 4. Hierarchical cluster analysis of miRNAs in livers of (A) LFBE rats and (B) NC rats vs. HFD rats (n = 8). Red indicates high relative expression and green indicates low relative expression. miRNAs with expression fold change > 1.5 and with FDR < 0.05 were considered statistically significant. NC group consisted of normal rats treated with distilled water (4 mL/kg body weight) through gavage administration and fed with control diet. HFD group consisted of diet-induced obese rats treated with distilled water (4 mL/kg body weight) through gavage administration and fed with HFD. LFBE group consisted of diet-induced obese rats treated with LFBE (1 g/kg body weight) through gavage administration and fed with HFD.
-
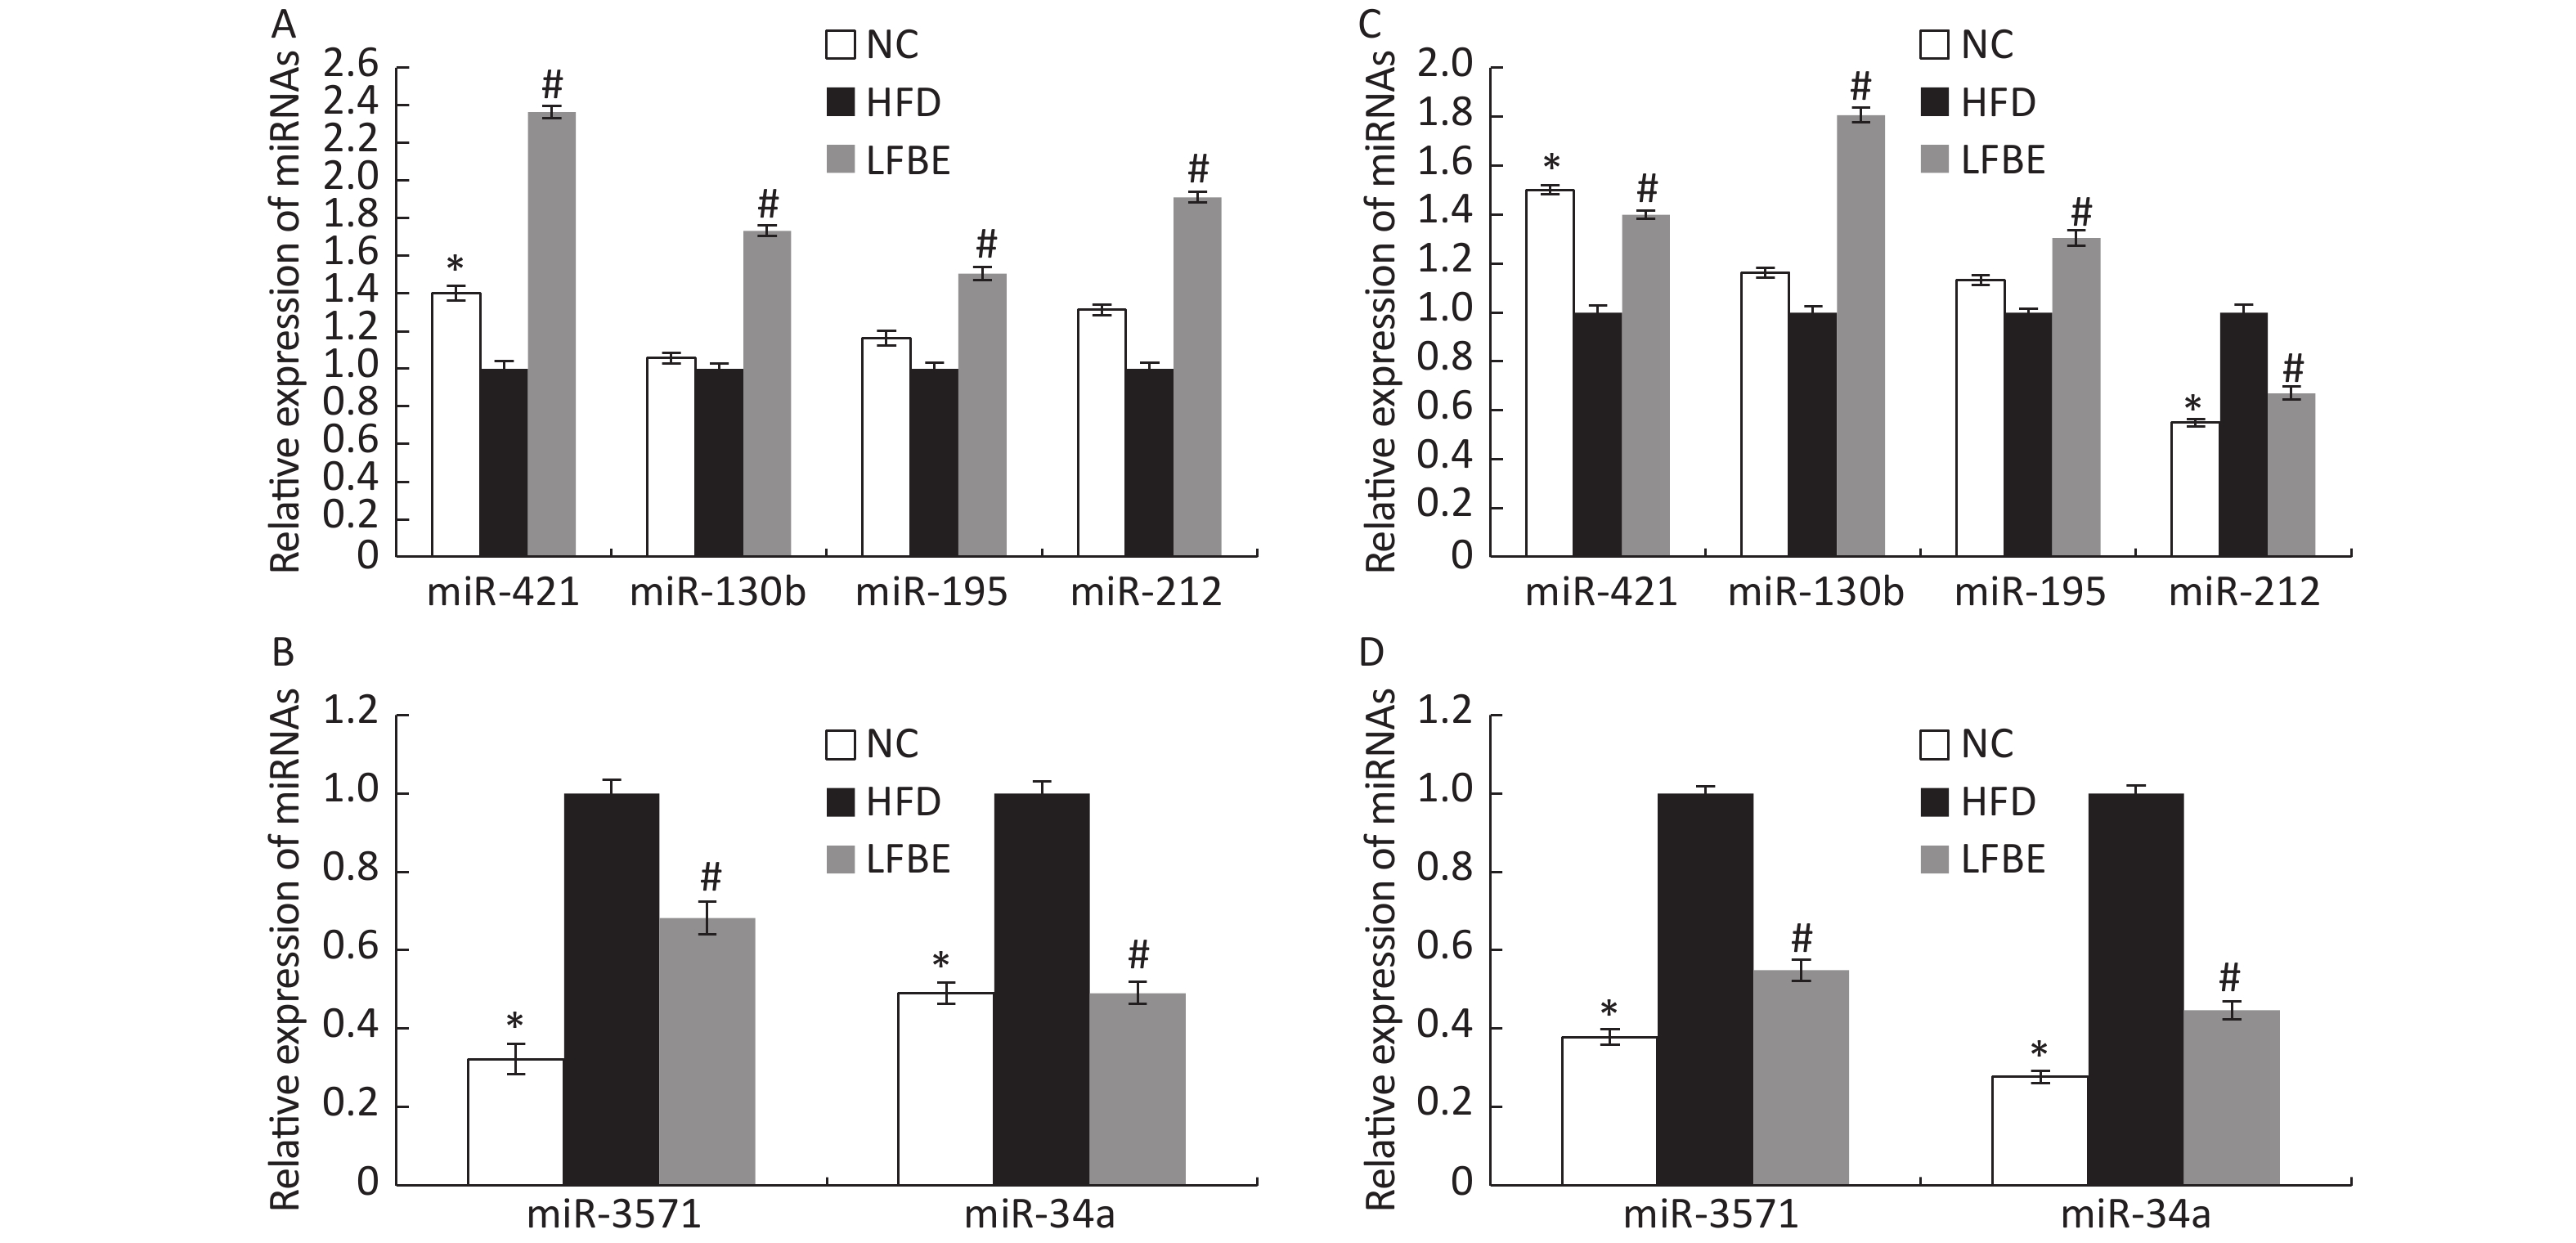
To confirm the trends observed in microarray assays, six miRNAs (miR-3571, miR-34a-5p, miR-421-3p, miR-130b-5p, miR-195-3p, and miR-212-3p) from the LFBE group were randomly selected for further validation using RT-qPCR, as compared to the HFD group. Three of the six selected miRNAs (miR-421-3p, miR-130b-5p, and miR-195-3p) were increased in the LFBE group compared with the HFD group (Figure 5A). Three of the six selected miRNAs (miR-3571, miR-212-3p, and miR-34a-5p) were significantly downregulated in the LFBE group compared with the HFD group (Figure 5B) and in the NC group compared with the HFD group (P < 0.05). The results were generally consistent with the microarray data (Figure 5C, D). Interestingly, miR-212-3p was downregulated in both the LFBE group and NC group compared with the HFD group (Figure 5A). However, this trend was opposite to that observed in the microarray data.
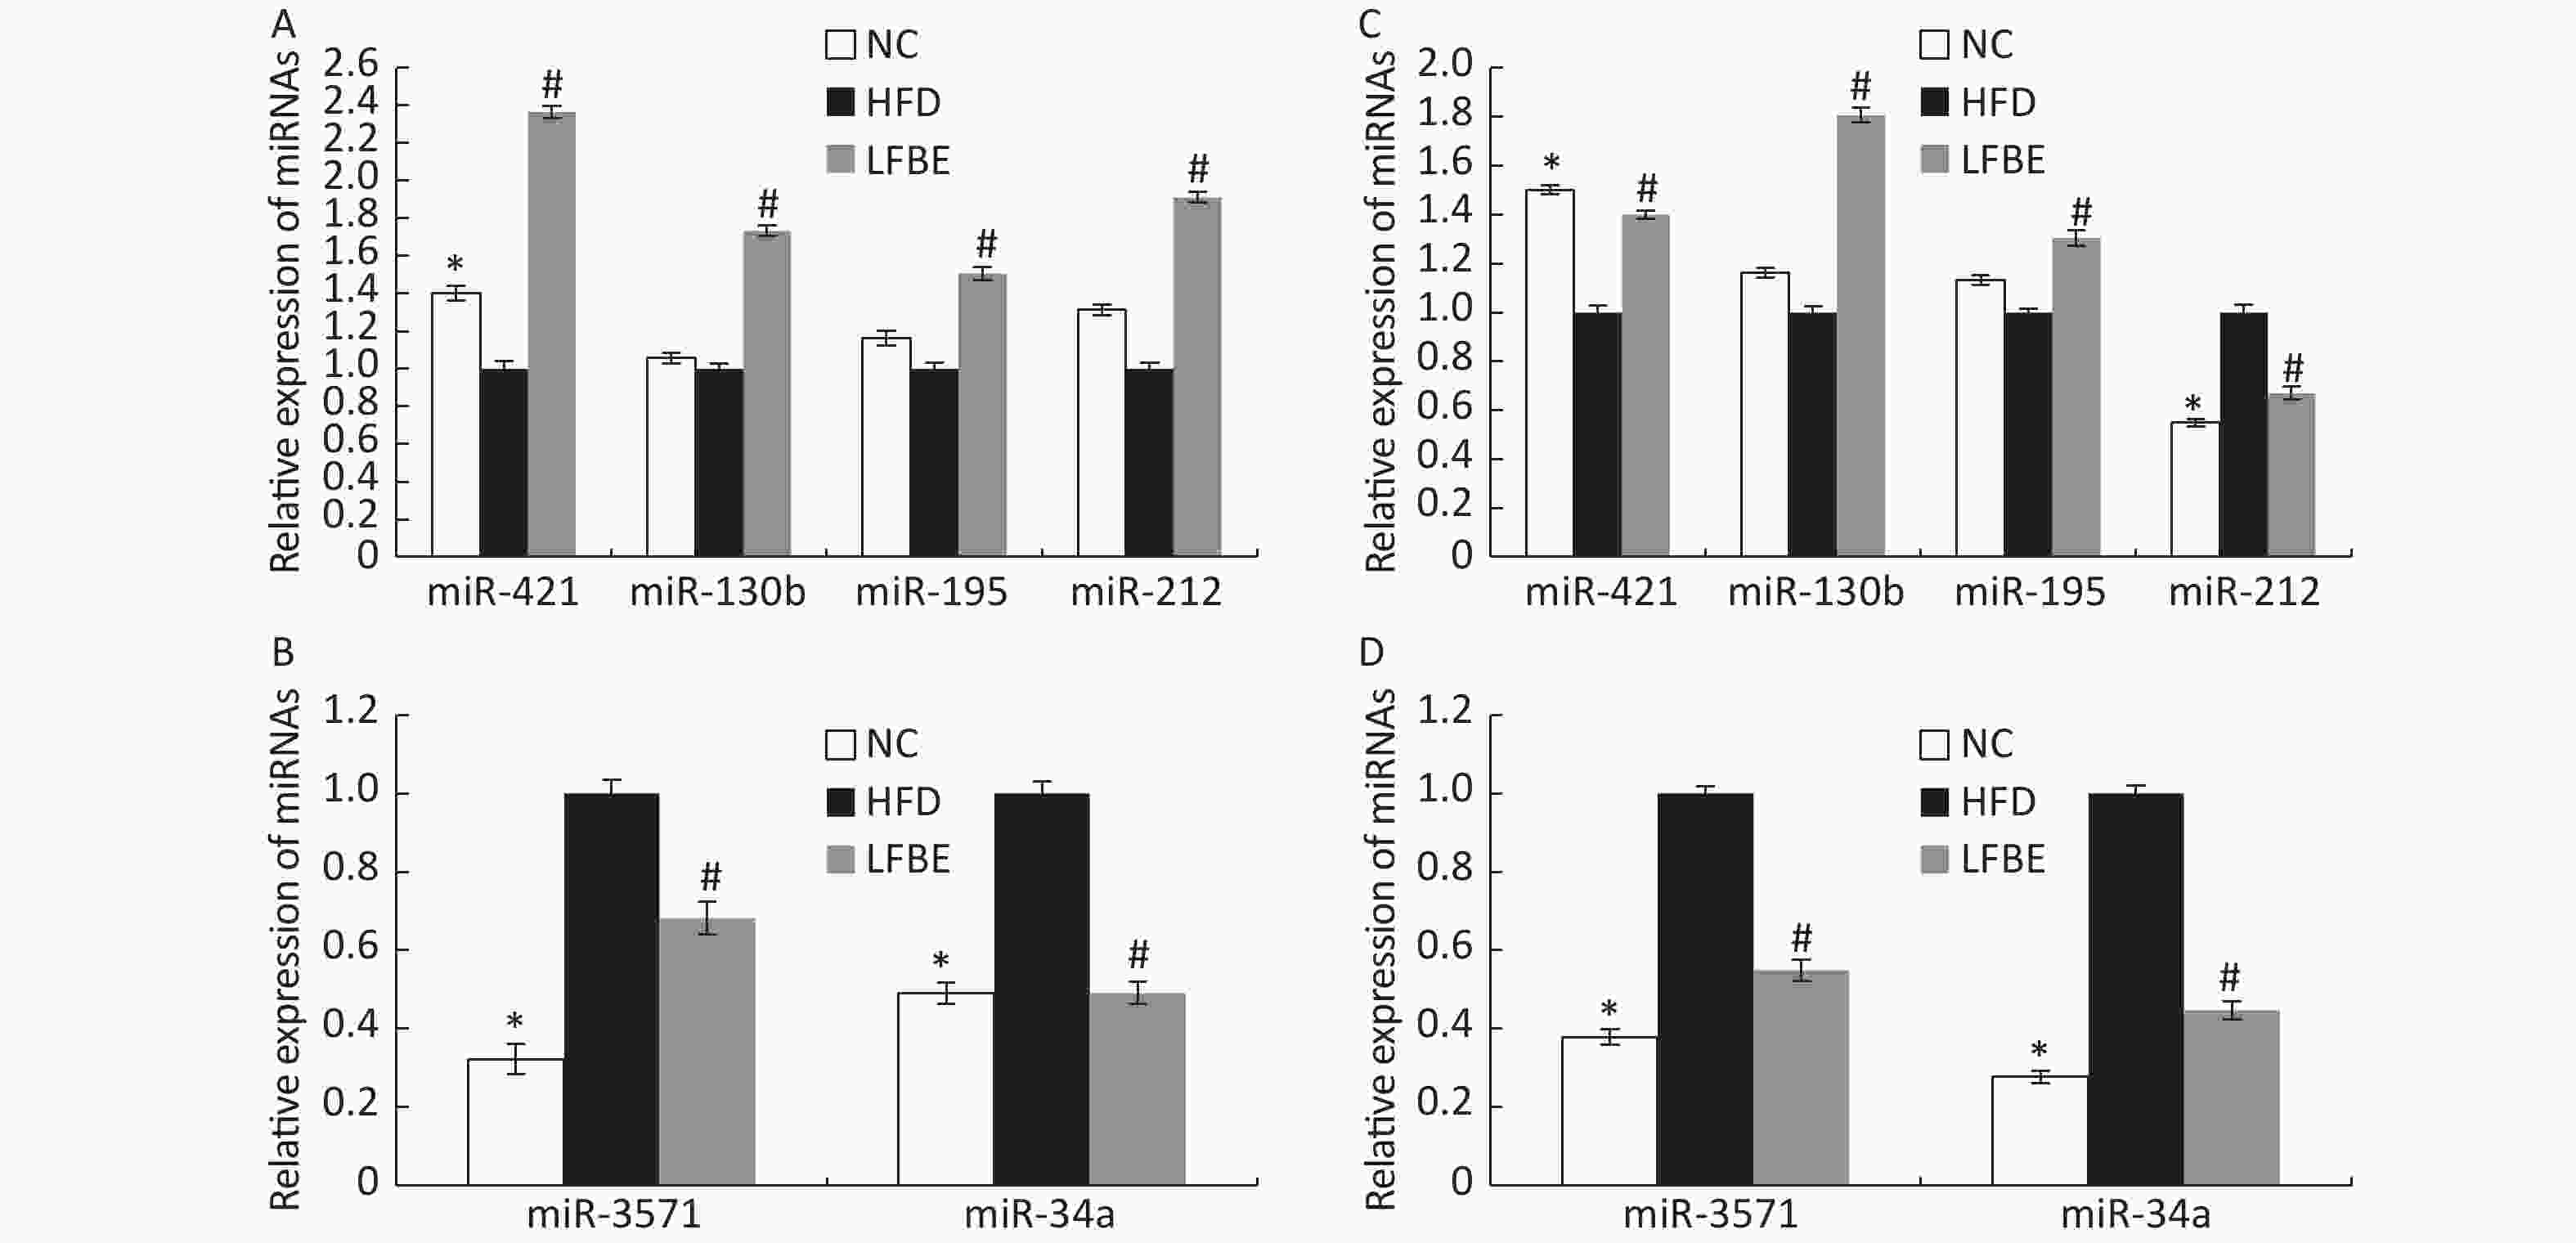
Figure 5. Validation of microarray data by real-time qRT-PCR. (A, B): Real-time qRT-PCR analysis of differentially expressed miRNAs in liver tissue. (C, D): Expression fold changes in the validated miRNAs by SAM algorithm in microarray analysis from NC and LFBE rats compared with HFD rats. Triplicate assays were carried out for each RNA sample, and the relative amount of each miRNA was normalized to U6 miRNA. NC group consisted of normal rats treated with distilled water (4 mL/kg body weight) through gavage administration and fed with control diet. HFD group consisted of diet-induced obese rats treated with distilled water (4 mL/kg body weight) through gavage administration and fed with HFD. LFBE group consisted of diet-induced obese rats treated with LFBE (1 g/kg body weight) through gavage administration and fed with HFD. *Significant difference between NC group and HFD group (P < 0.05), #Significant difference between LFBE group and HFD group (P < 0.05)
-
To further verify the results from the animal experiments, HepG2 cells were selected for in vitro assays for checking the glucose consumption and TG content. As can be seen from Table 2, LFBE treatment showed significant enhancement of glucose consumption in a dose-dependent manner in HepG2 cells. In addition, treatment of cells with LFBE (50 to 100 μg/mL) and RBE (50 to 200 μg/mL) did not result in toxicity except at high concentrations of LFBE (200 μg/mL), which inhibited HepG2 cell growth (data not shown). However, RBE hardly increased the glucose consumption at any of the tested concentrations. As can be seen from Table 3, miR-212 inhibitor and miR-34a inhibitor showed significant enhancement of glucose consumption in HepG2 cells.
Concentration (μg/mL) Glucose consumption (mmol/L) TG contents (%) Control 2.64 ± 0.24** 100.00 ± 1.41** Model 1.26 ± 0.25 135.97 ± 3.25 LFBE 200 2.02 ± 0.81** 104.05 ± 2.15** 100 2.51 ± 0.36** 106.21 ± 2.31** 50 2.18 ± 0.17** 112.63 ± 3.57** RBE 200 1.42 ± 0.26 129.45 ± 4.29 100 1.34 ± 0.22 130.58 ± 3.25 50 1.23 ± 0.13 132.85 ± 2.43 Note. Data are presented as mean ± SD (n = 3). *P < 0.05, **P < 0.01, compared to model. RBE: aqueous extract of unfermented raw barley; LFBE: aqueous extract of fermented barley with Lactobacillus plantarum dy-1; Control: normal cells without PA treatment; Model: HepG2 cells treated with PA. Table 2. Effect of LFBE and RBE on glucose consumption and relative TG contents after 24 h treatment of HepG2 cells
Concentration (nmol/L) Glucose consumption (mmol/L) TG contents (%) Control 3.05 ± 0.22** 100.00 ± 1.41** Model 1.68 ± 0.15 135.97 ± 3.25 miR-212 mimic 1.71 ± 0.23 147.89 ± 4.14 miR-212 inhibitor 2.95 ± 0.14** 107.14 ± 2.88** miR-34a mimic 1.52 ± 0.13 153.45 ± 4.89 miR-34a inhibitor 2.88 ± 0.24** 102.85 ± 1.73** Note. Data are presented as mean ± SD (n = 3). **P < 0.01, compared to model. Control: normal cells without PA treatment; Model: HepG2 cells treated with PA. Table 3. Effect of miR-212 and miR-34a on glucose consumption and relative TG contents after 24 h treatment of HepG2 cells
Dietary fat and free fatty acids are known to enhance hepatic glucose production and the accumulation of TG within lipid droplets in hepatocytes. LFBE treatment in concentrations of 50 to 100 μg/mL significantly reduced the accumulation of TG in PA-induced HepG2 cells (Table 2). However, RBE hardly reduced the TG contents at any of the tested concentrations. miR-212 inhibitor and miR-34a inhibitor significantly reduced the accumulation of TG in PA-induced HepG2 cells (Table 3).
-
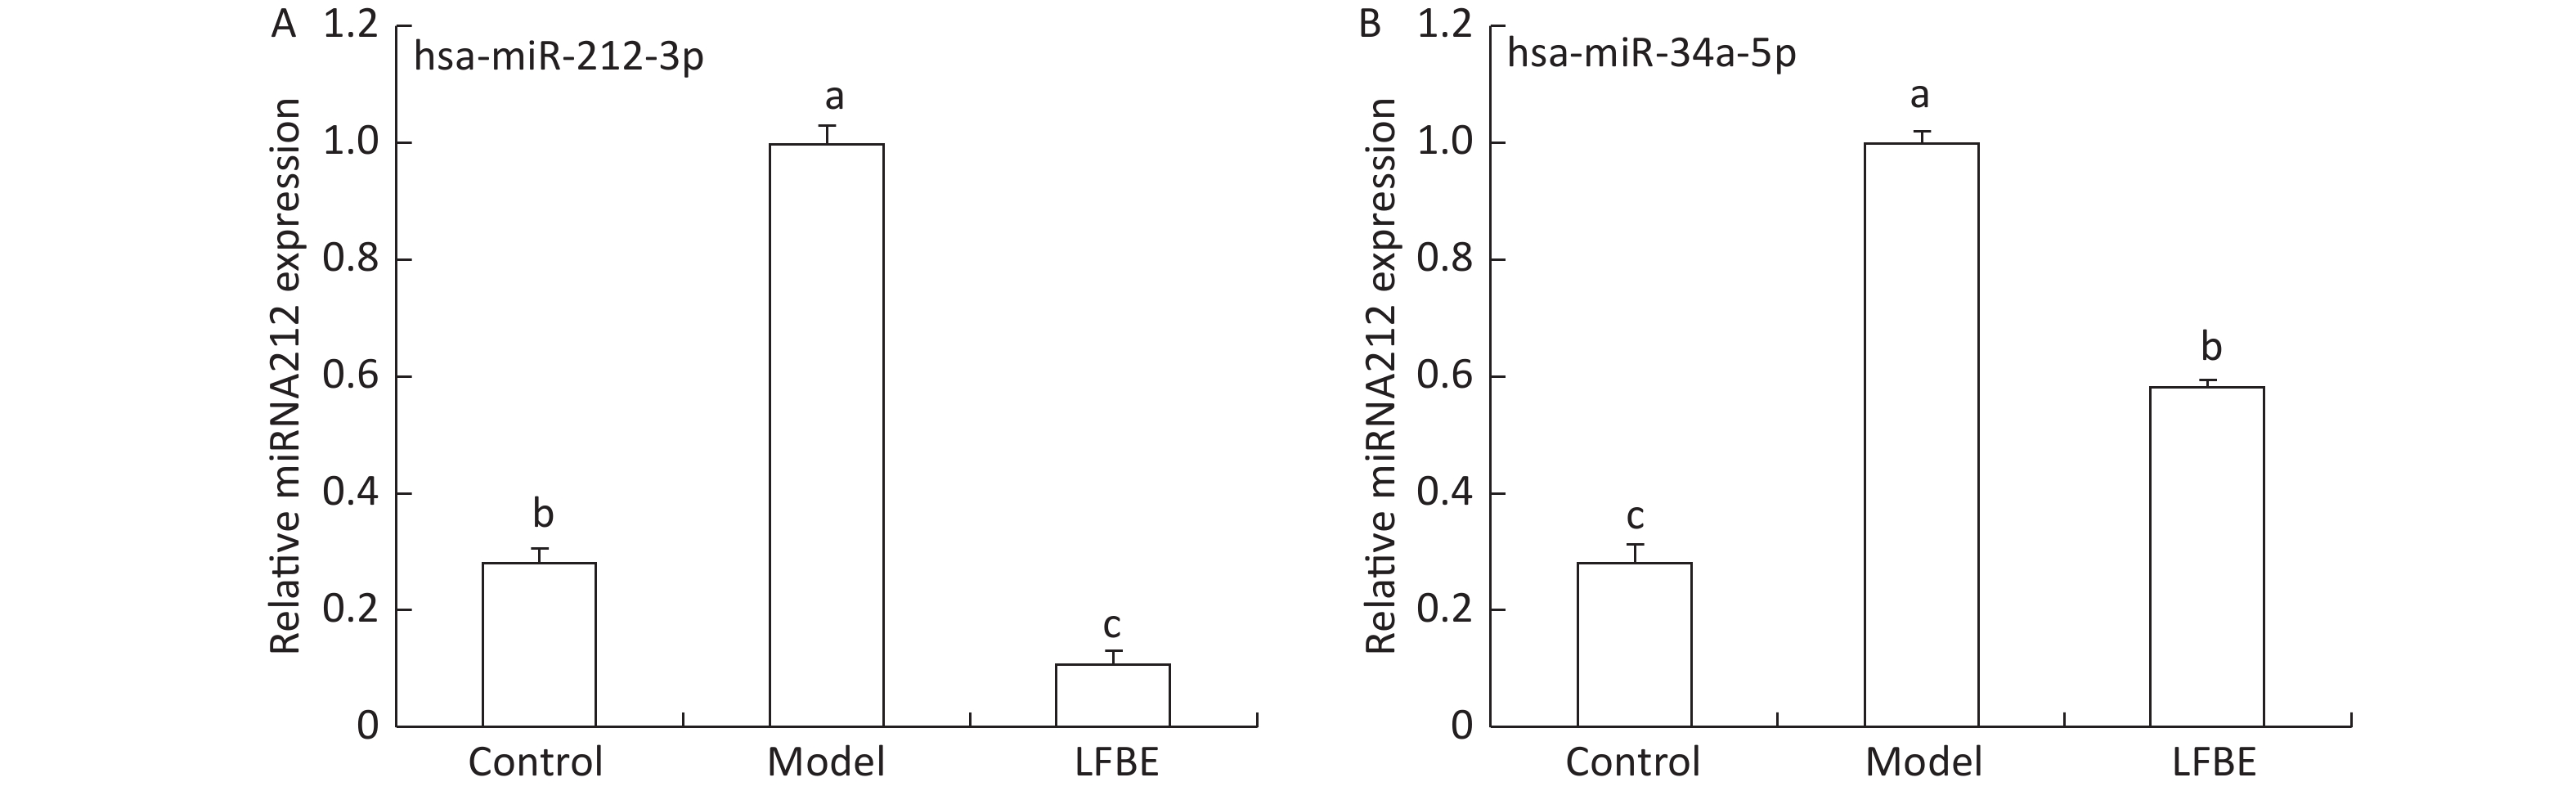
In probing the mechanism by which LFBE improves high levels of glucose and TG in PA-induced HepG2 cells, we found that the upregulation of miR-212 and miR-34a was diminished by LFBE in HepG2 cells (Figure 6).

Figure 6. The expression of miR-212-3p (A) and miR-34a-5p (B) in HepG2 cells treated with LFBE. Data are means ± SEM of six replicate experiments. Different letters (a, b, c) indicate a significant difference (P < 0.05).
-
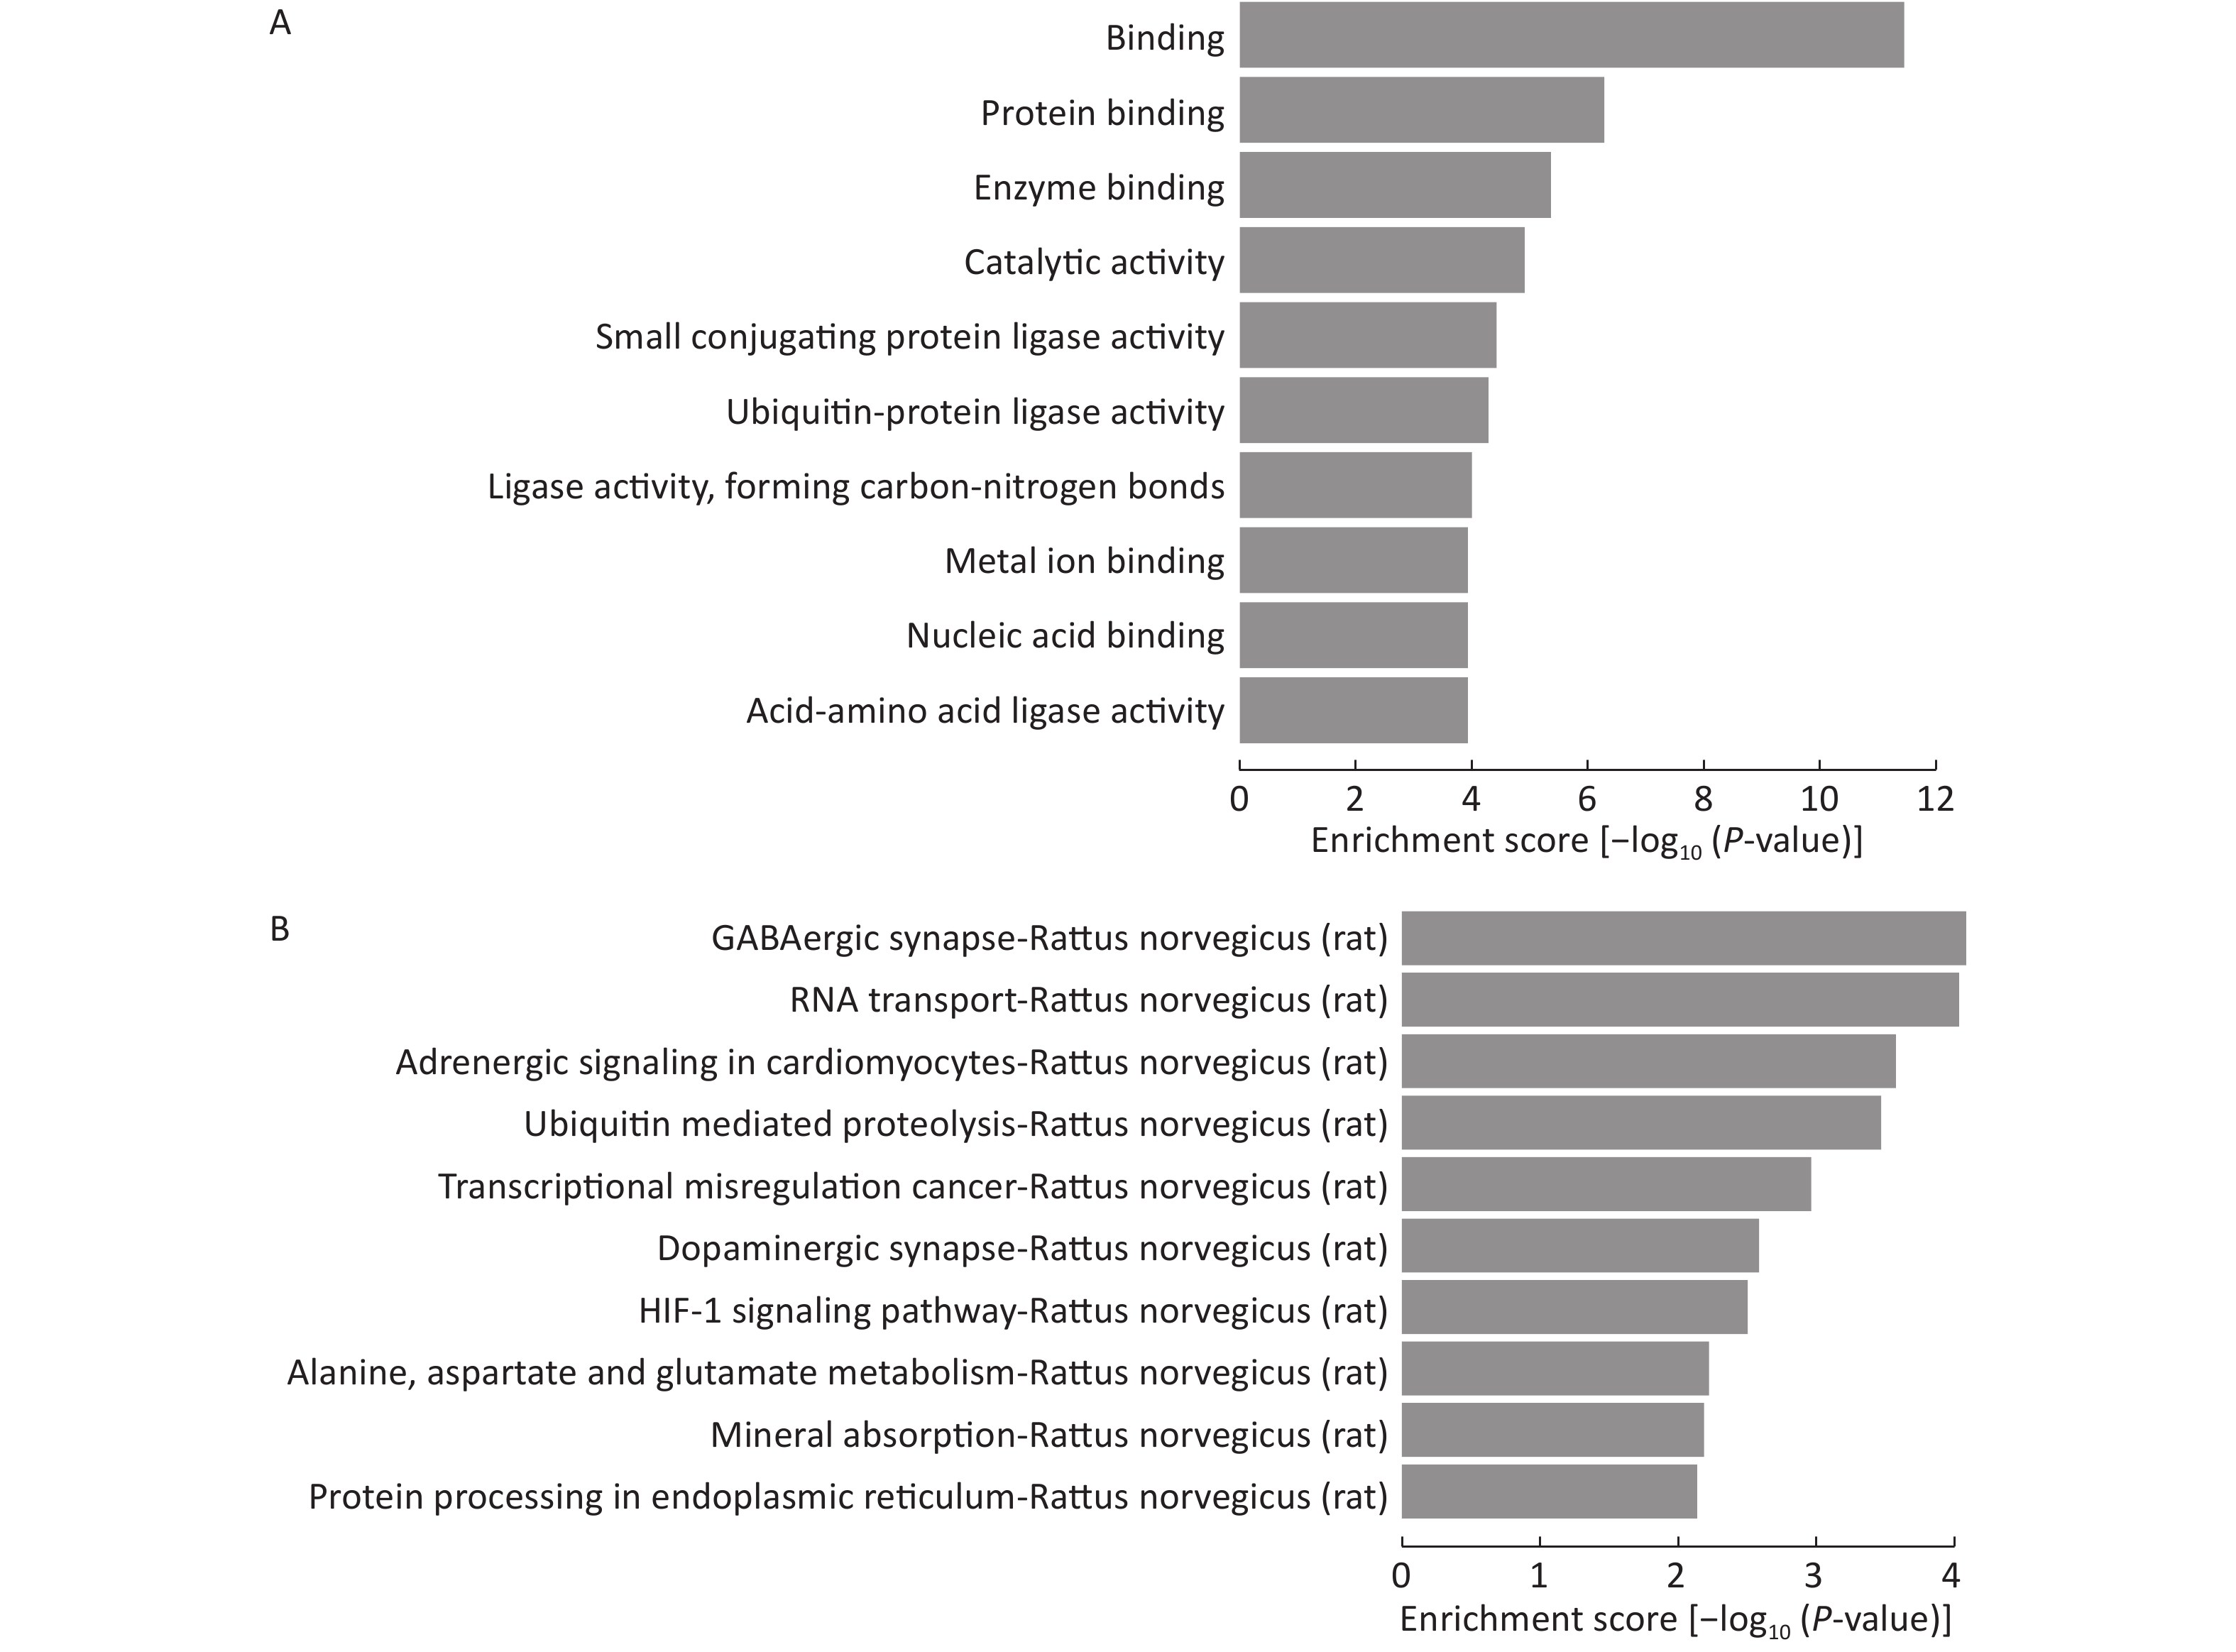
Because the number of experimentally validated miRNA targets is very limited, we predicted their potential target genes to explore the functions of the 15 differentially expressed miRNAs among LFBE and HFD groups. Three computer-aided algorithms, including TargetScan, miRanda, and miRBase, were used. The biology of the predicted target genes was further explored in the context of their molecular functions and involvement in known regulatory pathways. The predicated miRNA targets were categorized into several biological functions, and GABAergic synapse were shown to be the most enriched ones (Figure 7A, B).
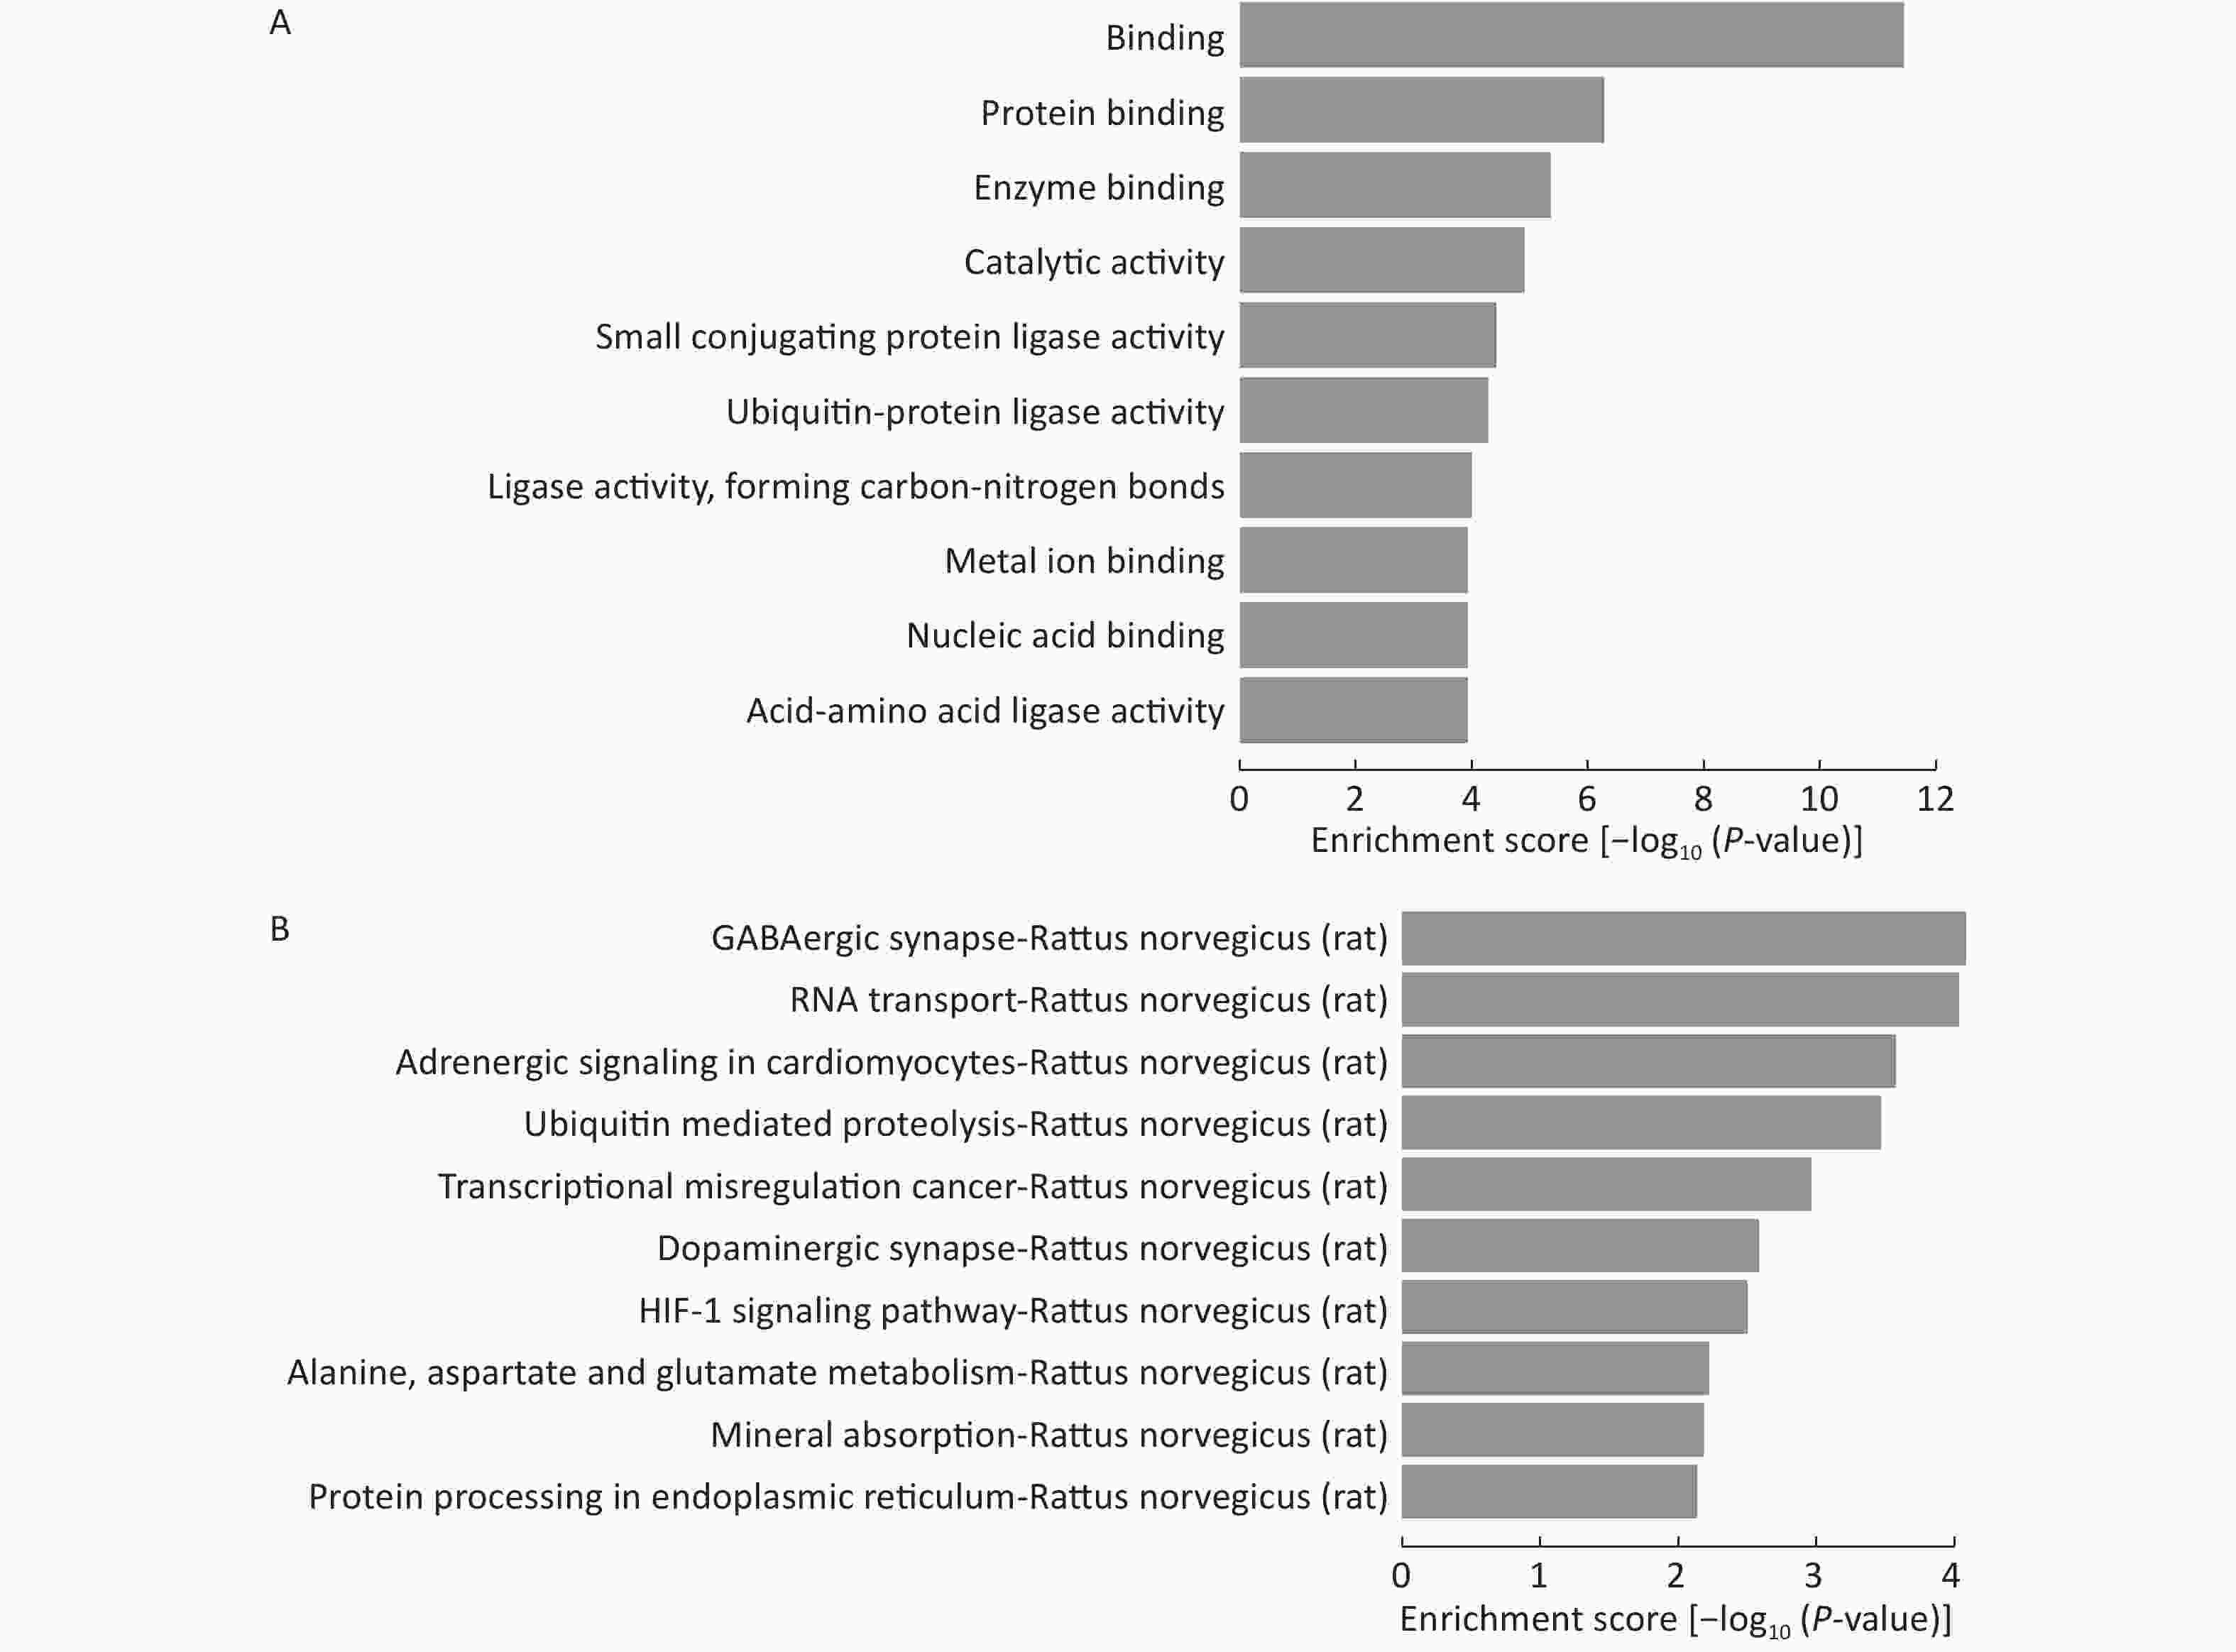
Figure 7. GO and KEGG pathway analysis of the deregulated miRNAs. Enrichment score is equal to log10 (P-value). The higher the enrichment score, the more specific is the corresponding function. (A) significant GOs and (B) significant signaling pathways. KEGG: Kyoto Encyclopedia of Genes and Genomes; GO: Gene ontology. NC group consisted of normal rats treated with distilled water (4 mL/kg body weight) through gavage administration and fed with control diet. HFD group consisted of diet-induced obese rats treated with distilled water (4 mL/kg body weight) through gavage administration and fed with HFD. LFBE group consisted of diet-induced obese rats treated with LFBE (1 g/kg body weight) through gavage administration and fed with HFD.
-
Our study demonstrated that Lactobacillus plantarum dy-1 fermentation changed the composition of the aqueous extracts of barley, with a significant increase in β-glucan and phenolic acids, especially of VA and FA. In addition, our study has shown that LFBE administration resulted in a lower rate of increase in body weight of rats through reduction in body fat. It was clearly shown that L. plantarum dy-1 fermentation significantly improves the anti-obesity properties of barley. These results are consistent with those of our preliminary research[9, 16]. A disorder of lipid metabolism and glucose homeostasis causes the development of obesity[2]. Dietary fat and free fatty acids are known to impair insulin sensitivity and to enhance hepatic glucose production and inflammatory cascades[17, 18]. Thus, an OGTT was performed. We found that the LFBE improved oral glucose tolerance in rats.
Furthermore, treatment of LFBE also improved hepatic steatosis and decreased serum and liver levels of triglycerides and total cholesterol in high-fat-fed rats. This effect might be due to higher levels of β-glucans and phenolic compounds. Both barley and oats have been reported to be effective in lowering serum TC and LDL-C in humans and animals, and the effect has been attributed to the content of β-glucans[18, 19]. Lin et al. reported that supplementation with polyphenol-rich noni juice probably resulted in decreased levels of serum and liver lipids in hamsters fed a high-fat/cholesterol diet[20, 21]. These reports have laid the foundation for further investigation into the molecular mechanism of the anti-obesity effect demonstrated by several edible products. Our previous studies on LFBE also report on the effectiveness of the barley in obesity-related therapy[16].
We know that some miRNAs have been proposed to be associated with obesity[12, 14, 15]. To identify miRNAs associated with the anti-obesity action of LFBE, miRNAs with at least a 1.5-fold change in expression were selected for microarray and RT-qPCR analysis. We found 15 miRNAs to be differentially expressed. miR-122 is a liver-specific miRNA implicated in cholesterol and lipid metabolism, and is known to increase hepatic fatty acid oxidation and decrease hepatic fatty acid and cholesterol synthesis rate[15]. LFBE also can reduce miR-122-5p overexpression in HFD-induced obese rats, but miR-122-5p induced no significant differences. The functions of miR-3571, miR-195-3p, miR-421-3p, and miR-130b-5p remain unknown in the context of obesity and lipid metabolism. However, miR-421-3p has emerged as an important regulator in the development of pancreatic cancer[22]; miR-195-3p with agomiRs could attenuate fibroblast proliferation[23]; and miR-130b targets Fmr1 and regulates embryonic neural progenitor cell proliferation and differentiation[24]. Importantly, there is a correlation between obesity and various diseases, such as cancer[25]. A search in the miRWalk database showed that among these miRNA, miR-421-3p, miR-130b-5p, miR-195-3p, and miR-3571 had non validated target genes. In addition, we found that miR-34a-5p associated with obesity is a previously validated target gene[14]. Some studies also reported that miR-34a overexpression was shown to decrease glucose-stimulated insulin secretion and to mediate apoptosis induced by free fatty acids in Min6 cells by targeting Vamp2 and Bcl2, respectively[13]. For miR-212-3p, although there are predicted target genes closely associated with obesity, there are no experimental reports yet. Validation of microarray results prompted us to further investigate the role of miR-212 dysregulation in the development of liver steatosis. In fact, miR-212 dysregulation has previously been reported in cancers[26] angiogenic responses[27], and non-alcoholic fatty liver[28]. Several studies have shown that overexpressing miR-132 and/or miR-212 increases glucose-stimulated insulin secretion[29]. Both miR-212 and miR-132 are upregulated and specifically regulated by hyperglycemia in pancreatic islets of Goto-Kakizaki (GK) rats[30] and upregulated in pancreatic islets from obese B6 and BTBR mice[12]. Results from cellular systems indicate that LFBE may influence miR-34a and miR-212 expression to modulate glucose consumption and regulate lipid metabolism.
To further verify the results from the animal model experiments, HepG2 cells were utilized for in vitro testing. The results of glucose consumption activity and lipid accumulation in in vitro experiments were consistent with data from animal studies. LFBE significantly enhanced glucose consumption and reduced lipid accumulation in a dose-dependent manner in PA-induced HepG2 cells. We also found that LFBE diminishes upregulation of miR-212 and miR-34a in HepG2 cells. At the same time, we found that miR-212 inhibitor and miR-34a inhibitor significantly enhanced glucose consumption and reduced lipid accumulation in PA-induced HepG2 cells. Further identification of these target genes and their characterization will be of great help in better understanding the potential roles of these differentially expressed miRNAs in hepatic energy metabolism. Among the enriched signaling pathways, only a few, such as adrenergic[31] and HIF-1[32, 33] signaling pathways have been reported to be involved in glucose and lipid metabolism. However, involvement of other signaling pathways, such as the dopaminergic synapse pathway, has never been reported. These findings suggest that various cellular processes and signaling pathways are involved in lipid metabolism. miRNAs and their possible target genes, which are located at the intersection of binding and the adrenergic signaling pathway, might be the focus of future studies.
This study establishes the potential of LFBE as a natural product with anti-obesity properties that could also improve lipid metabolism. LFBE is richer in β-glucan and phenolic compounds than RBE. In obese rats, LFBE can reduce body weight, decrease the levels of TG, TC, and LDL-C, and increase the level of HDL-C in serum and liver. We identified specific miRNAs that were differentially expressed in the HFD group and in both the LFBE and NC groups. Our results indicate that LFBE may regulate miRNA expression to inhibit obesity and fatty liver. Further studies will be required to determine the role of miRNAs in inhibiting obesity and the target genes of miRNAs regulating obesity needs further confirmation. On a related note, the primary active ingredients in LFBE that regulate the differential expression of miRNAs need to be determined.
-
The authors declare no conflict of interest.
-
ZHANG Jia Yan designed the study, assisted in animal and cell experiments, collected test data, interpreted the results, and wrote the manuscript. XIAO Xiang interpreted the results, and revised the manuscript. DONG Ying designed the study, interpreted the results, and wrote the manuscript. ZHOU Xing Hua collected test data and drafted the manuscript. All authors agreed to the final content.
Funds:
This study was supported by the priority academic program development of Jiangsu Higher Education institutions and the National Natural Science Foundation of China [31801538]

 Quick Links
 DownLoad: