


HTML
-
Fluorescent lighting technologies are undergoing rapid market growth as part of a resurgent social interest in energy efficiency and its need is much higher in developing countries like Pakistan due to energy crises and lesser expansion of electricity projects [1]. This fast growth of fluorescent lamps is also associated with great health risks because of emission of Mercury (Hg) which is an important component in all types of fluorescent lamps. Fluorescent lamps contain 0.7–115 mg of Hg per lamp depending on its size, and the subclass of compact fluorescent lamps (CFLs) on average contains 3–5 mg of Hg per lamp [2].
The fluorescent lamps are available in different shapes, smaller and larger in size but the lamp with 40 watt is commonly used. A florescent lamp is a sealed glass tube with argon gas and Hg vapor at low pressure. The glass tube is coated with phosphor compound from inside and the electrodes composed of tungsten coils which are coated with a substance, emitting electrons. When the voltage is applied, the electrons emit from cathode hit the argon gas emitting more electrons. These electrons then hit the Hg vapor to emit ultraviolet radiation. The radiations strike the phospher coating to produce visible light. Thus Hg plays a major role in the lightning of lamp [3].
Hg and its compounds have long been recognized as occupational toxicants[4]. Hg is present in earth crust and found in ranking on the top of environmental pollutants. It occurs in organic, inorganic, and elemental forms in many diverse settings [5, 6]. Hg is extensively used in agriculture, medicine and industries, therefore, circulates in the environment [7, 8]. The metallic Hg present in the compact and tubular form of fluorescent lamp is in liquid state which can be easily evaporated because of its low vapor pressure. Besides manufacturing, the workers in the fluorescent industries are also exposed to Hg through accidental breakage of lamps which released Hg in the air and also contaminate the ground. The workers exposued through breathing, skin contact, intake of water, and food with contaminated hands.
The metallic Hg behave differently when get entered in the human body because of changing its forms and exerts variety of adverse effects on human body organs, e.g. kidney, liver, respiratory system, skin, thyroid gland, nervous systems and immune system, reproductive and developmental defects, genotoxicities and cardiovascular disorders [9-12].
Recently, several studies reported the psychological effects of Hg exposure in the industrial workers including chronic insomnia[13] and measurement of hand tremor [14, 15] because brain and kidneys are highly susceptible to the low level of Hg [16]. However, no research work is conducted so far on the quantitative measurement of T-Hg concentrations and its species organic Hg (Me-Hg) and inorganic Hg (I-Hg) in the biological samples [blood (plasma and RBCs), nails, hair, and urine] of the exposed workers in florescent lamp industries. This study aimed to investigate the concentrations of T-Hg and its species (Me-Hg, I-Hg) in the biological samples (blood, nails, hair, urine) of the workers in fluorescent lamp industries and to assess its hazardous effects on human health.
-
The proposed hypothesis was evaluated by designing a prospective observational case-control clinical study as per the principles of the ‘world medical association (WMA) declaration of Helsinki-Ethical principles for medical research involving human subjects’ and its amendments[17]. The ethical committee of the Pak International Medical College and Research Institute, Hayatabad, Pakistan and Advance Studies and Research Board (ASRB) of the University of Peshawar, Pakistan approved the protocol of the study.
-
The samples of blood, urine, hair, and nails were collected before the work shift in the month of April 2014 from the workers of the fluorescent lamp industries in district Nowshehra, Khyber Pakhtunkhwa, Pakistan. Exposed workers (n = 40, total = 90) which represents the health status of more than 40% of exposed population were selected from different sections of the fluorescents lamp industries, including those working in the vicinity of exhaust, basing and sealing machine and healthy unexposed age and gender matched subjects (n = 40, total = 75) from the management section, working in the offices of the industry were selected as control. Signed written ‘Informed consent’ was also obtained from all the participants in the beginning of the study.
A brief questionnaire was also filled from the individuals in which the detailed medical profile and duration of the work in the industries were recorded.
-
The study includes the workers working in the exhaust, sealing, and basing machines in the fluorescent lamp industries.
-
The Hg exposure of workers by other ways like gold mining, fresh dental amalgam user, and chloralkali industries were excluded from the study.
-
Blood
Venous blood samples of 4–5 mL were collected from the subjects in heparinized vacutainer tubes. These samples were then divided into plasma and erythrocytes aliquots by centrifugation at 3,000 rpm for 10 min. The samples were then stored in Eppendorf tubes at −18 °C until analyses.
Urine
Urine samples of about 40 mL were collected in clean polyethylene bottles. 1 mL of HNO3 (10% aqueous solution) was added to each urine sample for Hg preservation in the samples.
Nails
Fingernails clippings of weight (0.25–0.35 g) were collected by cutting all 10 fingernails. Nails samples were coded and stored in plastic bags at room temperature for further processing. For the removal of external contaminants, nails samples were thoroughly washed three times with acetone, deionized water and 0.5% Triton X-100 aqueous solution. Finally, samples were dried at 35 °C for 24 h in oven.
Hair
A lock of scalp hair (0.5–1.5 g) near the occipital region was collected from each participant and stored in plastic bags at room temperature for further processing. Before extraction, hair samples were thoroughly washed and dried in the same manner as the nails. These samples were also cut into smaller pieces with stainless steel scissor.
Reagents
Hg standard solution (1 mg/L in 10% HNO3) Perkin Elmer manufactured under ISO 9001 quality assurance system, HNO3 (68%), HCl (37%), H2SO4 (98%), HClO4 (70%). Analytical grade Ethanol (CH3CH2OH), Acetic Acid (CH3COOH), Sodium Boro Hydride (NaBH4), Tin Chloride (SnCl2), Cadmium Chloride (CdCl2), Sodium Hydroxide (NaOH), Cysteine [HO2CCH(NH2)CH2SH] and Potassium Hydroxide (KOH), Ultra-pure water. All the chemicals and reagents were used without further purification.
Samples Preparation
The concentrations of T-Hg, I-Hg, and Me-Hg was determined in the prepared biological samples (plasma, RBCs, urine, nails, and hair) samples.
Quantification of T-Hg
The reported method [18] was used for the extraction of T-Hg from plasma, RBCs, urine, hair and nails samples. Samples of plasma (0.5 mL), RBCs (0.5 mL), urine (1 mL), hair (0.25 g), and nails (0.06 g) were thawed at room temperature and then transferred each to vials containing 3 mL mixture of HNO3 (70%), HClO4 (70%) and H2SO4 (98%) (In 5:2:1 ratio, respectively). The mixture of plasma, RBCs and urine were digested upto 40 °C for 1 h and then at 90 °C for another 1 h. When the brown nitrogen fumes dissipated, the heating of the solution was stopped, while the mixture of hair and nails samples was continously heated upto 200 °C for 20 min. After cooling, the samples were diluted with deionized water up to 30 mL.
Quantification of Me-Hg
The reported method [19] with few changes was used to determine the Me-Hg concentration in the biological samples RBCs, plasma and urine. The mixture of 1.5 mL of KOH (11 mol/L), 1 mL of L-cysteine solution (0.0124 mol/L) and 0.5 mL deionized water was added in each sample of plasma (0.5 mL), RBCs (0.5 mL), and urine (1 mL) and kept overnight at room temperature. The extracts were diluted up to 30 mL with deionized water before analysis.
The method [20] with slight modifications was used for the extraction of Me-Hg from hair and nails samples. The samples of hair (0.2 g) and nails (50 mg) were heated upto 100 °C for 15 min with the mixture of 2 drops of ethanol, 1 mL of deionized water and 5 mL of HCl (2.0 N). The samples mixture was cooled and 3 mL acetate buffer solution (4.5 pH) was added. The mixture was diluted up to (30 mL) with deionized water before analysis.
Quantification of I-Hg
The I-Hg was extracted from the biological samples by the adopted method [4]. The samples portion of 0.5 mL of RBCs, 0.5 mL of plasma, 1 mL of urine, 0.05 g of dried nails and 0.2 g of hair were taken separately in 50 mL of reaction flasks and 0.5 mL of Stannous Chloride (SnCl2) (1 x 10⁵ μg/L of HCl) was added to the flask as reducing agent. The reaction mixture was digested with 3 mL of NaOH (3 x 10⁵ μg/L). The mixture was continuously stirred before analysis by AAS 700.
Instrumentation
The concentrations of Hg in the digested samples of RBCs, plasma, urine, nails and hair were determined using atomic absorption spectrometry (ASS 700, Perkin Elmer) equipped with mercury hydride system (MHS-15) linked with electrodeless discharge lamp (EDL) (used specifically for Hg detection) with instrument adjustment of 253.7 nm wavelength and 186 MP current. Sodium borohydride (NaBH4) and Stannous chloride (SnCl2) was used as reducing agent. The samples, internal laboratory standards and controlled were passed through the same digestion process.
Quality Control
The certified Hg standard stock solution 1 mg/L in 10% HNO3 was used for the preparation of calibration standards of 10, 25, and 50 µg/L at the time of analysis. The analytical performance was evaluated in terms of limit of detection were 0.34, 0.11, 0.91 µg/L for RBCs, plasma and urine, respectively and 0.09 µg/g, 0.16 µg/g for hair and nails, respectively. The accuracy of the method was validated by analyzing three different certified reference materials namely human hair NIES No.13 (National Institute of Environmental Studies, Japan), blood material level I, MR4206 (Nicomedia company, Oslo, Norway) and urine control level II (Sigma chemical company). The observed average (n = 3) and reference values of Hg for hair was found 4.27 ± 0.24 µg/g comparable with reference value 4.42 µg/g and for urine the value found was 78.5 ± 1.3 µg/L comparable with 98 µg/L while 2.2 ± 0.4 µg/L comparable with 2.4 µg/L for blood. The percent recoveries from the tested samples ranged from 80% to 96%.
Statistical Analyses
The mean and standard deviation of replicates (n = 3) for T-Hg, Me-Hg and I-Hg concentrations in plasma, RBCs, urine, hair and nails were calculated. The statistical analysis was performed by using sigma plot version 10, Graph pad version 5, and Excel® software. The difference between Hg concentration of exposed workers and the control group was evaluated by unpaired t-test at 95% confidence interval. The statistical relation between Hg concentration in biological samples and demographic characteristics was examined by linear regression analysis. A value of P < 0.05 was considered significant.
Study Design
Subjects
Inclusion Criteria
Exclusion Criteria
Collection of Samples
-
The general informations about the age, weght, height, smoking, fish consumption, and the overall safety condition of the industries are summarized in Table 1. The workers in the fluorescent lamps industries were mostly untrained and unaware about the hazardous effects of Hg. The workers protection measures were inadequate because the special protective booties and face shields were not provided to the workers. Routine medical examination was not provided. No air monitoring equipment’s were installed and most of the machines were not properly working and stay idle and there was no recycling unit for broken lamps. In the industries, the workers were only male with a mean age of 26.70 y; therefore no female was included in the control group. The height 5.28 ± 0.20 feet, weight 56.90 ± 10.50 kg and experience 5.35 ± 4.81 y of the exposed workers and control group was recorded. The total working time was 10 h per day in two shifts and one holiday in a week. About 70% of the workers were using gloves during work. Among selected workers, only 40% workers were fish consumers and 10% were using Hg based dental amalgam filling 2 years before giving the biological samples for this research therefore the amalgam filling was quite old (Table 1). All the data collected through questionnaire survey was correlated with Hg concentrations in biological samples of the workers.
Parameters Exposed workers Control
groupParameters Exposed occupational workers Control
groupAge (y) 26.70 ± 6.72 29.90 ± 5.27 RBCs (µg/L) Me-Hg 27.70 ± 5.36 1.67 ± 0.86# Gender (male*) 40 40 I-Hg 3.32 ± 0.75 0.14 ± 0.07# Height (ft) 5.28 ± 0.20 5.31 ± 0.16 T-Hg 31.87 ± 5.96 1.85 ± 0.94# Weight (kg) 56.90 ± 10.50 55.10 ± 8.92 Plasma (µg/L) Me-Hg 3.50 ± 0.68 0.16 ± 0.08# Experience (y) 5.35 ± 4.81 Na I-Hg 10.60 ± 1.95 0.41 ± 0.21# Working (h) 8 Na T-Hg 15.10 ± 2.77 0.59 ± 0.30# Smoker (%) 60 55 Urine (µg/L) Me-Hg 13.50 ± 6.89 0.31 ± 0.23# Masks user (%) 0 Na I-Hg 137.50 ± 24.20 2.38 ± 1.14# Gloves user (%) 70 Na T-Hg 154.60 ± 28.00 2.81 ± 1.30# Goggles user (%) 0 Na Hair (µg/g) Me-Hg 3.21 ± 0.73 0.30 ± 0.18# Fish consumer (%) 40 Na I-Hg 0.31 ± 0.17 0.03 ± 0.02# Protective cloths 0 Na T-Hg 3.64 ± 0.84 0.33 ± 0.20# Hg used in tooth filling (%) 10 Nr Nails (µg/g) Me-Hg 5.52 ± 0.92 0.37 ± 0.20# I-Hg 0.60 ± 0.26 0.03 ± 0.02# T-Hg 6.30 ± 1.62 0.41 ± 0.22# Note. *Each value of mean ± SD represents standard deviation (n = 40). Na not applicable. Nr, not reported. #P < 0.001. Table 1. The demographic profile and the concentrations of Me-Hg, I-Hg, and T-Hg in RBCs, plasma, urine, hair and nails of exposed workers in Fluorescent lamps industries and control subjects
The Hg concentration was (T-Hg, Me-Hg, and I-Hg) determined in all five biomarkers including RBCs, plasma, urine, hair and nails samples of Hg exposed workers in the industries and control individuals (Table 1) for the assessement of the distribution of Hg species in different body organs after exposure and the effect of the demographic characteristics (age, weight, experience, smoking, fish consumption) on Hg concentration on the biological samples of exposed workers. For the purpose, the age of the selected workers was divided into four groups ranging from 18–23, 24–29, 30–34, and 35–40 y, whereas the weight and experience of the workers was also categorized in to four groups ranging from 40–49, 50–59, 59–68, and 69–74 kg and 1–3, 4–7, 7–9, and 9–12 y respectively.
-
The mean concentrations of T-Hg in RBCs and plasma (31.87 µg/L, RBCs) (15.10 µg/L, Plasma) were found significantly (P < 0.001) higher in exposed workers (n = 40) as compared to the control subjects (n = 40) T-Hg (1.85 µg/L, RBCs), (0.59 µg/L, Plasma) (Table 1) and its level was found 6 times higher than its respective permissible limit (5.0 µg/L) [21]. The percentage distribution of Hg species in RBCs comprised of 80%–90% of Me-Hg and 10%–20% of I-Hg, might be the reason of conversion of ionic Hg into Me-Hg by the anaerobic bacteria present in the RBCs (Table 1) [22, 23]. However, demethylation of Me-Hg occurs in RBCs which leads to the presence of I-Hg concentrations counting for 10%–20%. The workers exposed to the metallic Hg (Hg0) through inhalation, ingestion and dermal contact. The 80% absorption occurs through inhalation. The inhaled Hg0 oxidized to Hg+2 which attached to the carbon atom and form Me-Hg. Therefore workers exposed to Me-Hg through fish consumption or oxidation of metallic Hg into Me-Hg in the human blood which is then distributed to the whole body as reported earlier. Once absorbed in the body tissues Me-Hg can pass the blood brain barrier and converted into I-Hg and accumulated there. The ratio between Me-Hg and I-Hg in RBCs was found 9:1. Thus the blood can be used as a good indicator for Me-Hg concentration [24]. As compared to RBCs an opposite % age between Me-Hg and I-Hg in plasma samples of the workers was observed which was 30%–40% of Me-Hg and 60%–70% of I-Hg level [24]. The ratio calculated for Me-Hg and I-Hg in plasma was 1:2, therefore blood plasma can be a good indicator for both Me-Hg and I-Hg analysis [24].
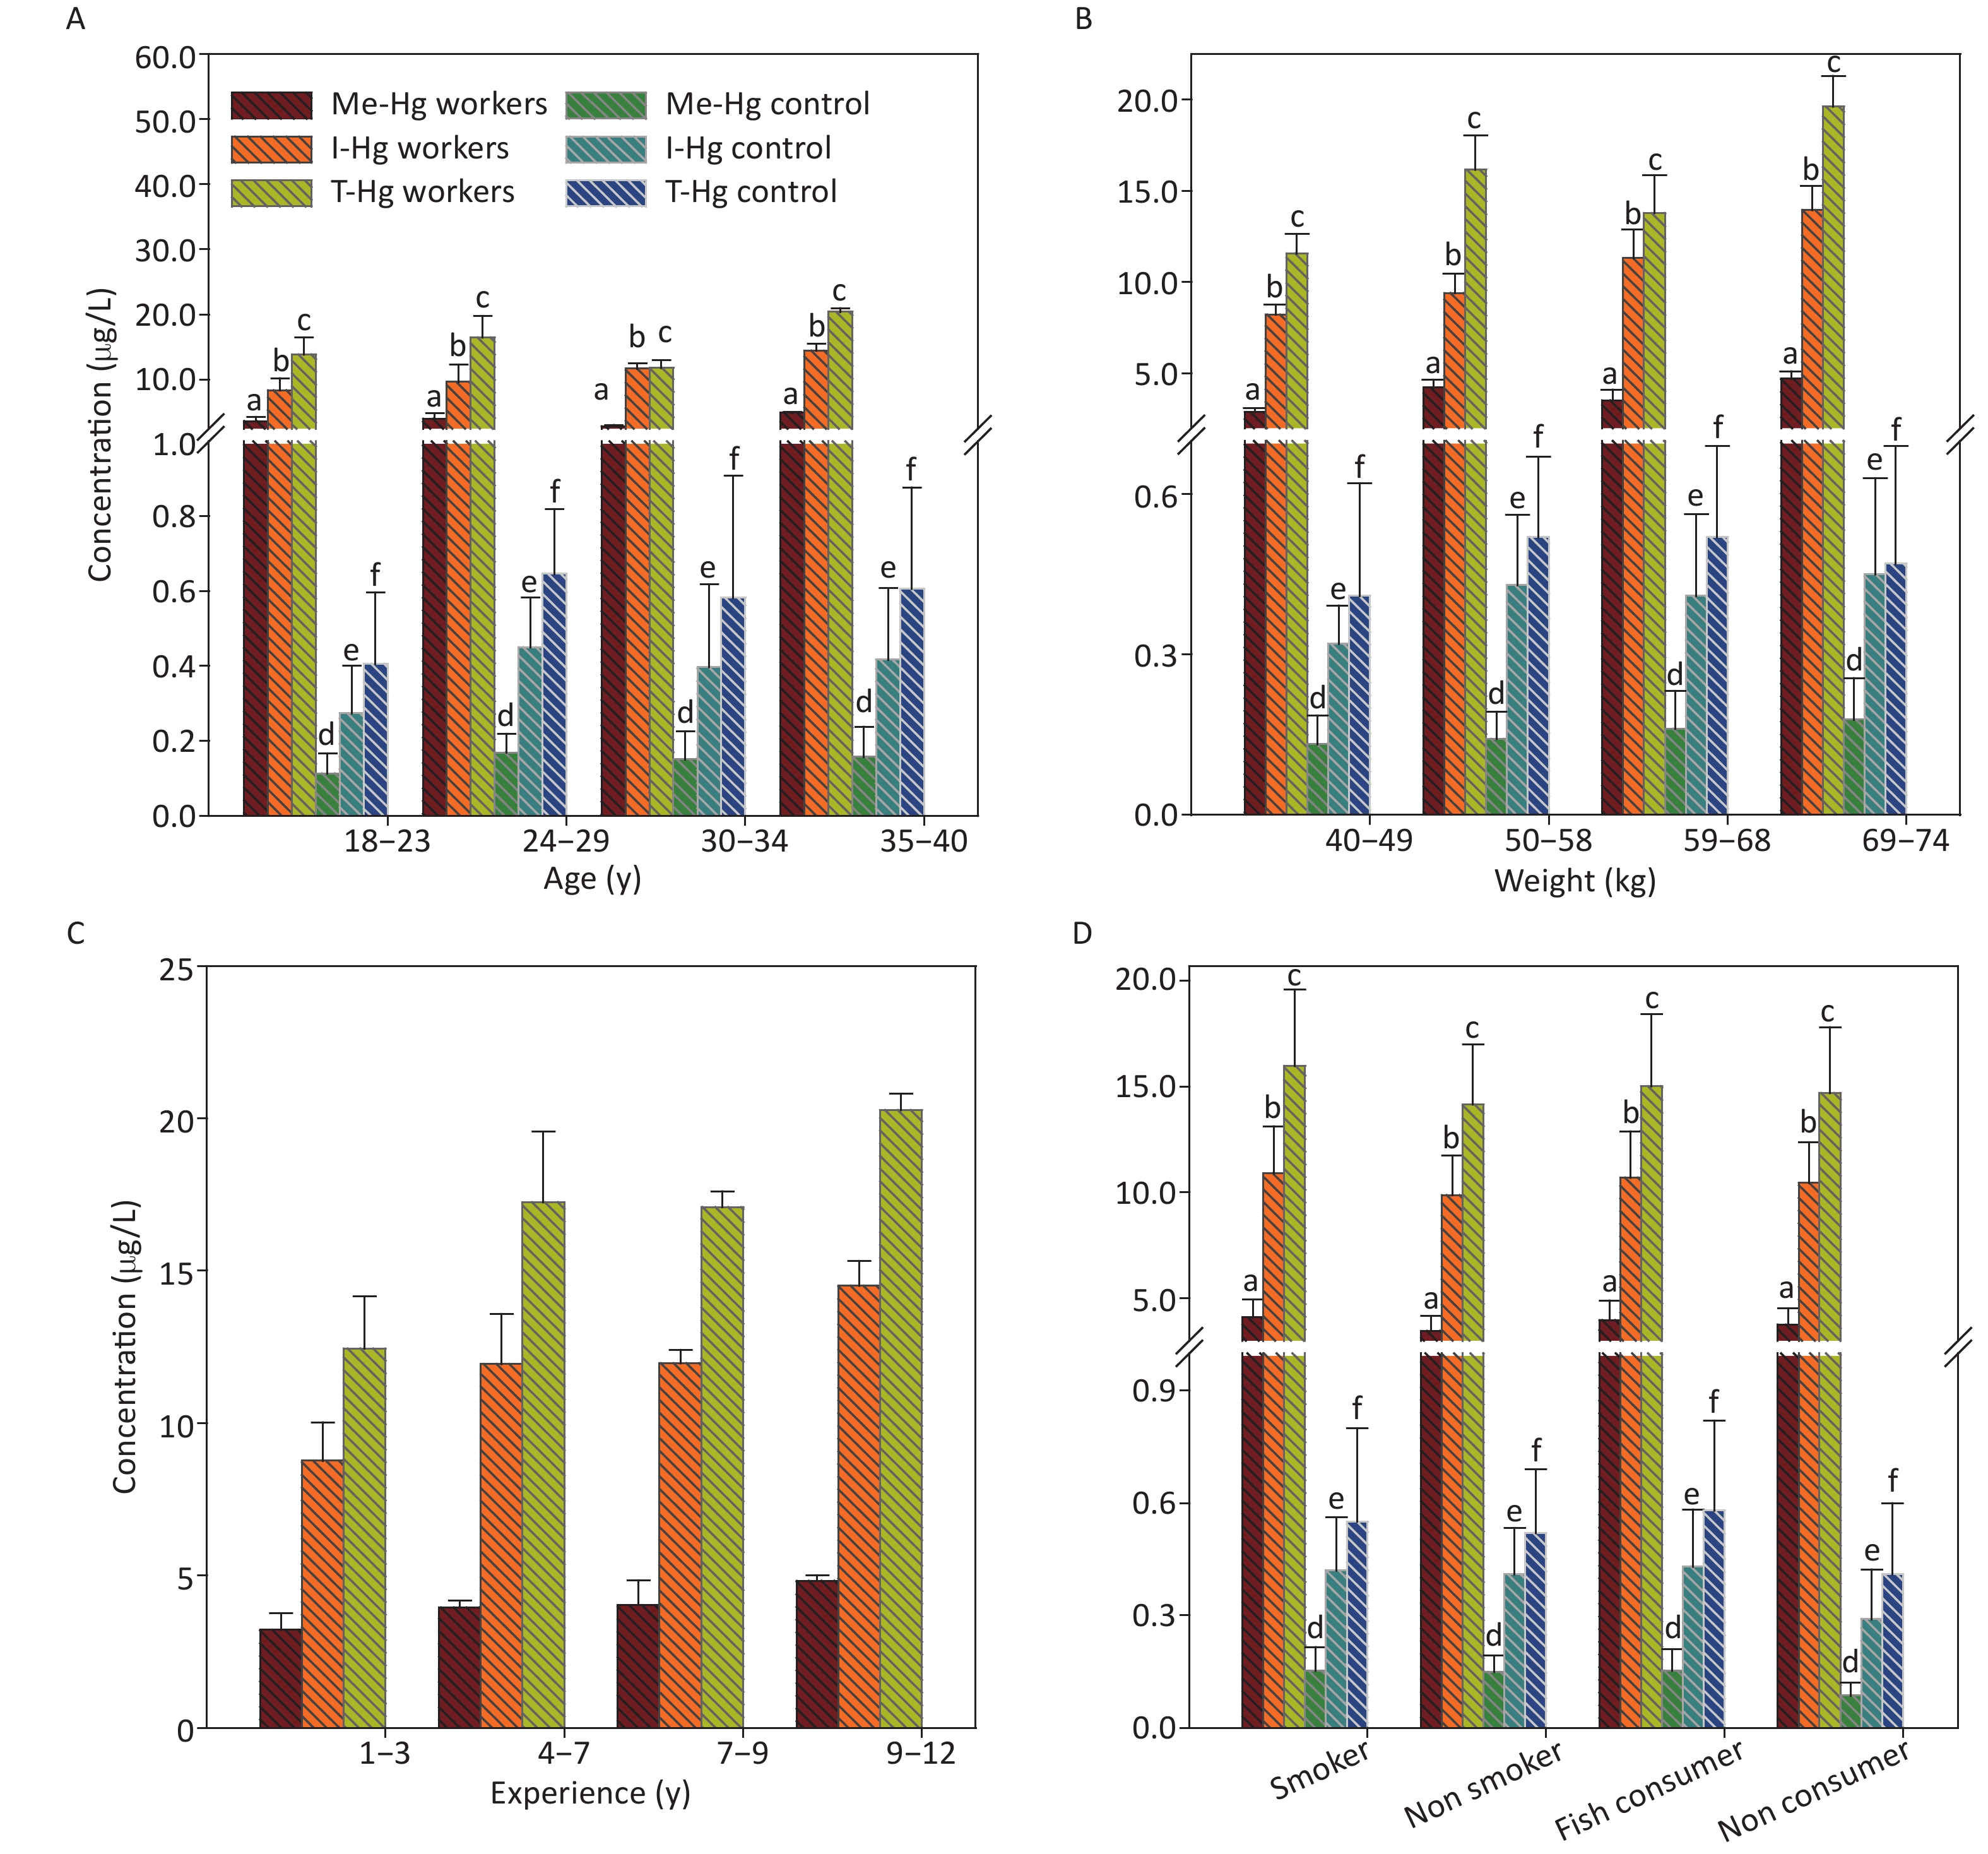
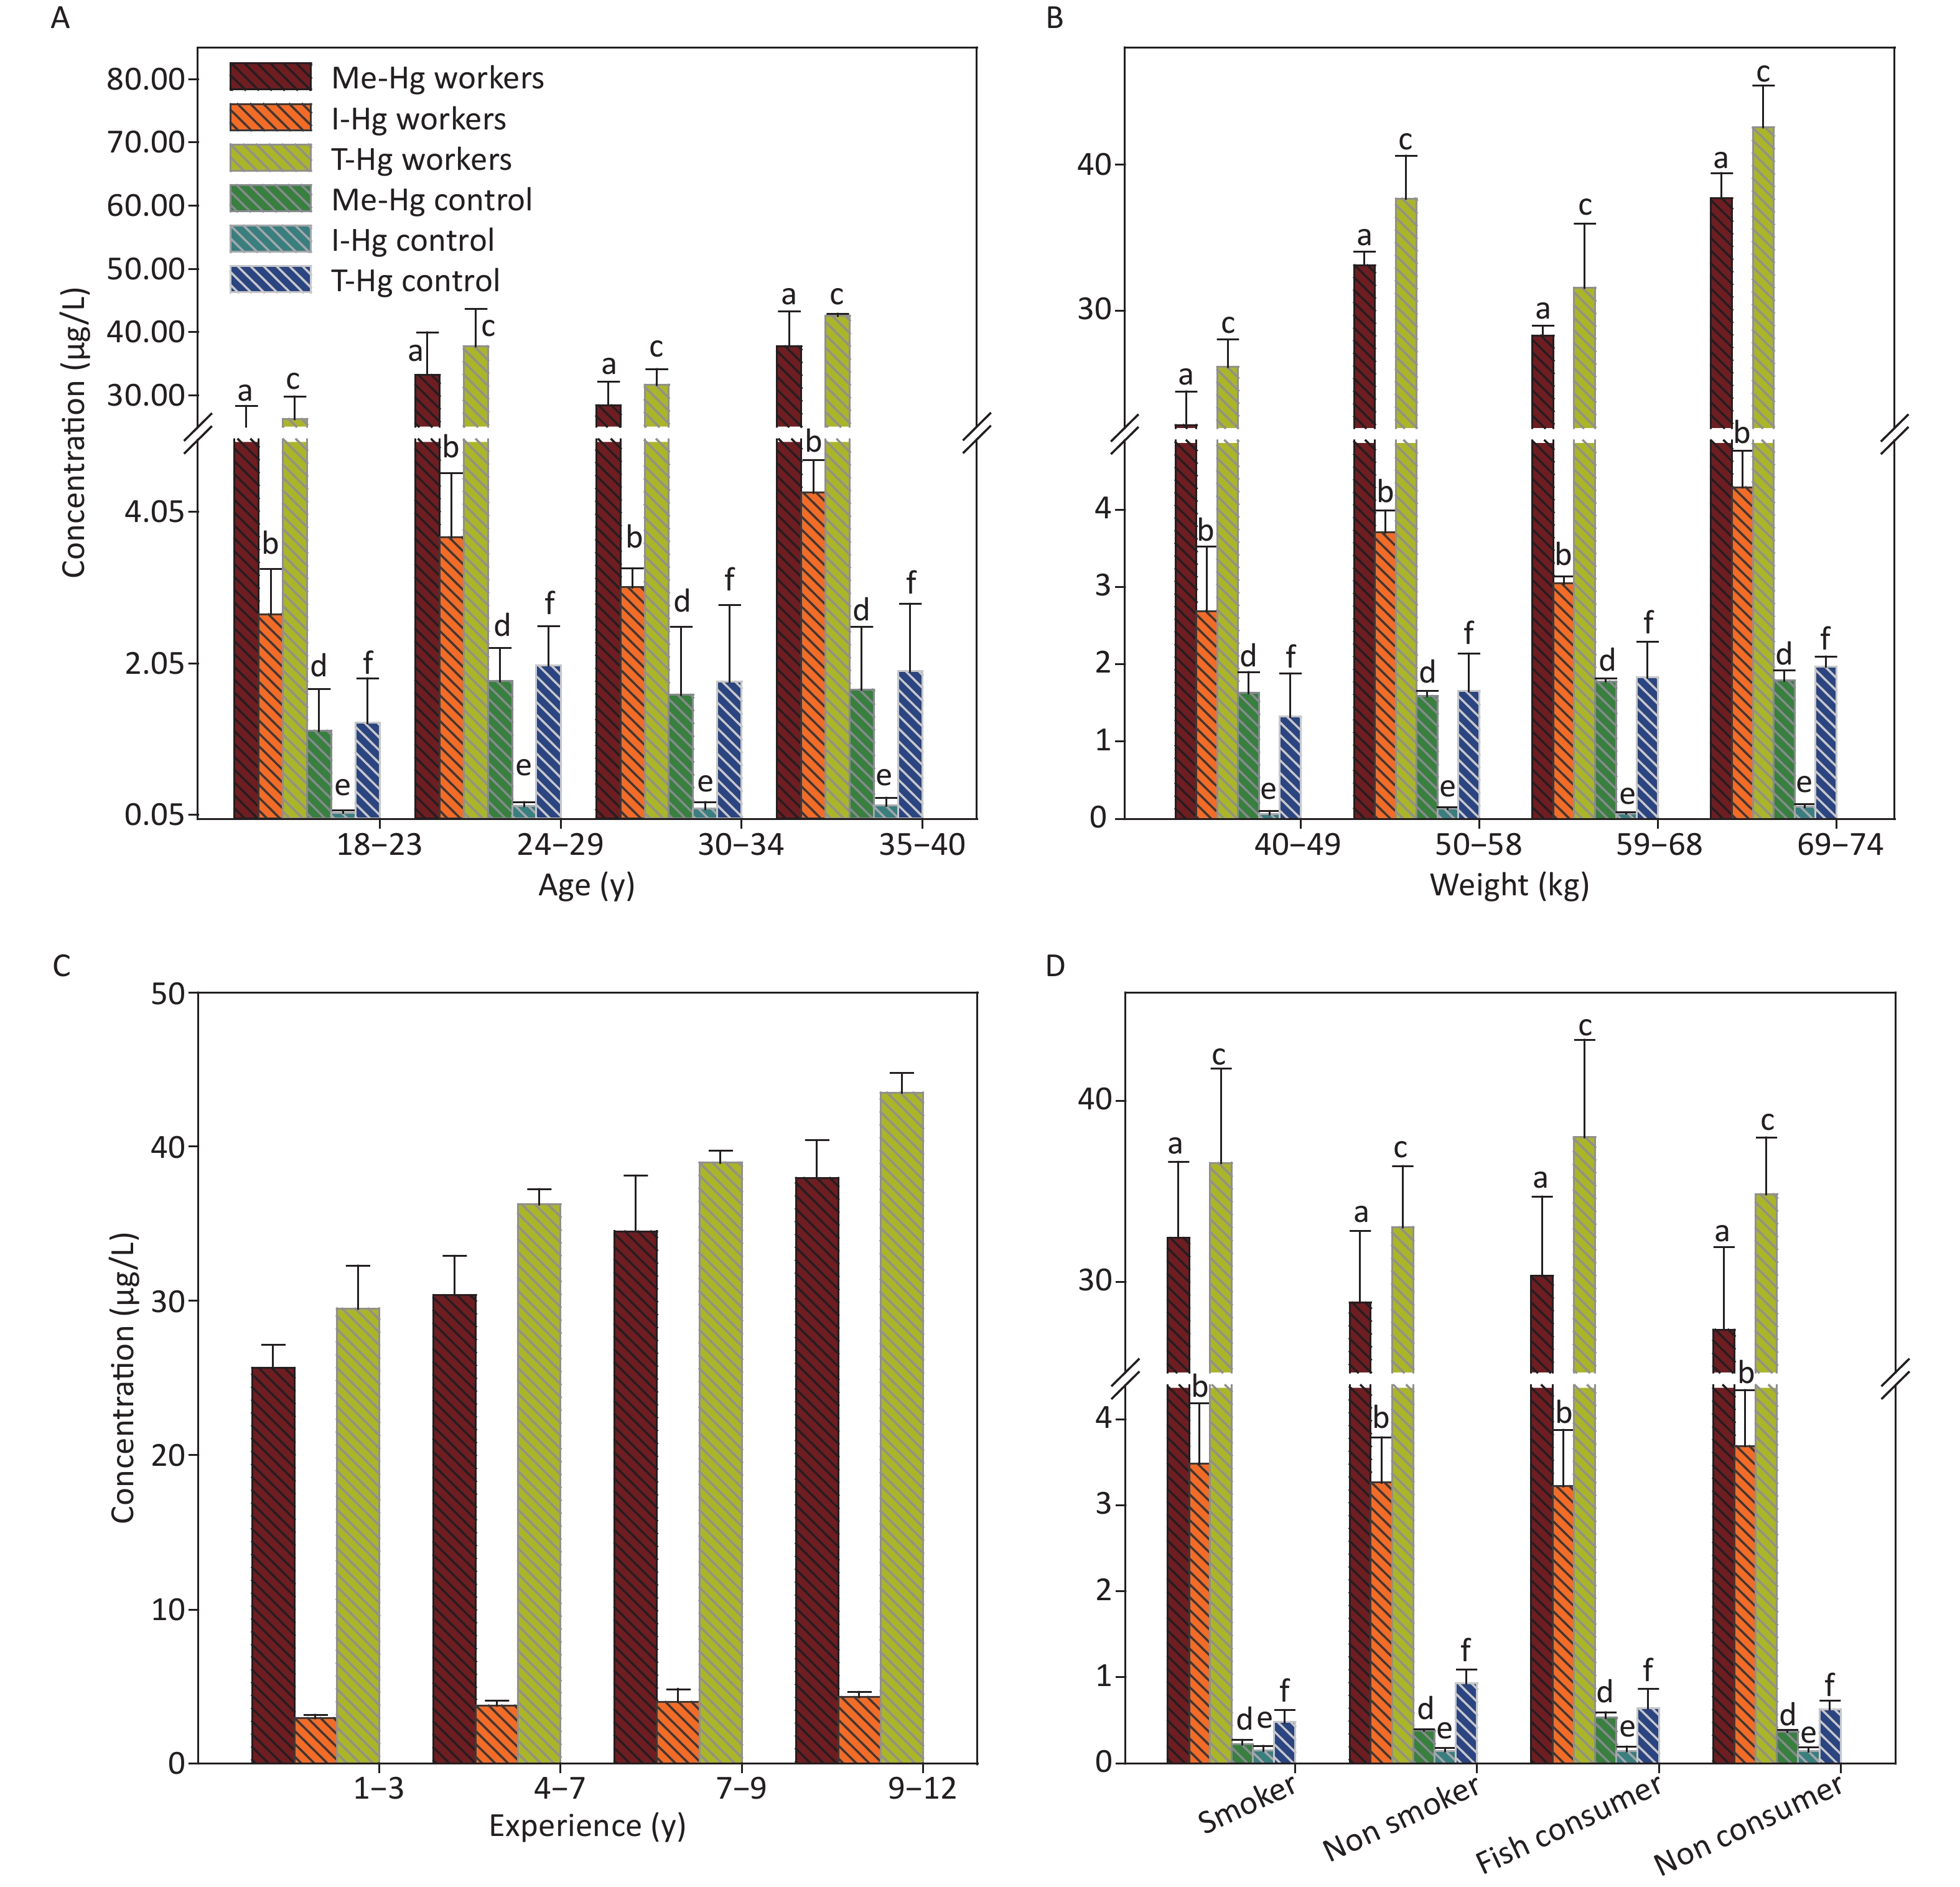
The relationship of RBCs and plasma Hg concentrations with age and weight of the exposed workers and control observed no significant result (Figures 1A, 1B, 2A, 2B), as the workers of the 2nd group with age ranged from 24–29 y and weight range from 50–59 kg is showing an elevated level of T-Hg concentration as compared to the third group which observed random changes in the Hg concentration with age and weight. The linear regression model observed that the age and weight of the workers and control has shown a significant relation only with Me-Hg in RBCs (R2 = 0.65, P = 0.0012 for Me-Hg) (R2 = 0.86, P = 0.009 for control) and no significant relation with Hg in plasma.
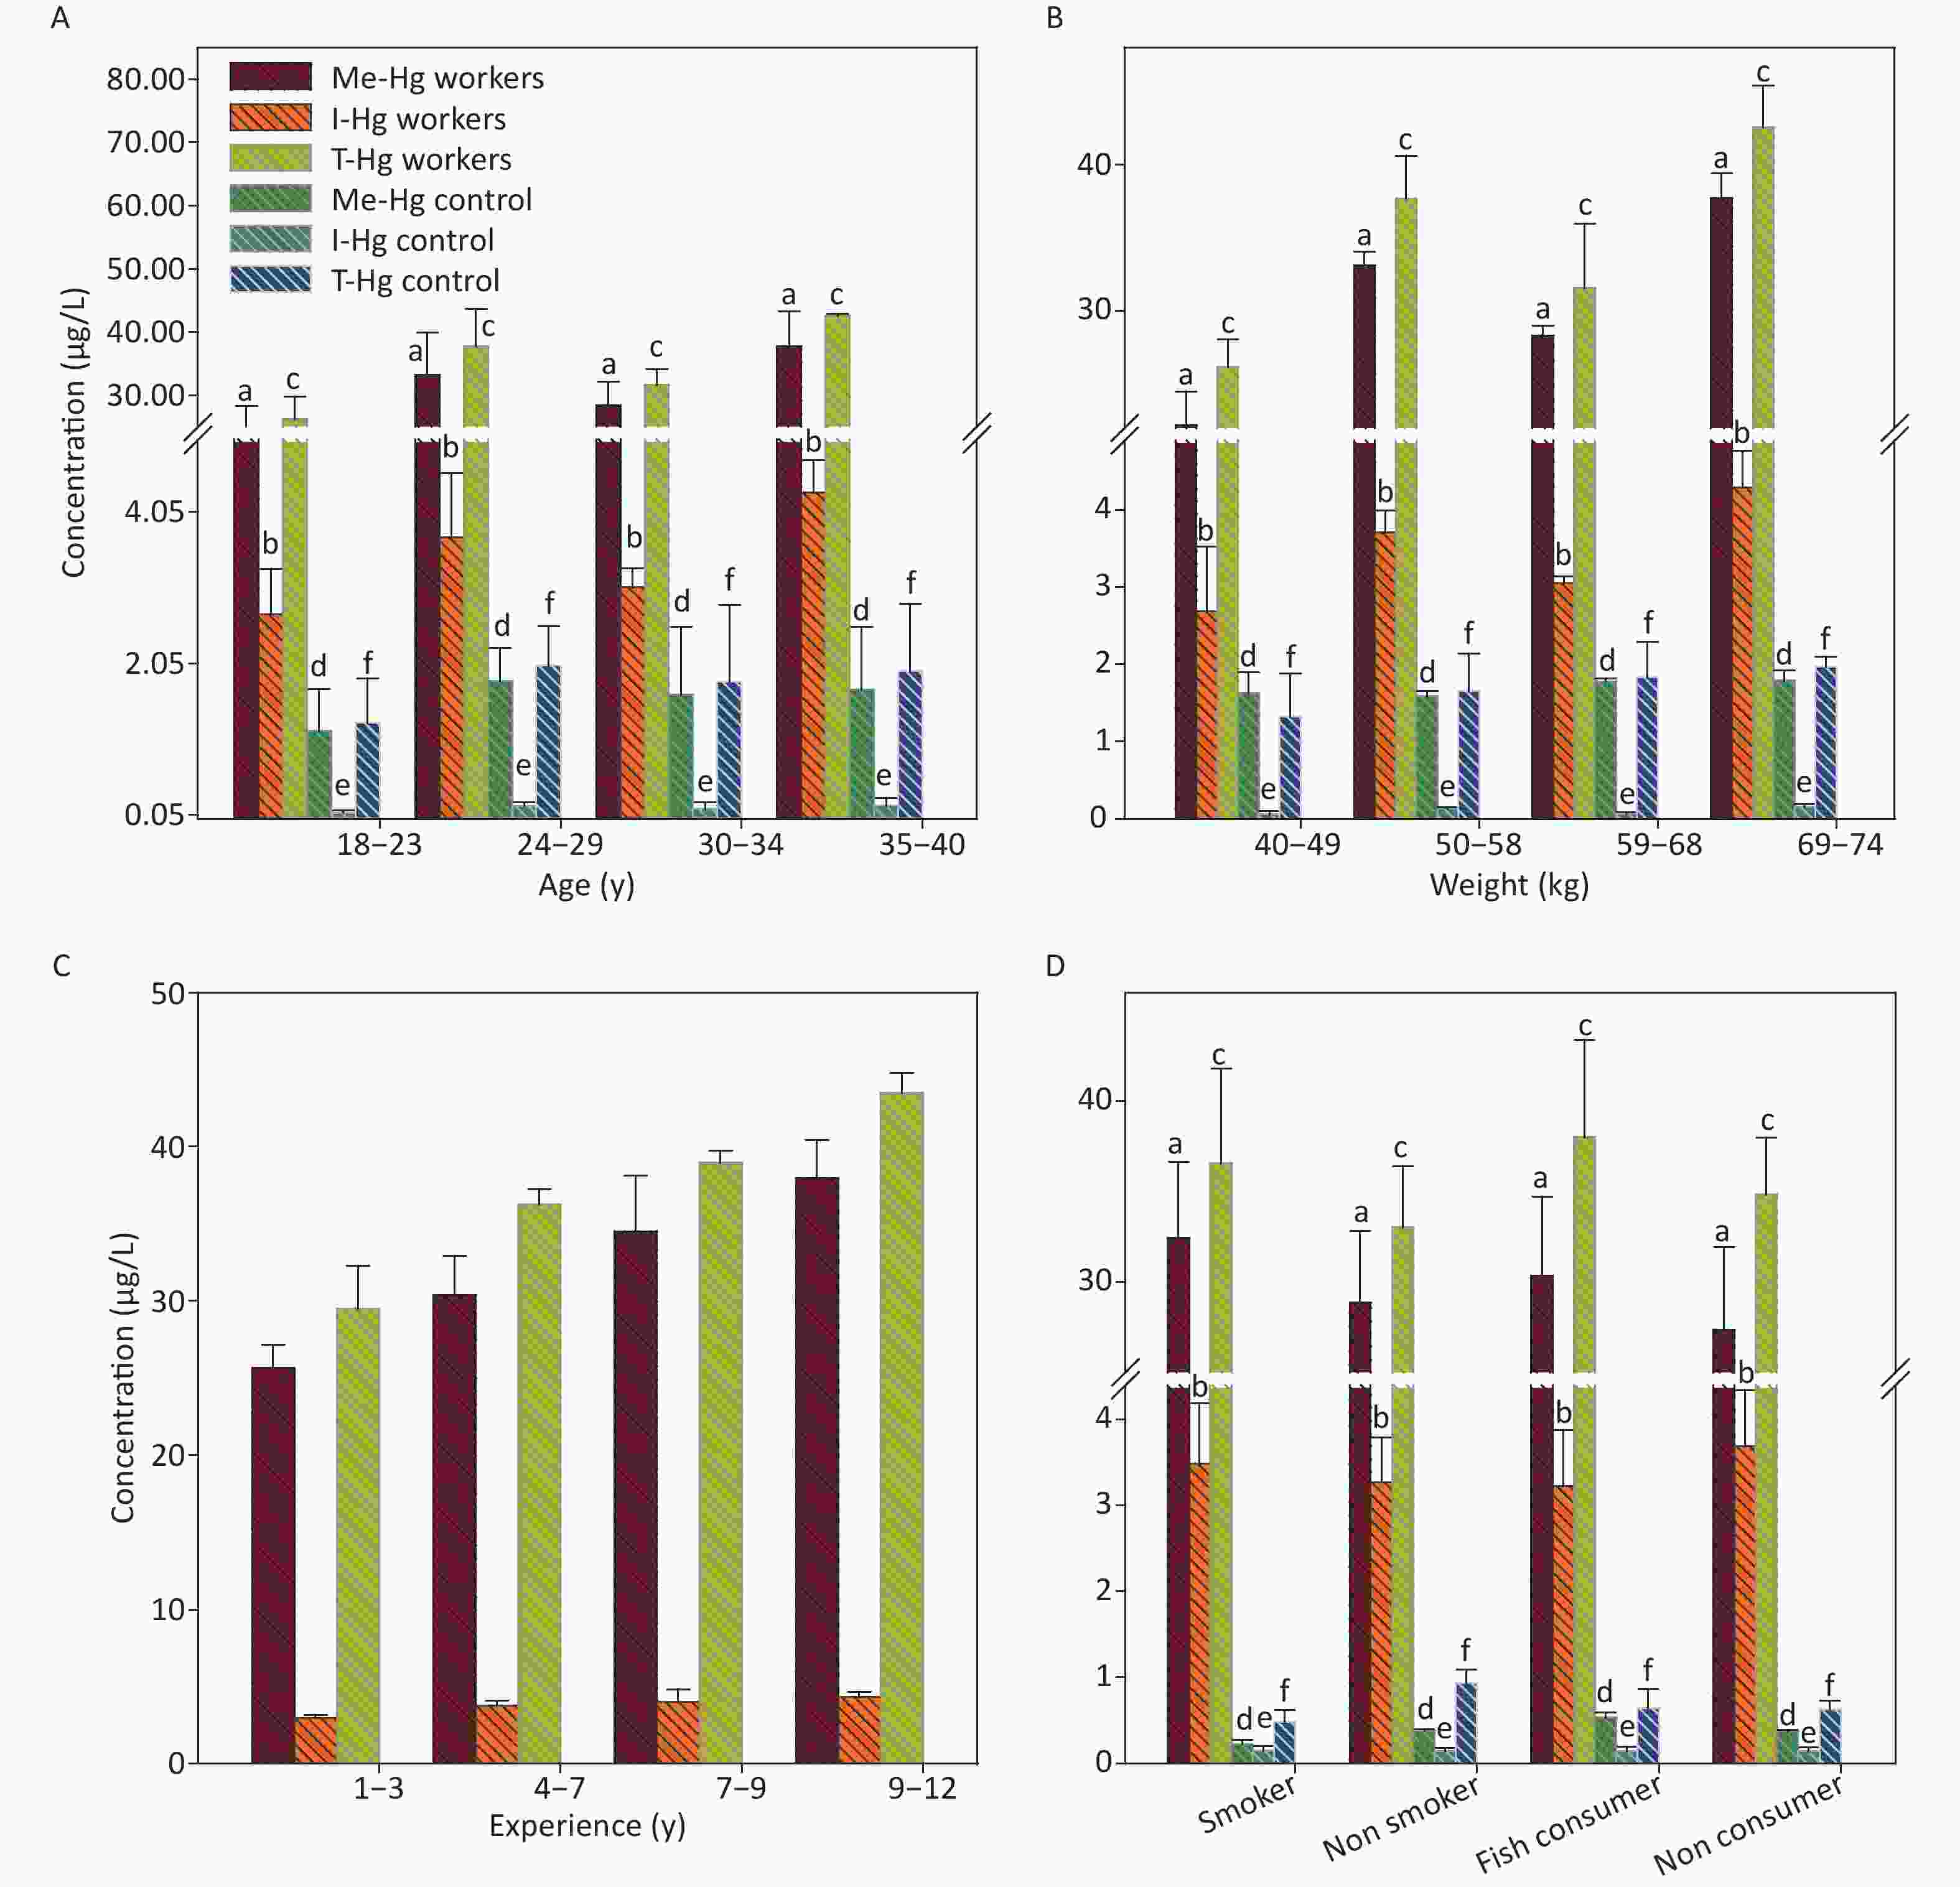
Figure 1. The concentrations of Me-Hg, I-Hg, and T-Hg in RBCs with (A) age, (B) weight, (C) experience, (D) smoking and fish consumption of the exposed workers and control subjects. Similar letters indicate no-significant difference while different letters indicate significant differences when compared with the control group.
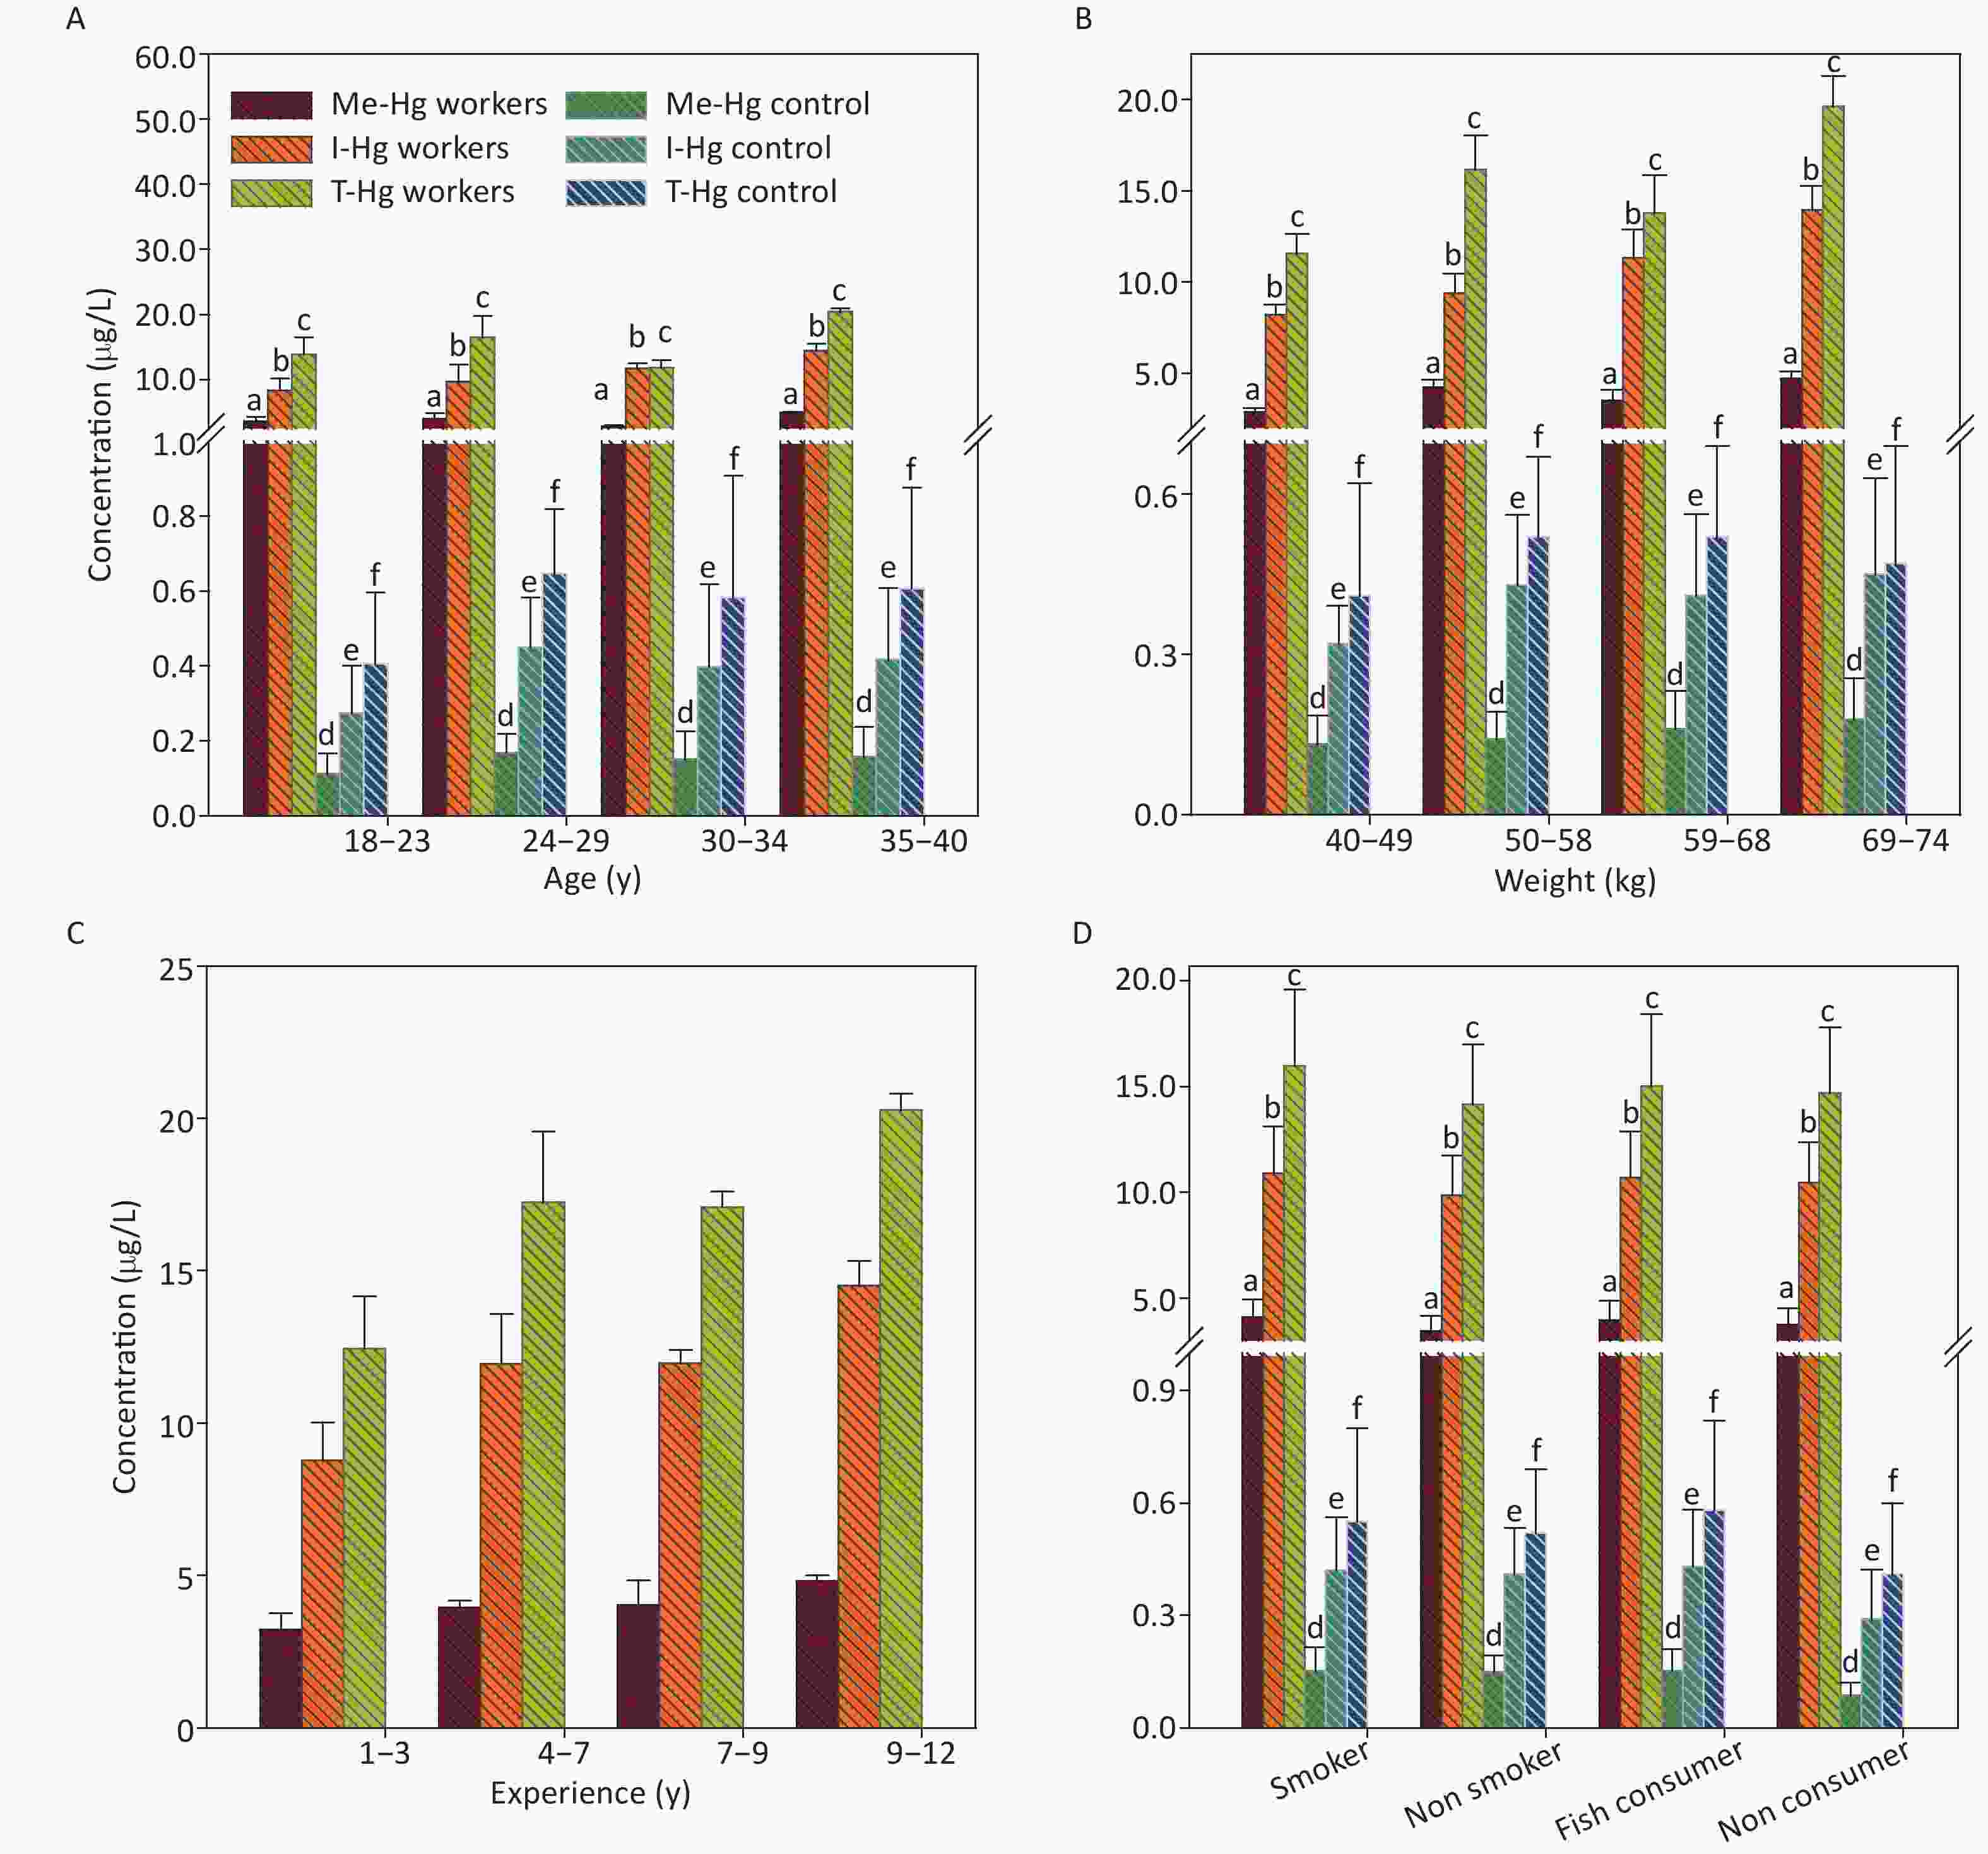
Figure 2. The concentrations of Me-Hg, I-Hg, and T-Hg in plasma with (A) age, (B) weight, (C) experience, (D) smoking and fish consumption of the exposed workers and control subjects. Similar letters indicate no-significant difference while different letters indicate significant differences when compared with the control group.
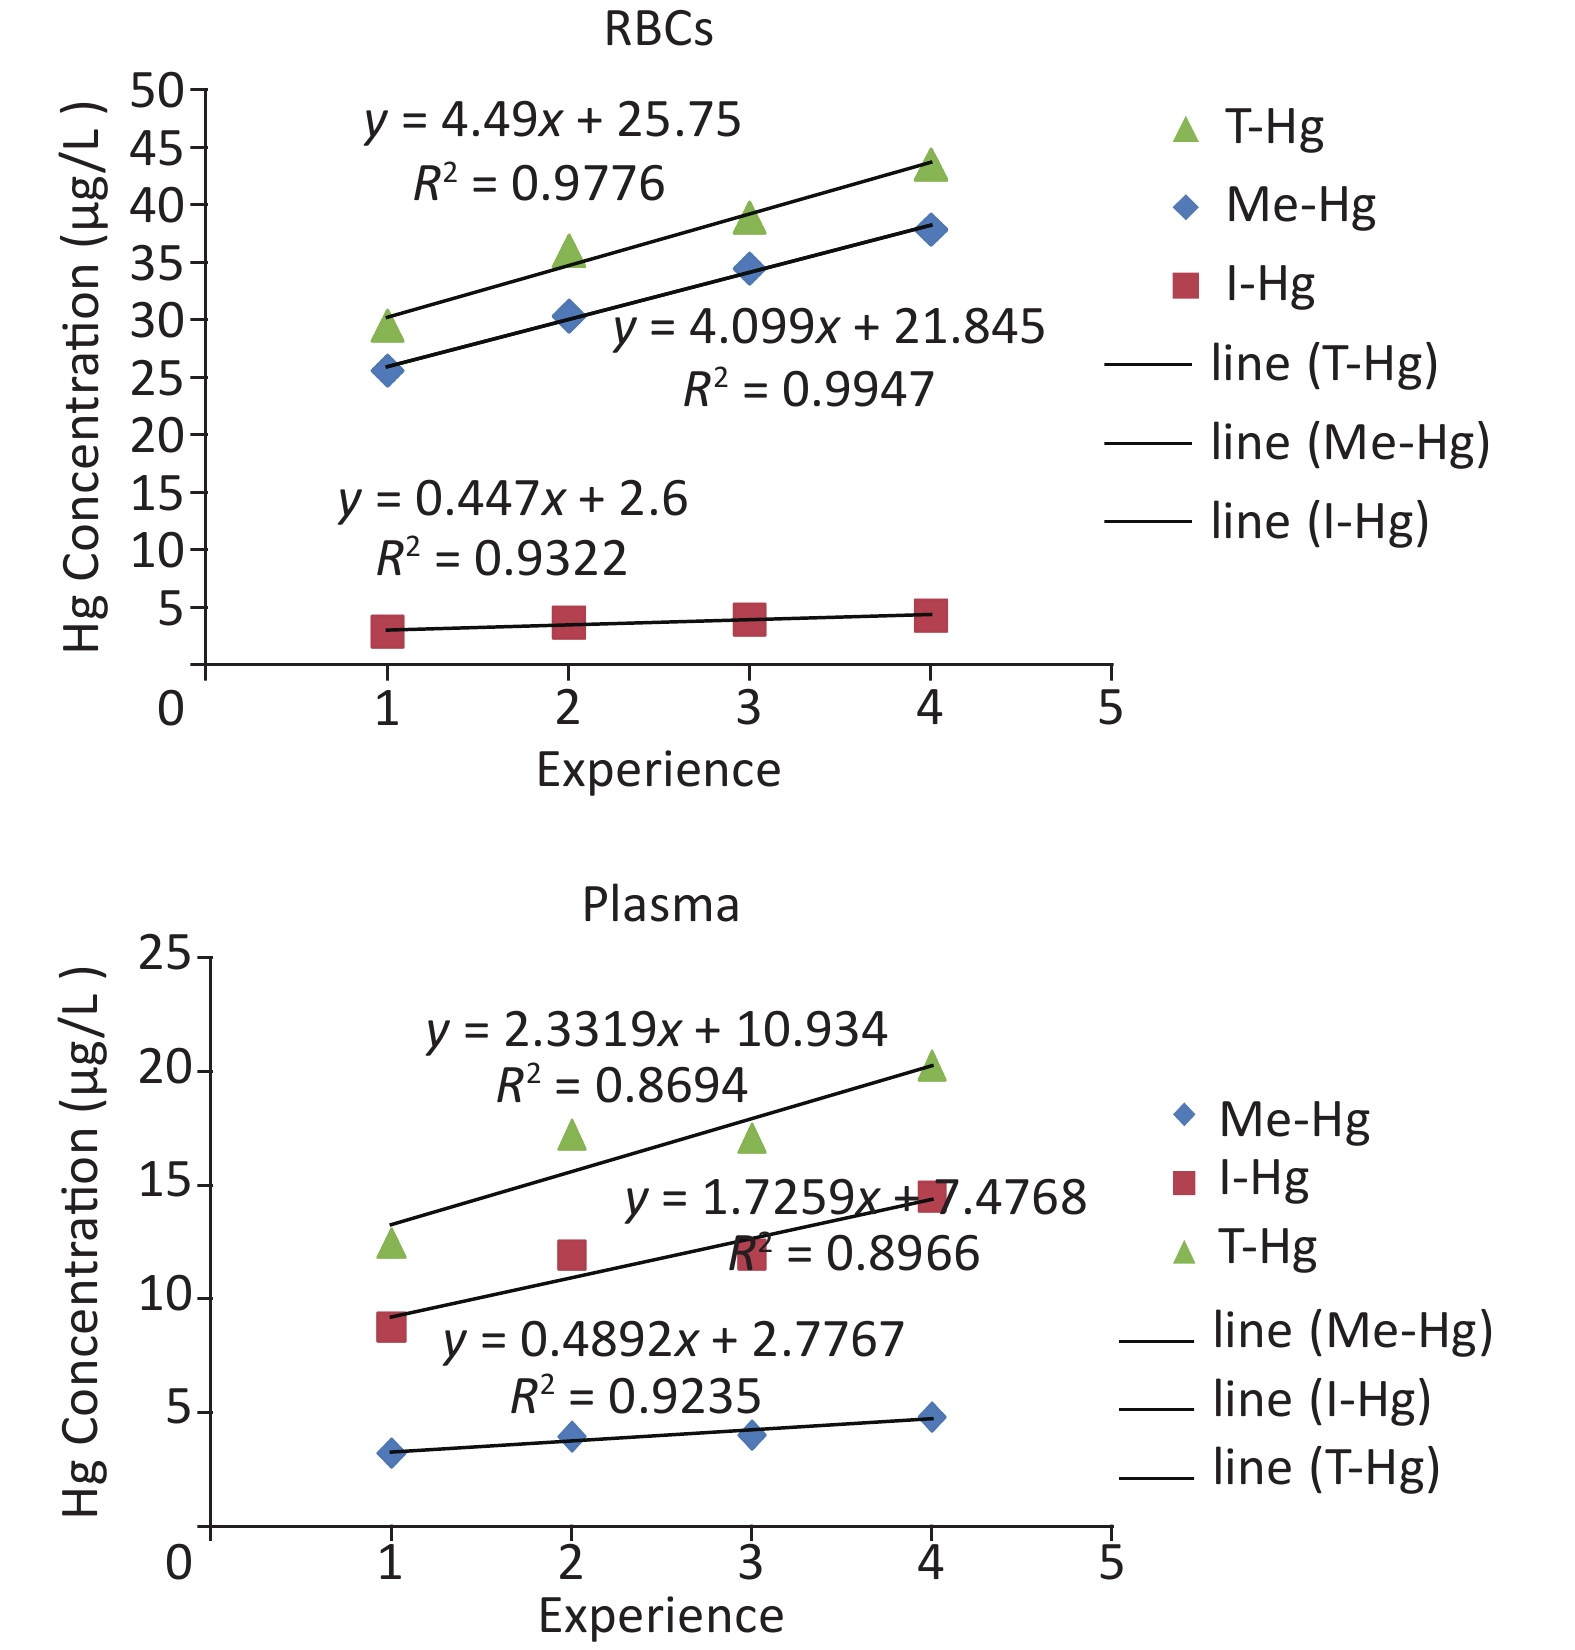
The long-term Hg exposure was found to be directly related with the elevated concentrations of the Hg species (Figure 1C) which was assessed by the relationship of the experience length and Hg concentrations in RBCs and plasma, through linear regression (Supplementary Figure S1 available in www.besjournal.com which observed that the Hg accumulated with the passage of time in the blood after exposure for long period of time [24]. Smoking and fish consumption were also significantly (P = 0.001) increasing the Hg concentration only in the RBCs of smokers and fish consumers when compared with non-smokers and non-fish consumer in exposed workers (Figure 1D) [24-26], but all workers were using fish in little quantity (once in a month) [27]. However in control, the smokers RBCs and plasma concentration (0.84 µg/L, 0.25 µg/L respectively) is higher as compared to non smokers RBCs and plasma concentration (0.57 µg/L, 0.17 µg/L). Similarly the fish consumers RBCs (0.64 µg/L) and plasma (0.43 µg/L) concentration was also found higher than non fish consumers (0.45 µg/L RBCs) (0.16 µg/L plasma) in control individuals.
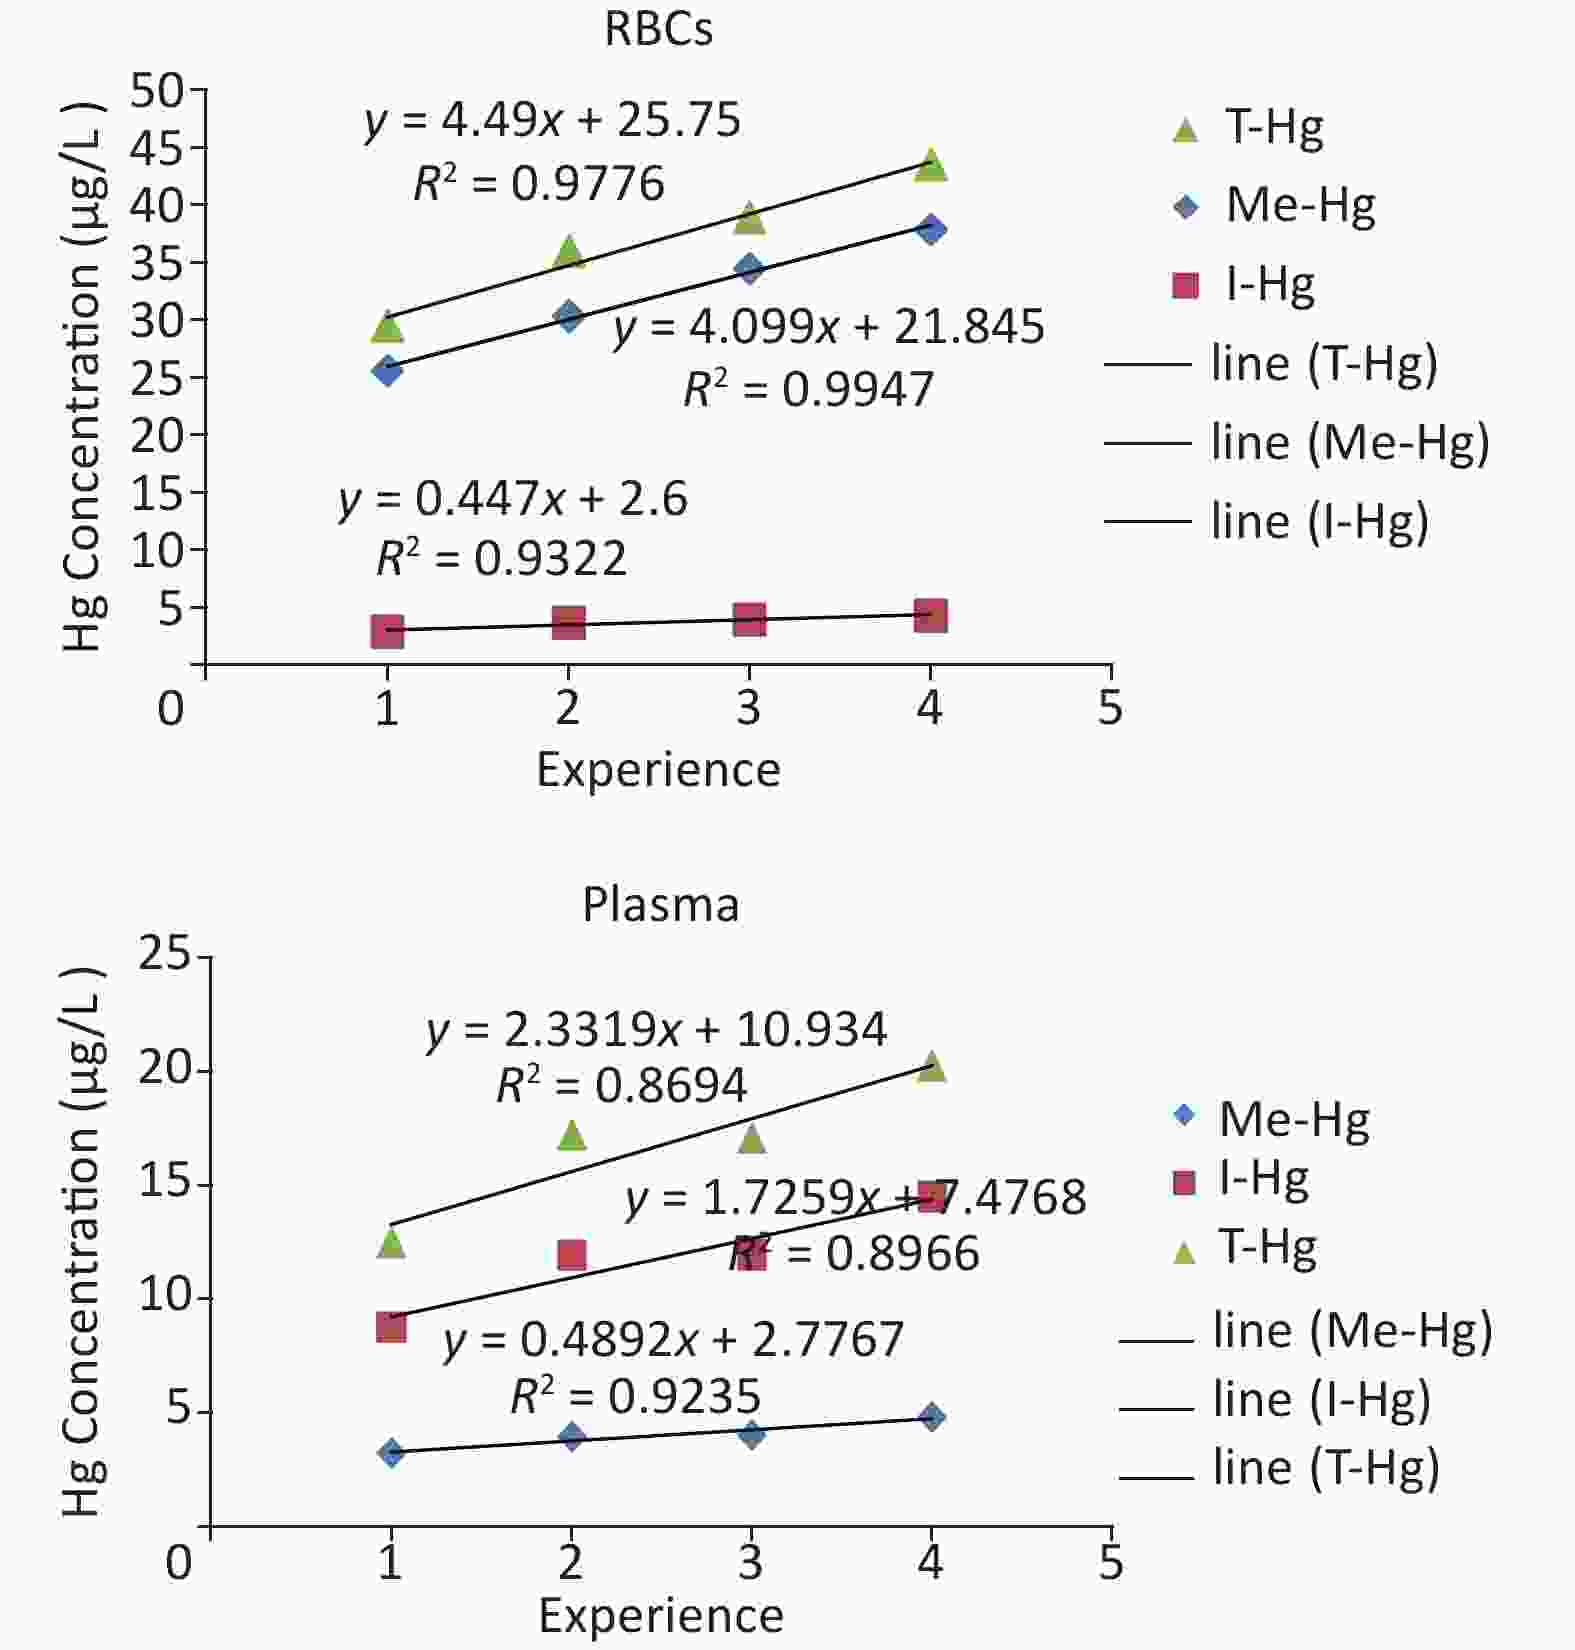
Figure S1. The linear regression between experience and Hg concentration in the blood (RBCs, Plasma) of the workers.
The distributions of Me-Hg and I-Hg in the whole blood (RBCs and plasma) were calculated as 75%:25% respectively because maximum part of the blood is made up of RBCs [24,28,29]. This percentage also confirms the above mentioned results.
-
The urine samples were found 90% of I-Hg whereas a small amount of organic Hg may be found due to the reason of rupturing of RBCs after spending life span of 120 days in the blood which contains bounded organic Hg as reported earlier [7, 24]. The ratio calculated between Me-Hg and I-Hg in urine was 1:10 which makes it a good indicator for I-Hg determination [30].
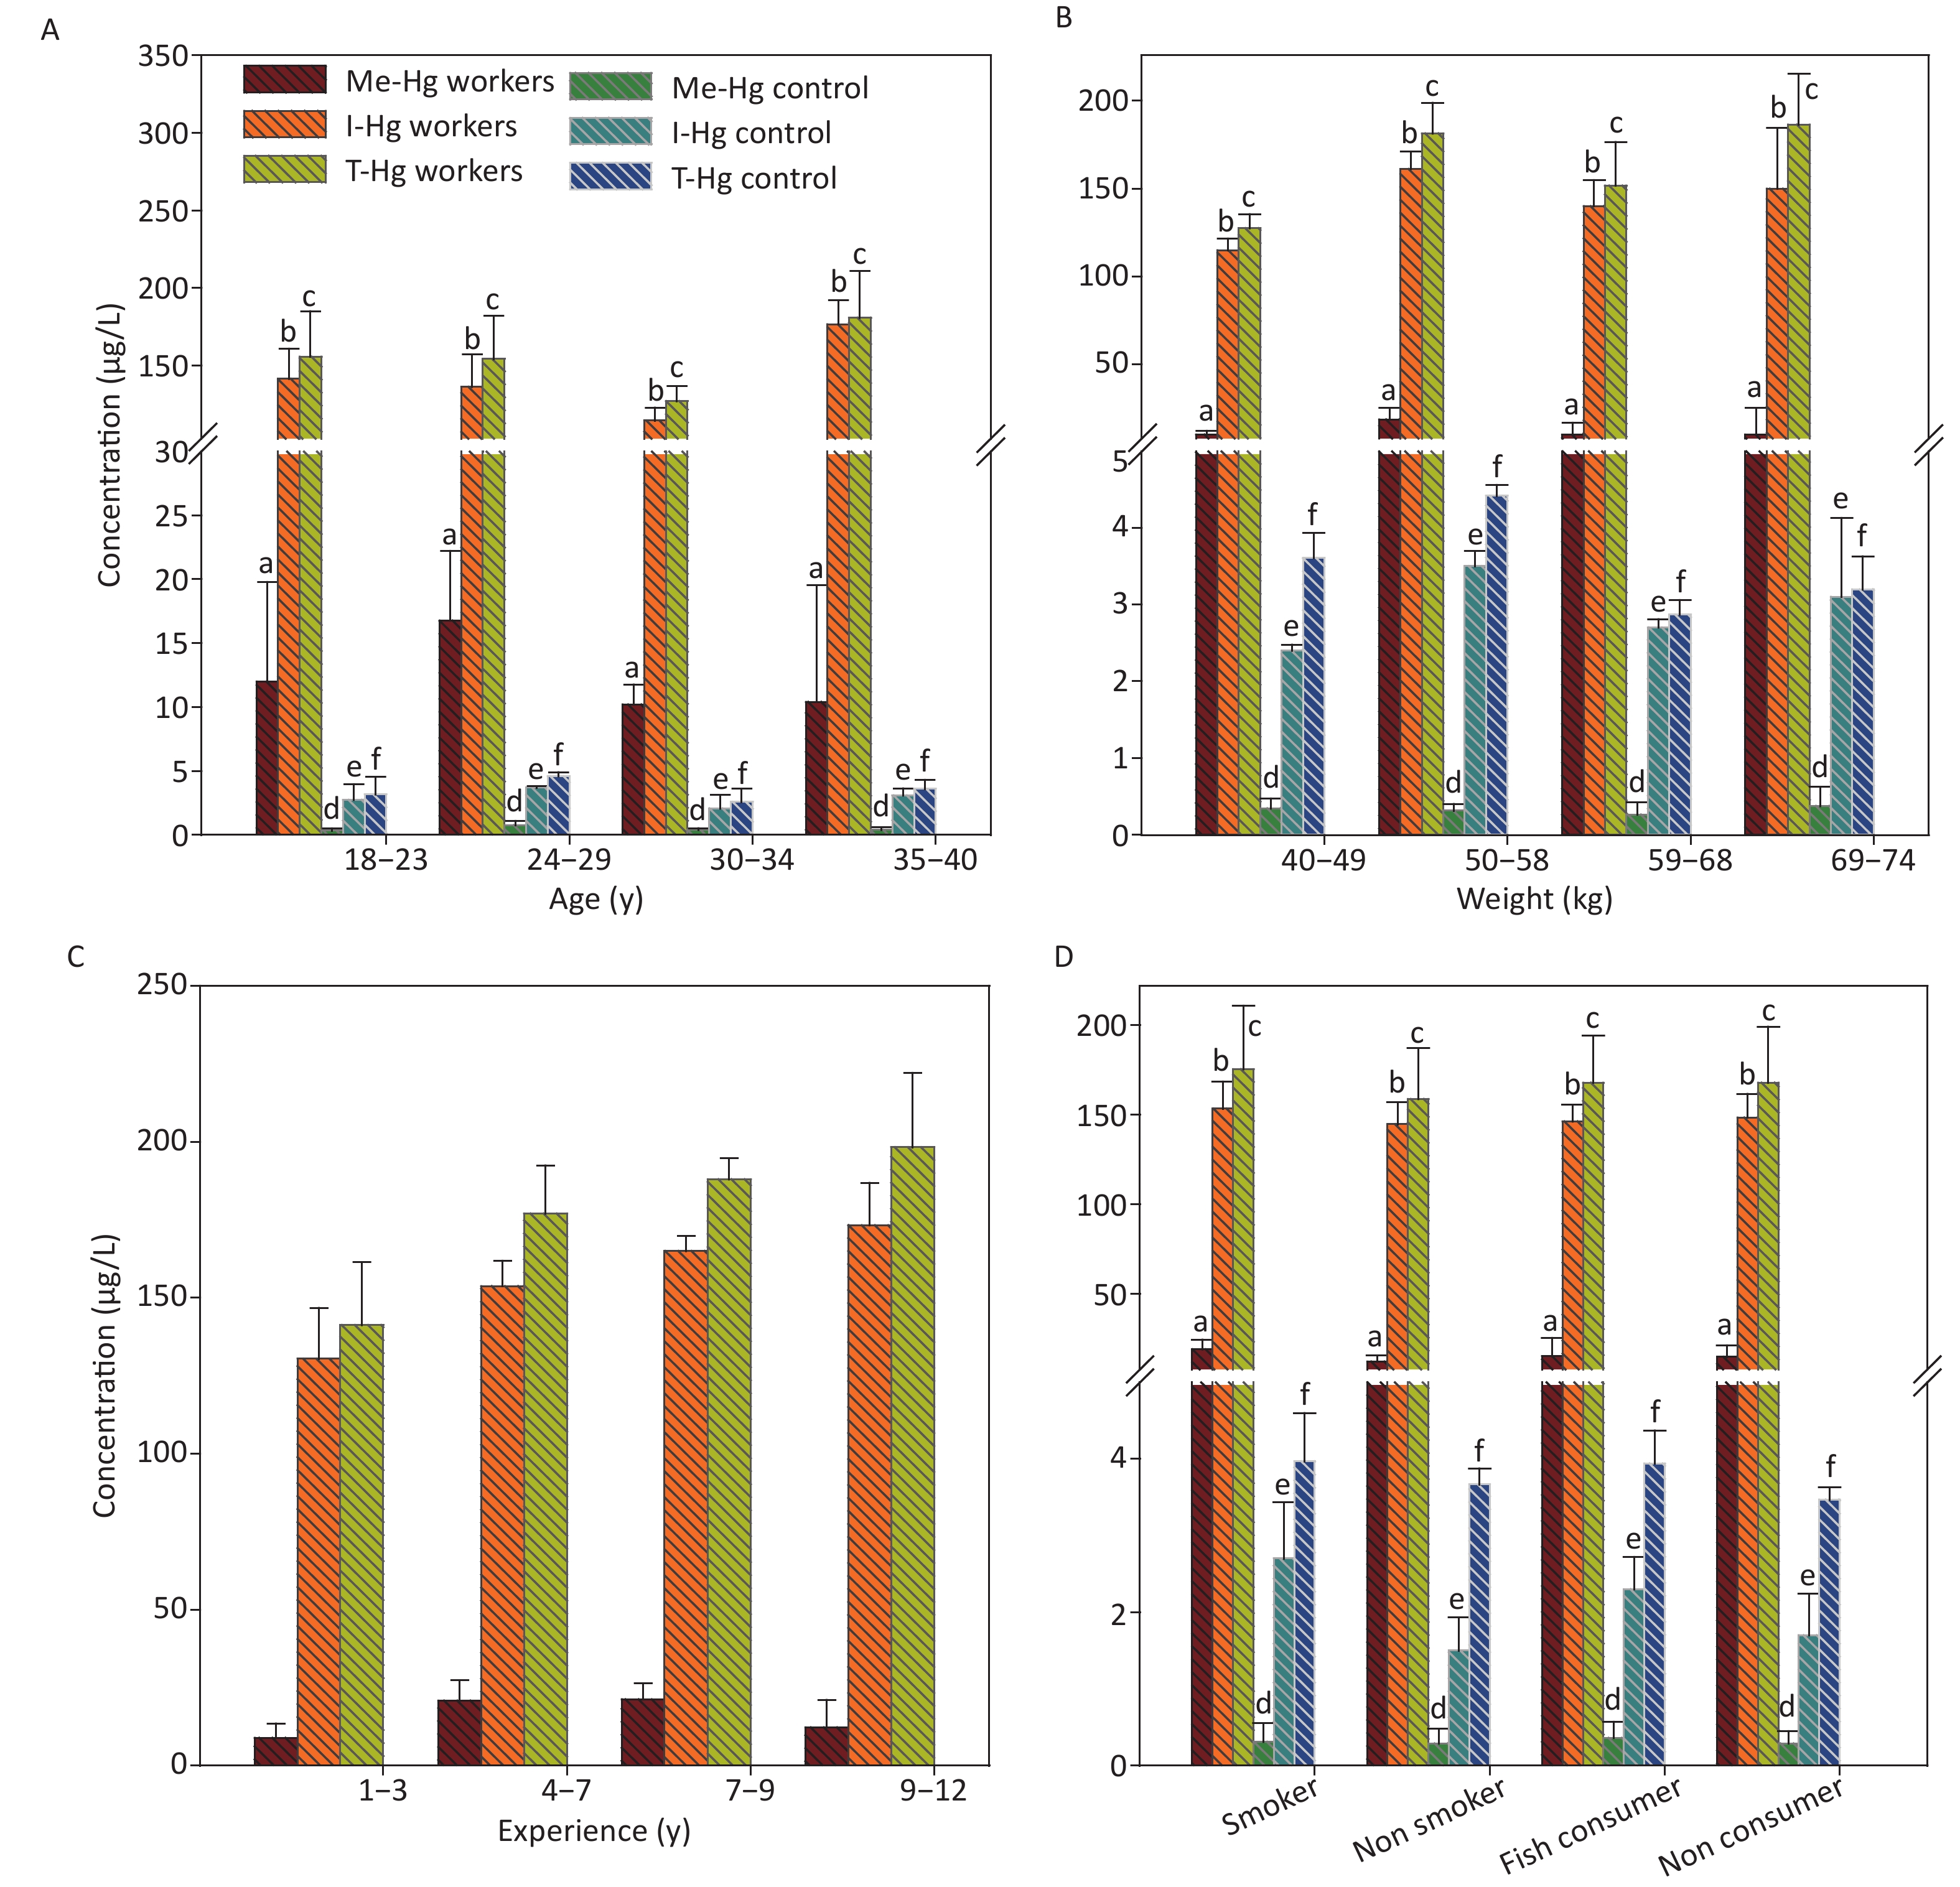
The mean concentrations of T-Hg in urine was found significantly (P < 0.001) higher in exposed workers than control subjects (Table 1) and its level was 39 times higher than the permissible limit set by WHO (T-Hg 4 µg/L) for urine Hg [31]. The linear regression model between the experience length of the workers and Hg concentration in urine indicated a direct relation for the T-Hg (R2 = 0.896, P = 0.0001) and I-Hg (R2 = 0.942, P = 0.0001) concentrations, while no significant relationship with Me-Hg (R2 = 0.5, P = 0.06) because the concentration of Me-Hg is very low in urine. The regression analysis of urine with age (R2 = 0.08, P = 0.001), weight (R2 = 0.47, P = 0.006) and fish consumption of the exposed workers observed a weak relation while no significant relation with smoking [25, 32]. In control, the urine Hg concentration with age (R2 = 0.84, P = 0.0012) and weight (R2 = 0.0002, P = 0.9) has shown significant relation while no effect with fish consumption and smoking. The reported half-life (t ½) of Hg in the urine is 25–41 days, lower than the half-life (90–120) of Hg in the blood, observed that I-Hg rapidly leaves the body than Me-Hg [33] because of increased rate of excretion through urine [24, 28, 29].
The workers with experience ranged from 9–12 y observed the highest concentration of T-Hg, Me-Hg and I-Hg in urine samples among the four selected groups and the concentration was 198.2, 12.16, 173.3 µg/L, respectively (Figure 3C).
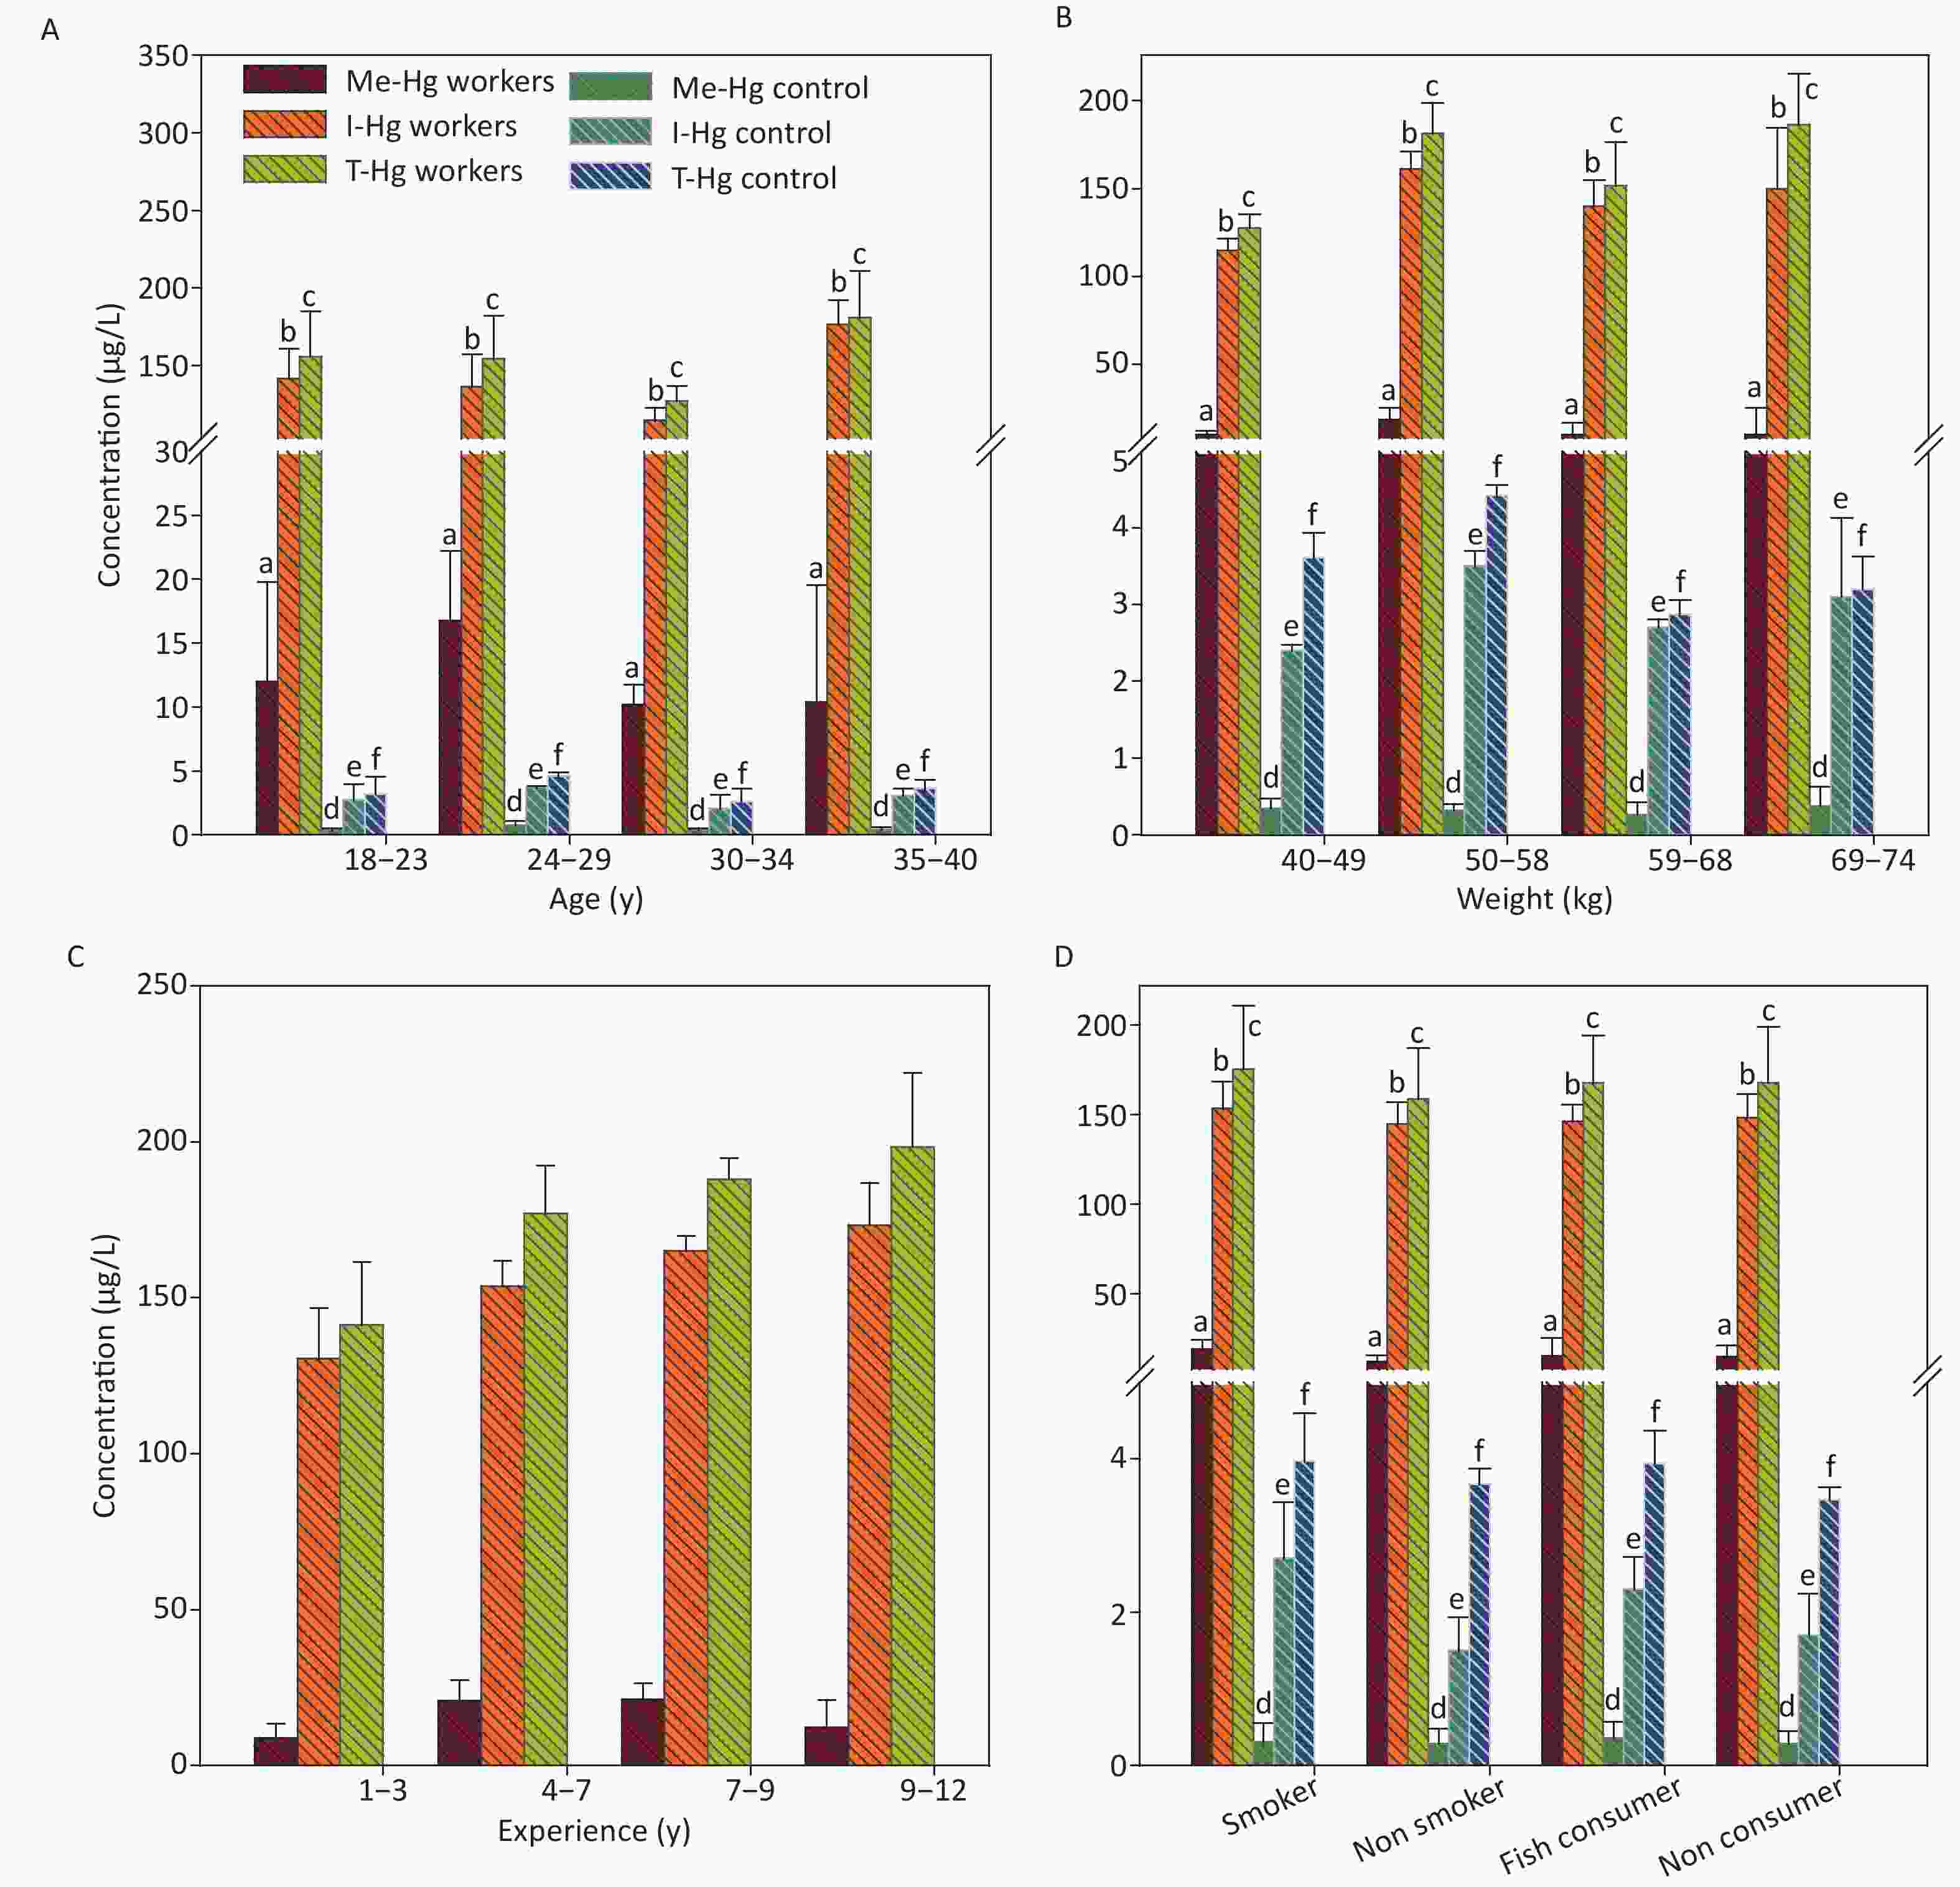
Figure 3. The concentrations of Me-Hg, I-Hg and T-Hg in urine with (A) age, (B) weight, (C) experience, (D) smoking and fish consumption of the exposed workers and control subjects. Similar letters indicate no-significant difference while different letters indicate significant differences when compared with the control group.
It was observed from the study that the workers near exhaust machine and long time working experience have a high level of Hg in their urine and are more vulnerable as compared to other workers because the machine released all of the processed Hg in the industry as a smoke.
-
Regarding Hg in hair and nails, 80%–90% of Hg in workers hair and nails was Me-Hg [30] and its ratio with I-Hg was found 10:1 for both hair and nails. The reported half-life (t ½) of the hair Hg is 65 days with the range of 35-100 days and a small amount of I-Hg was also detected. Me-Hg is lipophilic in nature and strongly attached to the sulfhydryl groups of the protein which are abundantly present in the hair and nails [7, 34].
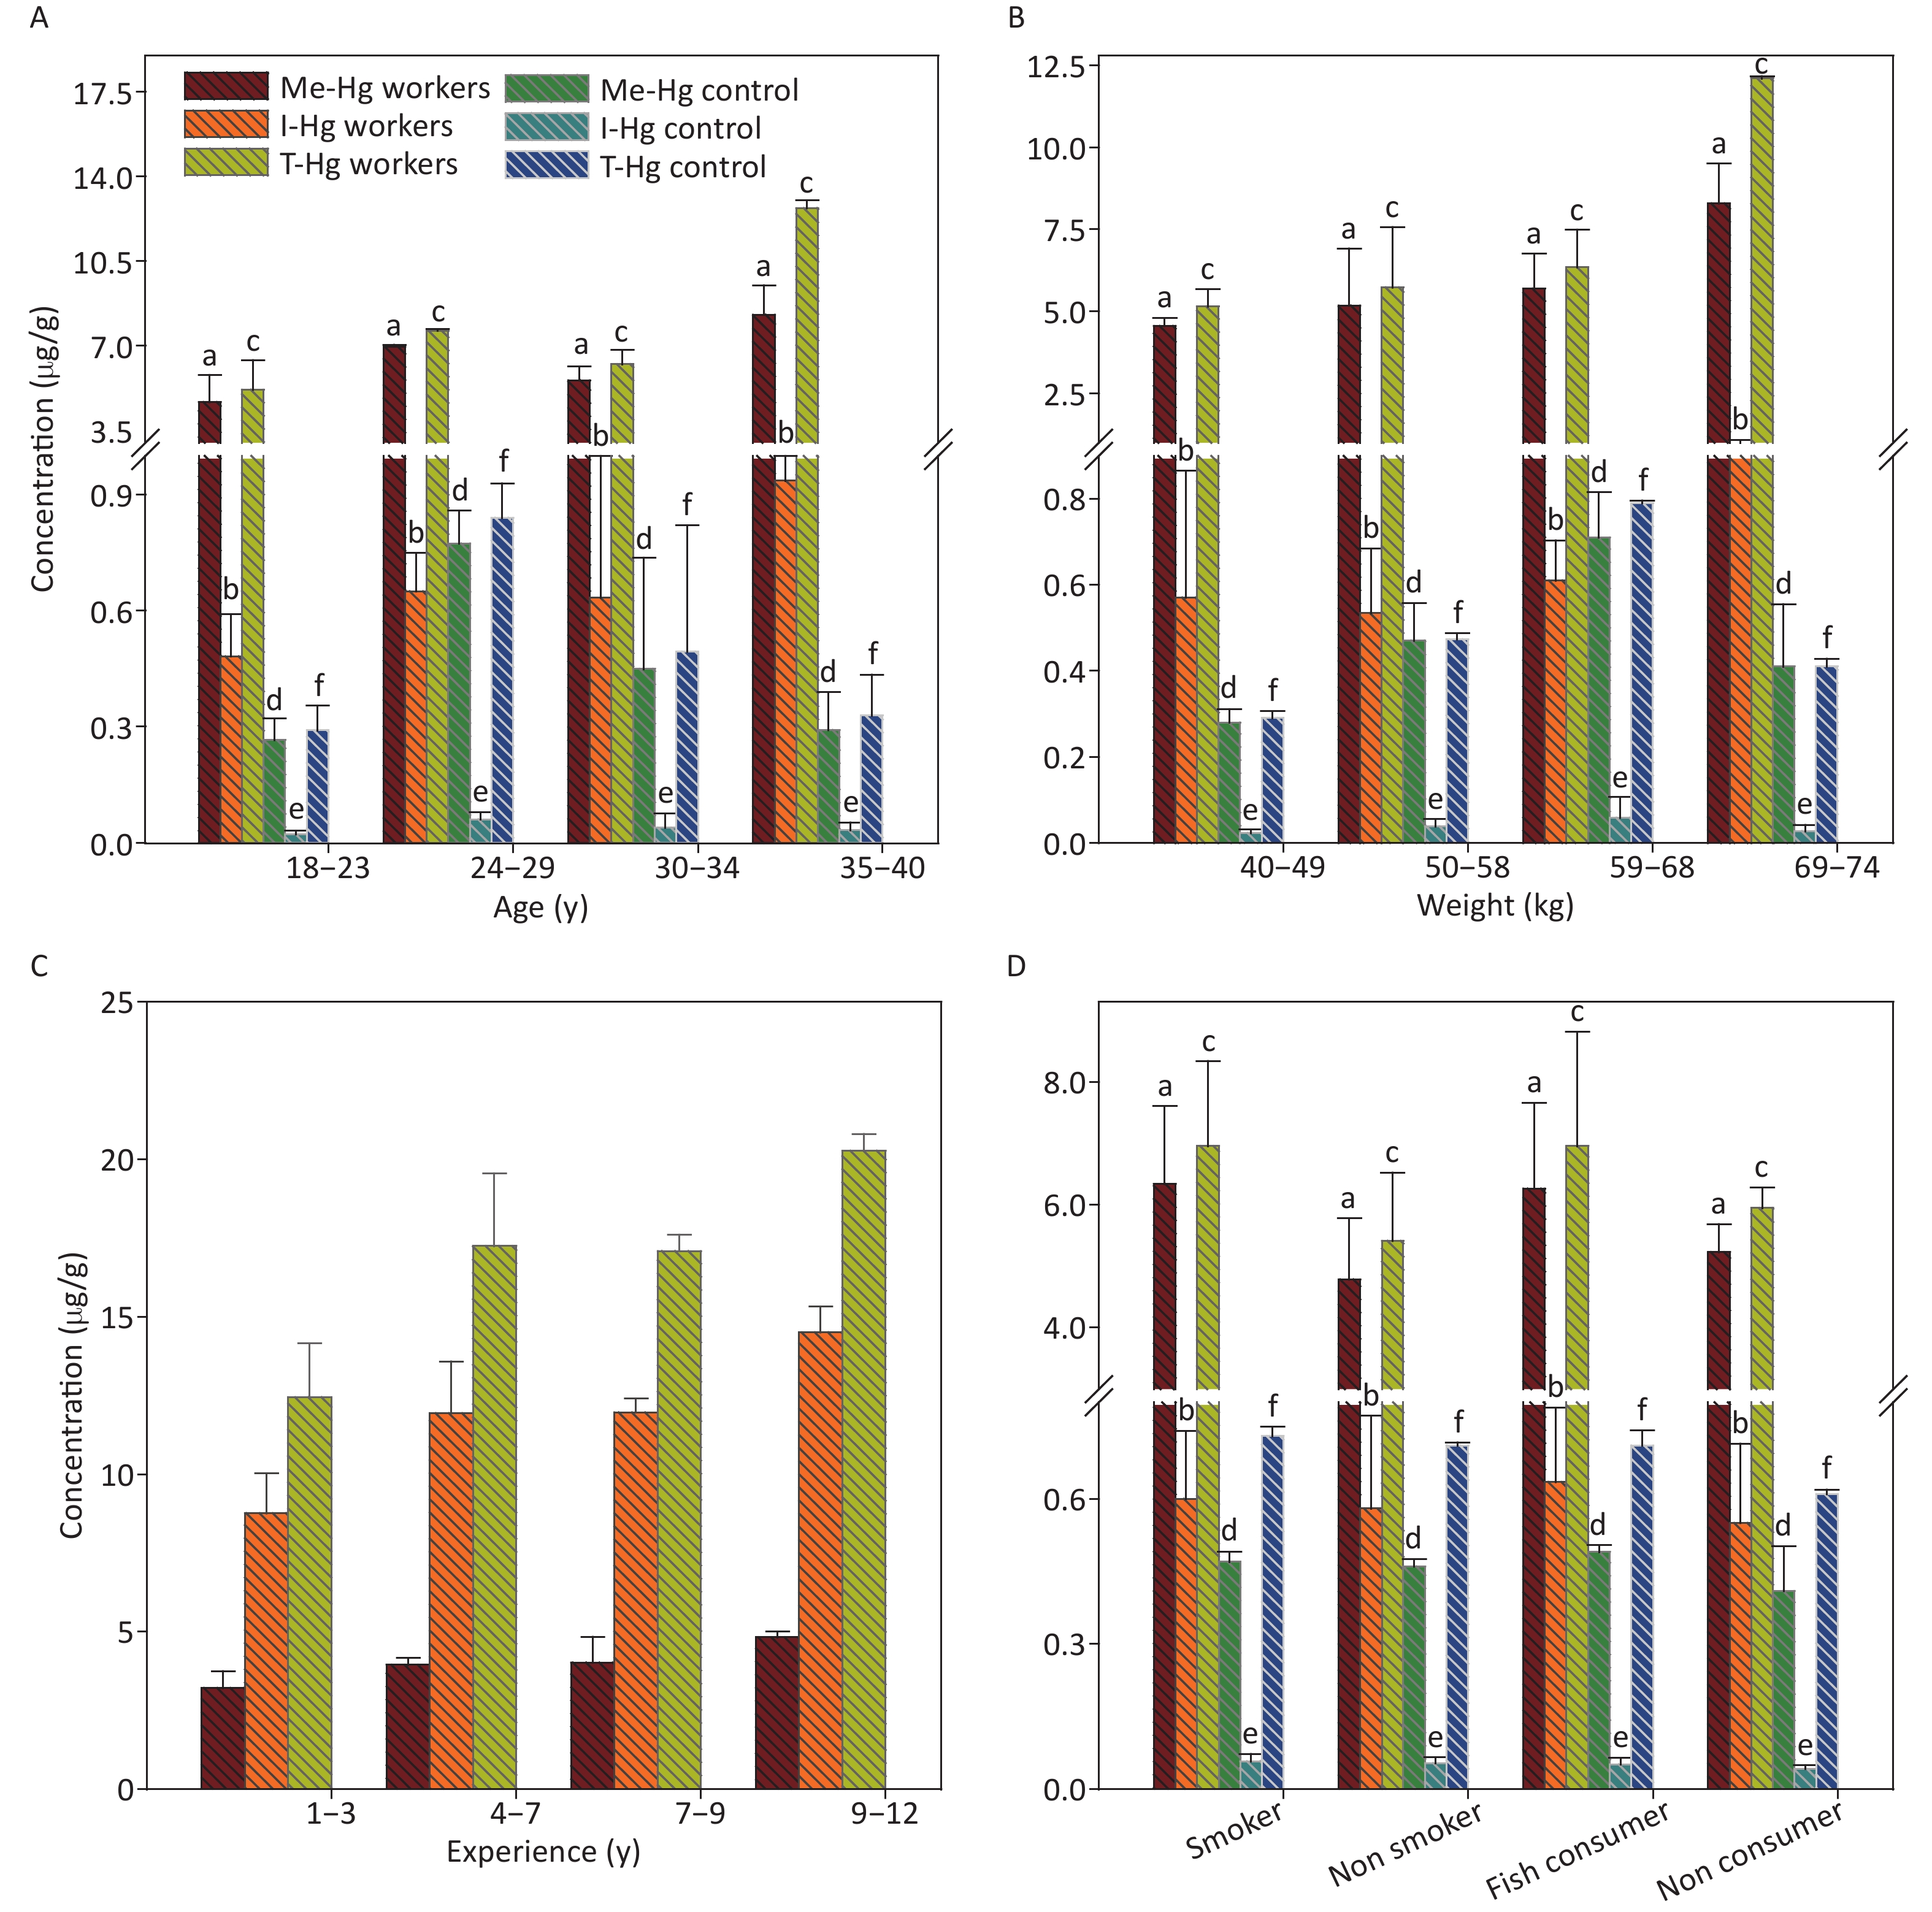
It was observed that the mean Hg concentrations in hair was determined significantly (P < 0.001) higher in exposed workers (T-Hg, 3.5) (Me-Hg, 3.2) (T-Hg, 0.3 µg/g) as compared to control 0.33, 0.3, and 0.03 µg/g, respectively (Table 1), and the Me-Hg in the hair samples was found 3 times higher than the permissible limit (less than 1 µg/g) set for hair Hg [20]. Statistically strong relation was found between Me-Hg in the hair and experience of the workers while no significant relation was found between hair Hg and fish consumption in exposed workers. The age, weight and smoking have no significant effect on hair Hg concentrations which supports the findings reported in previous paper [35, 36]. However in control, the Hg concentration in hair observed a significant relation with both age, weight, fish consumption (R2 = 0.0002, P = 0.91) and no significant relation with smoking (Figure 4).
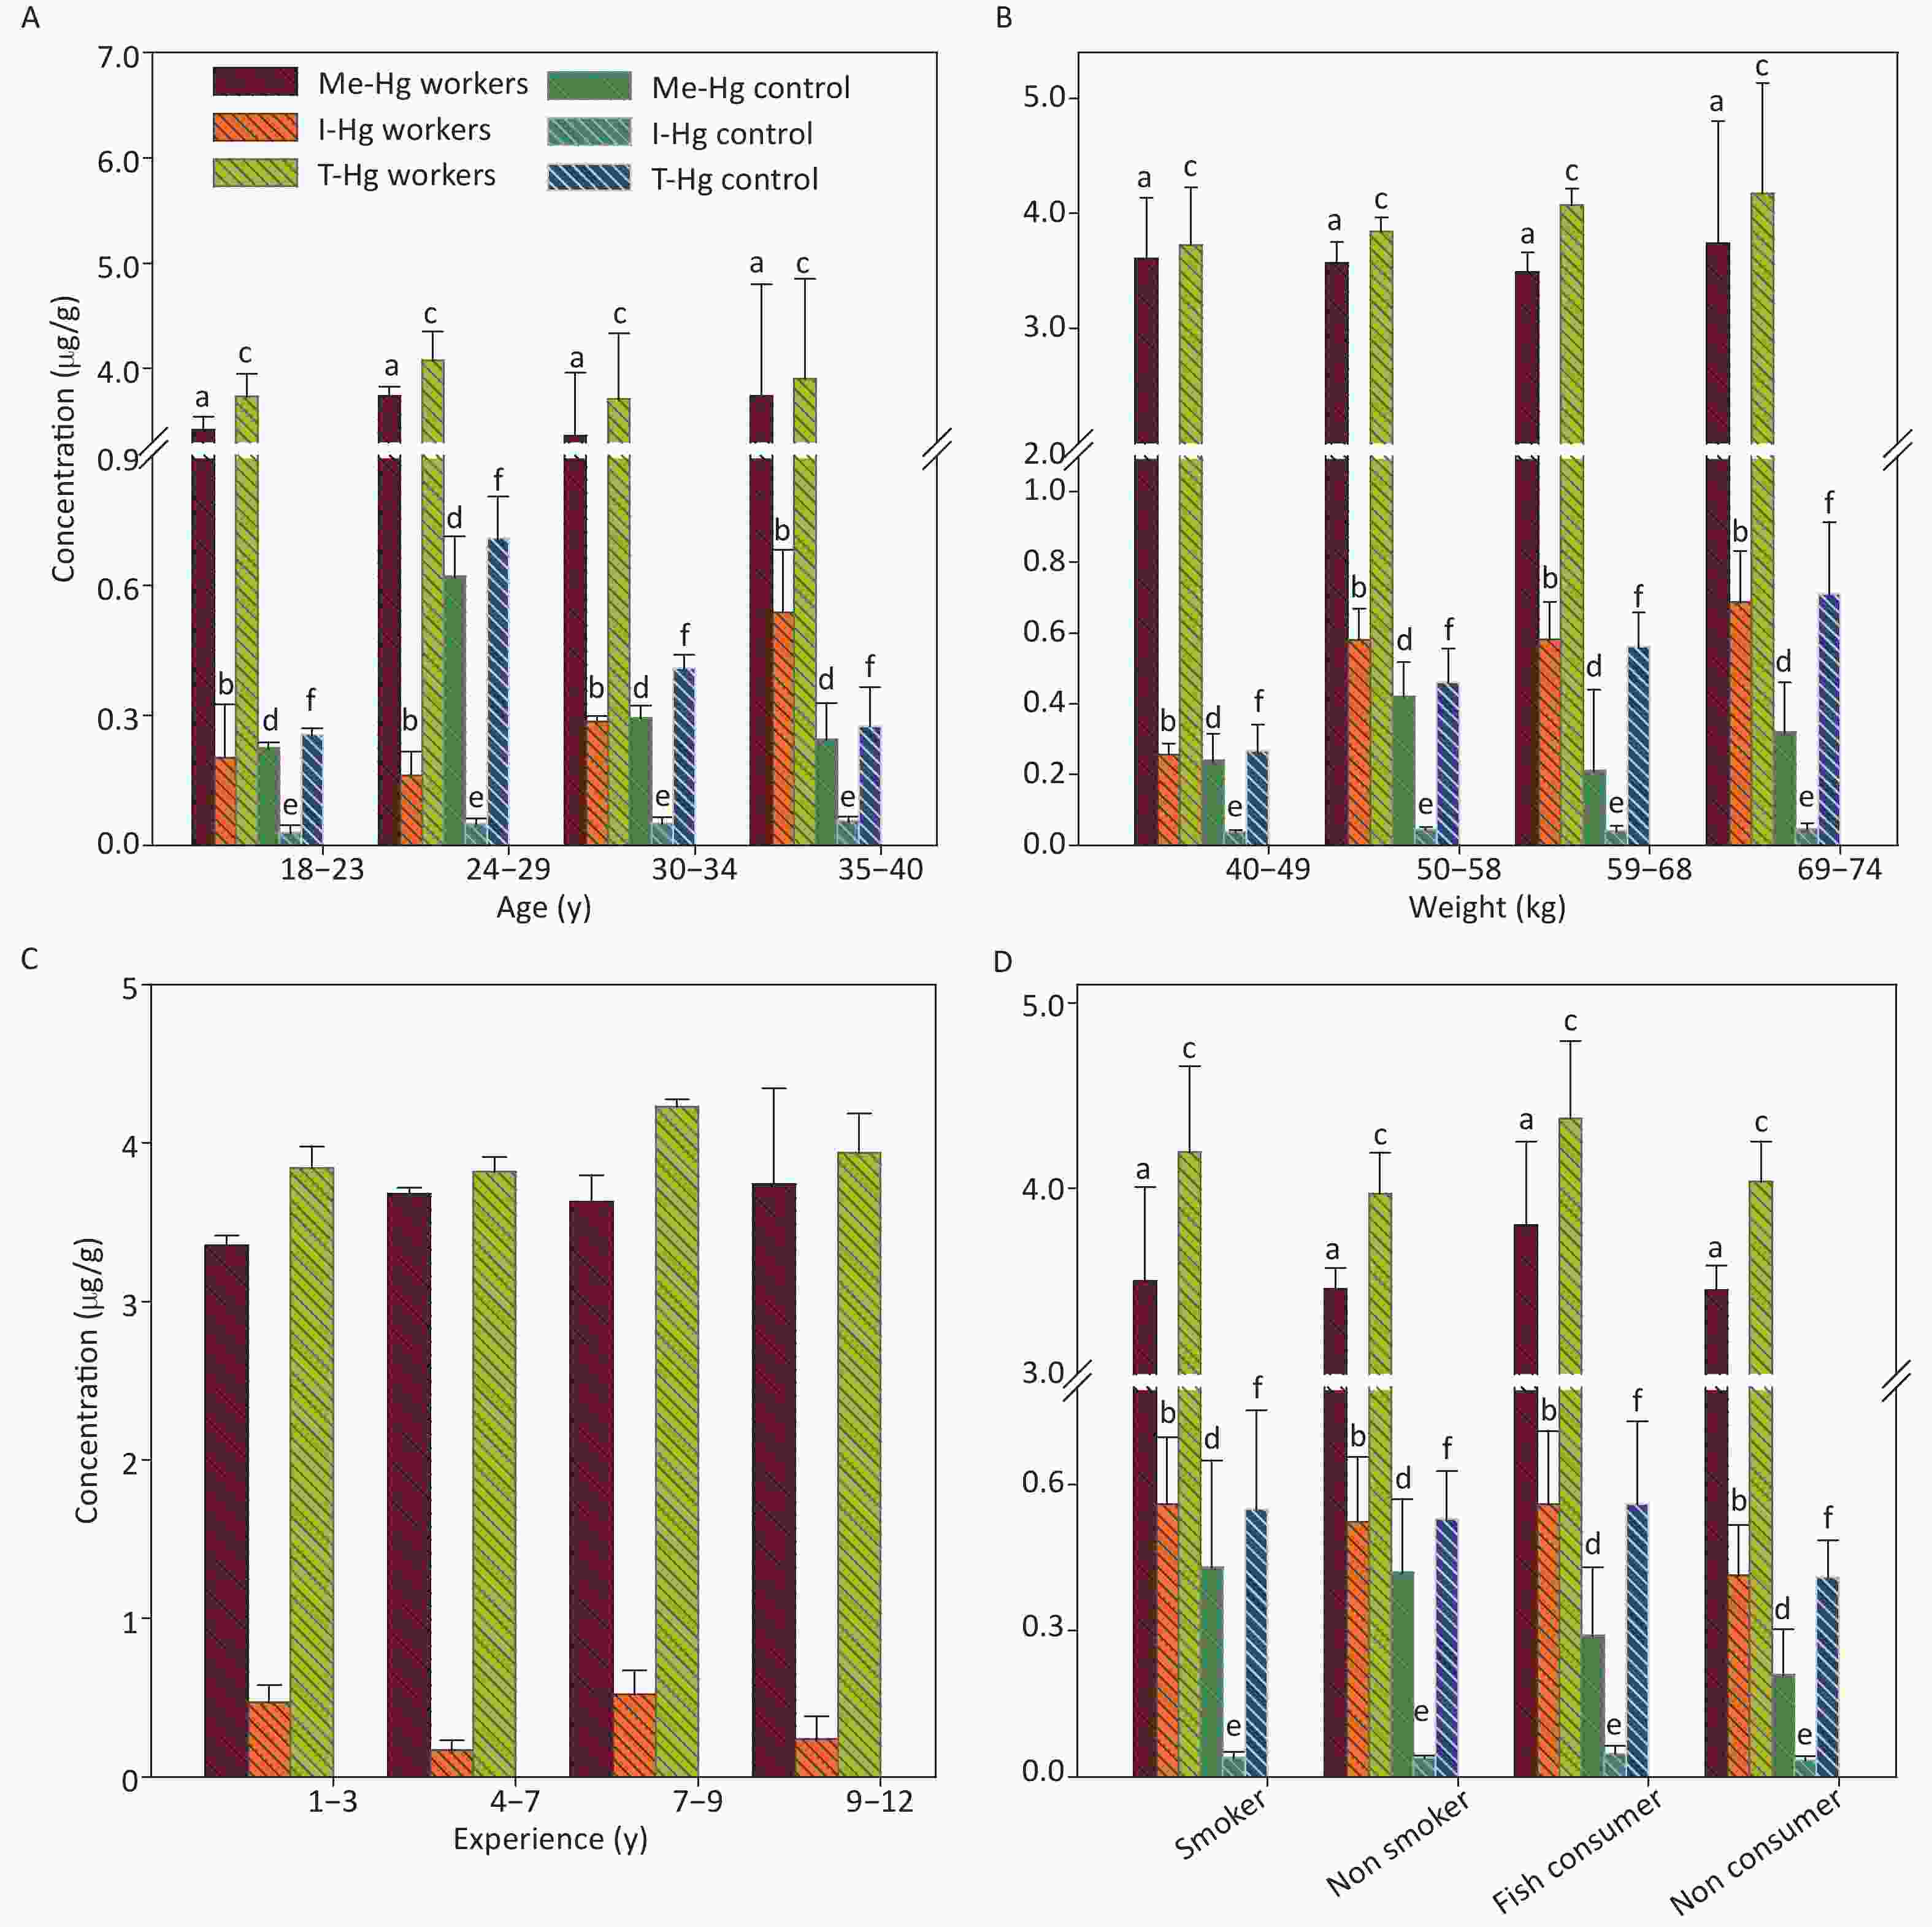
Figure 4. The concentrations of Me-Hg, I-Hg, and T-Hg in hair with (A) age, (B) weight, (C) experience, (D) smoking and fish consumption of the exposed workers and control subjects. Similar letters indicate no-significant difference while different letters indicate significant differences when compared with the control group.
The mean concentrations of T-Hg (6.3 µg/g), Me-Hg (5.52 µg/g) and I-Hg (0.6 µg/g) was examined in workers nails and was found 15 times higher Hg in nails than control and 2 times higher than the permissible limit set for nail Hg (less than 5 µg/L) [37, 38].
In comparison, the relationship between nails Hg concentration and demographic characteristics was found different from that of hair. The nails Hg has a significant relation with age (R2 = 0.674, P = 0.002), weight (R2 = 0.743, P = 0.0003), experience length (R2 = 0.869, P = 0.0002) and fish consumption in both exposed and control individuals . It observed that nails Hg is influenced by long term exposure and fish consumption because the Hg accumulated in the nails with time. The nails Hg assessment also indicate the earlier Hg exposure [36, 37] (Figure 5).
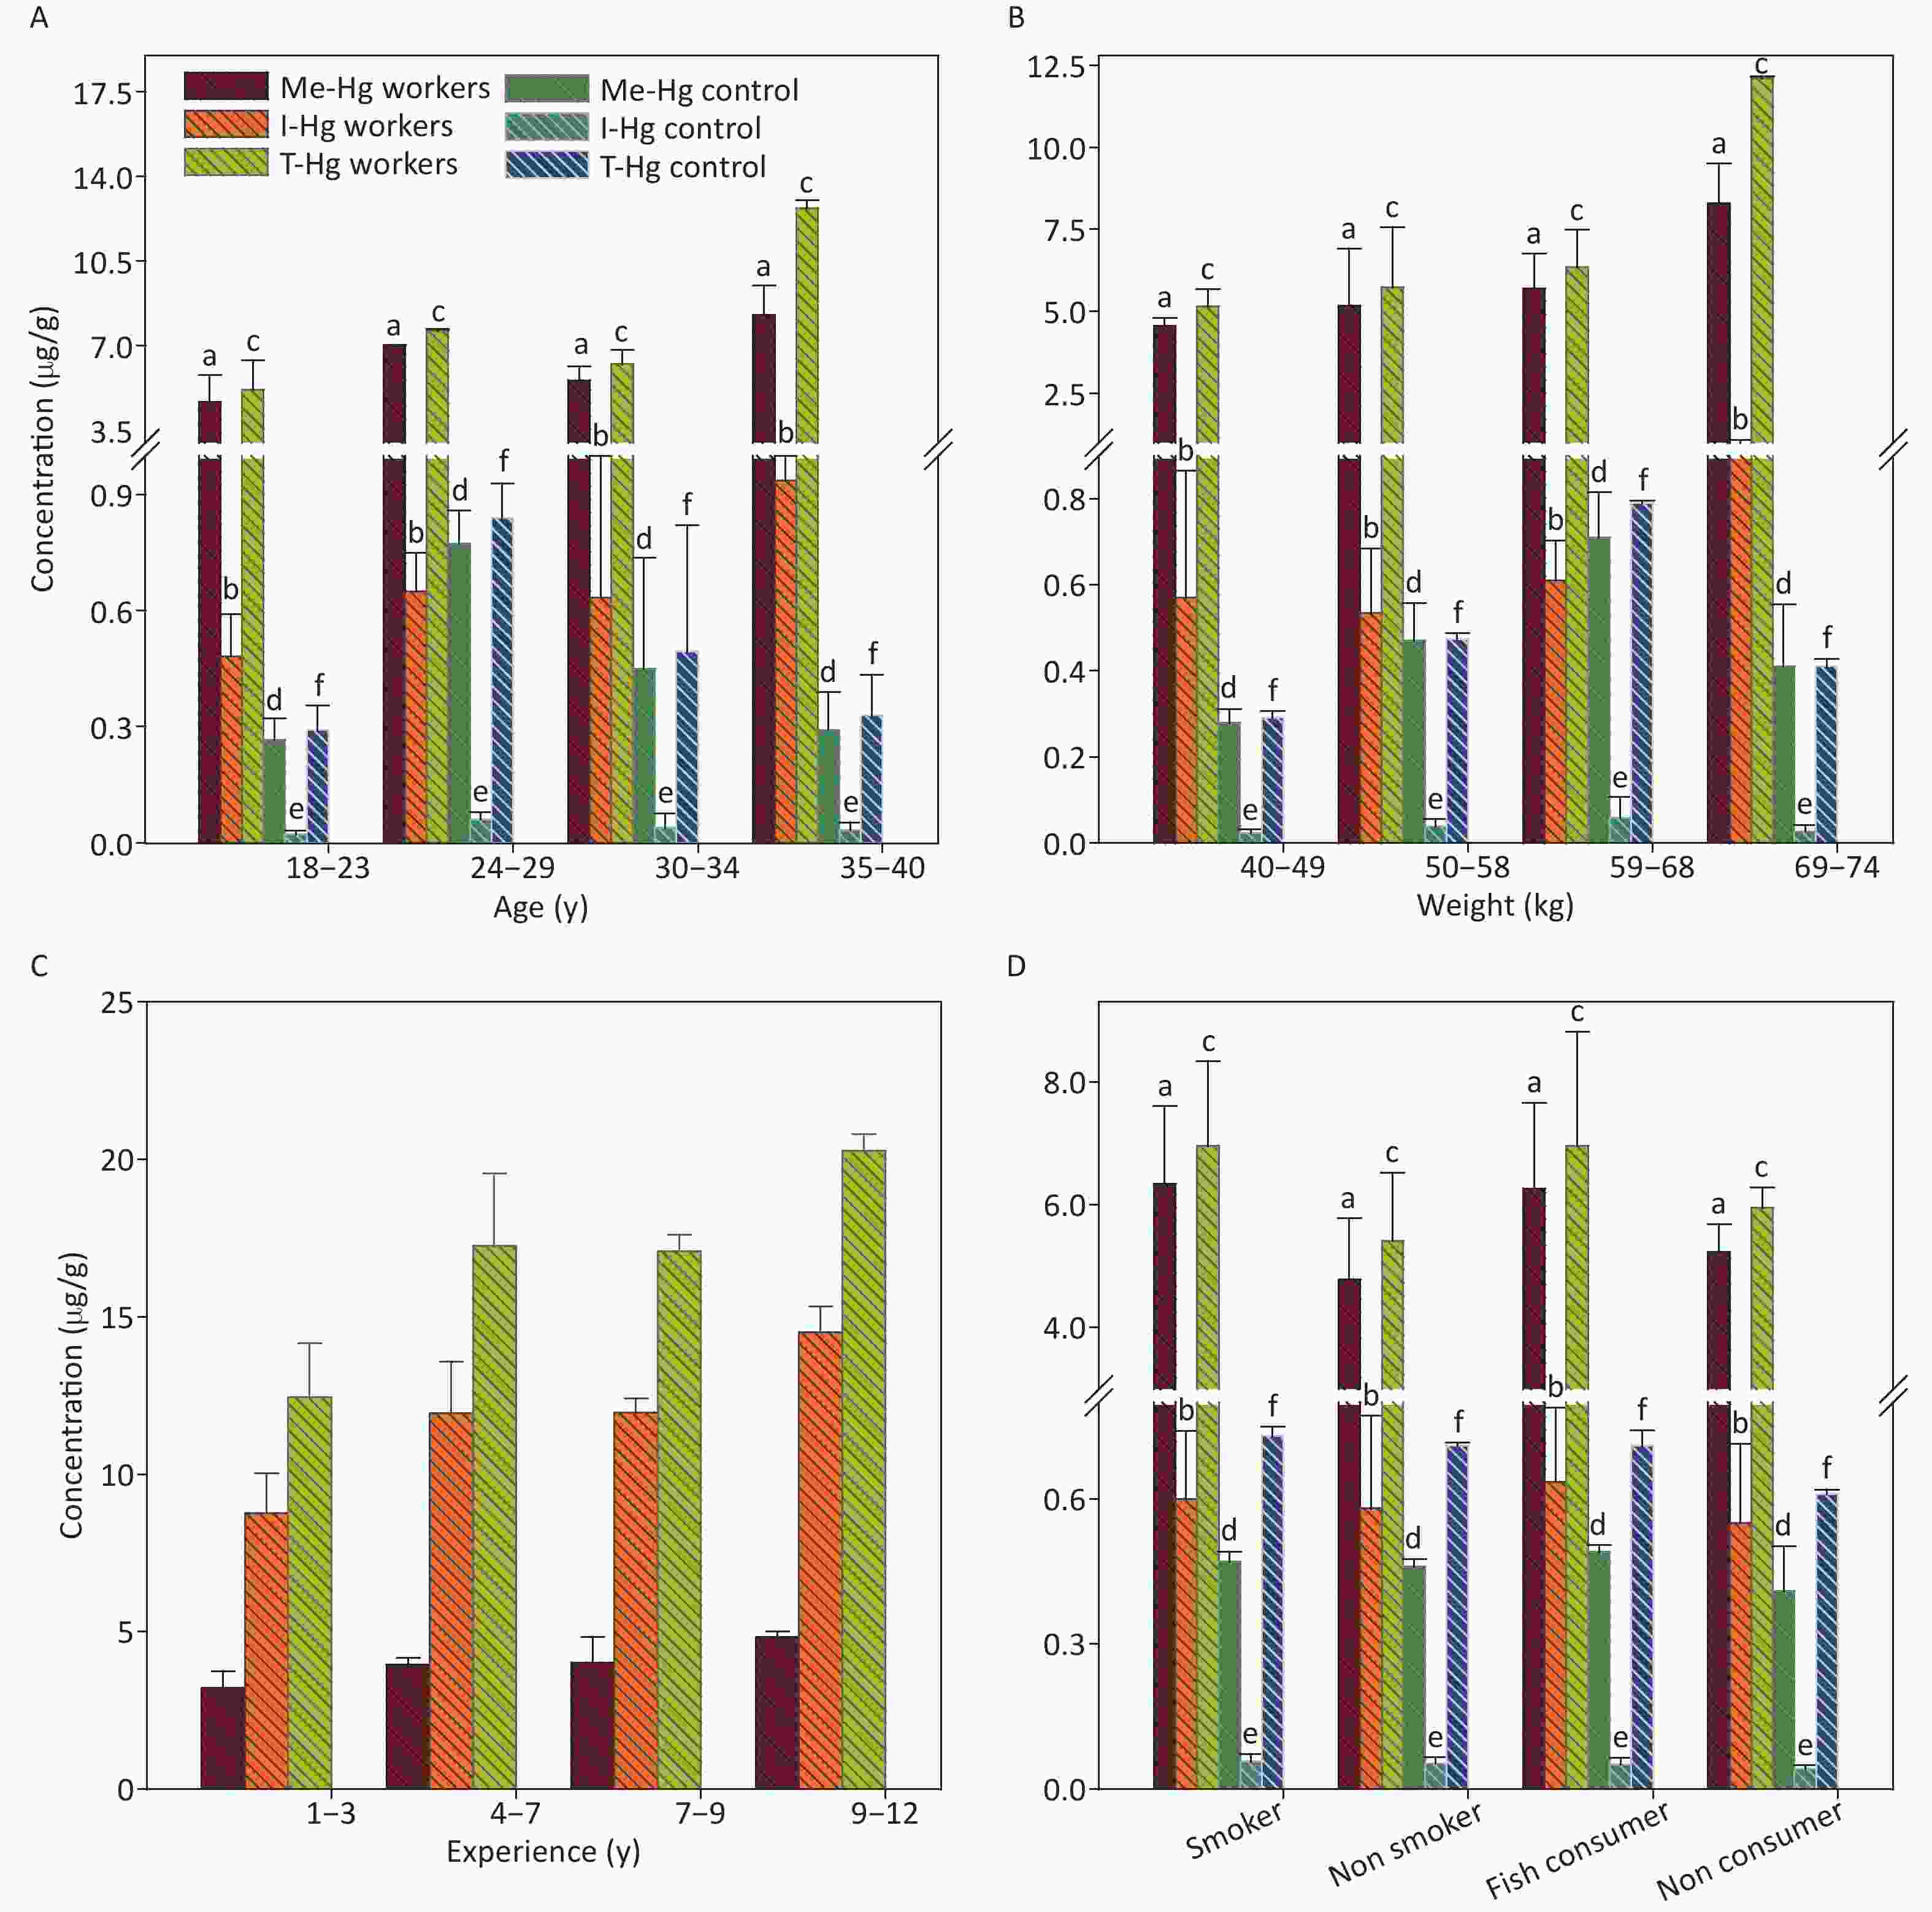
Figure 5. The concentrations of Me-Hg, I-Hg, and T-Hg in nails with (A) age, (B) weight, (C) experience, (D) smoking and fish consumption of the exposed workers and control subjects. Similar letters indicate no-significant difference while different letters indicate significant differences when compared with the control group.
Hg Concentration in RBCs and Plasma
Hg Concentration in Urine
Hg Concentrations in Hair and Nails
-
This is a twofold study in which the first part was focusing on the assessment that wether the Hg exposure and the concentration found in the biological samples can cause health problems among workers, and the second was to investigate that what pattern has the Hg and its species adapt when get entered into the body. The study observed that the industrial exposed workers exhibited significantly (P = 0.001) higher concentrations of Hg in their blood (RBCs, plasma), urine, hair and nails samples as compared to control as well as the concentration was found several times above the permissible limit set for all biological samples. The relationship of Hg concentration between biological samples and demographic characteristics (age, weight, experience, smoking, fish consumption) of both Hg exposed workers and individuals selected as control was assessed by linear regression observed that Hg in RBCs, plasma, urine, hair and nails has a significant relation with experience of the workers [24] while a weak relation with age, weight, smoking and fish consumption [25, 26]. However in control a strong relation was observed for fish consumption and weak relation with age and weight [35].
The highest Hg concentration was found in the biological samples of four workers aged 26, 29, 35, and 40 y. Those workers were working in the exhaust machine from long time with experience of 12 and 14 y. This data showed that workers working near the vicinity of exhaust machine are more vulnerable to the toxic Hg as compared to the basing and sealing machine. This study also unveiled that the age and weight were found independent variables for the assessment of Hg concentration [4] while exposure time and vulnerability greatly influence the Hg concentration in the biological samples.
According to the WHO report Hg is considered as one of the top ten toxic chemicals of public health concern greatly affect immunity, digestive system, kidneys and lungs. Exposure for some hours can lead to headache, cough, chills, shortness of breathing and metallic taste etc. The concentration found in different biological samples not only bioaccumulate in different body organs but this can be the reason of many neurological and kidney diseases [39], because the concentration above the permissible limit is alarming for the workers under study. The different diseases noted through questionnaire survey among the workers showed that 20% of the workers complaining the symptoms of insomnia and loss of appetite while 30% reported memory disturbances because Hg when passed to the brain, it change its forms and accumulate there causing neurological diseases including hand and eyelid tremor, memory disturbance and insomnia which supports the previous studies conducted so far [40]. In the study area, 35% workers complained headache and body aches with fatigue and two workers were reported with mental health problems, the detail of which has been given in Supplementary Table S1 (available in www.besjournal.com). A previous case study [33] reported nephrotic syndrome in the workers of fluorescent tube recycling factory. The concentration noted was 41 µg/L in the blood and the protein excretion in urine was 12.3 g/d which then reached to 0.32 g/d after withdrawl from Hg. However, this is rarely occurs because membranous glomerulonephritis would never develop after chronic Hg exposure. The urinary problems regarding burning micturition, some often blood seen in urine was reported in 26% of exposed workers working near exhaust machine which is the effect of high concentration Hg exposure [41].
Parameters Exposed Control Mean Mean Age (yr) 26.7 ± 6.7 29.9 Gender Male Male Height (ft) 5.28 ± 0.20 5.31 ± 0.3 Weight (Kg) 56.9 ± 10.5 55.1 ± 11.2 Vacation on Occasion on Occasion Experience (yr) 5.35 ± 4.81 6.21 ± 4.51 Working (hr) 10 10 Masks user/non user (%) 0 0 Goggles user/non user (%) 0 0 Dental amalgam user (%) 10 30 Gloves user/non user (%) 70/30 70/30 Smokers/nonsmokers (%) 60/40 55/45 Fish consumer/non consumer (%) 40/60 50/50 Urinary problems (%) 26 5 Headache (%) 35 10 Memory disturbances (%) 30 5 Loss of appetite (%) 20 5 Night blindness (%) 1 NRa Insomnia (%) 20 NR Fatigue (%) 33 5 Body aches (%) 35 10 Finger and eyelid tremor (%) 20 NR Tiredness (%) 67 20 Two workers with MHP (mental health problem) Note. a Not Reported. Table S1. Results of questionnaire regarding diseases prevailing among the selected workers
The results of this study observed that the Hg distributed in the whole body but the species of Hg (Me-Hg, I-Hg) are showing different pattern of distribution among the body organs. The Me-Hg was found dominant specie in the RBCs, hair and nails samples [24, 29] while I-Hg was found dominant specie in the urine and plasma samples [30].
The current study results were compared with other reported literature as shown in Table 2. The Hg concentration found in the previous studies [4, 51] conducted among the workers of flurecsent lamp recycling factory, goldmining workers and goldsmith had a higher blood Hg concentration similar to the current study results. The total Hg concentration was found much lower in studies on children for IQ test [52] and in dental amalgam users [44]. In comparison with the current study the highest concentration of Hg was found in a study which analyzed Hg (590–1,099 μg/g) in workers nails [52-55].
No Parameters Current study Reported literature Concentration Mean Remarks Country Reference 1 Urine 154.6 ± 28 μg/L 1,060 μg/g creatinine In workers of small scale goldmining Wuchuan, Guizhou, China [42] 2 Urine 13.85 ± 13.14 µg/g creatinine Workers of compact fluorescent lamp factory Iran [43] 3 Urine 1.34 μg/L Dental amalgam users USA [32] 4 Urine 9.4 μg/L In children living near high Hg contaminated artisanal gold mining area Nangaritza River Basin, Ecuadorian Amazon [44] 5 Hair 3.64 ± 0.84 μg/g 0.53 μg/g Cinnabar mining region Huancavelica, Peru [45] 6 Hair 2.4 μg/g Cinnabar mining region Almaden, Spain [46] 7 Hair 69.3 μg/g In workers of small scale goldmining Wuchuan, Guizhou, China [42] 8 Hair 3.8 μg/g Gold minning region Bolivia [47] 9 Fingernails and toenails respectively 6.3 ± 1.62 μg/g 590 μg/g and
1,099 μg/gWorkers in chloralkali plant Punjab Pakistan [48] 10 Fingernails 0.14–27.27 mg/kg In operative dentists Tehran [49] 11 RBCs 31.87 ± 5.96 μg/L 33 ± 8.8 μg/L Goldsmith workers Pakistan [4] 12 Plasma 15.1 ± 2.77 μg/L 11.8 ± 3.2 μg/L Goldsmith workers Pakistan [4] 13 Blood 46.9 μg/L 26.8 ± 14.6 μg/L Goldmining workers Suriname [50] 14 Blood 1.61 μg/L In children for IQ test Southern China [16] 15 Blood 38 μg/L Workers in Fluorescent lamp recycling facility Wisconsin [51] Table 2. Comparison of Hg concentration in biological samples with reported literature
The study concluded that workers in the industries are vulnerable to the toxic level of Hg and they must be provided with all protective clothing, gloves, shoes and proper duty rotation which ensure their protection from Hg. To protect workers exposure through breathing, the respirator properly fitted, tested with mercury vapor cartridge and the manufacturer should regularly monitor the health of the individuals and precautionary measures should be taken to avoid any serious problems. The Environmental Protection Agency (EPA) of the Pakistan has to strictly implement the laws and regulations regarding handling of toxic metals and regularly monitor the industries to ensure safe and protected environment for workers and general public living near surroundings.
-
Nayab GUL performed the experiments and wrote the manuscript. Sardar KHAN manage the whole research work and review the manuscript. Abbas KHAN and Adnan SARWAR assist in data collection and design the study. Javed NAWAB and Nida GUL help in samples analysis. All authors approved the final version of the manuscript.
-
The authors declared that they have no conflict of interest

 Quick Links
 DownLoad: