


-
Bacterial infections occur during most wound repair processes after exposure to tissue damage, and severe inflammatory reactions often delay wound healing[1, 2]. Bacterial infections kill tens of thousands of people worldwide annually[3], and this has incited considerable panic, particularly because of antibiotic resistance[4]. Various materials with antibacterial properties, including biocides, metal ions[5], carbon nanotubes[6], quaternary ammonium compounds[7], noble metal materials[5], and metal oxide nanoparticles[8], have been established to date. However, all of these antibacterial materials are chemically synthesized and thus have some inadequacies, such as complex preparation processes, high costs, biotoxicity, and/or possible environmental pollution[9]. Safe, effective, and environmental-friendly antibacterial agents are urgently needed to combat bacterial infections and accelerate wound healing[10-13].
Photothermal treatment has become an alternative option for treating some types of bacterial infections[14, 15]. It is associated with the integration of an appropriate energy absorber within locoregional tissues. Therein, a near-infrared laser causes therapeutic local hyperthermia and the subsequent death of surrounding malignant cells[16]. Carbon and nanoparticles of various metals such as V, Mn, Ce, and Pt, have been developed; however, their dismal metabolism finally results in toxicity and harmful health effects, including changes in mitochondrial respiration, immune responses, and genetic toxicity[17].
Melanin is a polyphenolic compound with an anthracene ring as its monomer unit[18]. Melanin is the cause of brown, black, and gray coloration in plants, microorganisms, and animals, as well as in the skin, hair, and eyes of humans[19]. Synthetic polydopamine melanin nanoparticles are an alternative to photothermal treatment because of their high energy absorption capacity after laser irradiation. The absorption efficiency of these melanin nanoparticles is high in the infrared region, the energy has a high conversion rate to heat, and they are significantly stable against irradiation[20]. Naturally-derived melanin should have good biocompatibility and biostability, because it does not elicit side effects including cytotoxicity and antigen responses in vitro[21-23] or when injected into organisms in vivo[20]. Natural melanin has been investigated for over half a century now, and recent studies have also targeted melanin from cuttlefish[24, 25] and squid[26, 27]. Melanin has poor solubility because it is usually combined with proteins and polysaccharide, from which it is difficult to separate, and experts have not yet been able to define its structure[28-30]. Thus, naturally sourced melanin needs to be explored in detail. Mussel shells contain natural melanin. The meat of the blue mussel, Mytilus edulis (M. edulis), is delicious and it has a high protein content; hence, these mollusks have been described as ‘the eggs of the sea’. However, recent studies on M. edulis have focused mainly on its edible parts[31-33], as a result, a large number of M. edulis shells were discarded because they cannot be used reasonably. If melanin is extracted from M. edulis shells, it can not only broaden the source of melanin, but also reduce the environmental pollution of waste mussel shells. Therefore, more studies on M. edulis melanin are needed from the viewpoints of protecting the environment, comprehensive utilization of natural resources, and biological therapies.
Here, we characterized and assessed the bacteriostatic properties of melanin extracted from M. edulis. We then investigated its ability to promote the healing of wounds infected with drug-resistant bacteria and its biological toxicity in vitro and in vivo.
-
Shells of M. edulis were obtained from the coast near Rizhao in Shandong province. We purchased 12 mol/L HCl, NaOH, pepsin, trypsin, neutral protease, alkaline protease, complex protease and animal protease from Sinopharm Chemical Reagent Co. Ltd. (Shanghai, China). The source of Luria-Bertani (LB) medium, propidium iodide (PI), and 4’-6-diamidino-2-phenylindole (DAPI) was Thermo Fisher Scientific Inc. (Waltham, MA, USA) and 3-(4,5-dimethyl-2-thiazolyl)-2,5-diphenyltetrazolium bromide (MTT) was from Sigma-Aldrich Corp., (St. Louis, MO, USA). Escherichia coli producing extended-spectrum β-lactamase (ESBL) and methicillin-resistant Staphylococcus aureus (MRSA), were provided by the Biology Experimental Teaching Centre of Qingdao University. Mouse fibroblasts (L929) and human umbilical vein endothelial cells (HUVEC), were provided by the Affiliated Hospital of Qingdao University. All reagents used in this study were analytical grade and applied without further purification. The Institutional Animal Care and Use Committee (IACUC) at Qingdao University approved all the experimental protocols. Ultrapure 18.2 MΩ water was obtained from Millipore Sigma Co., Ltd., Burlington, MA, USA).
-
Shells of M. edulis were crushed using a DXF-10A High-speed pulverizer (Guangzhou Duoshun Machinery Co. Ltd., Guangzhou City, China). A JEM-2100 transmission electron microscopy (TEM) microscope was obtained from JEOL Ltd. (Tokyo, Japan). Infrared spectra were acquired using a Nicolet Nexus470 infrared spectrometer (Thermo Fisher Scientific Inc.). X-ray photoelectrons (XPS) were measured using a PHI 5000 Versaprobe-II spectrometer (Sigmatech Inc., Huntsville AL, USA) and a monochromatic Al Kα (1486.6 eV) source. Photothermal radiation was applied using a near infrared laser transmitter (Shenzhen Shenan Medical Device Factory, Shenzhen, China). Images were acquired using an S-4800 scanning electron microscope (SEM) (Hitachi Ltd., Tokyo, Japan). Fluorescence images were assessed using a TCS SP8 CARS fluorescence confocal microscope (Leica Cameras AG., Wetzlar, Germany). All samples were refrigerated at in -80 °C (Qingdao Haier Special Electric Freezer Co. Ltd., Qingdao, China).
-
Washed, dried and powdered M. edulis shells were mixed with 4 mol/L HCl, and filtered to remove remaining CaCO3. The filtrate was mixed with 1 mol/L NaOH and separated by 1,880 ×g centrifugation (Anting Scientific Instrument Factory, Shanghai, China). The pH of the supernatant was adjusted to 1.5, to obtain a precipitate that was sedimented by centrifugation and washed several times with distilled water to obtain a crude melanin product. This product was hydrolyzed with HCl (H-melanin) and trypsin (T-melanin) under appropriate conditions, and dried. Supplementary Information shows experimental details.
-
Hydrolyzed melanin was assessed using ultraviolet spectrophotometry. Functional groups were identified, and the structures of H-melanin and T-melanin were determined using Fourier transform infrared spectroscopy (FTIR). Their internal structures were characterized using SEM and X-ray photoelectron spectroscopy (XPS)[34]. Supplementary Information contains more experimental details.
-
Hydrolyzed melanin (13 mg) samples were placed in EP tubes, irradiated at 0.8 W and 808 nm with a near-infrared laser for 7 min, then temperature was recorded every minute to compare the photothermal conversion capability of H-melanin and T-melanin. The samples were treated with water dispersion at 25–200 μg/mL then laser-irradiated at 2 W/cm2 and 808 nm for 5 min with pure deionized water as the negative control.
-
Single colonies of resistant Staphylococcus aureus (S. aureus) and Escherichia coli (E. coli) were inoculated onto solid LB medium and into 50 mL of sterile liquid LB medium (containing tryptone 0.5 g, yeast extract 0.25 g and NaCl 0.5 g) and agitated overnight at 180 rev min-1 in a rotary shaker at 37 °C. Thereafter, the bacterial suspensions were diluted in sterile phosphate buffered saline (PBS) to a density of 1 × 10⁶ colony forming units (CFU)/mL[35, 36]. Hydrolyzed melanin (20 μL; 2 mg/mL) suspended in sterile water was mixed with 200 μL of bacterial suspensions. Blank controls contained PBS instead of melanin. The bacterial samples were exposed or not to near infrared radiation (NIR; 2 W, 808 nm, power density 8 W/cm2, continuous output) for 15 min with shaking every 5 min. Thereafter, the samples were shaken for 30 min at 37 °C, then 200 μL was evenly streaked onto plates containing LB medium and left for 24 h at 37 °C. CFU were counted[37] and the bacteria were characterized using TEM[38, 39].
Suspensions of aqueous H-melanin and T- melanin (50 μL; 20 mg/mL) added to 500 μL of fresh E. coli and S. aureus suspensions were shaken, then and irradiated or not with NIR (2W, 808 nm) for 15 min. The blank control contained PBS, and was incubated at 37 °C for 30 min. The bacterial suspensions were mixed with 500 μL of sterile water, then separated by centrifugation at 8,000 rmp. The precipitate was resuspended in 500 μL of water[40], stained with 200 μL DAPI (12.5 μg/mL) and PI (1.25 μg/mL) for 15 min and left at room temperature in darkness for 30 min. The stained samples were then assessed by fluorescence microscopy.
-
The ability of hydrolyzed melanin to heal wounds was evaluated in 6-week-old Sprague-Dawley rats weighing 200 g. Round wounds with a diameter of 6 mm prepared on the backs of the rats, and infected with 20 μL S. aureus (106 CFU/ mL). The wounds were then treated with PBS, H-melanin or T-melanin, and with or without NIR irradiation for 15 mins. The wounds were photographed daily. Rats were sacrificed on days 0, 3, and 6 to collect wound tissues, and skin covering entire wounds and normal adjacent skin were extracted and incubated at 37 °C in LB liquid medium overnight. Thereafter, CFU were counted.
Wound tissues collected on days 3 and 6 were fixed in 4% paraformaldehyde, embedded in paraffin, sliced into 4-μm sections, and stained with hematoxylin and eosin (H&E) for histological assessment[41].
-
The cytotoxicity of hydrolyzed melanin was assessed in HUVEC and L929 cells in vitro using MTT assays.
The biosafety of melanin was also assessed in vivo. Rats were intravenously injected with PBS (control), or H-melanin and T-melanin (200 μg/mL). The rats were euthanized 6 days later, and the liver, heart, spleen, lungs, and kidneys were harvested. Blood was also collected from those injected with melanin to examine physiological indexes.
-
The ultraviolet spectra of melanin extracted from M. edulis shells were characterized. A maximum absorption peak near 230 nm (Supplementary Figure S1A, available in www.besjournal.com), and the black color of the shell extracts indicated that the extract was melanin[42, 43].
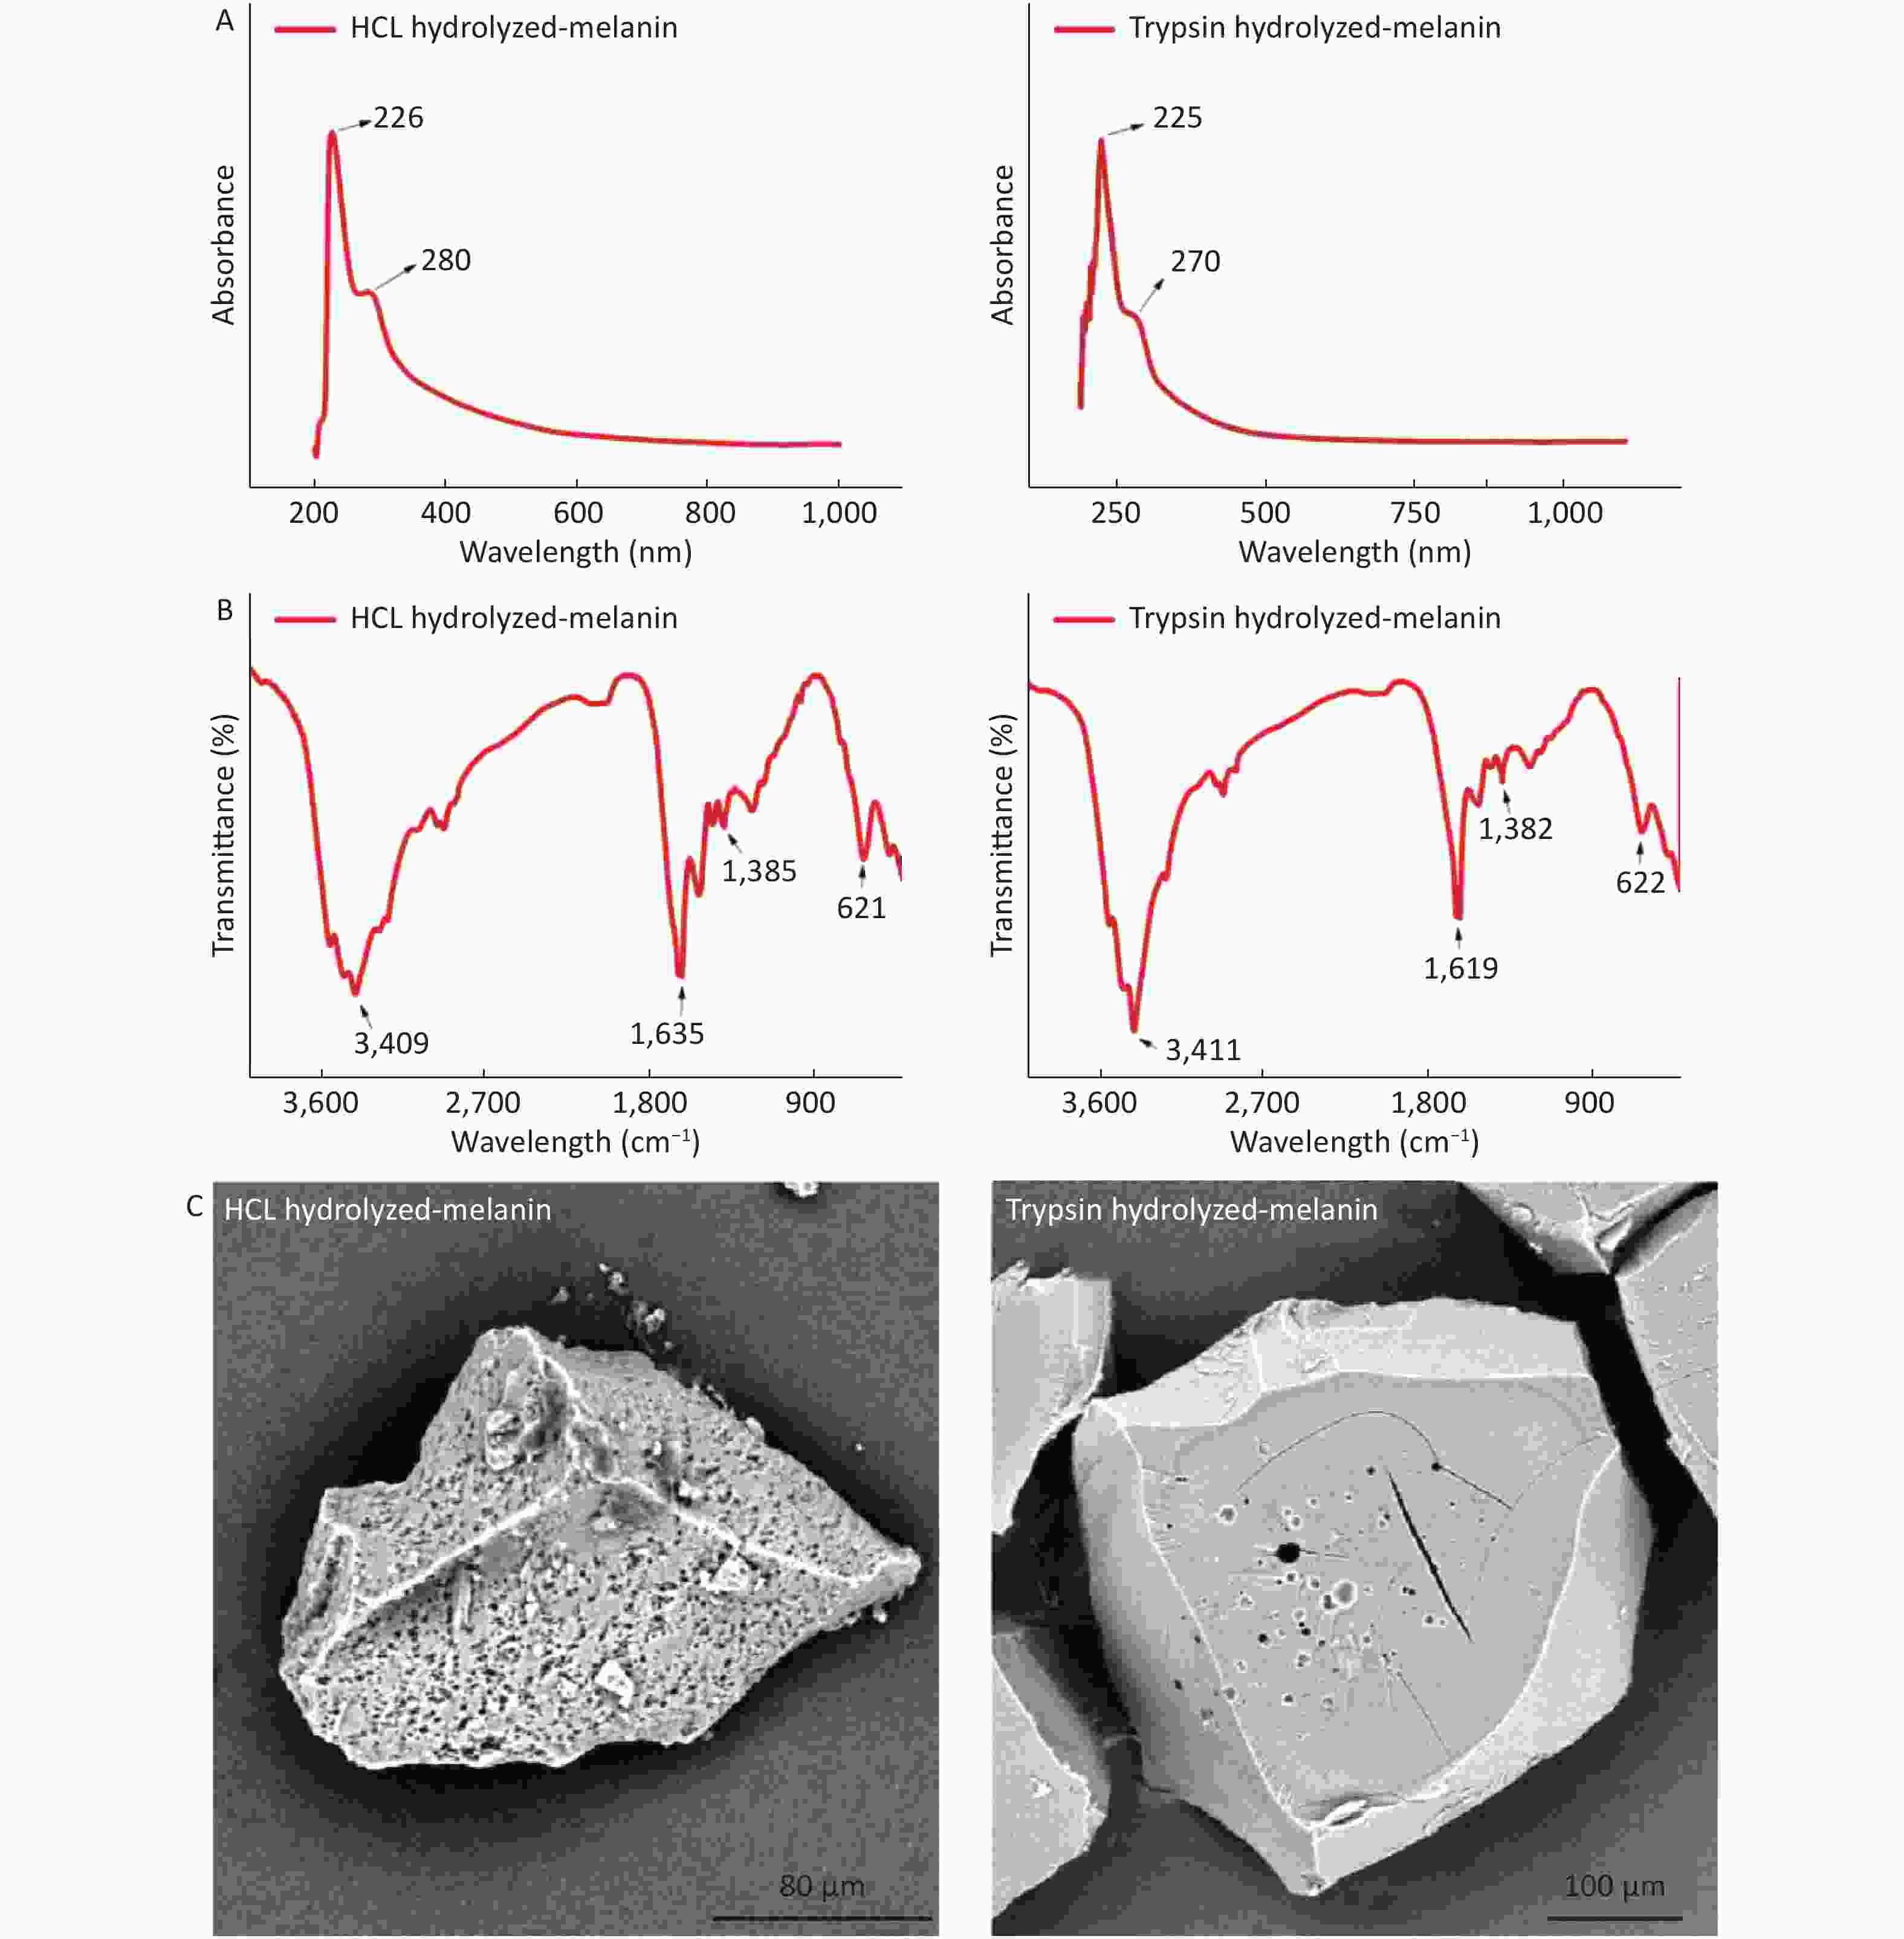
Figure S1. (A) UV absorption spectra of HCl hydrolyzed-melanin and trypsin hydrolyzed-melanin. (B) FTIR spectra of HCl hydrolyzed-melanin and trypsin hydrolyzed-melanin. (C) SEM images of HCl hydrolyzed-melanin and trypsin hydrolyzed-melanin.
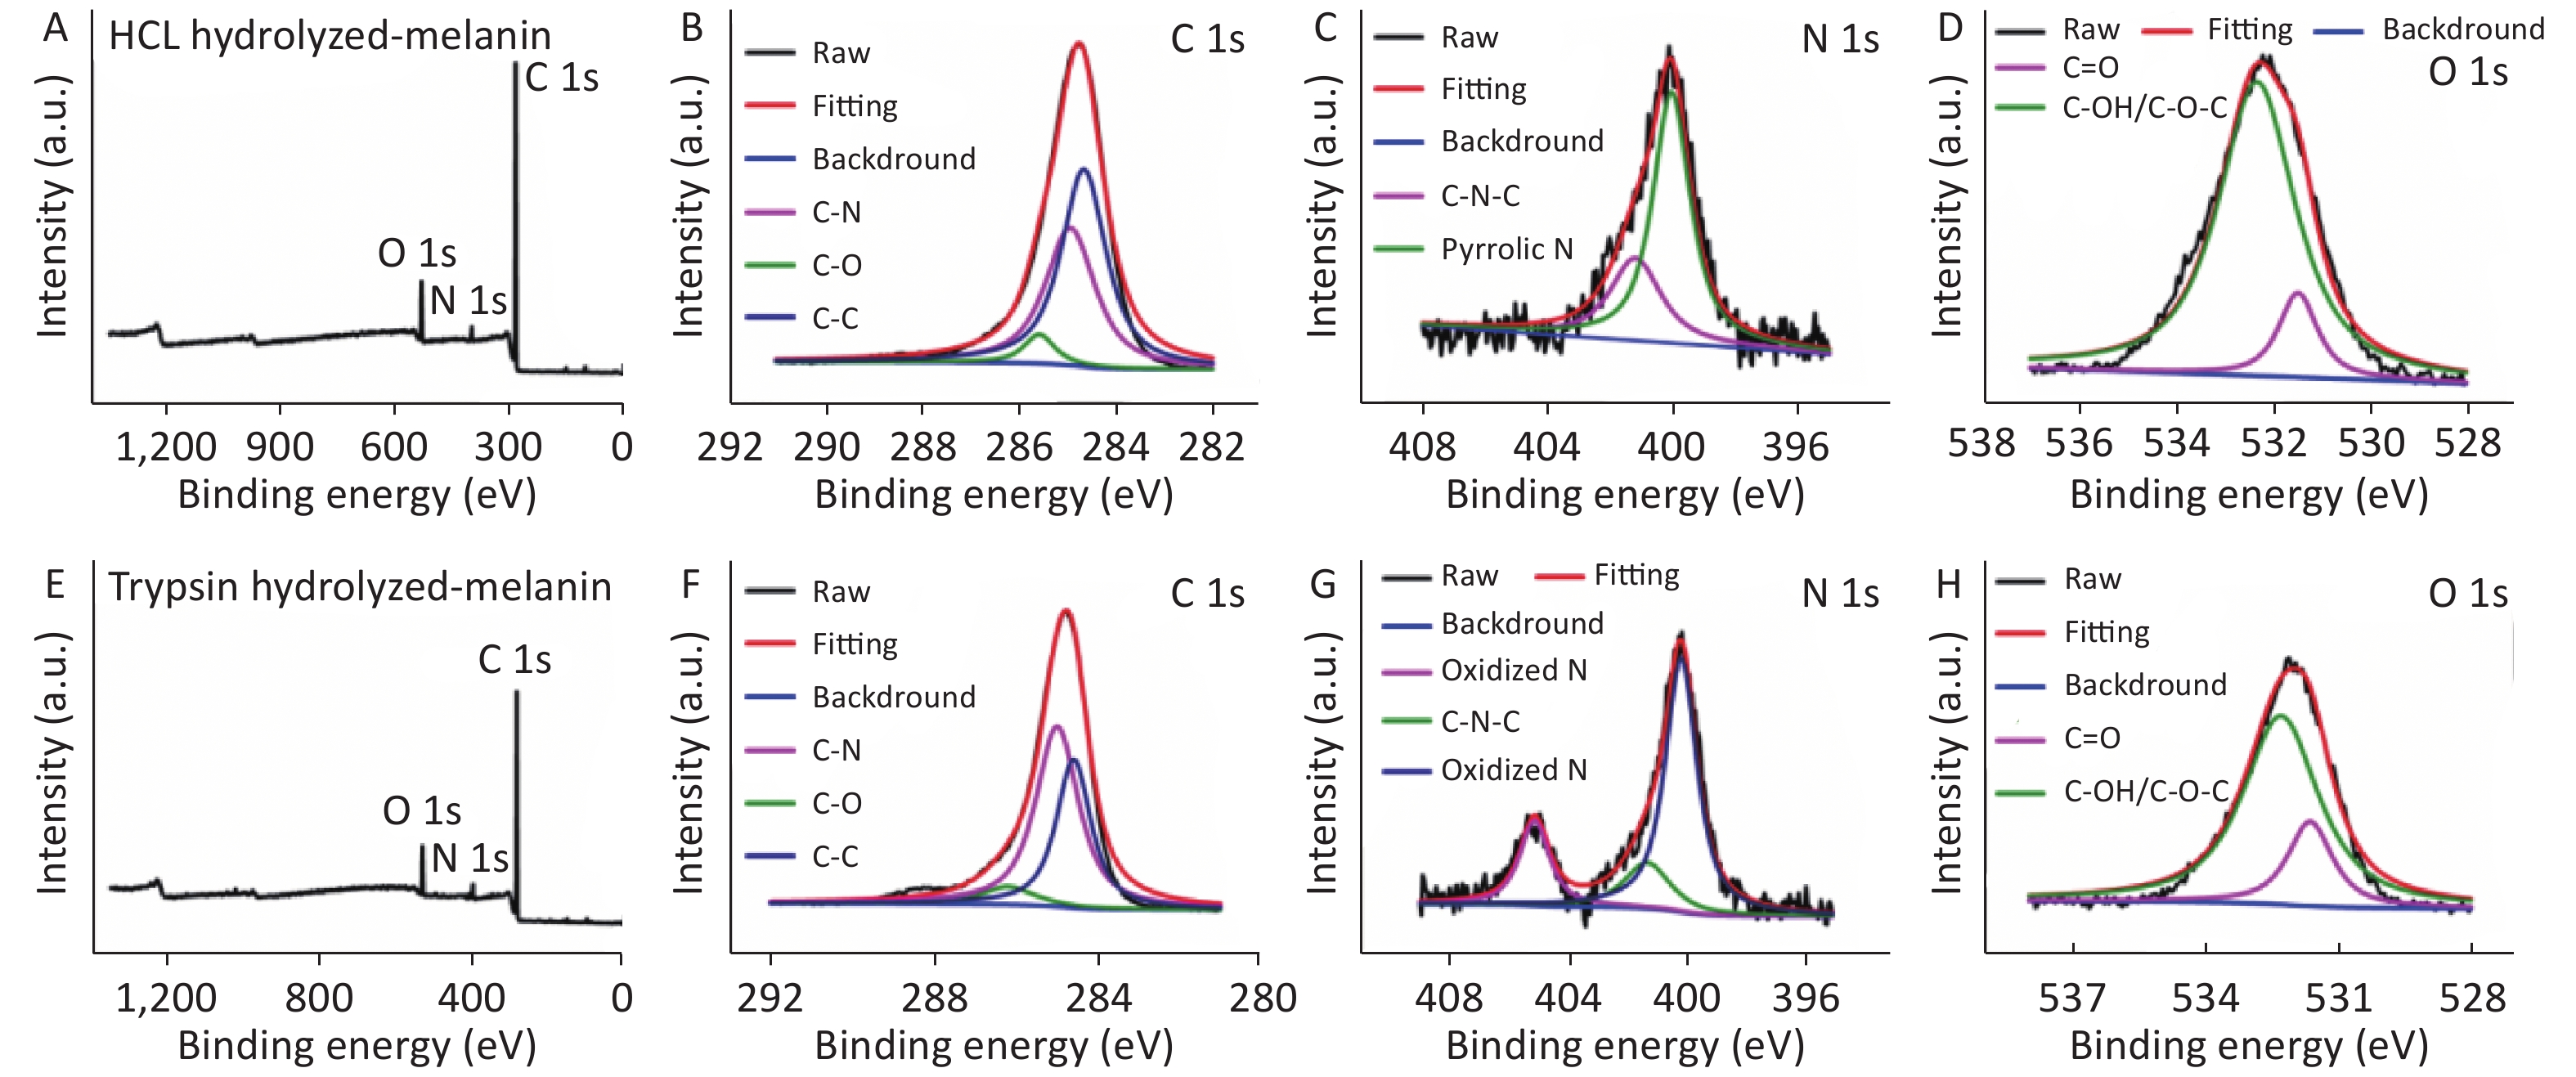
We further examined whether the hydrolyzed black extracts from M. edulis shells really were melanin using infrared spectroscopy. The infrared spectra of the hydrolyzed extracts (Supplementary Figure S1B) revealed peaks at 3,300–3,500 cm–1, 1,600–1,670 cm–1 and 1,250–1,465 cm–1, thus confirming that the extracts from the M. edulis shells were indeed melanin. Supplementary Figures S1C and S2 (available in www.besjournal.com) show ultrastructural SEM images and XPS of extracted and T- and H-melanin.
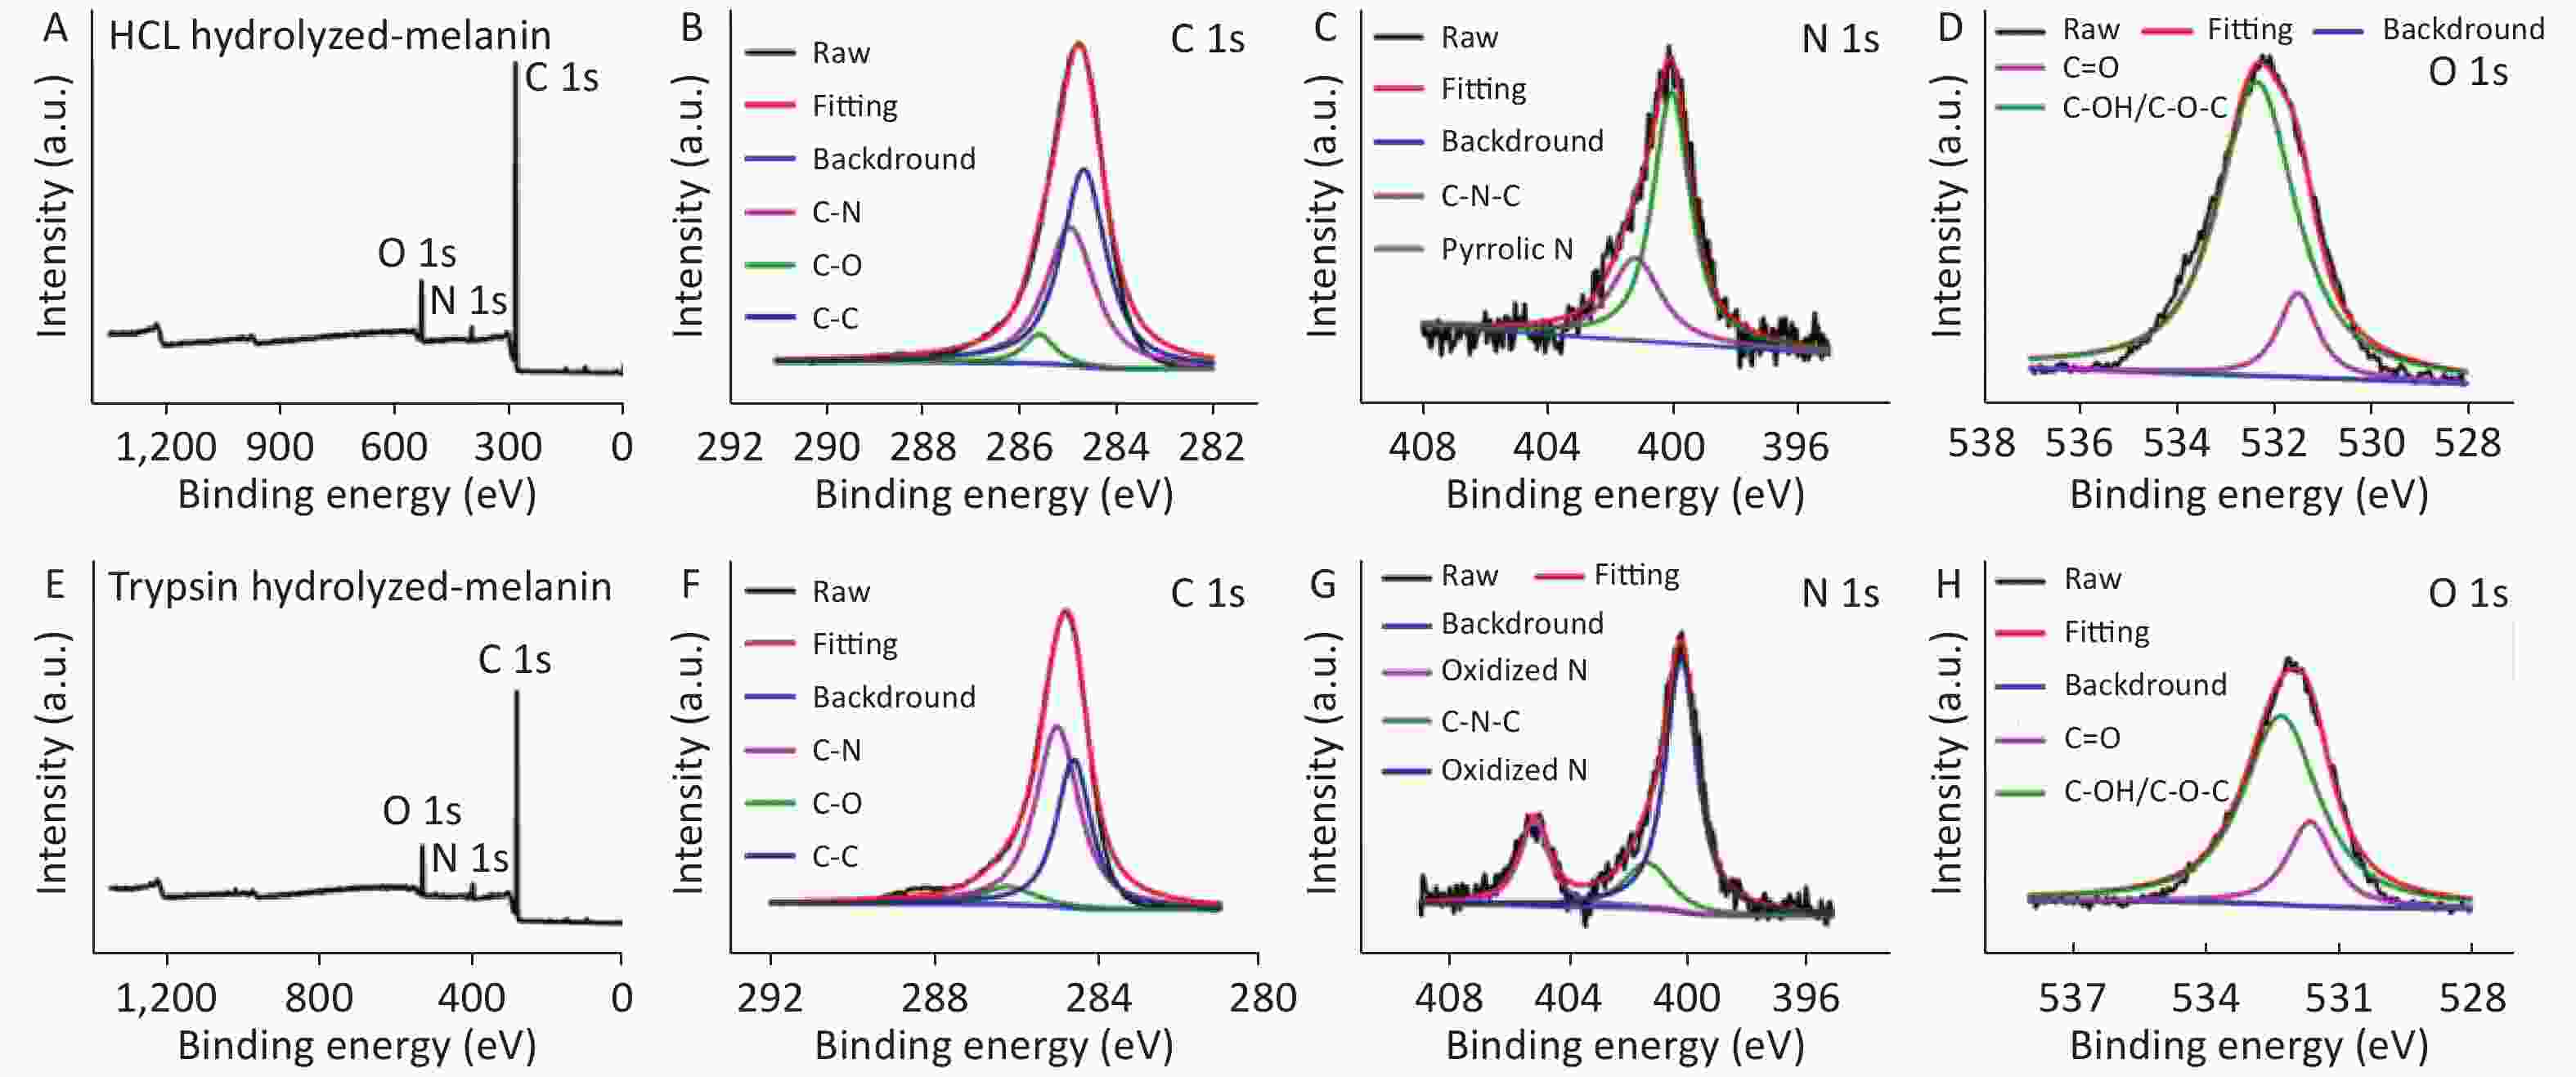
Figure S2. (A) XPS survey spectrum of HCl hydrolyzed-melanin. (B) XPS C1S spectrum of HCl hydrolyzed-melanin. (C) XPS N1s spectrum of HCl hydrolyzed-melanin. (D) XPS O1s spectrum of HCl hydrolyzed-melanin. (E) XPS survey spectrum of trypsin hydrolyzed-melanin. (F) XPS C1S spectrum of trypsin hydrolyzed-melanin. (G) XPS N1s spectrum of trypsin hydrolyzed-melanin. (H) XPS O1s spectrum of trypsin hydrolyzed-melanin.
-
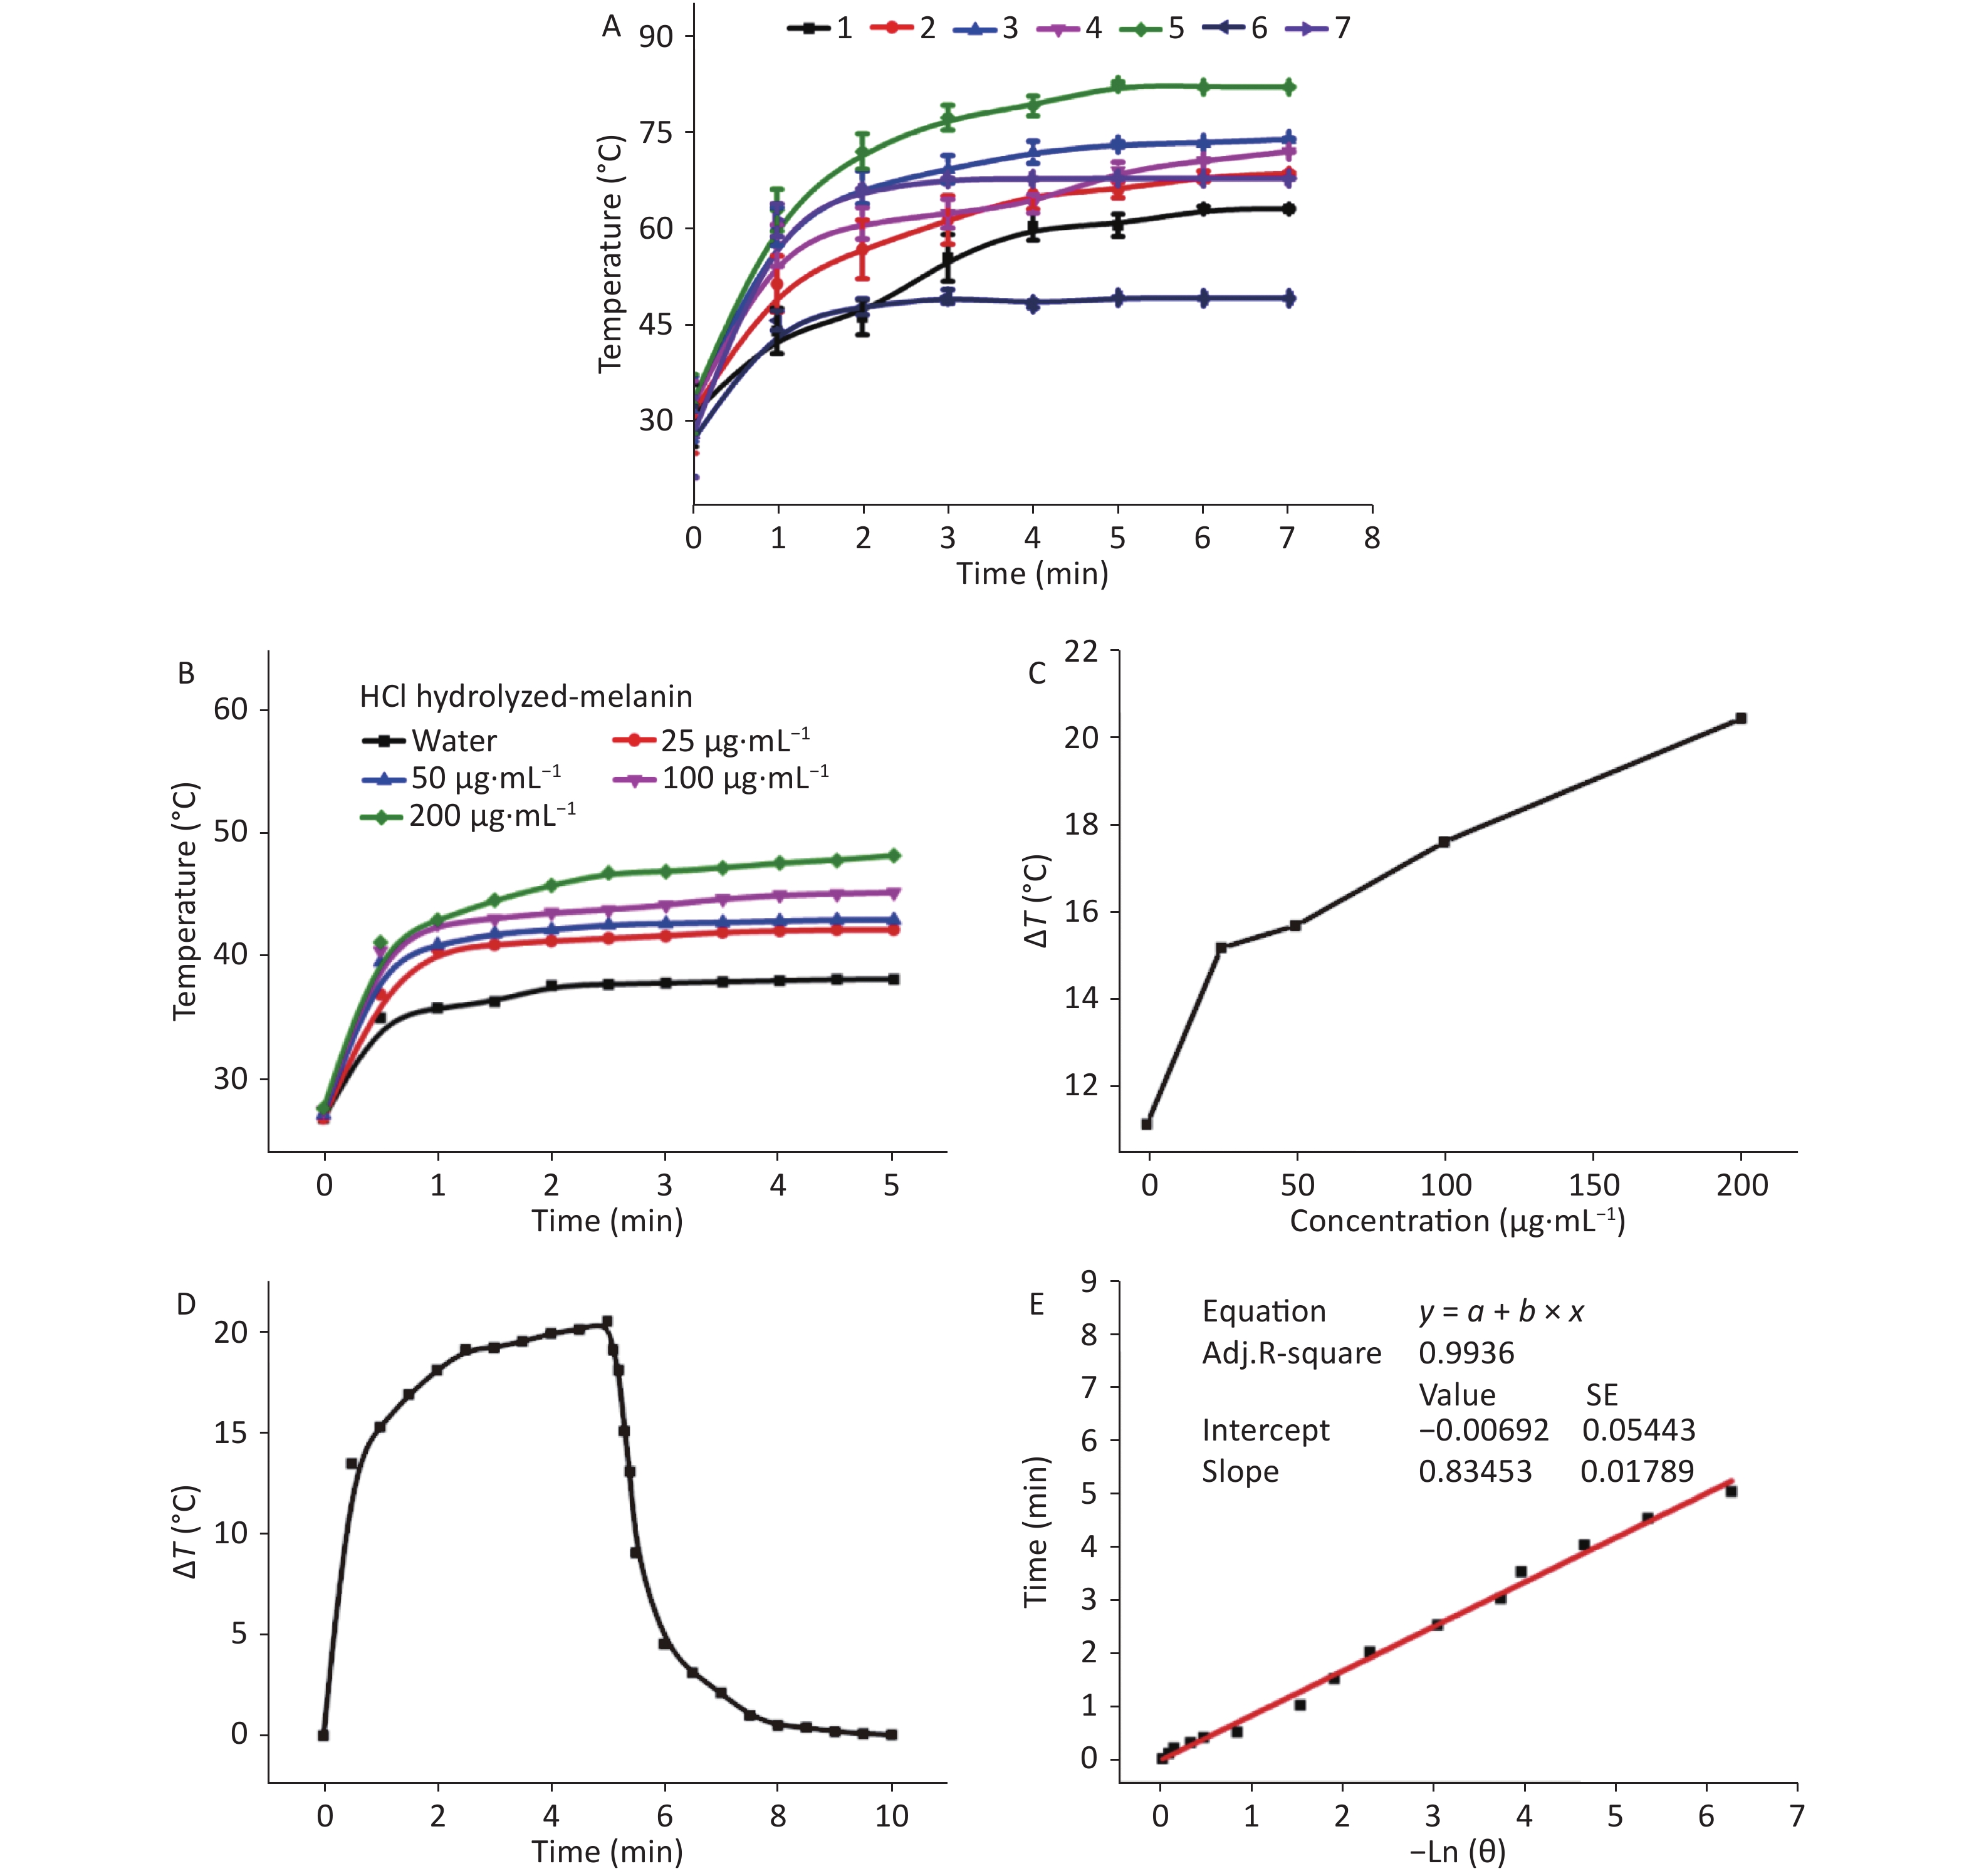
We compared the photothermal conversion effects of M. edulis melanin hydrolyzed with concentrated HCl and various proteases (P-melanin). Figure 1A shows the relationship between the temperature of H-melanin and T-melanin, and the length of exposure to NIR irradiation (0.8 W, 808 nm). The temperature of hydrolyzed melanin changed roughly in three stages as follows. During the first 0–1 min, the temperature rapidly increased under near-infrared radiation, and immediately produced a thermal effect. The rate of the temperature increase gradually slowed over the next 1–6 min, then stabilized between 6–7 min. The temperature of T-melanin increased more rapidly, and peaked at 81.4 °C. The H-melanin peaked at 67.4 °C, and the P-melanin reached only 49 °C. These findings indicated that melanin can be photothermally converted by NIR irradiation to promote a local increase in temperature, thus exerting sterilization and inhibition effects, and that T-melanin was the most effective.
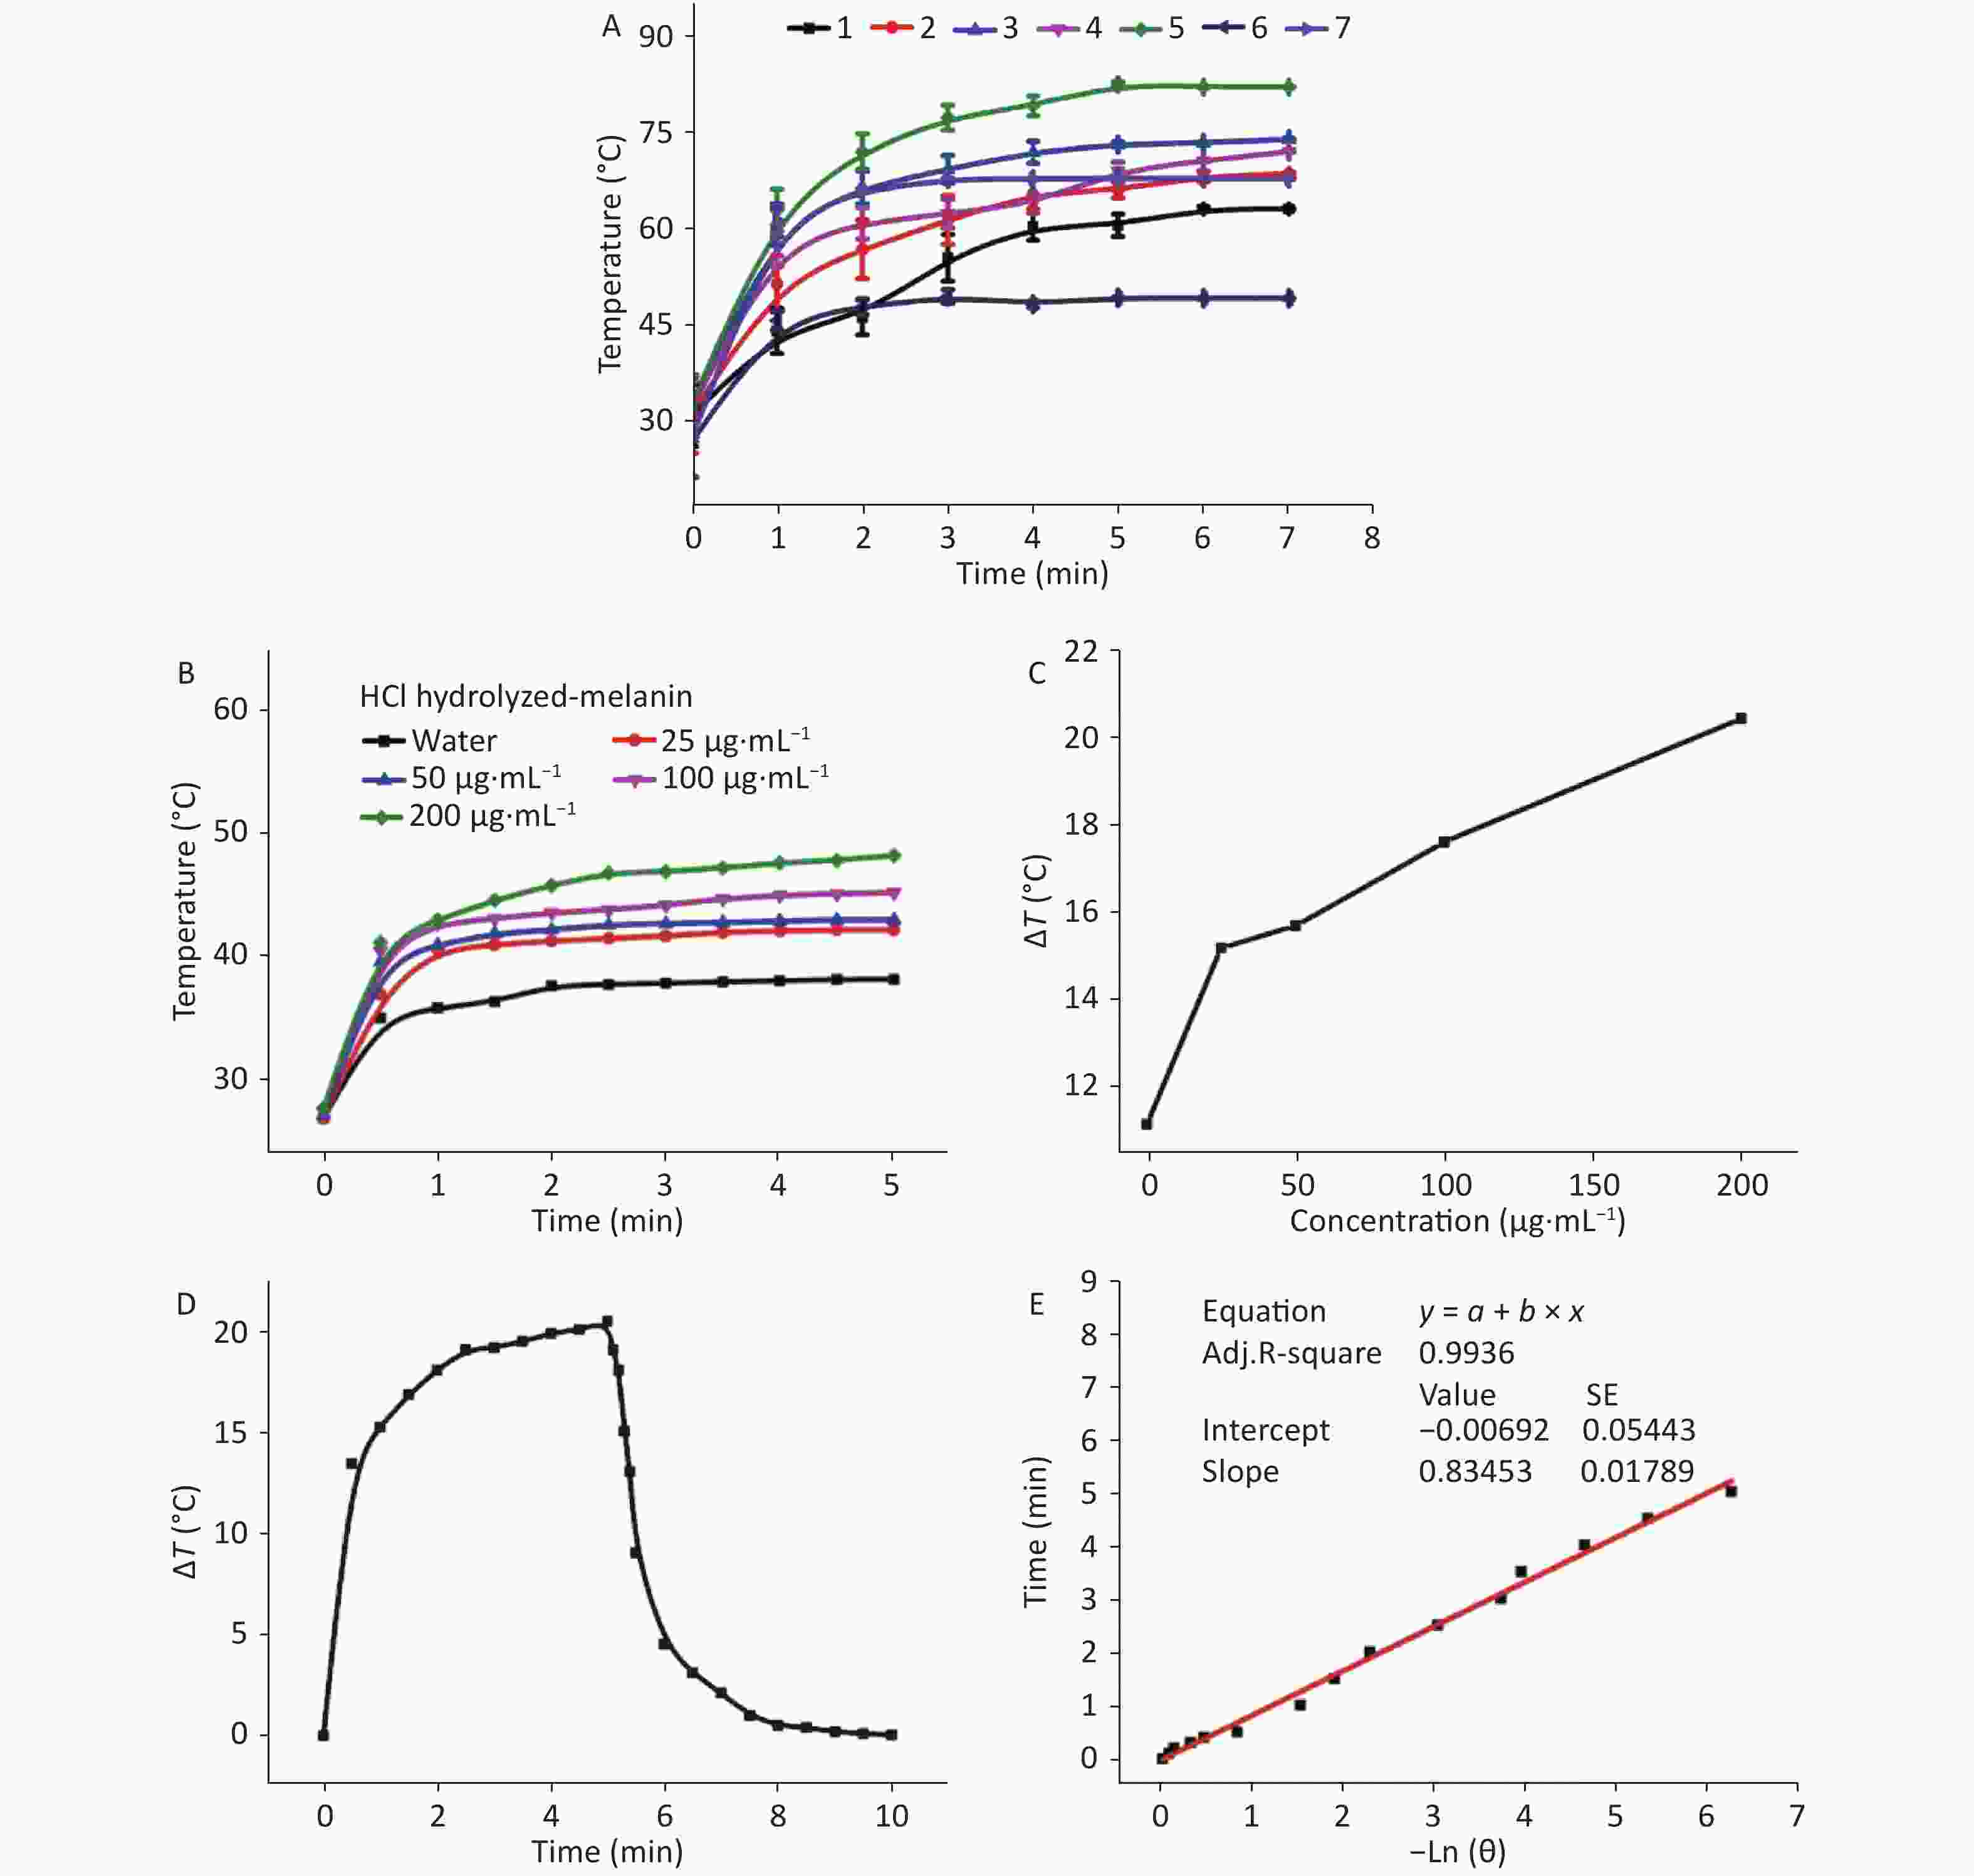
Figure 1. Photothermal conversional effects of hydrolyzed melanin. (A) Photothermal conversional effects of various concentrations of hydrolyzed melanin under NIR laser radiation at 0.8 W and 808 nm. Numbers 1 to 7 represent melanin hydrolyzed by pepsase, animal proteinase, neutral protease, alkaline protease, trypsin, compound protease, and HCl, respectively. (B) Increases in temperature of water and of aqueous suspensions of H-melanin according to duration of irradiation. (C) Temperature variations (Δ) in aqueous suspensions of H-melanin over 300 s. (D) Photothermal response of 200 μg/mL of aqueous H-melanin under NIR laser irradiation at 2 W and 808 nm for 5 min and then the laser was shut off. (E) Linear time data vs. −lnθ were acquired based on the cooling period shown in (C).
We assessed temperature changes of 25 to 200 μg/mL of melanin to determine photothermal conversion at various concentrations (Figures 1B and 2A). Since the temperature of melanin suspended in water at 200 μg/mL changed the most, we applied this concentration to calculate photothermal conversion and to correspond with the doses in the antibacterial experiments in vitro and the biocompatibility assays in vivo. After irradiation for 5 min, the temperatures of the H-melanin and T-melanin suspensions and of pure water increased by 20.4 °C (Figure 1C), 23.2 °C (Figure 2B) and 11.2 °C, respectively.
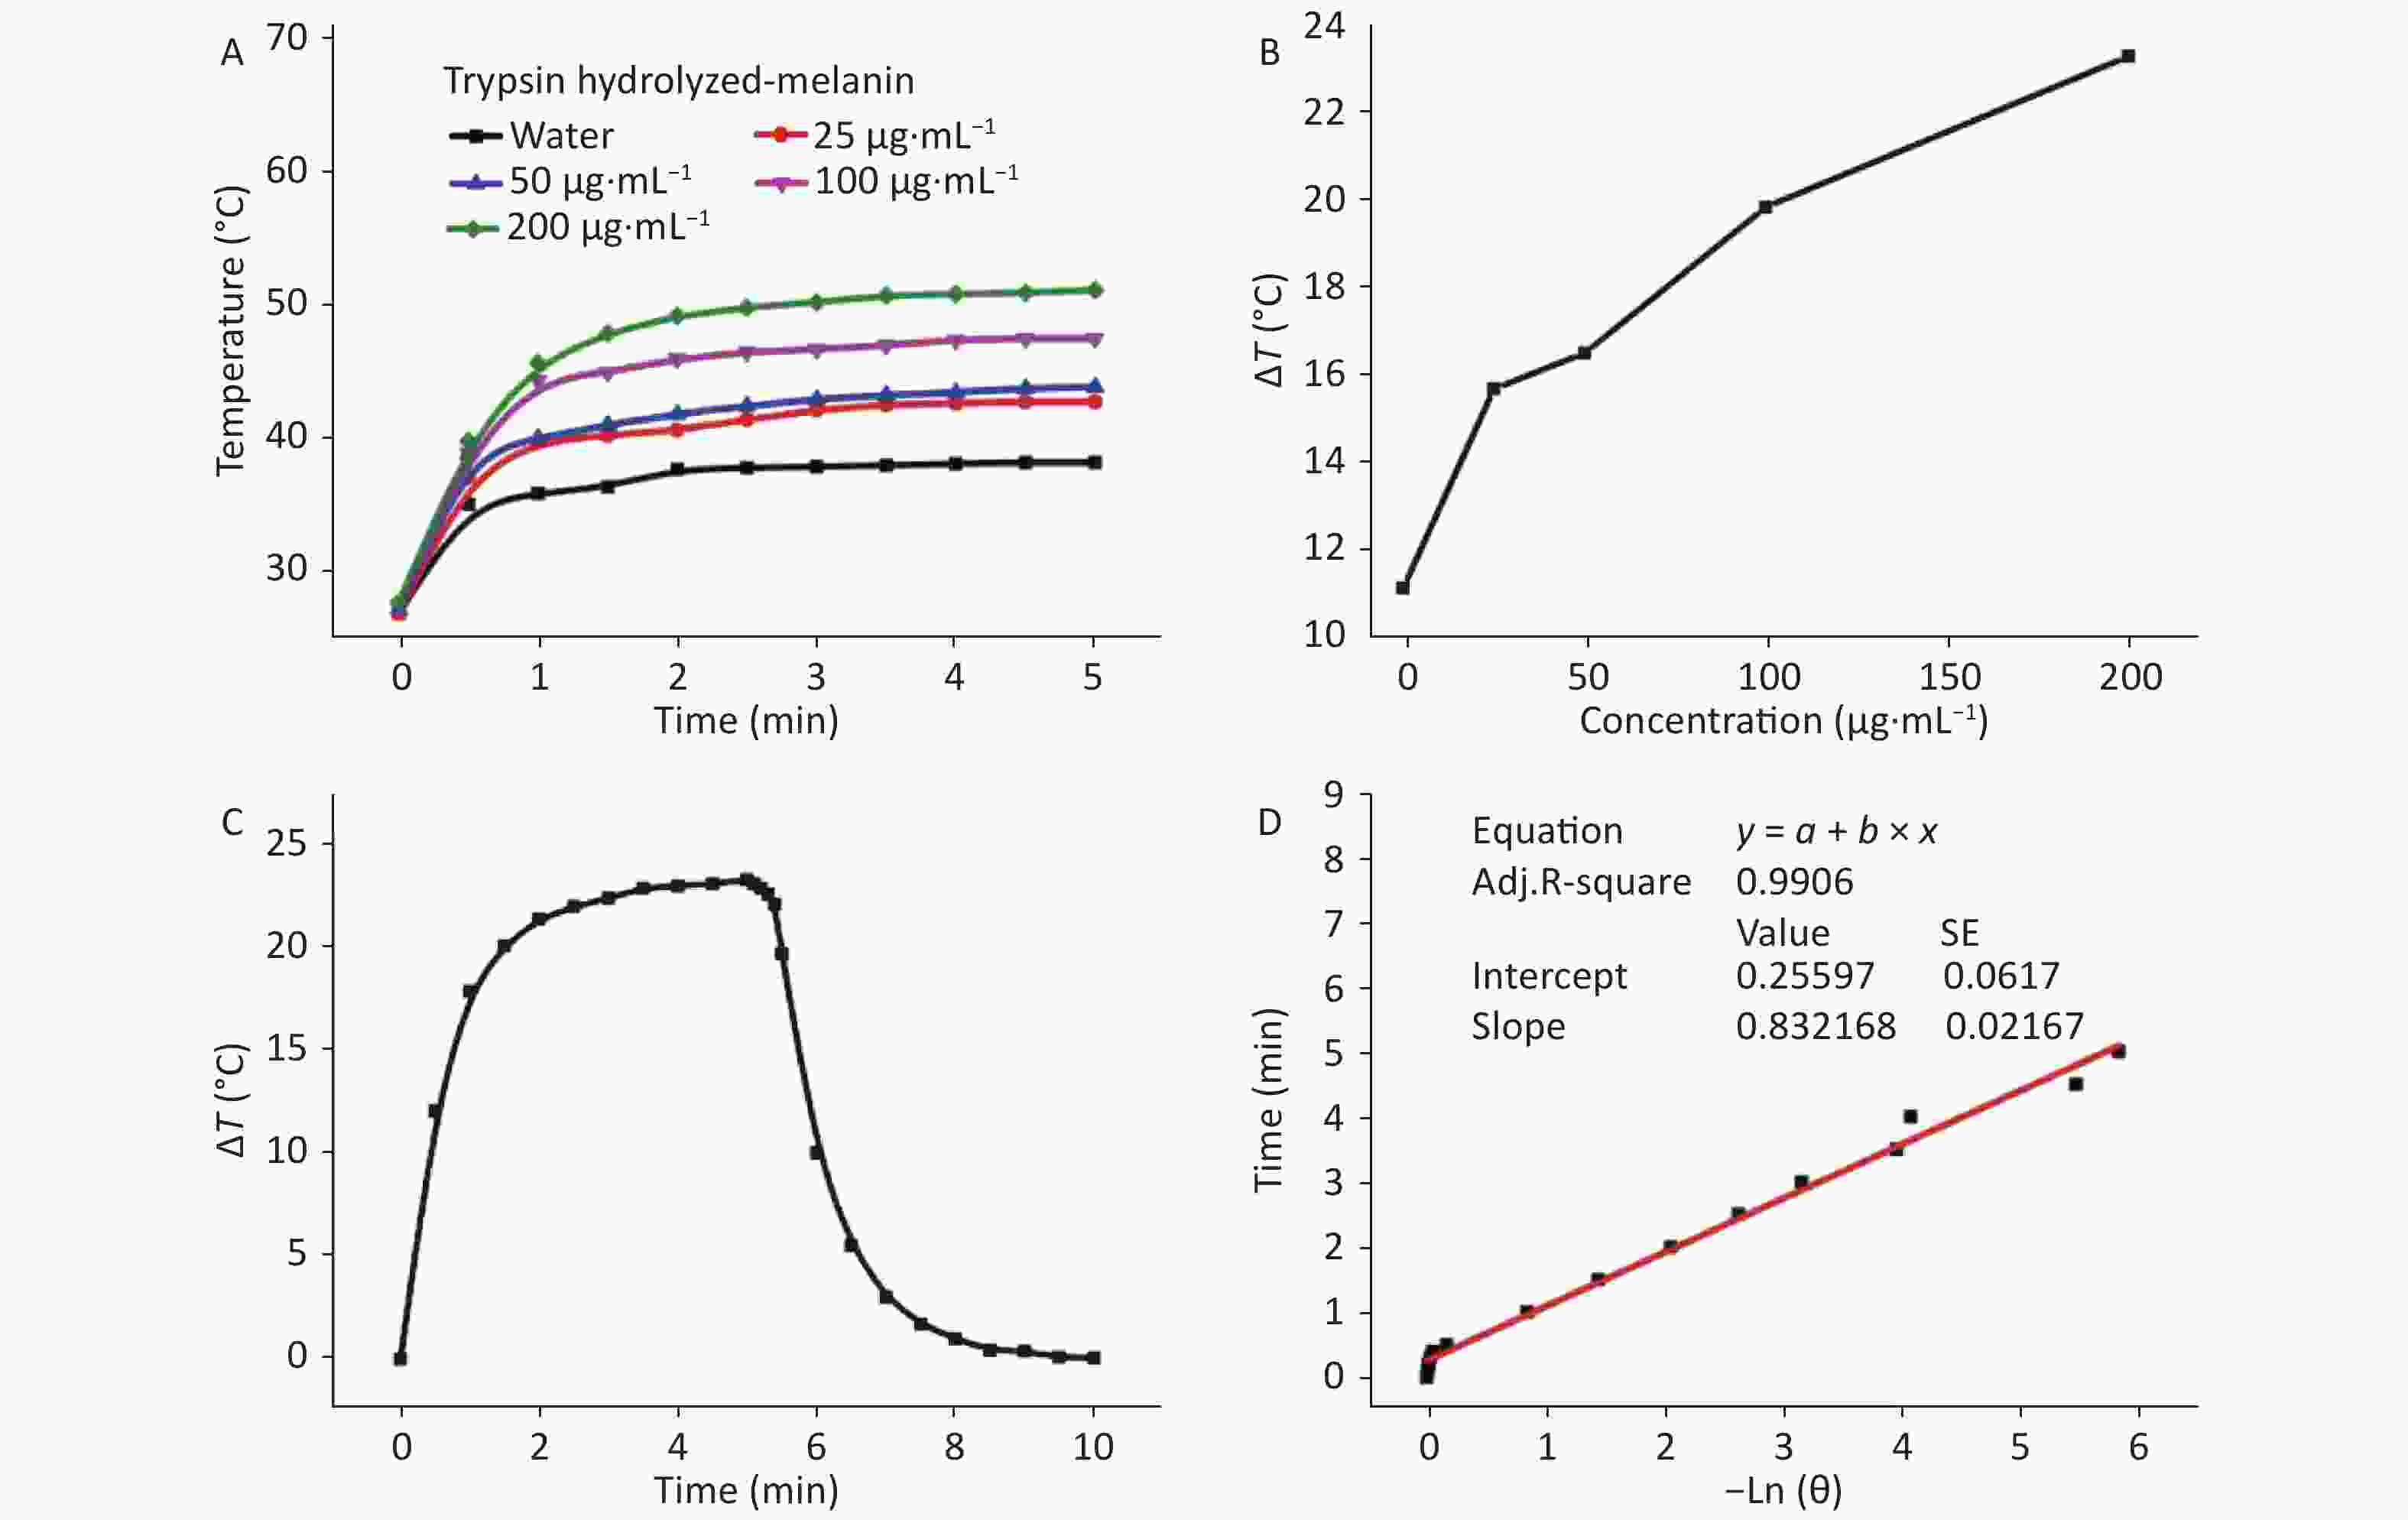
Figure 2. Photothermal responses of T-melanin. (A) Increases in temperature of water and aqueous T-melanin suspensions at various concentrations during irradiation for 5 min. (B) Temperature variations (ΔT) Temperature variations (Δ) in aqueous H-melanin suspension during 300 s. (C) Photothermal response of 200 μg/mL of aqueous T-melanin under NIR laser irradiation at 2 W and 808 nm for 5 min and then later the laser was shut off. (D) Linear time data vs. −lnθ acquired based on cooling period shown in (C).
Next, we measured the photothermal conversion efficiency (η) of H-melanin and T-melanin as described[44]. The η, t, and θ values were calculated as:
$$\eta = \frac{{hA\Delta {T_{\text{max} }} - {Q_s}}}{{I\;(1 - {{10}^{ - {A_\lambda }}})}},$$ (Eq. 1) $$t = - \frac{{\sum\limits_i {{m_i}{C_{p,i}}} }}{{hA}}ln\theta ,$$ (Eq. 2) $$\theta = \frac{{\Delta T}}{{\Delta {T_{\text{max} }}}},$$ (Eq. 3) where h is the heat transfer coefficient, A is the surface area of the container, ΔTmax is the temperature change in the melanin suspension at the maximum steady-state temperature, I is laser power, Aλ is absorbance of the melanin suspension at 808 nm, Qs is the amount of heat associated with the light absorbance of the solvent (pure water; measured independently as 25.2 mW), η is photothermal conversion efficiency, and m and C are the mass and heat capacity of the solvent (water), respectively. According to Equation 1, and Figures 1E and 2D, the η values of H-melanin and T- melanin were 22.89% and 51.35%, respectively.
-
We compared the bacteriostatic effects of T- and H-melanin against Gram-negative (E. coli) and positive
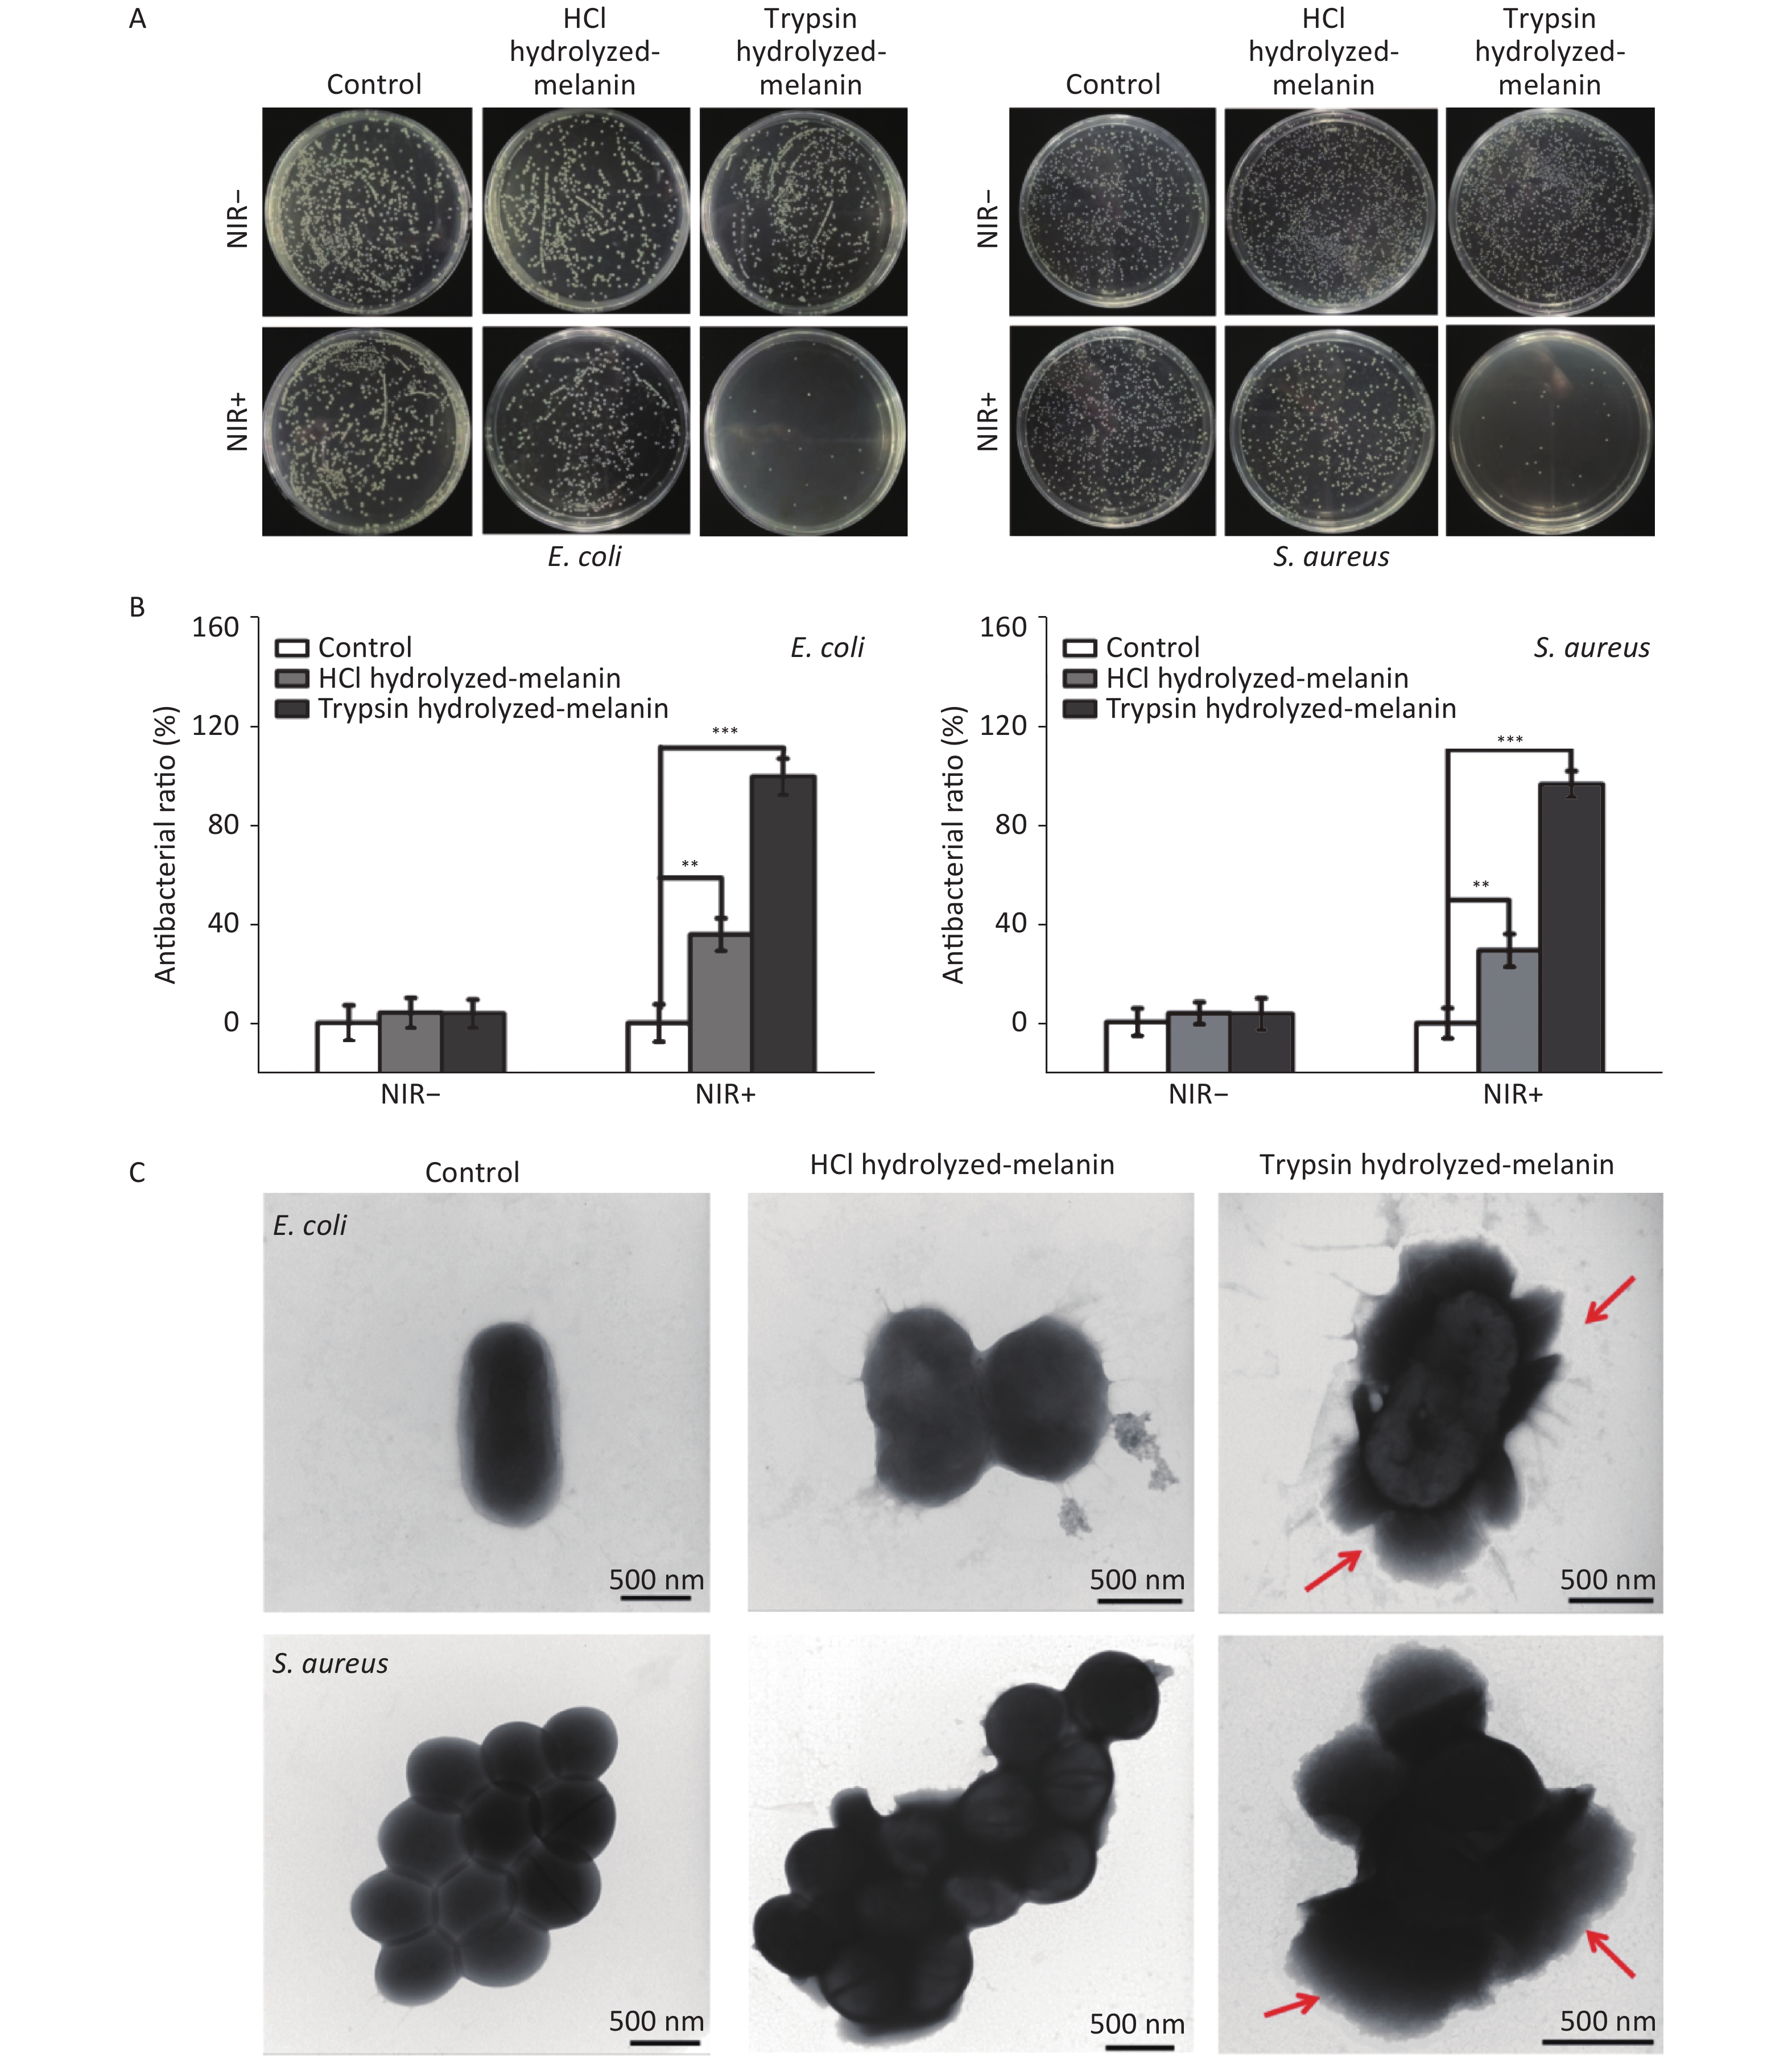
(S. aureus) bacteria. Figure 3A shows that the number of bacteria did not significantly change in the control group regardless of NIR irradiation. These findings indicated that NIR irradiation alone does not affect the normal growth of E. coli and S. aureus. After 15 min of incubation without irradiation, the numbers of E. coli and S. aureus did not significantly change in the T- and H-melanin groups compared with the controls, indicating that neither hydrolyzed melanin exerted bactericidal effects without NIR irradiation. In contrast, the numbers of bacteria in the H- and T-melanin groups slightly and significantly decreased respectively, after 15 min of NIR radiation compared with none. These findings indicated H- and T-melanin was weakly, and more strongly bactericidal, respectively, against E. coli and S. aureus.
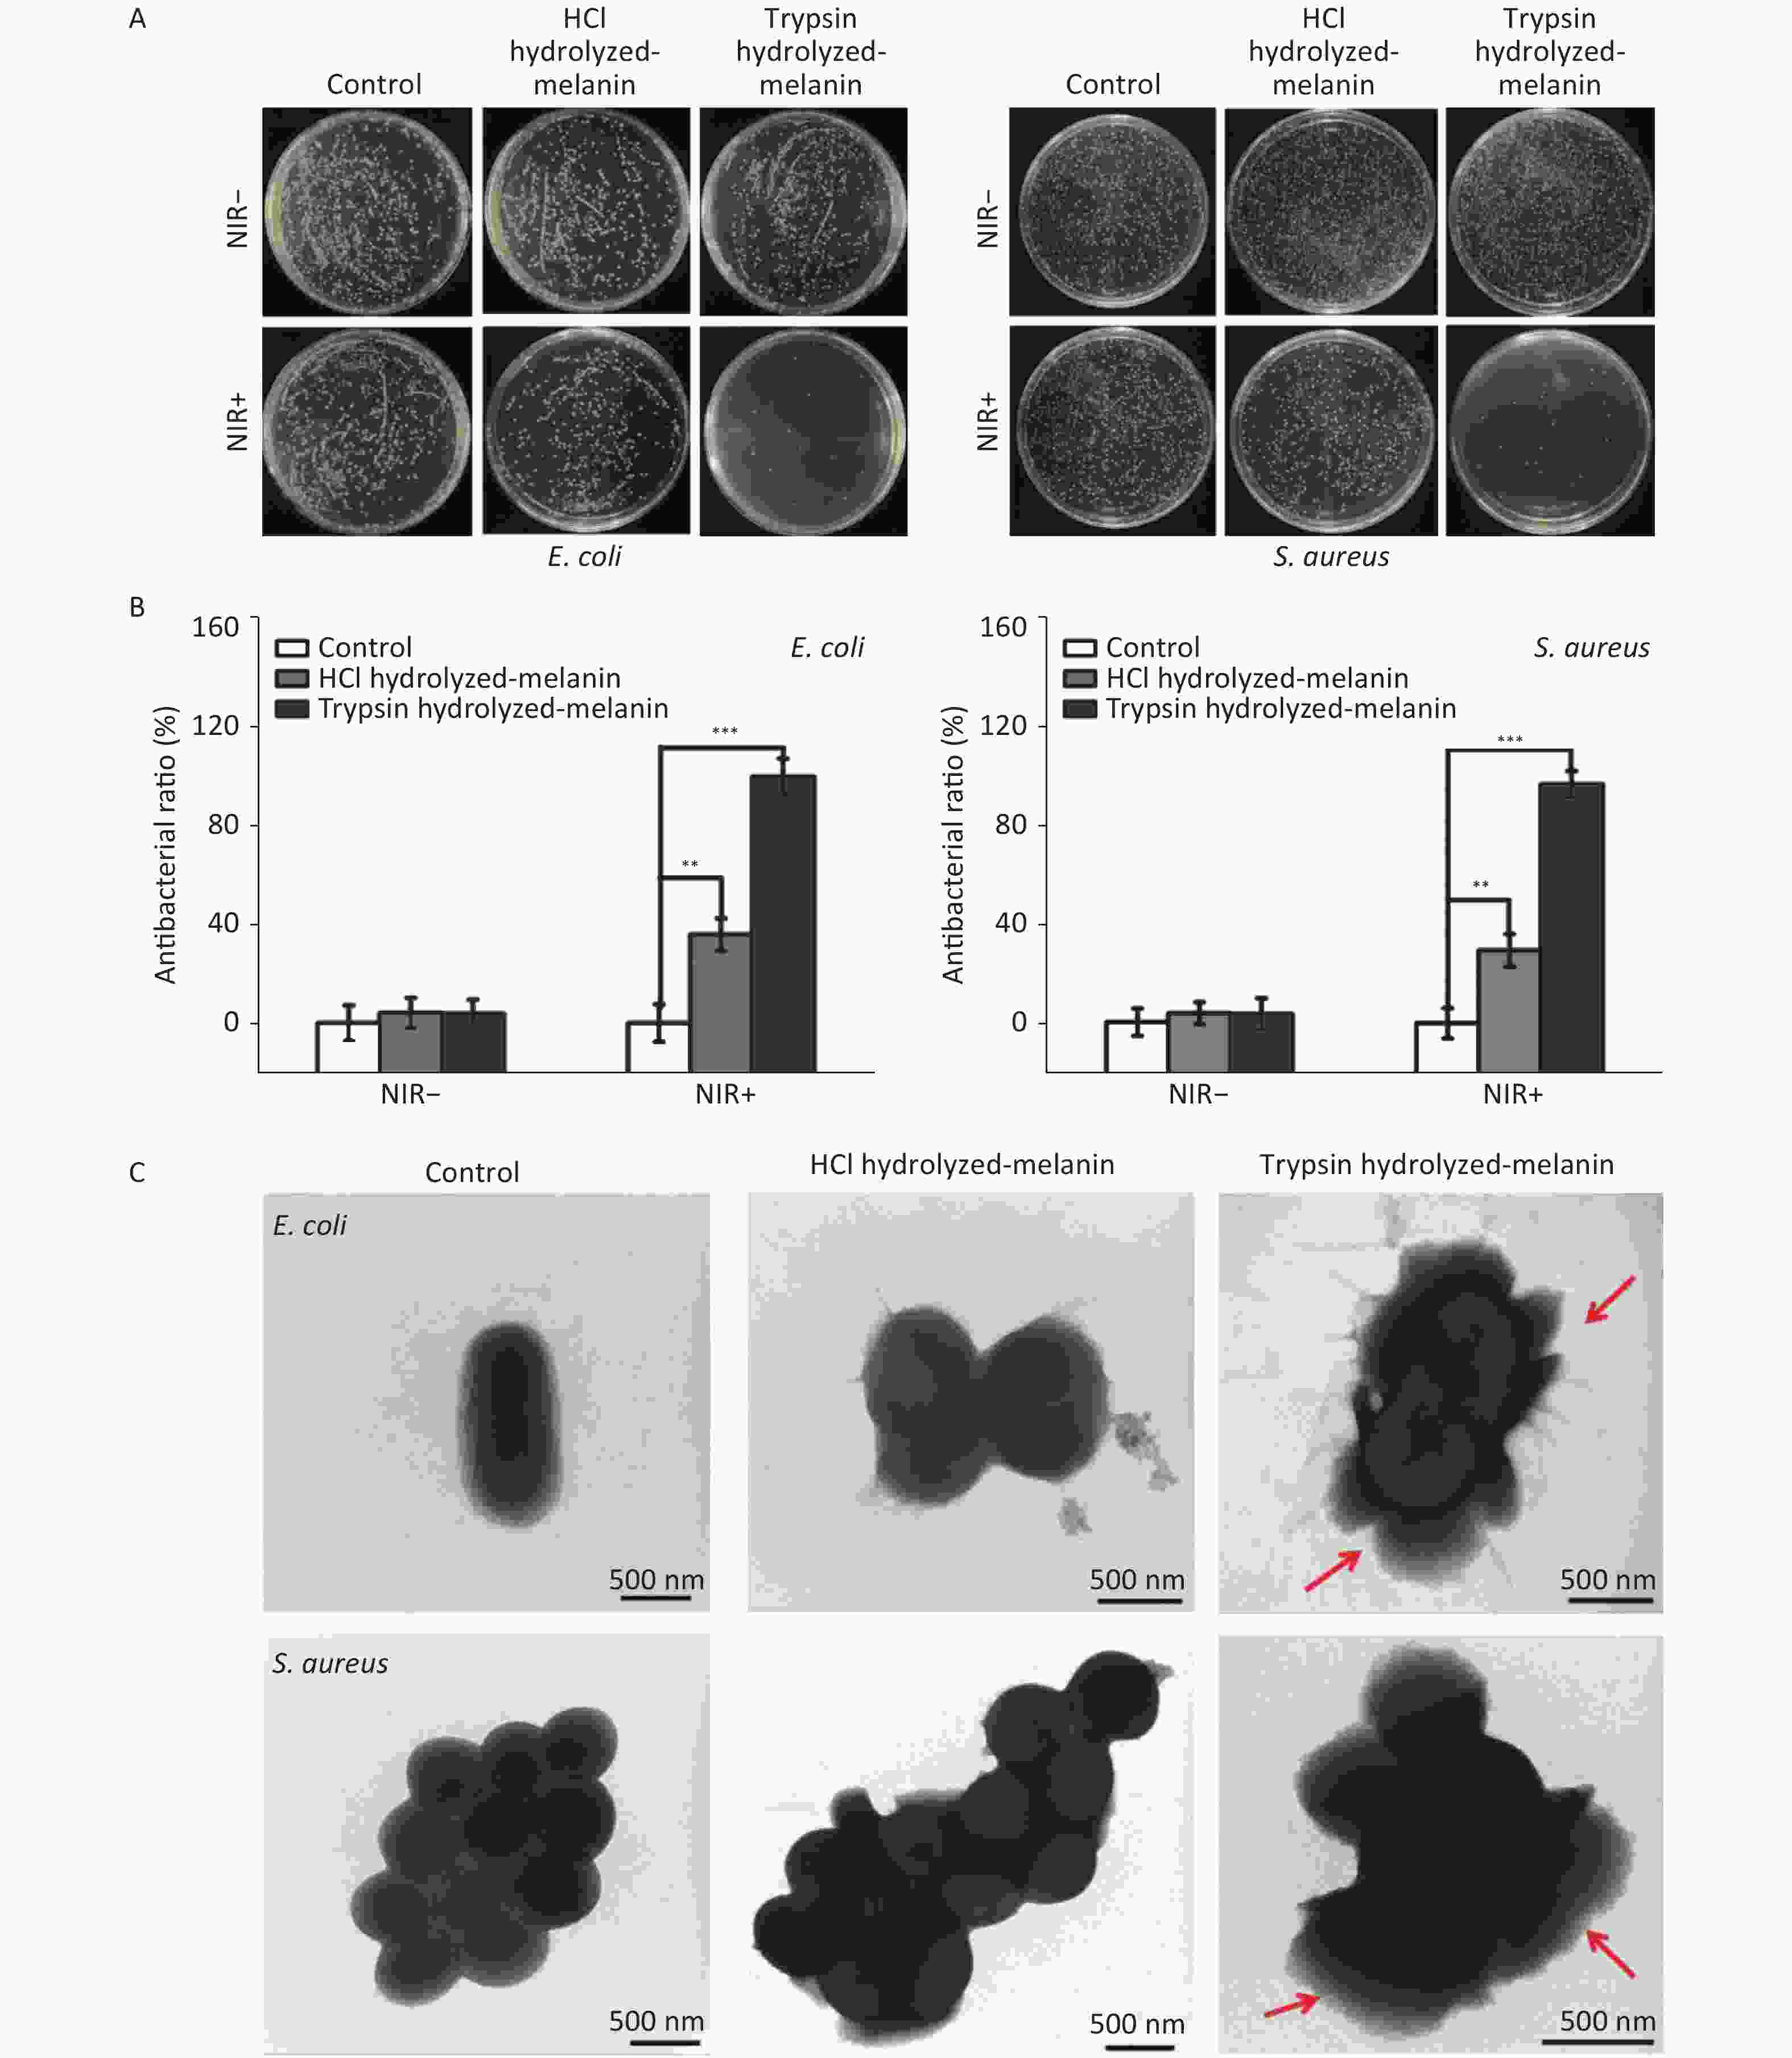
Figure 3. Escherichia coli (E. coli) and Staphylococcus aureus (S. aureus) incubated with H-melanin and T-melanin followed by NIR irradiation for 15 min. (A) Photographs show E. coli and S. aureus after incubation with melanin followed by NIR irradiation. (B) Antibacterial ratios against E. coli and S. aureus. Data are presented as means ± SD
(n = 3; **P < 0.01 and ***P < 0.001). (C) TEM images for E. coli and S. aureus incubated T-melanin and H-melanin. NIR-, without, and NIR+, with near infrared radiation. With NIR irradiation, the bacteriostatic rates of H- and T-melanin against E. coli and S. aureus were 35.43% and 29.10% (Figure 3B), and 97.43% and 94.23%, respectively.
Changes in the morphology of individual E. coli and S. aureus cells after different treatments were assessed by TEM. Figure 3C shows that the bacteria in the control group appeared normal, with a complete membrane structure and a normal rod-like or spherical shape. The edges of E. coli and S. aureus cells exposed to NIR irradiation for 15 min and incubated with H-melanin were slightly broken, but the basic shape persisted. In contrast, the cell walls and membranes of these bacteria similarly exposed to NIR irradiation and incubated with T-melanin were completely ruptured, releasing the cytoplasm into the milieu (red arrow). These findings indicated that T-melanin together with NIR irradiation are bacteriostatic and can play a sterilizing role.
-
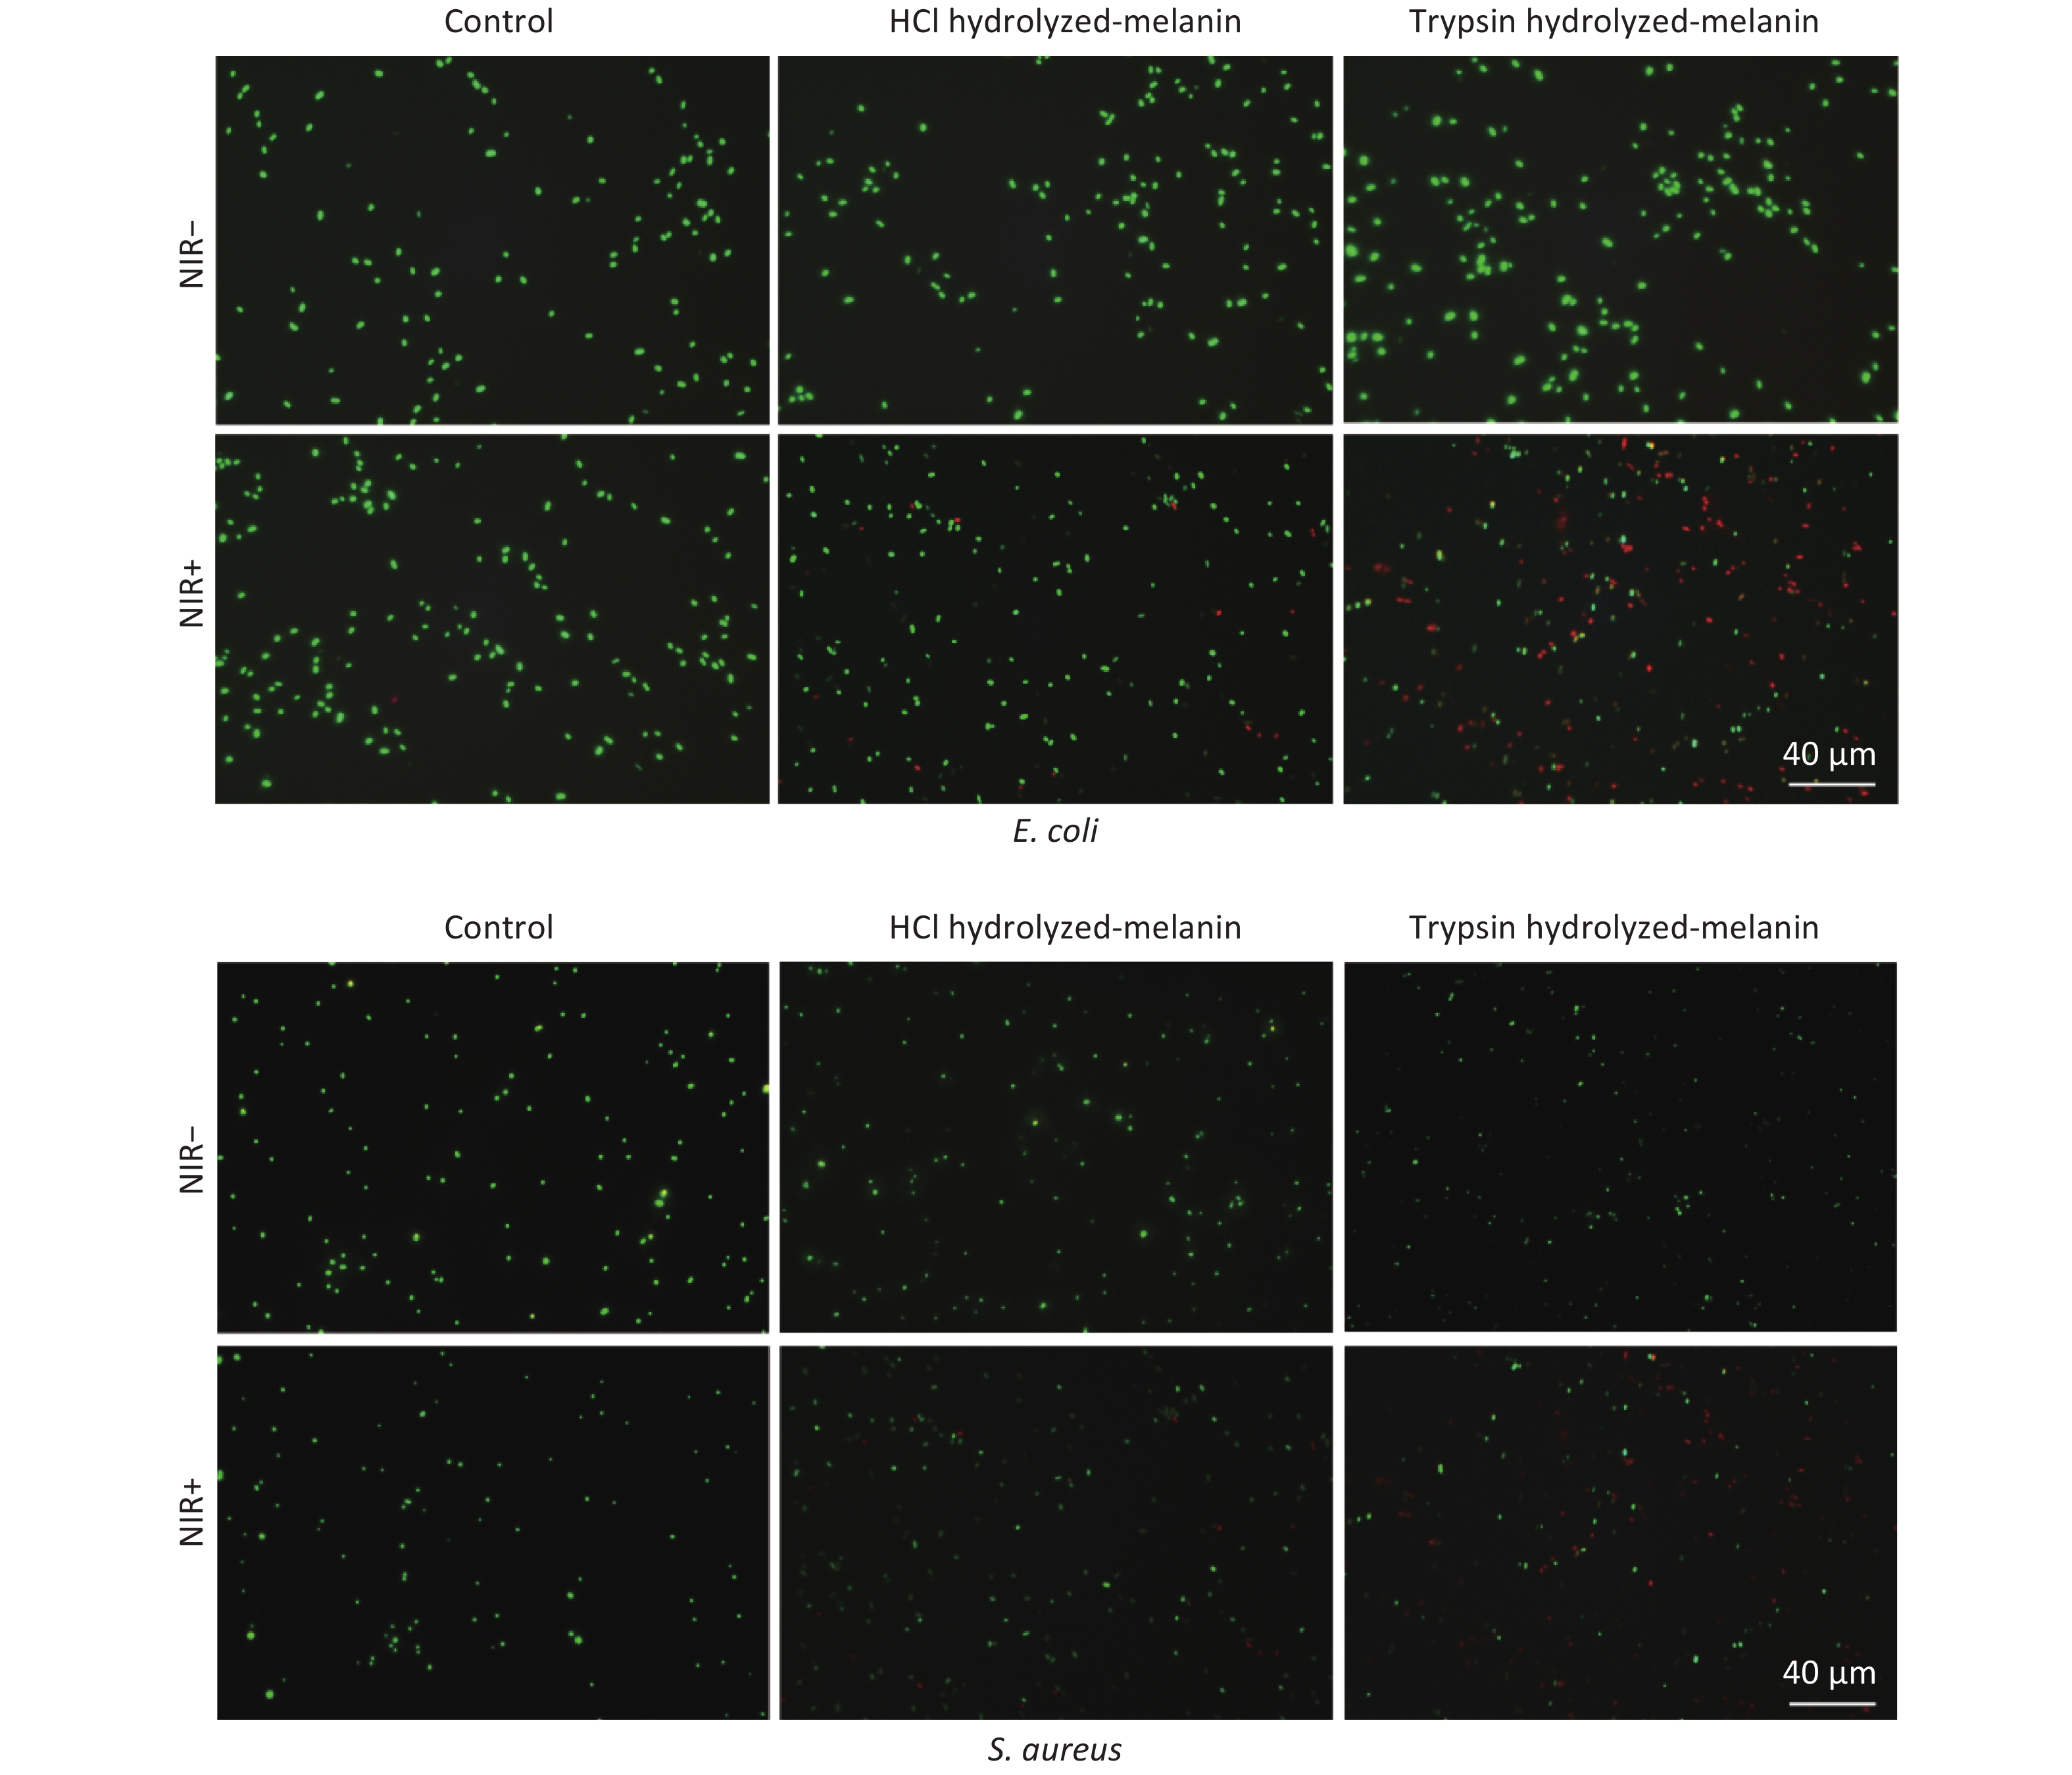
Bacterial viability after incubation with H- and T-melanin and exposure to NIR was determined using LIVE/DEAD BacLight kits (Thermo Fisher Scientific Inc.). Viable and dead bacteria are stained green and red, respectively.
Figure 4 shows that control E. coli and S. aureus incubated without H-melanin stained green with or without NIR irradiation, indicating that NIR alone cannot kill these bacteria. Incubating the bacteria with H-melanin in the absence of NIR irradiation showed that H-melanin was not cytotoxic. Furthermore, NIR irradiation of the H-melanin group killed only a few cells, indicating a slight bactericidal effect against E. coli and S. aureus.
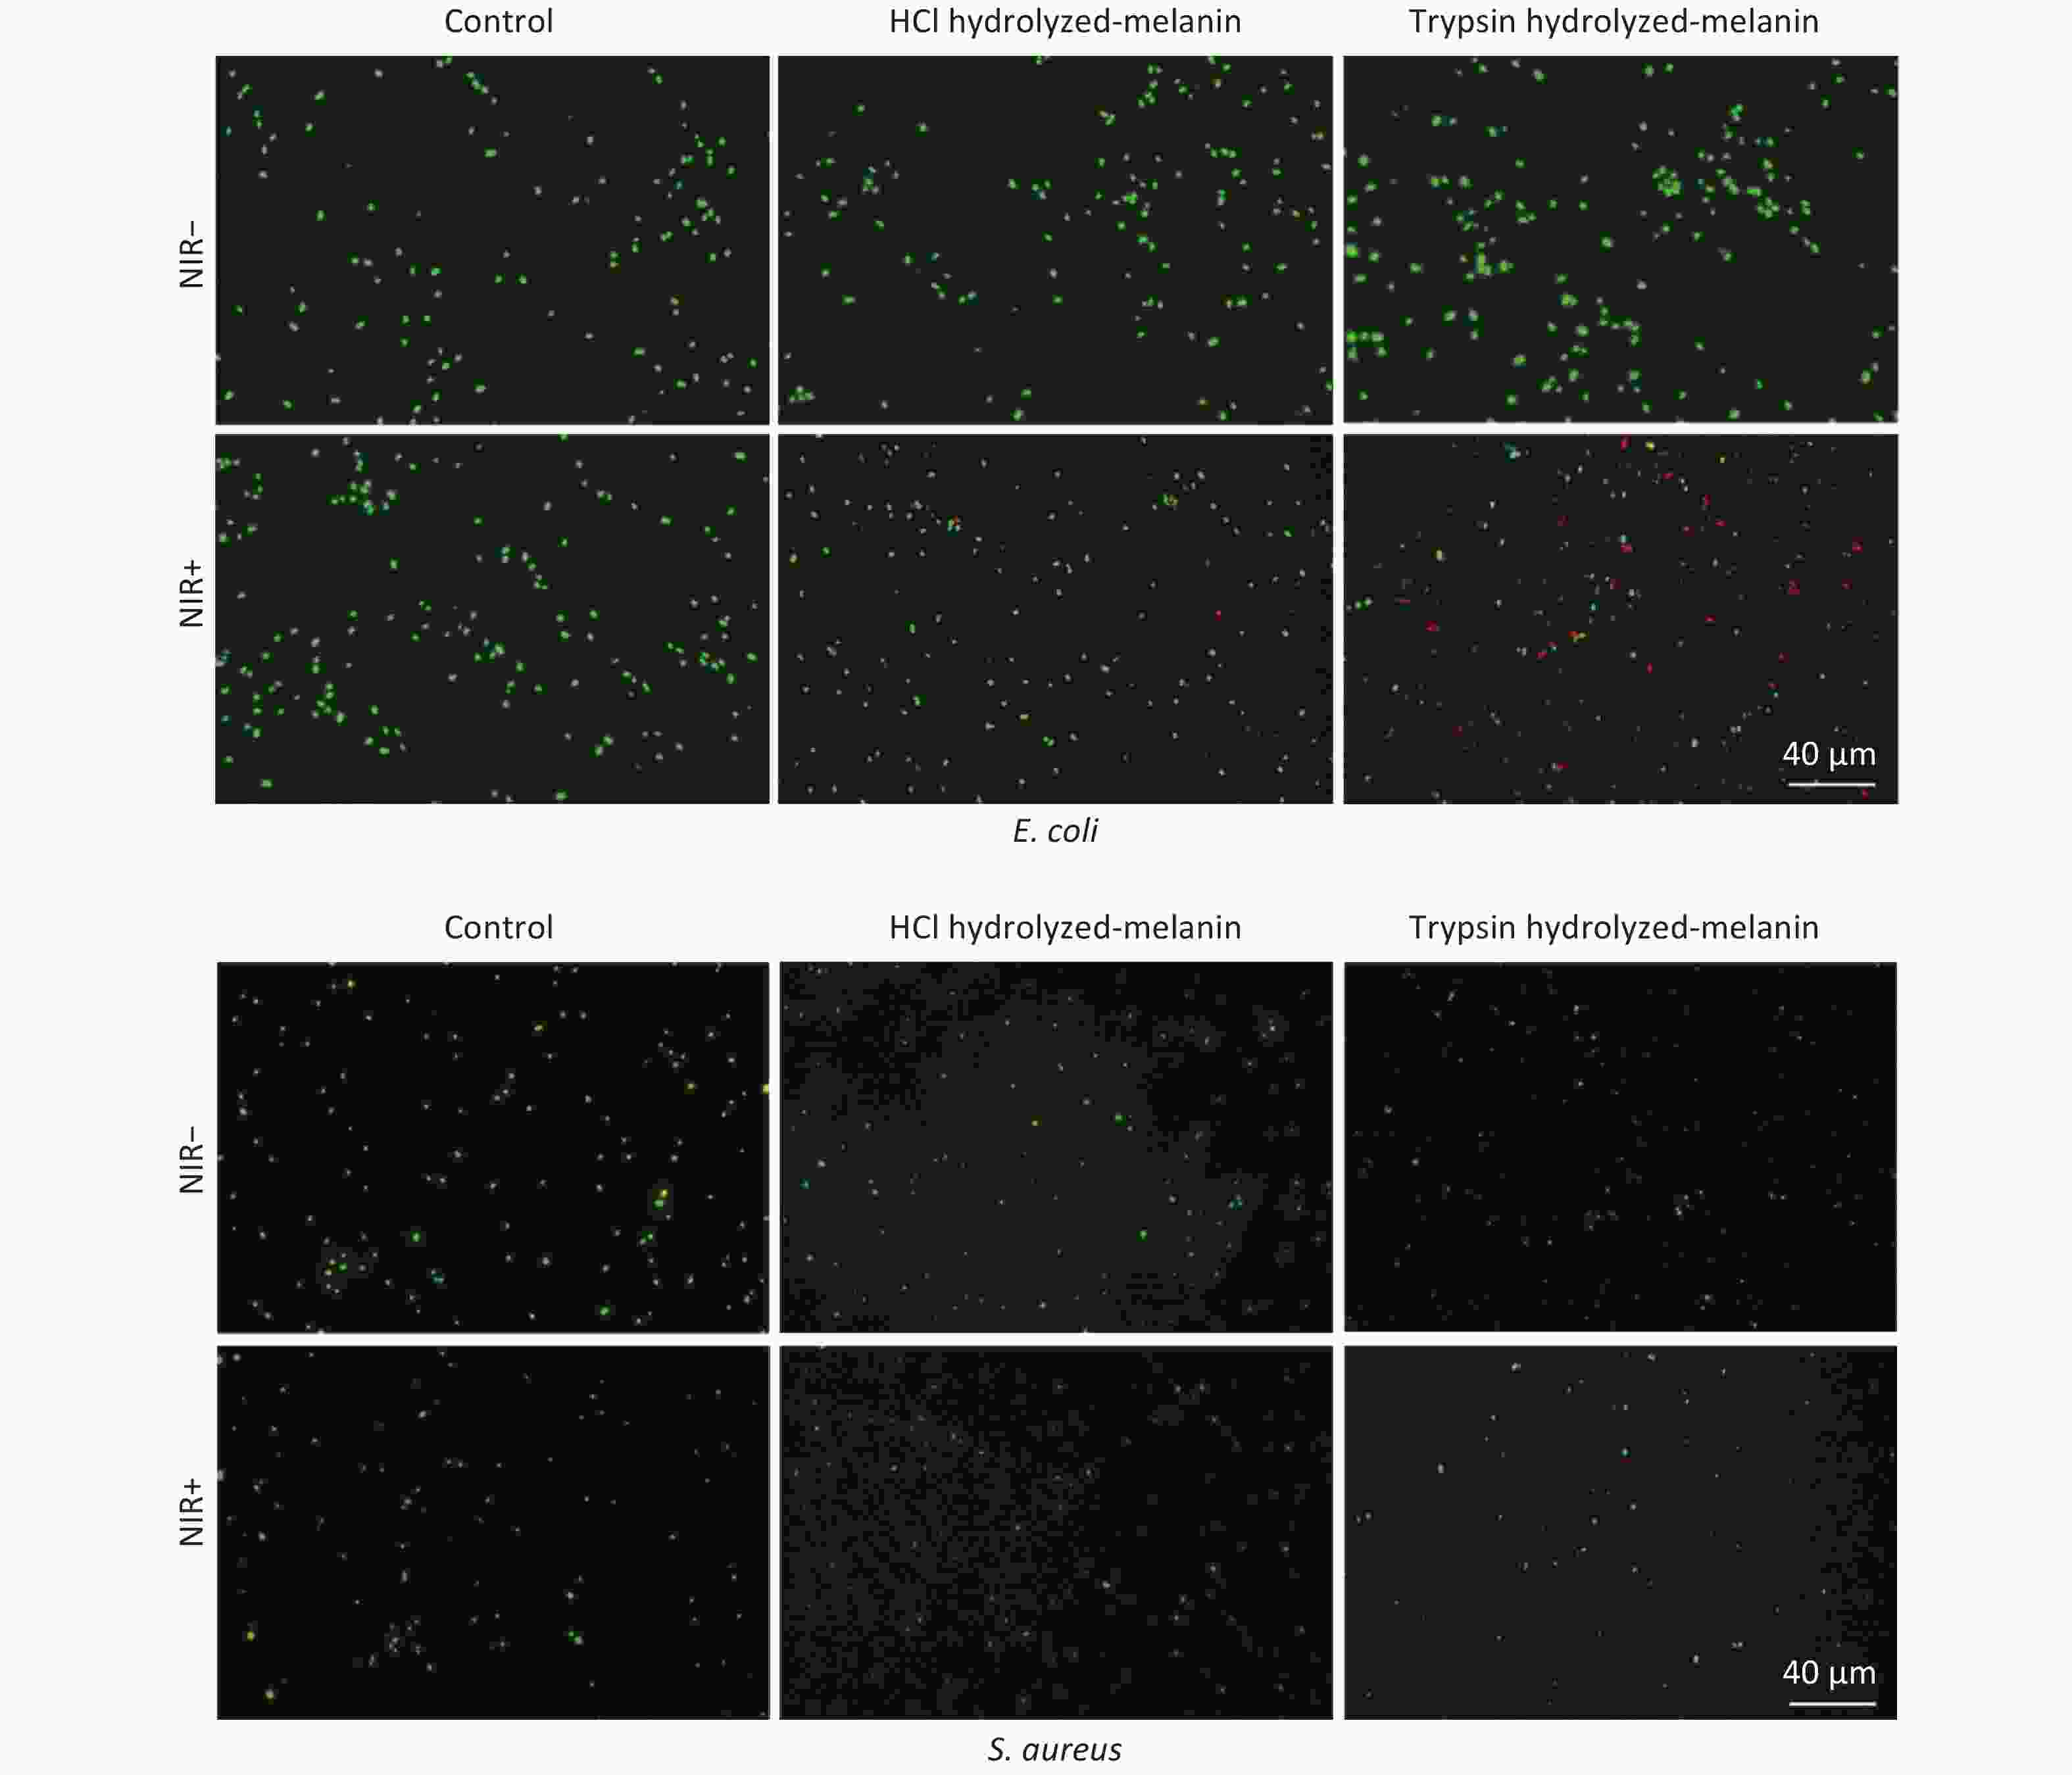
Figure 4. Representative fluorescence images of viability of E. coli and S. aureus cell incubated with T- or H- melanin and with or without NIR irradiation. NIR-, without, and NIR+, with near infrared radiation.
Green cells found after incubating these bacteria with T-melanin but without NIR exposure indicated that these bacteria remained viable. However, most cells exposed to T-melanin together with NIR irradiation were stained red, indicating that T-melanin exerted more powerful bactericidal and sterilization effects than H-melanin.
-
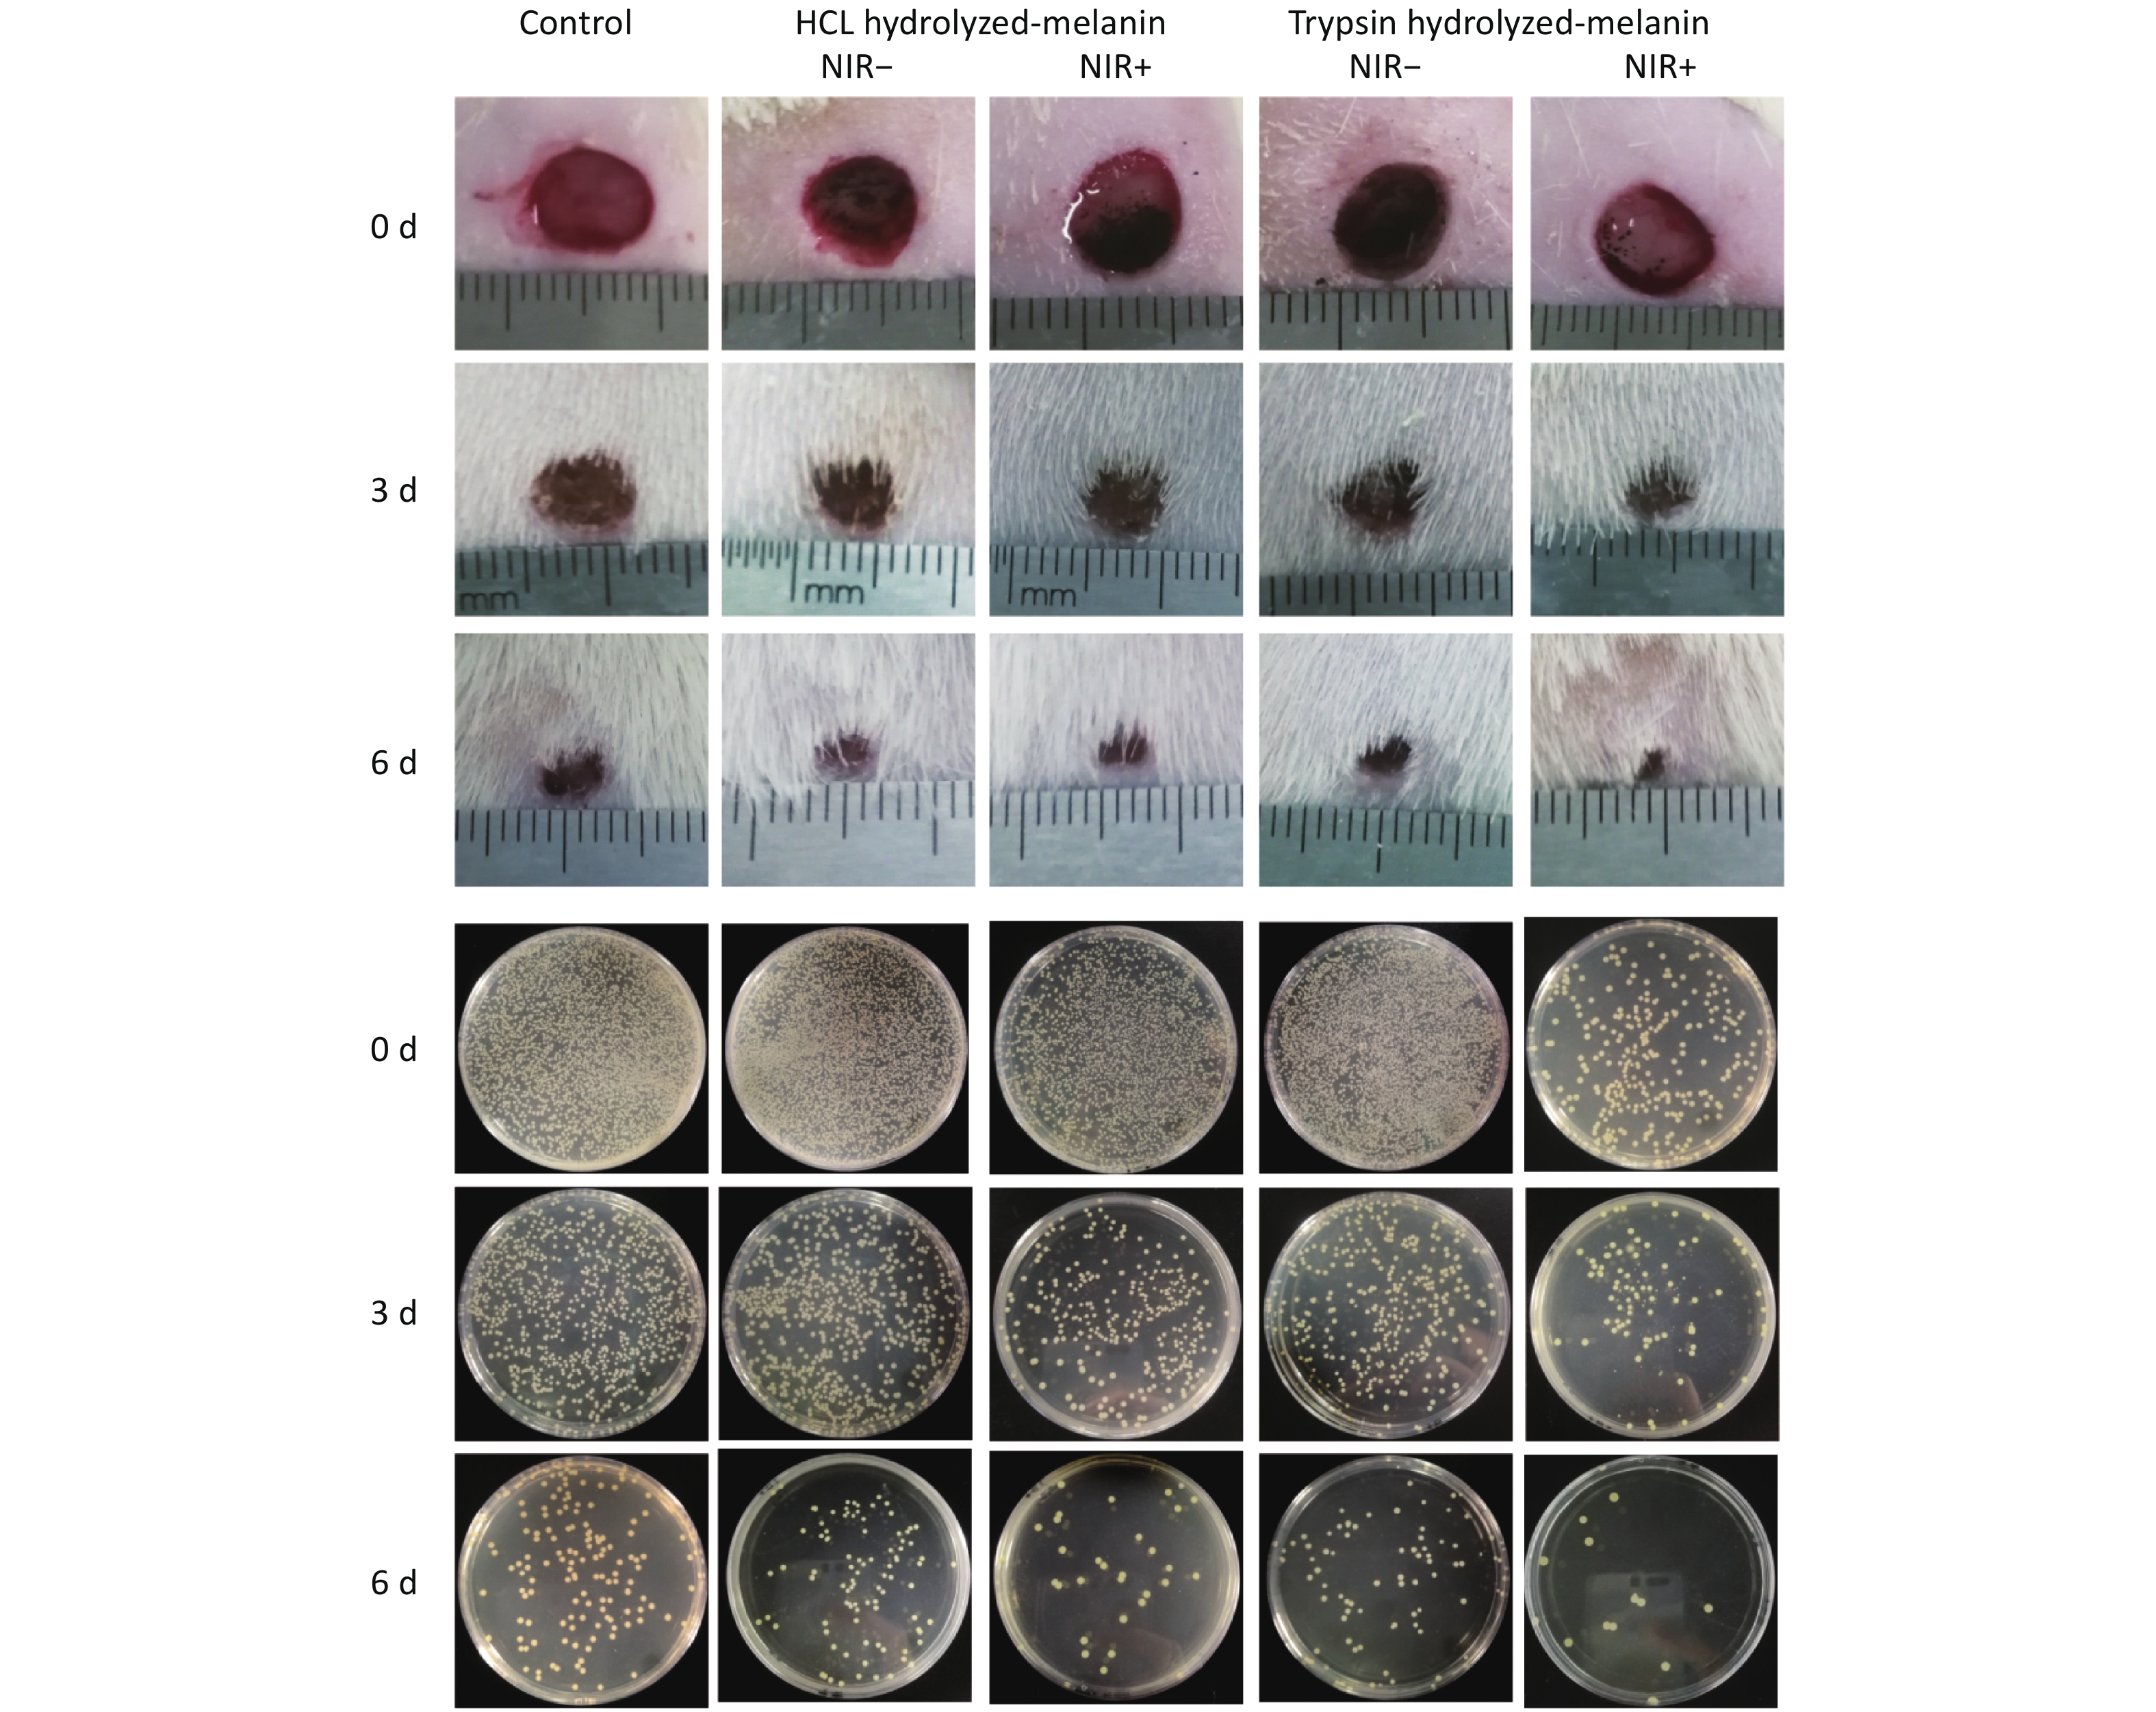
Based on the antibacterial findings in vitro, we assessed the wound healing activities of H-melanin and T-melanin in vivo, individually. In brief, a rat model of bacterial infection was constructed by local infection with the resistant S. aureus. Thereafter, the infected rats were randomized as H-melanin, T-melanin, and control groups, separately (Figure 5). On the day 0, the drug-resistant S. aureus infected wounds in the three groups were of equal size. On the day 3, all three groups of wounds were healed to varying degrees. The T-melanin group with NIR+ had the smallest wound area, followed by the H-melanin group, while the control group had the largest wound area. By day 6, the T-melanin group with NIR+ was basically healed, the healing effects were significant compared with H-melanin ad the control group.
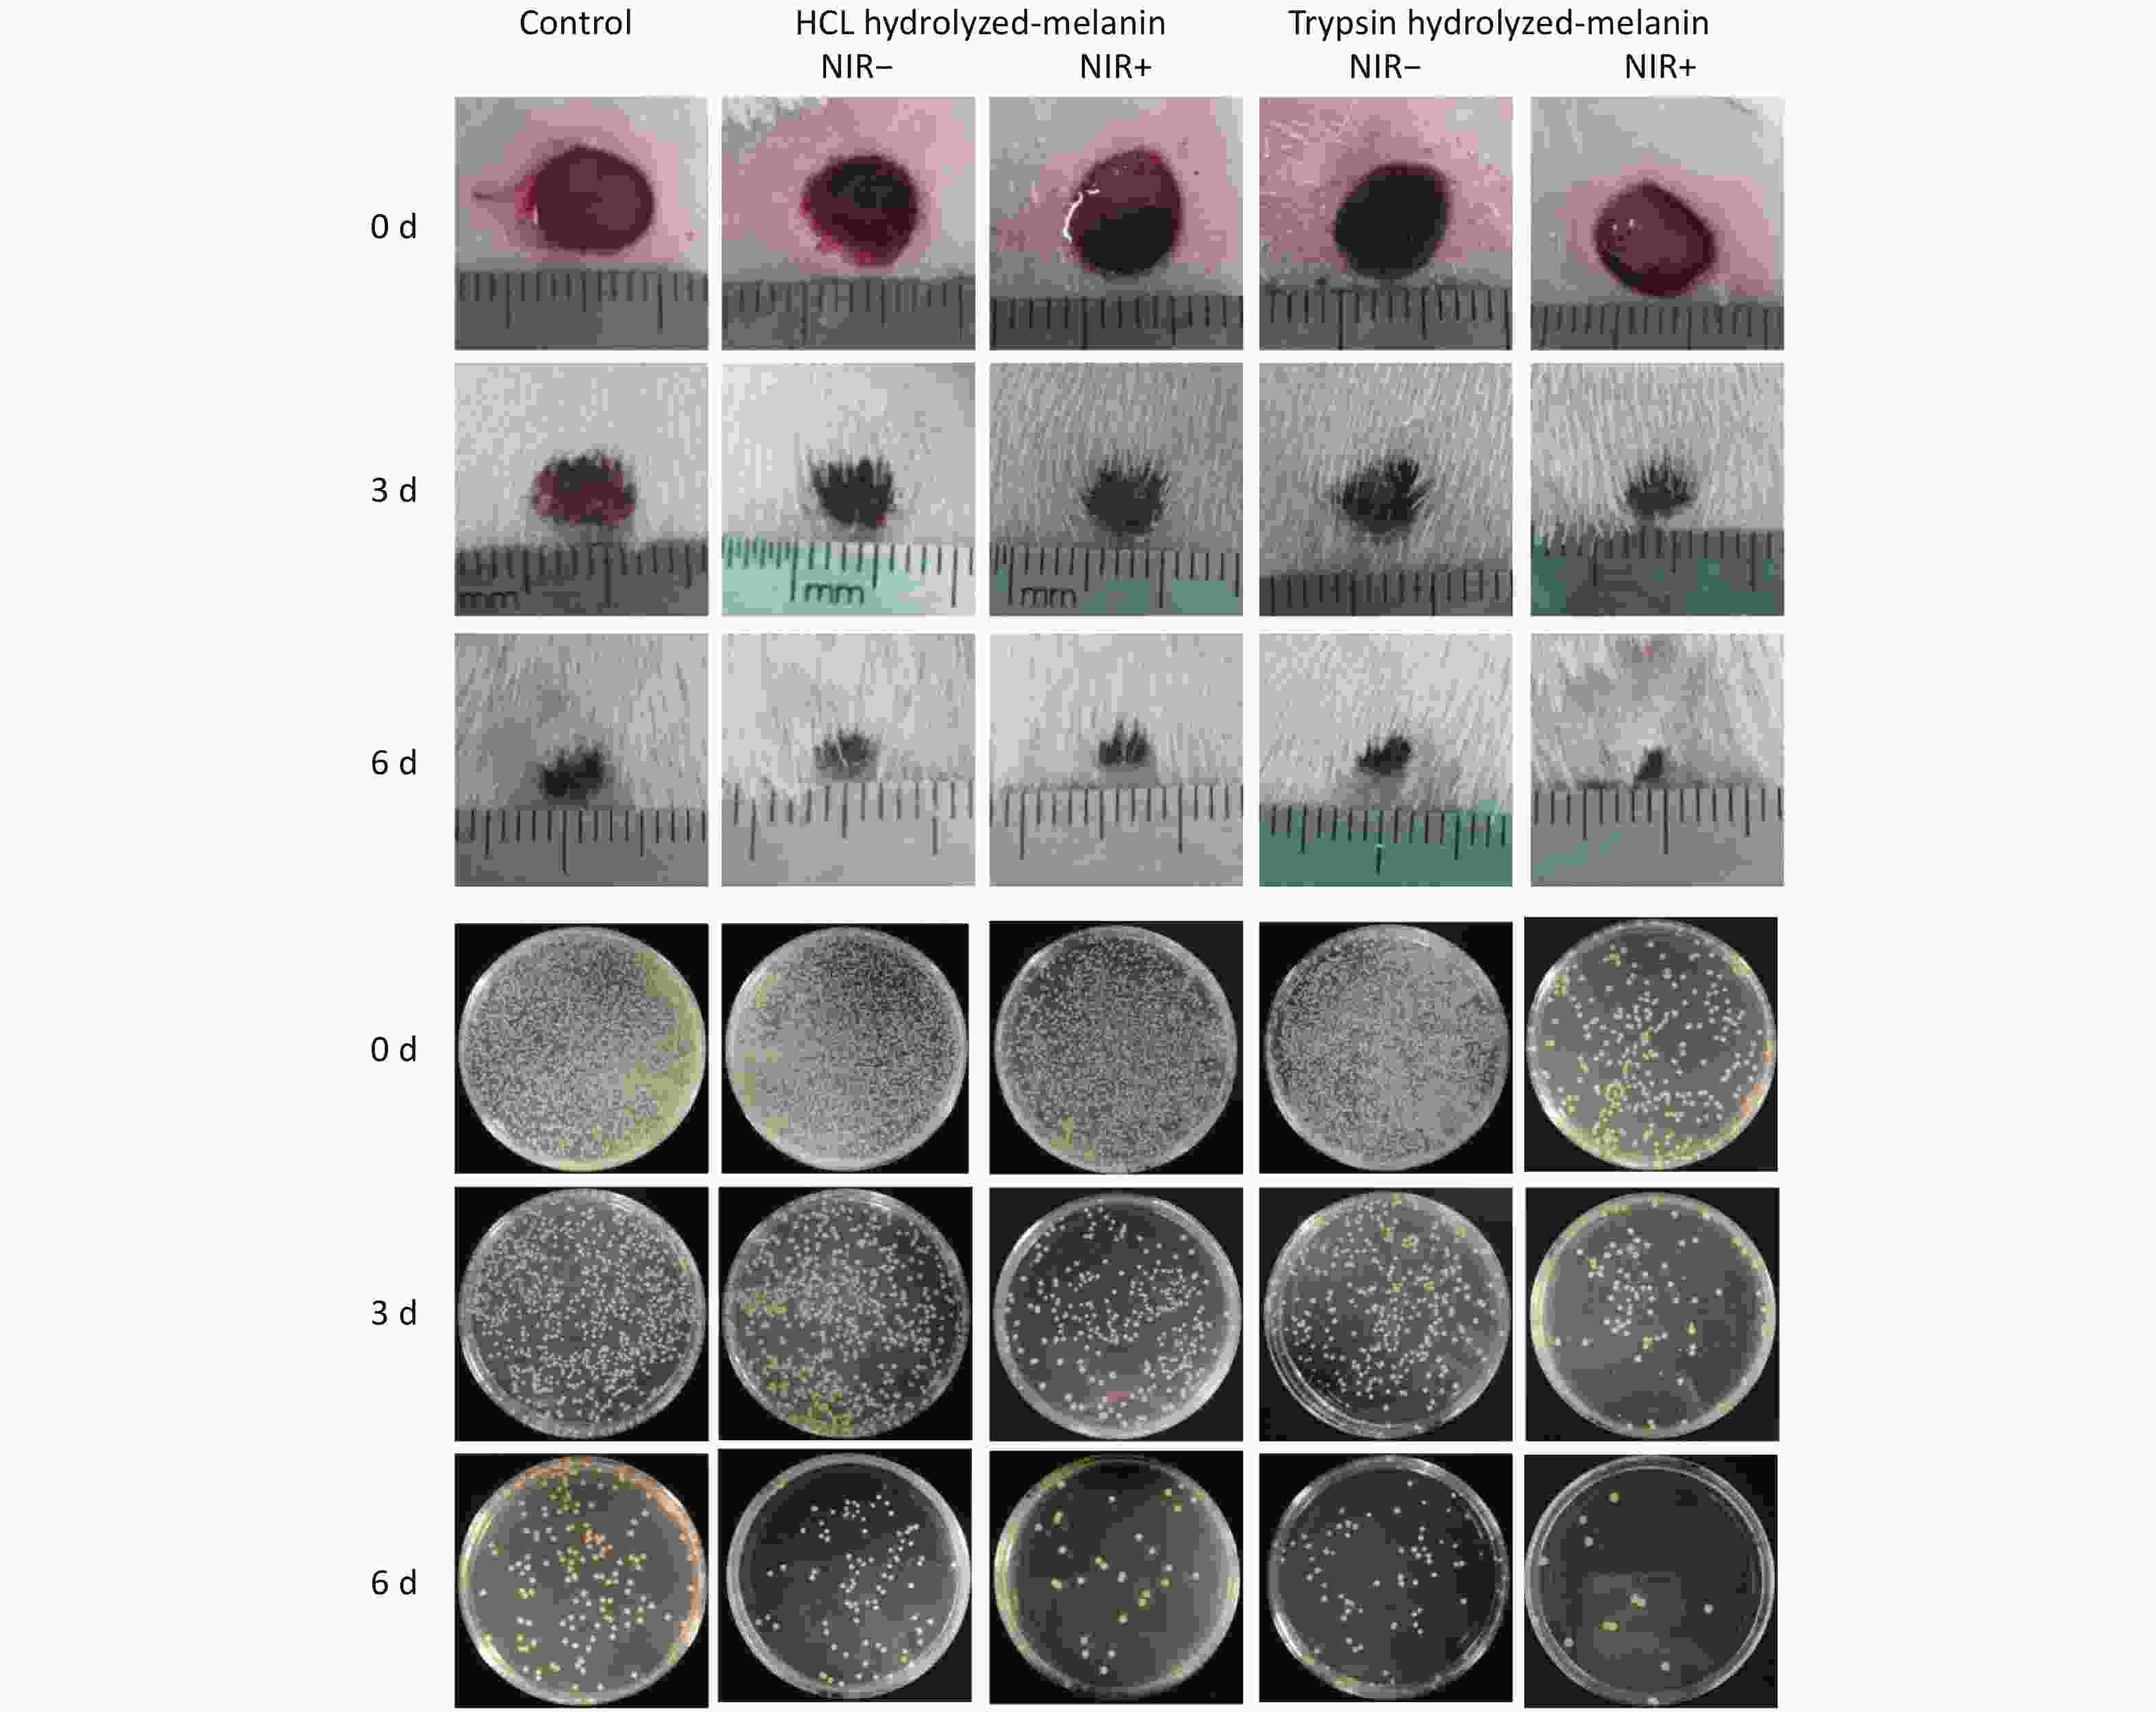
Figure 5. Wound tissues and bacterial colonies collected after treatment with melanin and NIR irradiation days 0, 3, and 6.
We quantified the wound healing process by comparing wound sizes on days 3 and 6 with that on day 0 (Figure 6A). The size of wounds significantly differed in the group treated with T-melanin and NIR radiation compared with the control on day 3 (P < 0.01). The wounded area was significantly smaller on day 6 in the group treated with T-melanin and NIR radiation compared with the control (P < 0.05) and the NIR- irradiated H-melanin group (P < 0.001). These findings confirmed that the high temperature of NIR induced the maximal bactericidal effect of T-melanin against these methicillin-resistant bacteria.
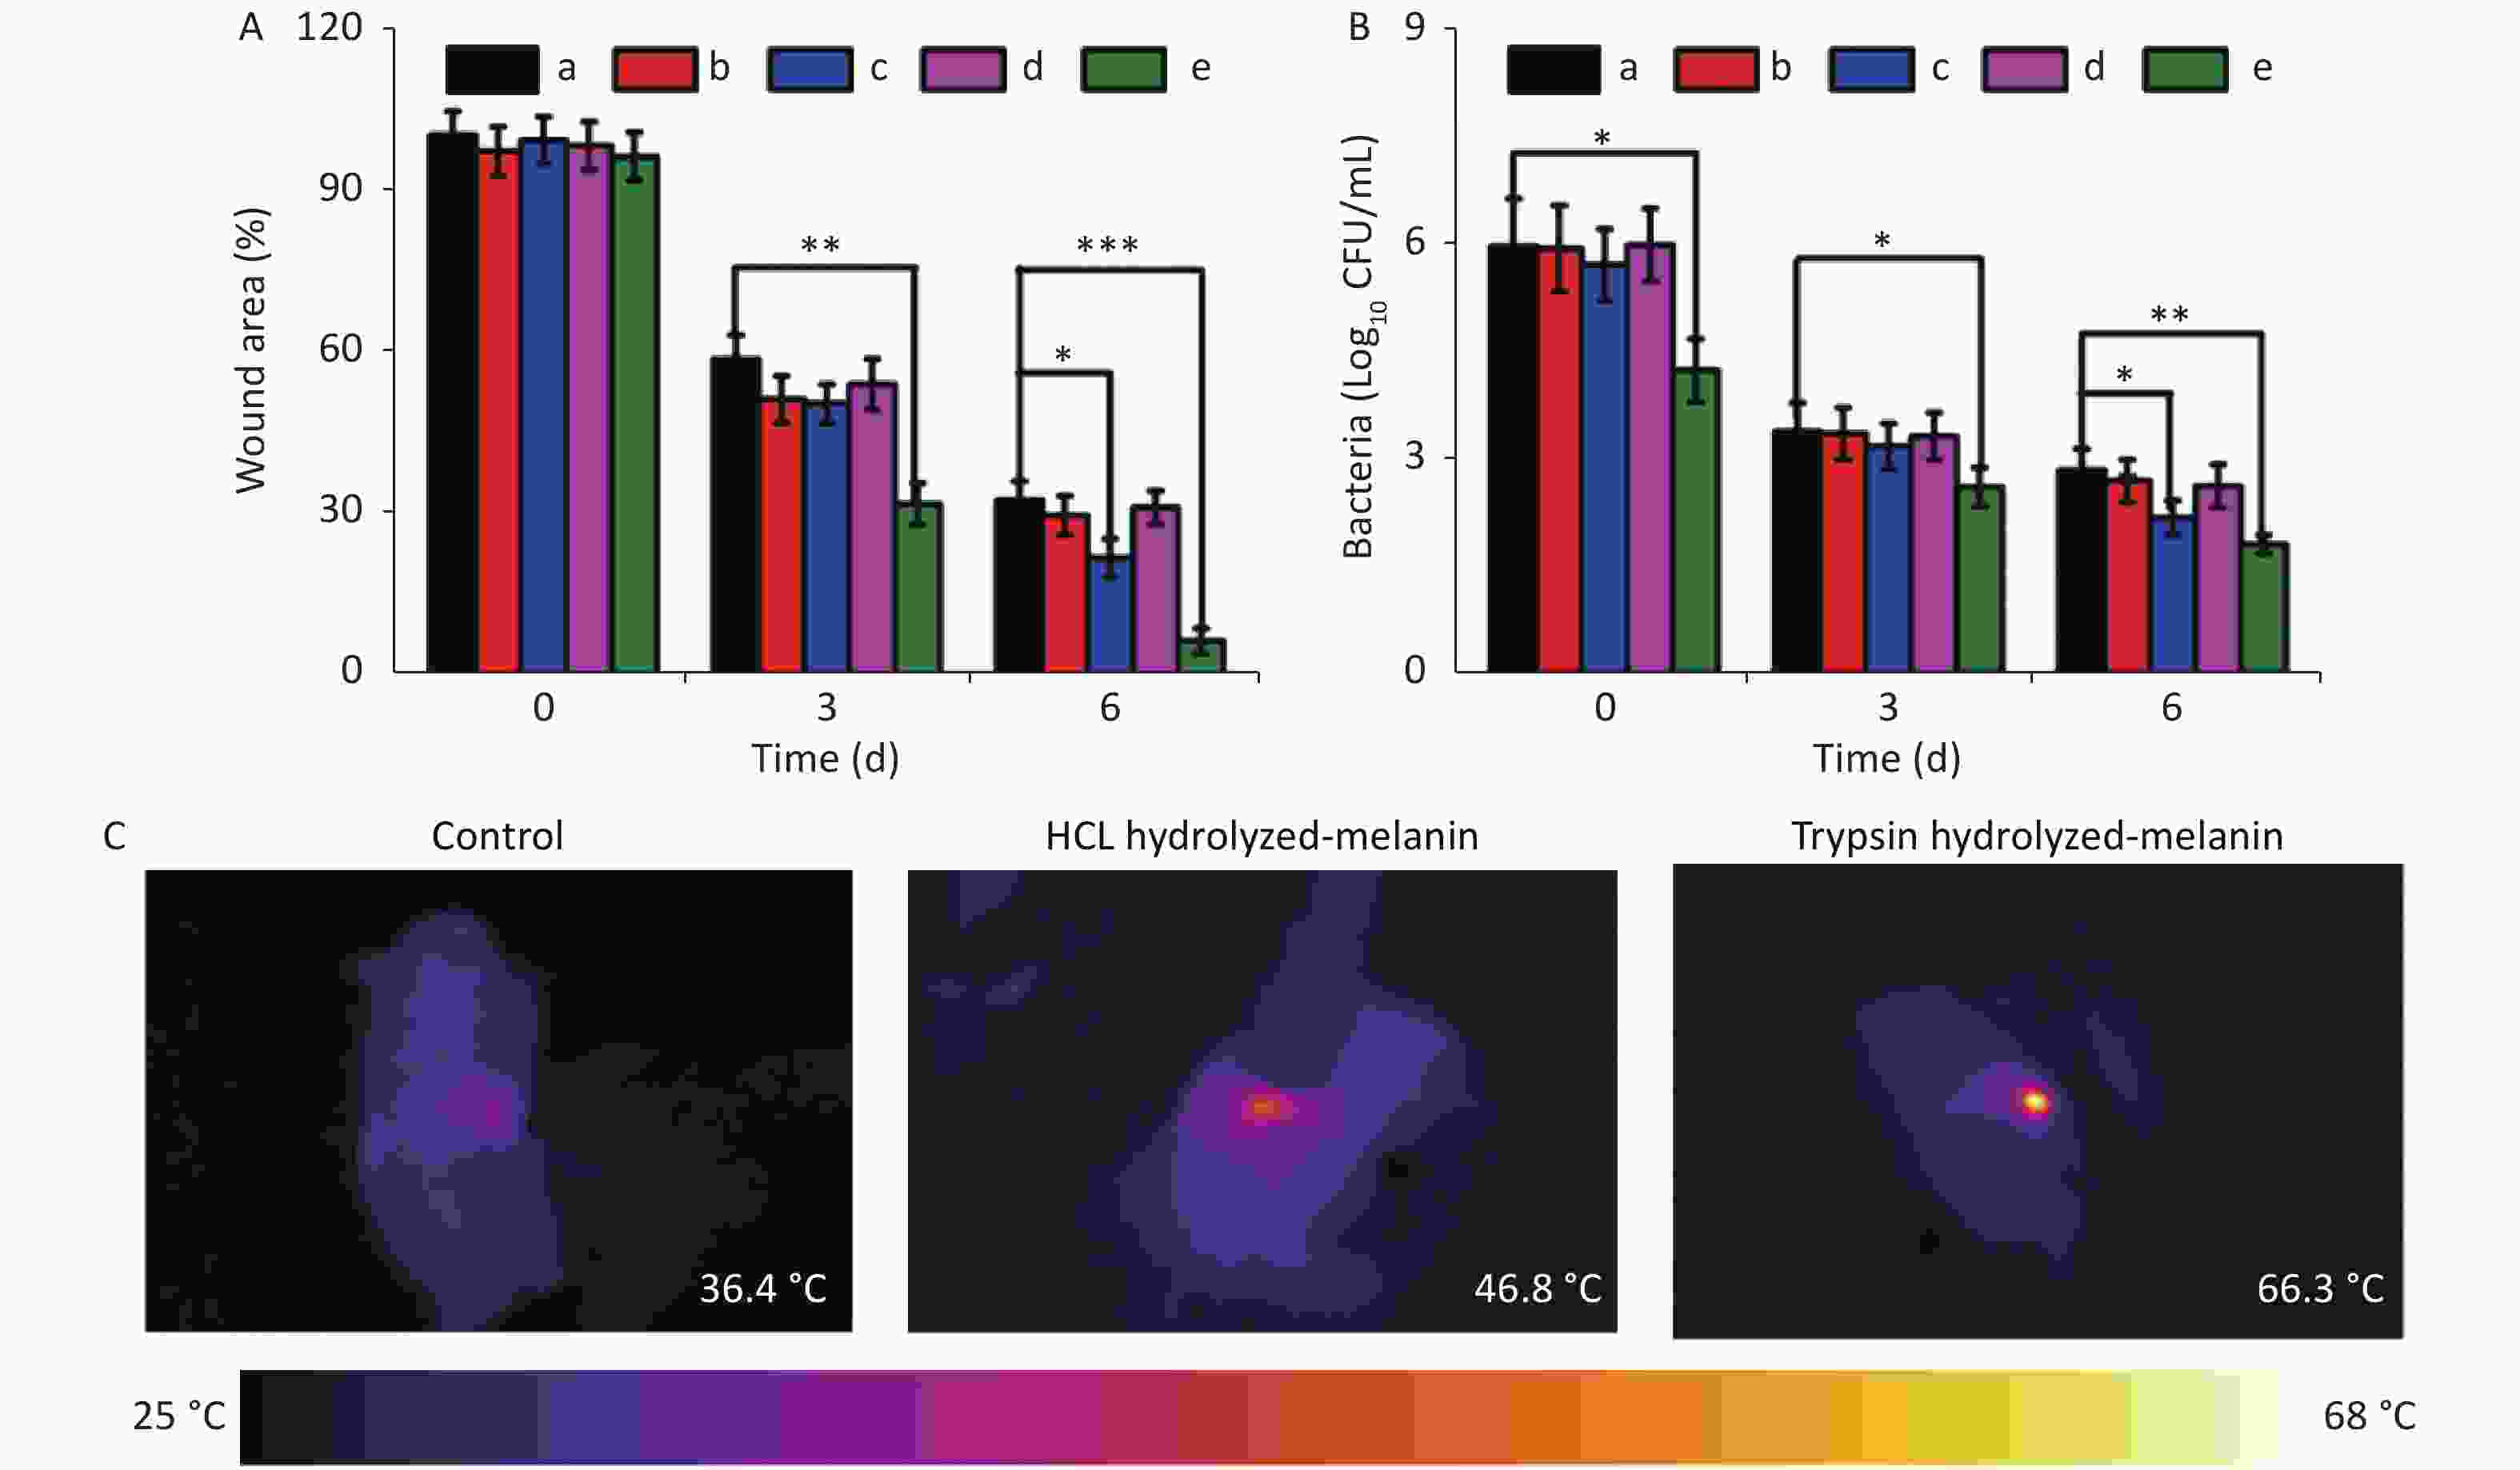
Figure 6. Wound sizes, bacterial CFU and thermal images. (A) Wound sizes in rats from different groups after various treatments. (B) Numbers of bacterial CFU in wound tissues on days 0, 3, and 6. Black, red, blue, magenta and green columns in A and B represent control, H-melanin and NIR-, H-melanin and NIR+, H-melanin and NIR-, and H-melanin and NIR+, respectively. (C) Thermal images of rats after various treatments. All data are shown as means ± SD
(n = 3 rats per group. *P < 0.05, **P < 0.01, and ***P < 0.001). Figure 6C shows infrared images of the temperature increase in wounds treated with melanin and NIR irradiation[45]. After 15 min of irradiation at 2 W, local temperatures of the H- and T-melanin groups increased from 36.4 °C to 46.8 °C and 66.3 °C, respectively, indicating better photothermal conversion of T-melanin.
Wound tissues were harvested from each group of rats to further determine the abundance of S. aureus cells on days 0, 3, and 6 by counting CFU (Figure 6B). The number of bacterial colonies was the lowest on days 3 and 6 when treated with T-melanin and NIR irradiation compared with the control (P < 0.05), followed by H-melanin with NIR irradiation. The wound healing capacity on day 6 was better for T- than H-melanin with NIR irradiation.
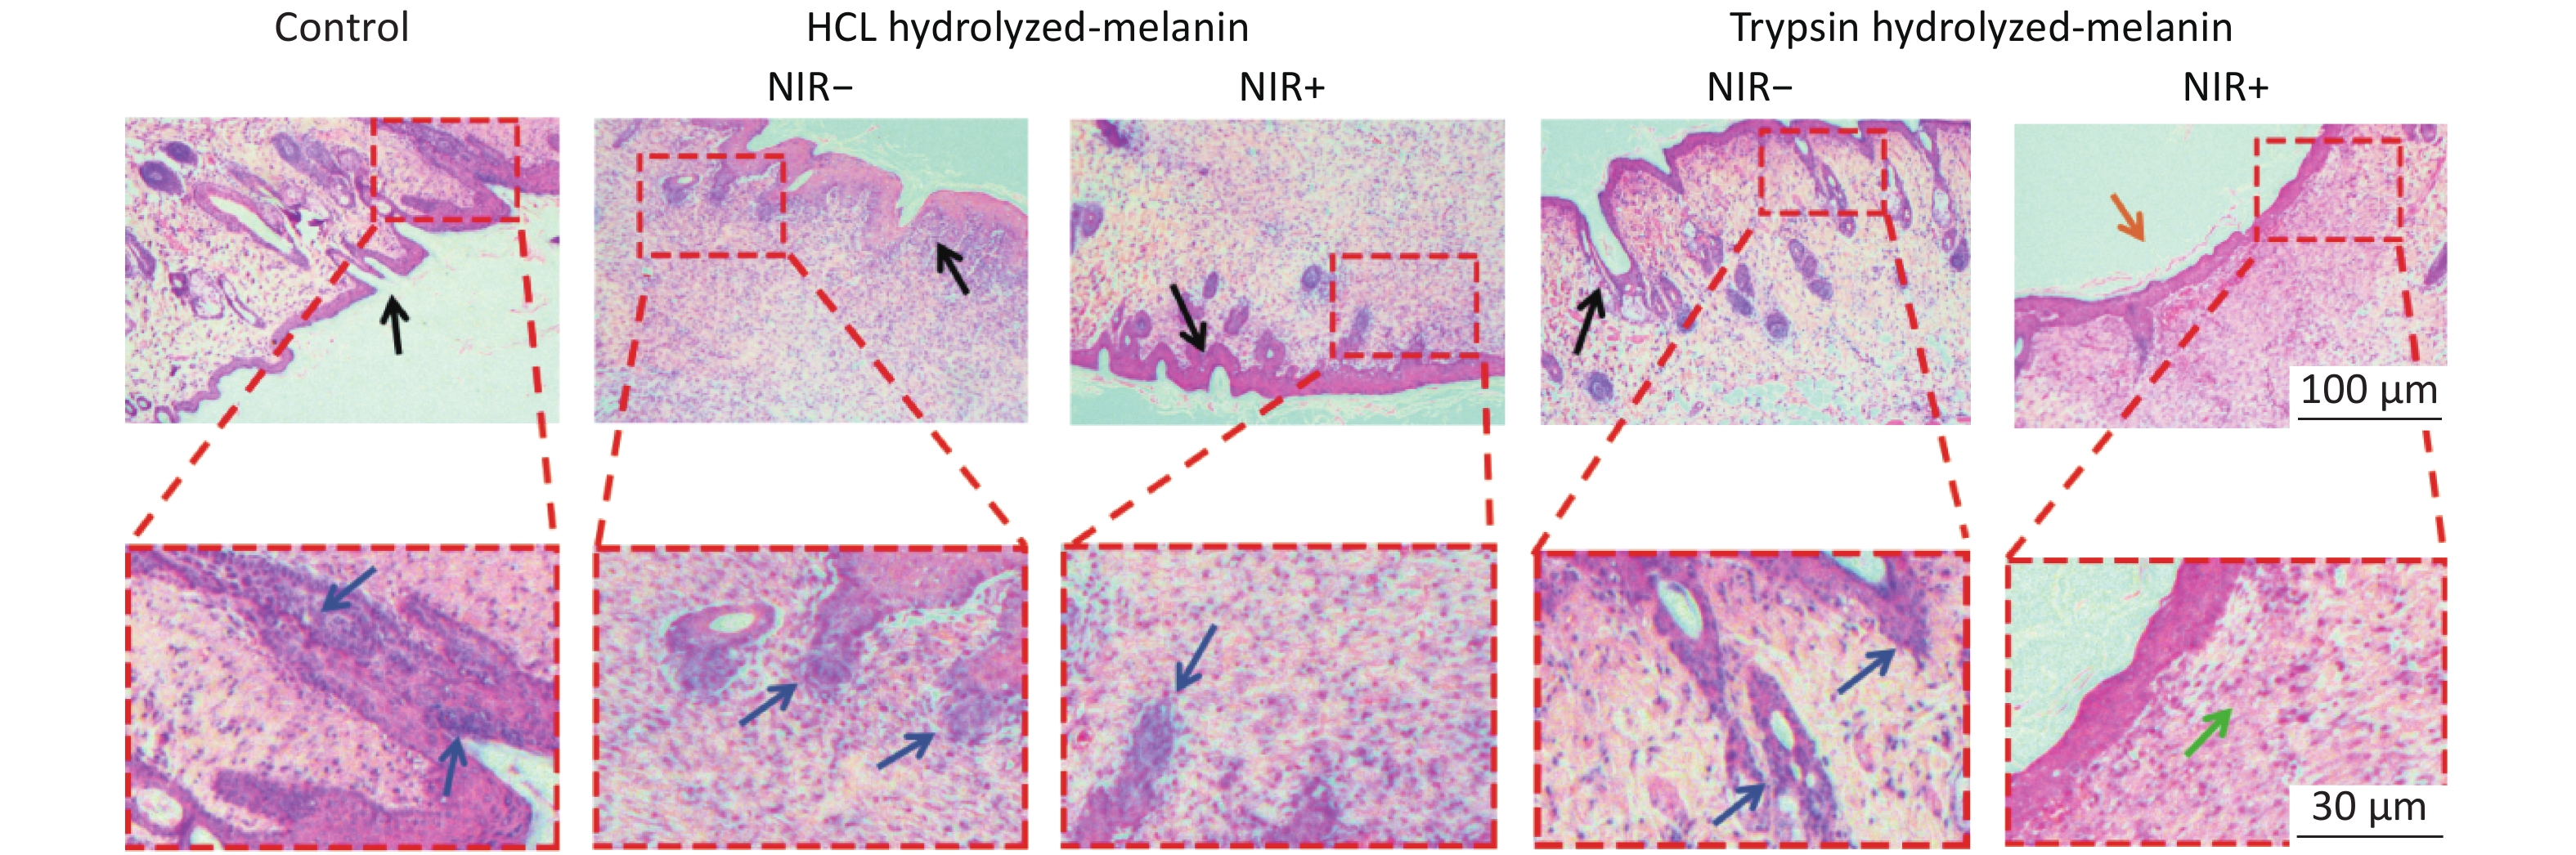
Wound tissues were stained with H&E on day 6 to evaluate wound healing. Neutrophils stain blue in infected tissues[46]. Figure 7 shows the histological findings of wounds in the control, H-melanin and T-melanin groups without NIR. A blue arrow indicates inflammatory cells, suggesting serious infection of the wound, The skin at the surface of the wound surface is cracked and damaged (black arrow). In contrast, the ratio of inflammatory cells is very small in the wounds treated with T-melanin and NIR irradiation. This combination exerted the optimal healing effect as indicated by a smooth, complete skin surface (yellow arrow) and normal subcutaneous tissue structure (green arrows).
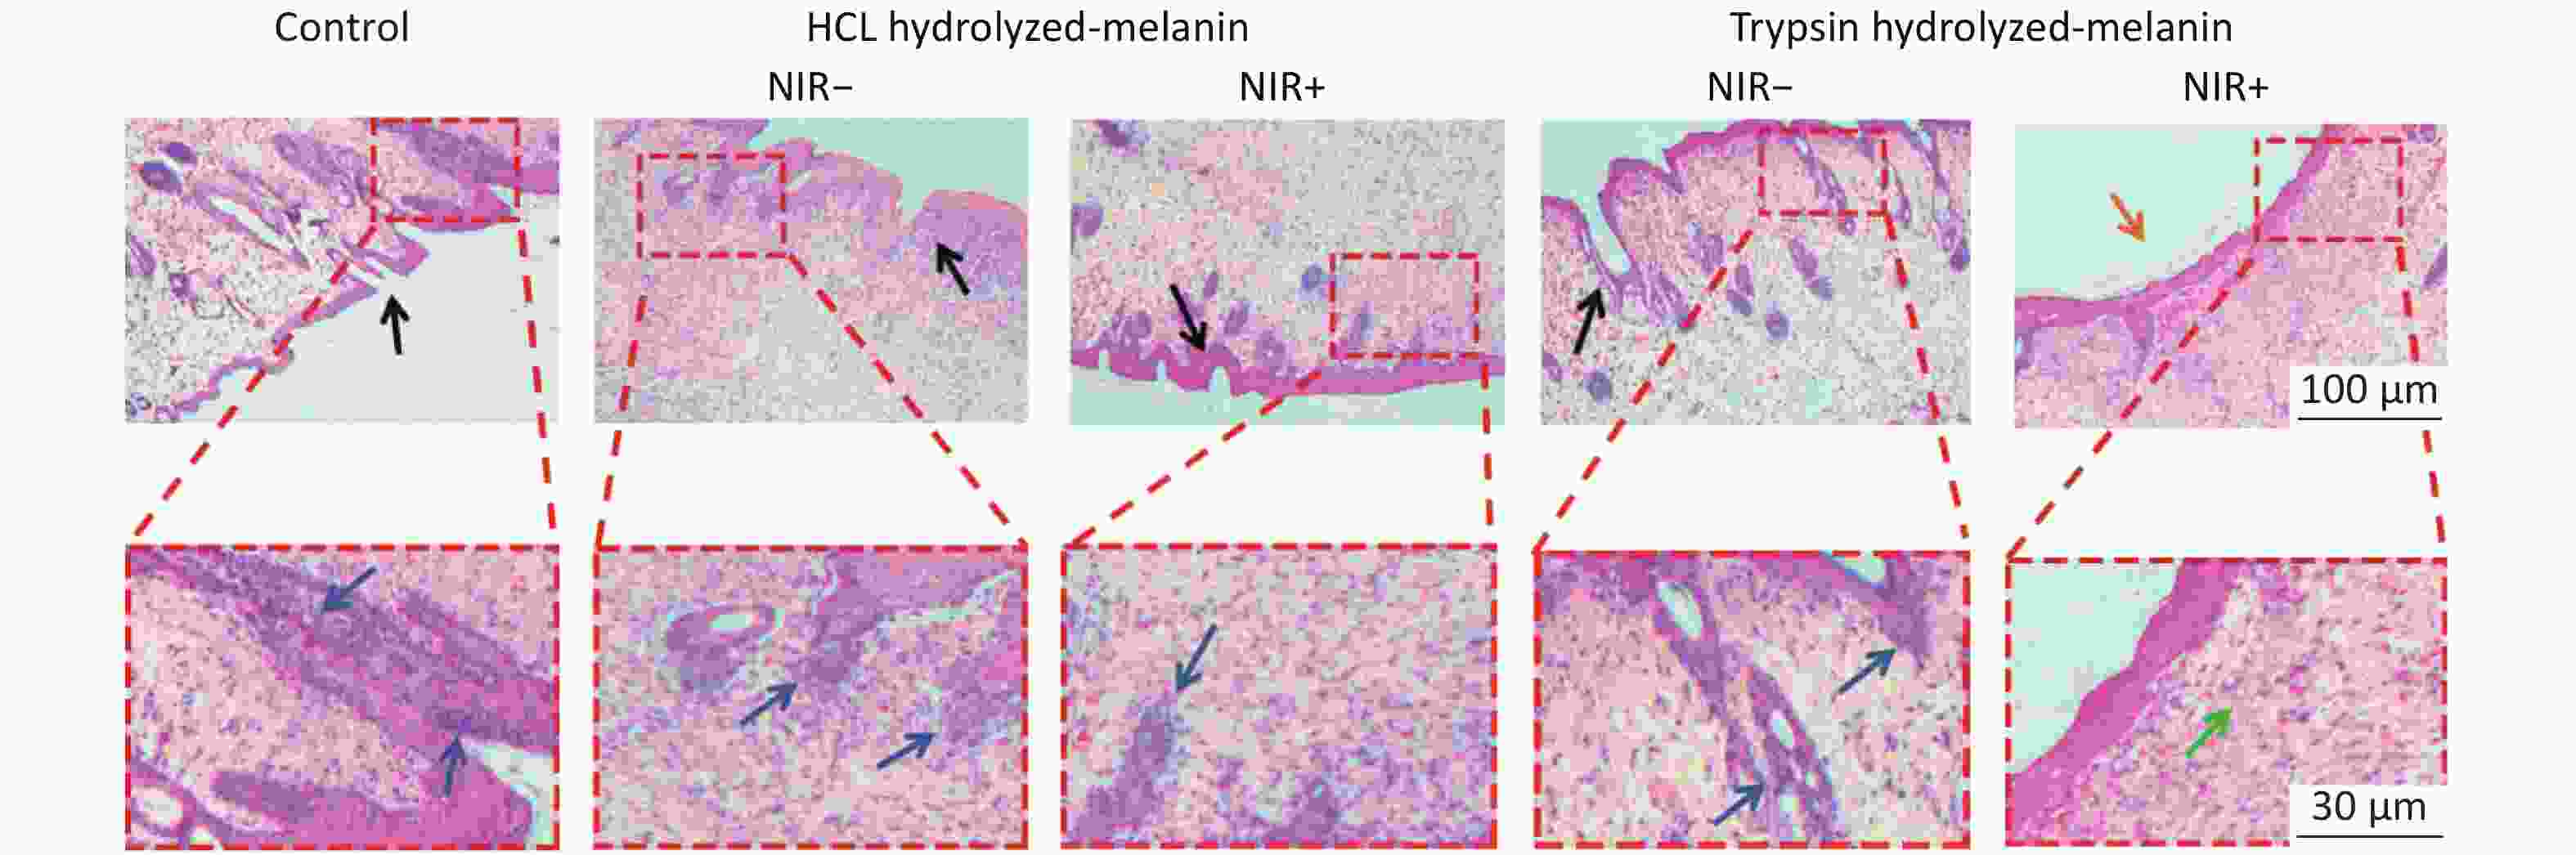
Figure 7. Status of skin tissue infection on day 6. Wound tissues were stained with H&E after various treatments. Scale bars indicate magnified boxed areas of tissue sections.
-
The above results indicated that T-melanin could offer a tremendous advantage for disinfecting wounds. Therefore, the biosafety of this nanomaterial should be considered.
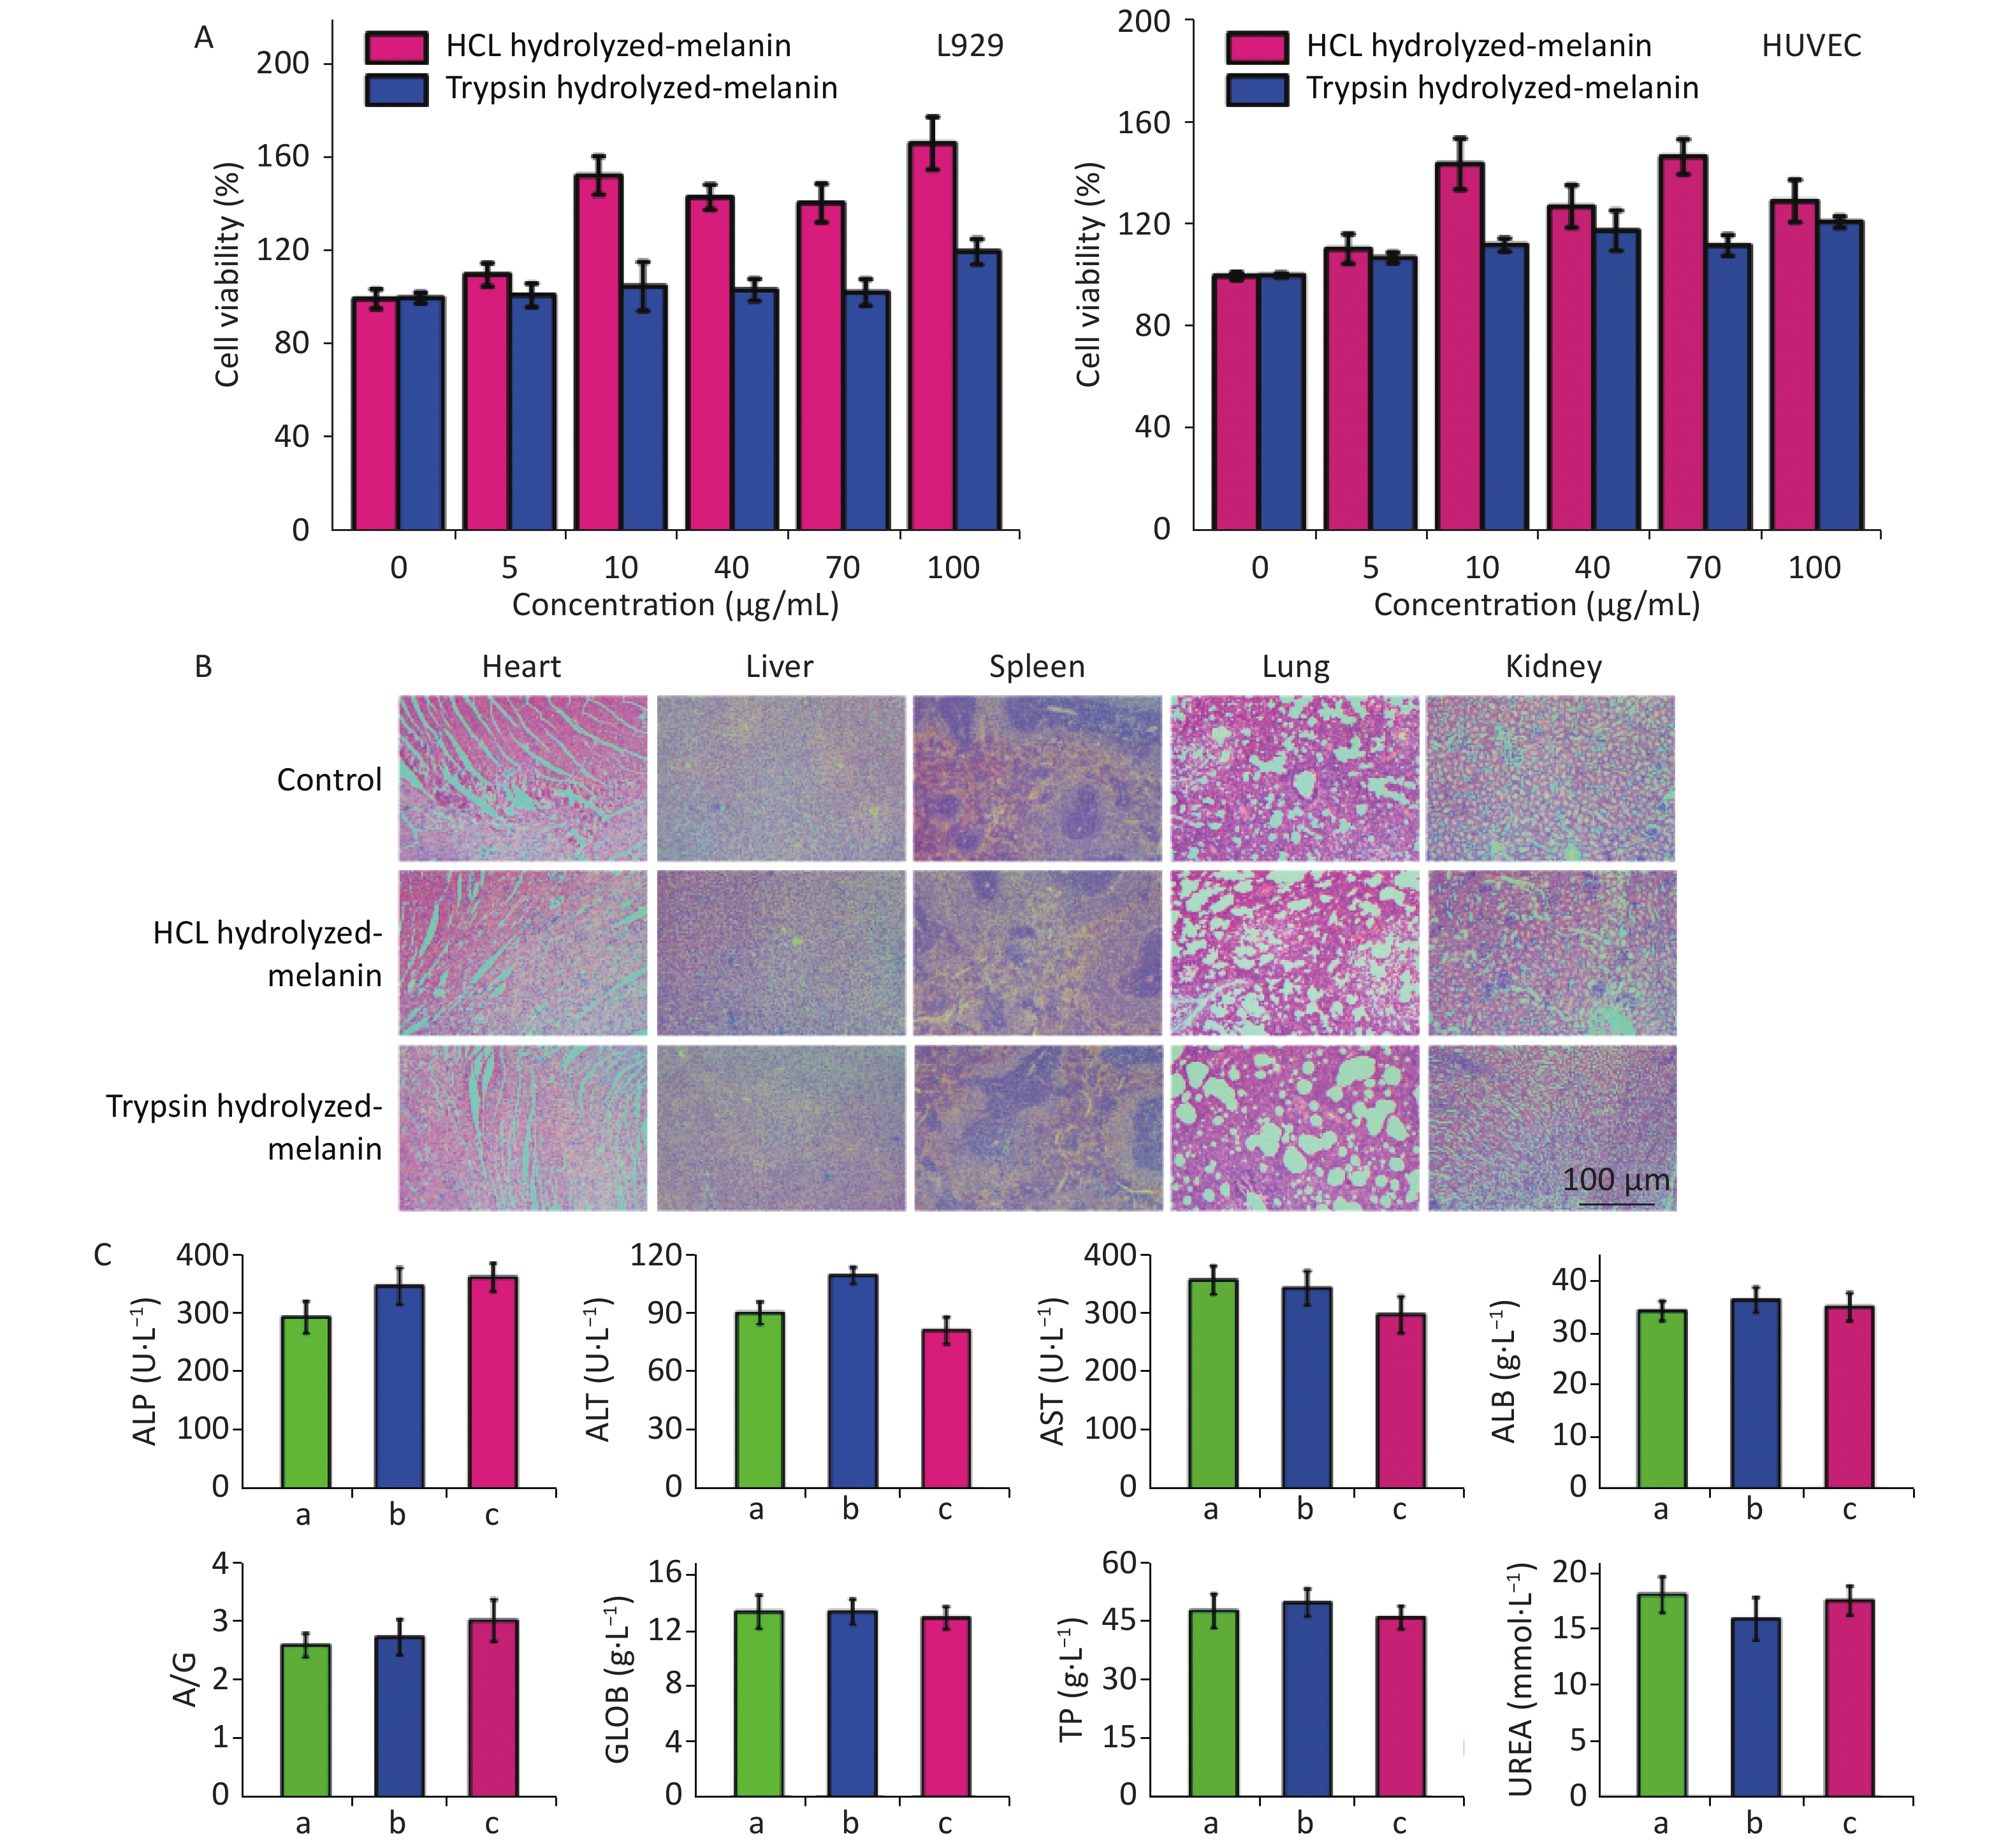
We evaluated the cytotoxicity of T- and H-melanin in vitro using the MTT method, and tested relative survival by adding different volumes of melanin suspension to L929 cells and HUVEC, respectively. Figure 8A shows that at melanin concentrations of 0–200 μg/mL, the survival rates of these cells remained > 99%. Therefore, we considered that T- and H-melanin are safe and not cytotoxic in vitro.
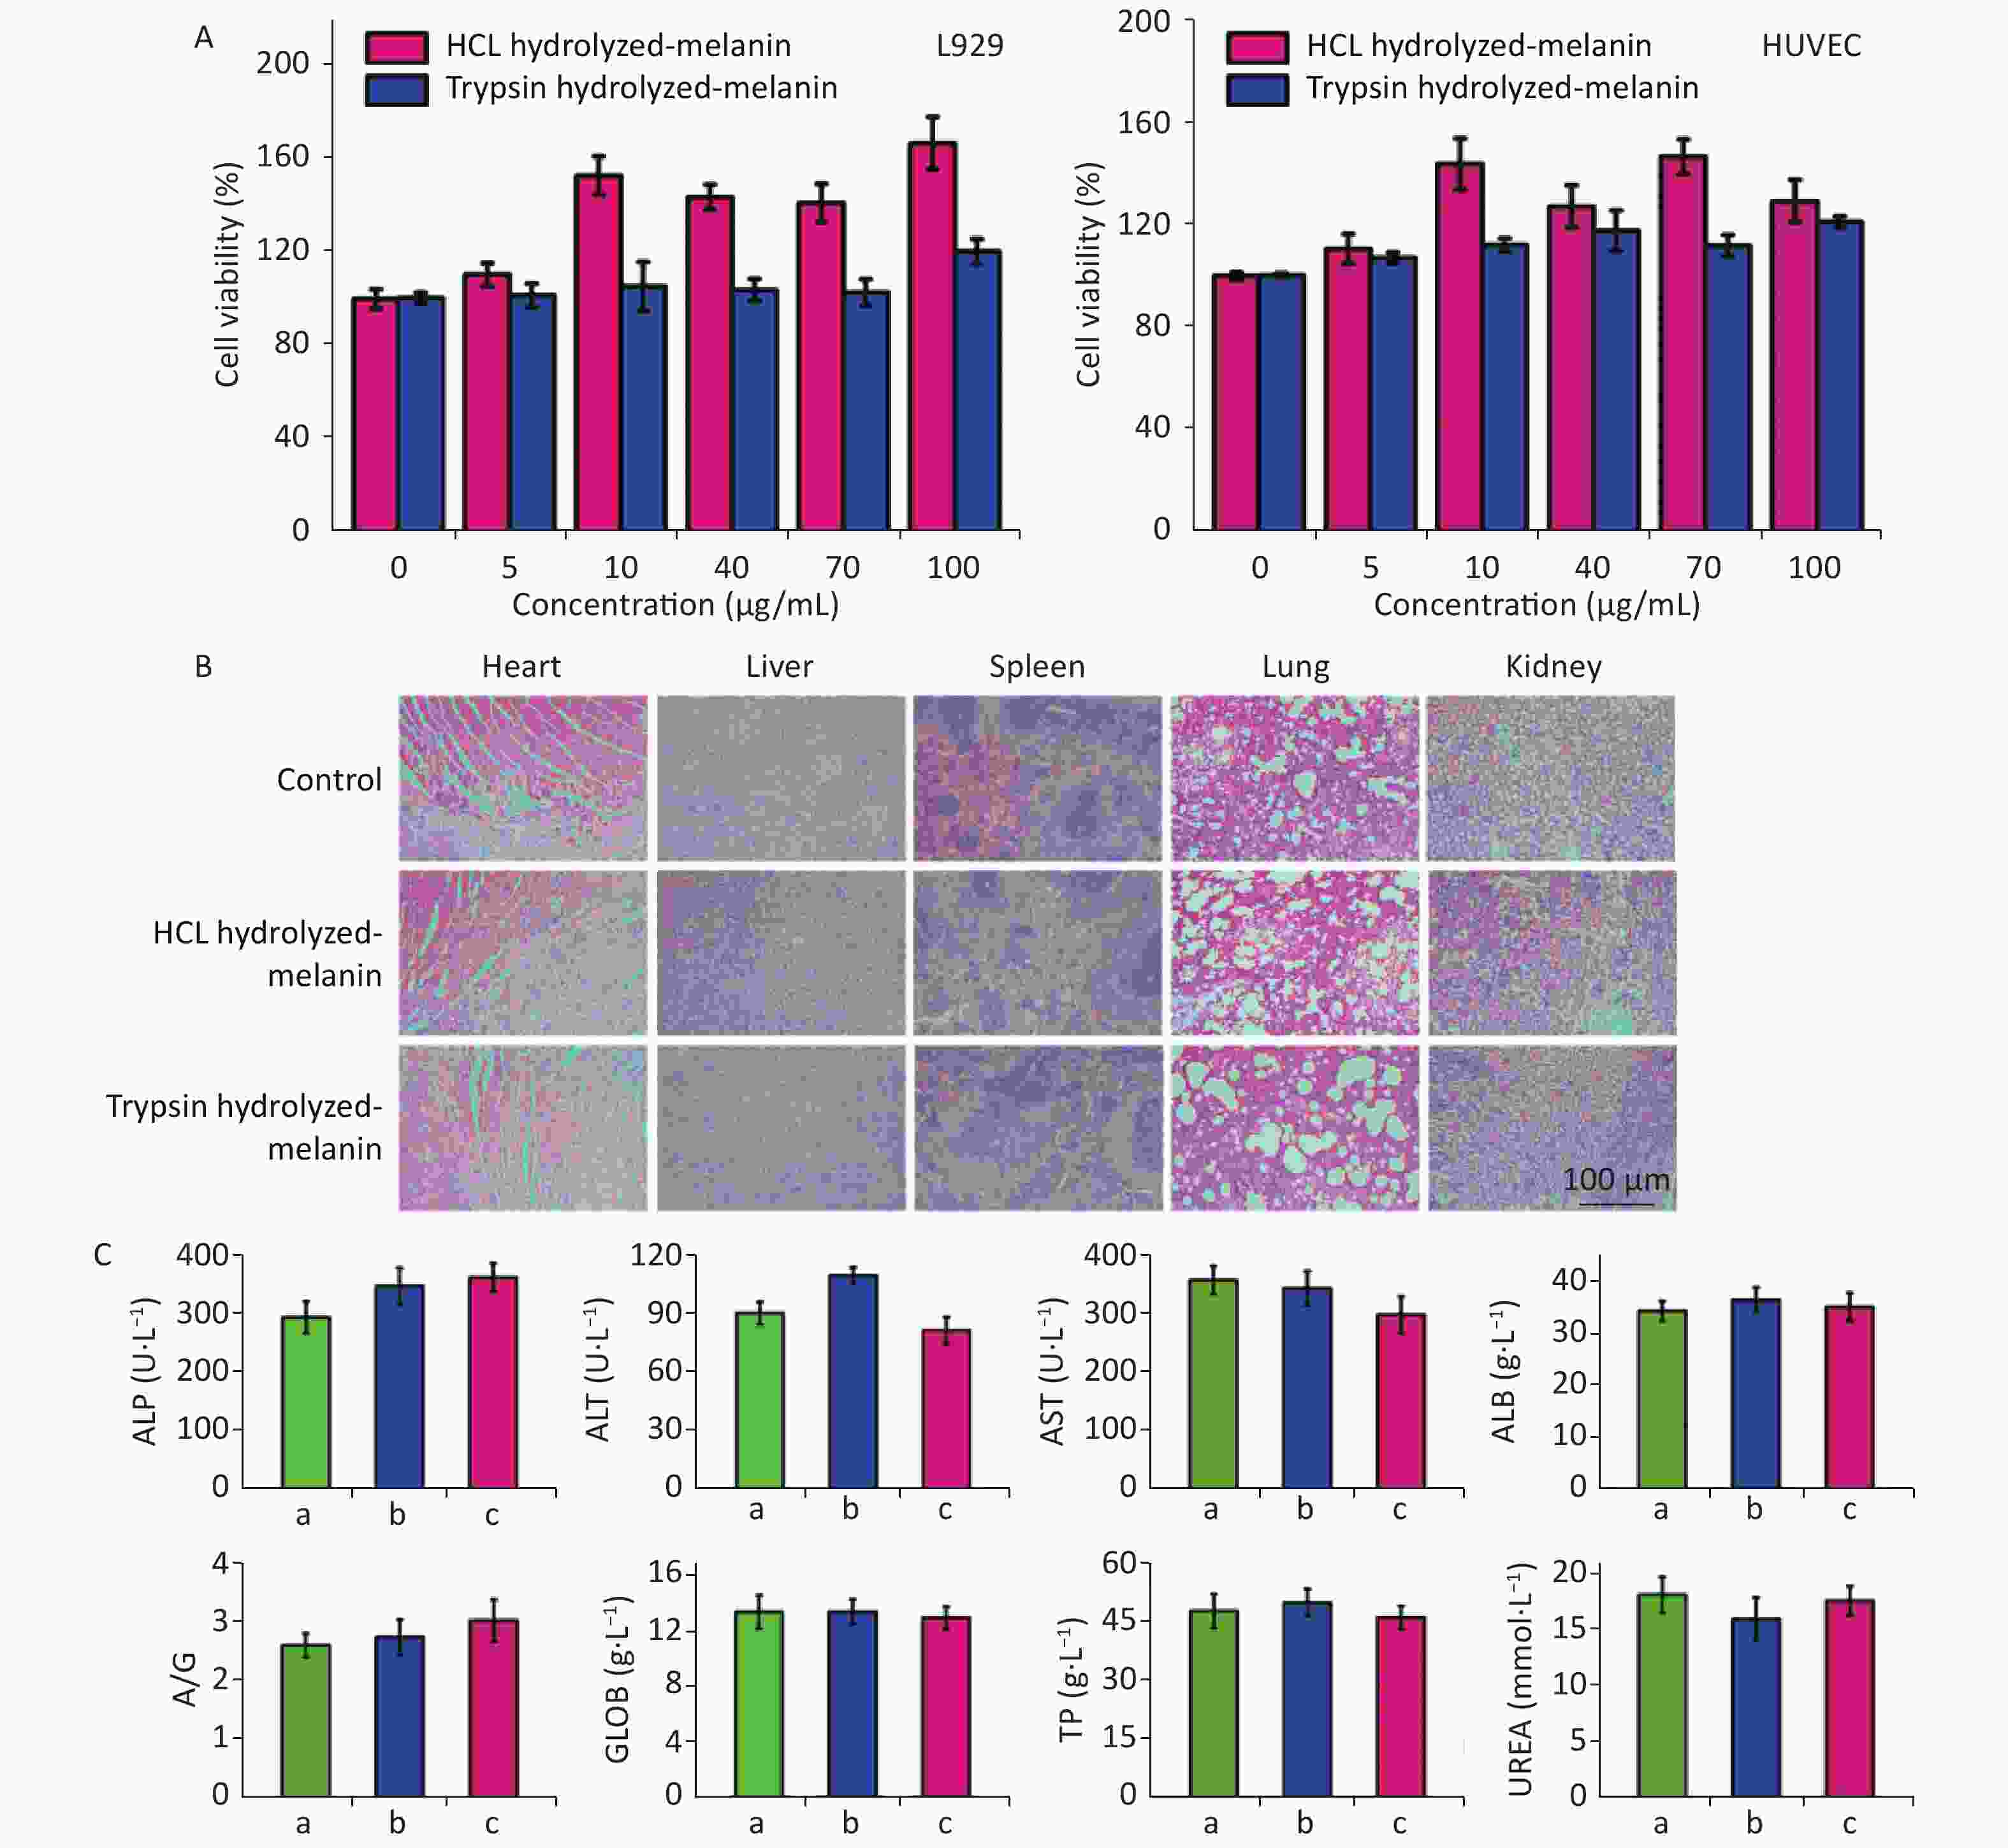
Figure 8. Cytotoxicity of H-melanin and T-melanin against L929 cells and HUVEC in vitro and in mice in vivo. Values are shown as means and standard deviations of three mice per group. (A) Cytotoxicity of H- and T-melanin against L929 cells and HUVEC in vitro. (B) Sections of heart, liver, spleen, lungs, and kidneys harvested from mice treated with or without (control; PBS) melanin (H&E stain). (C) Blood biochemical findings of mice under treated with (a) PBS, (b) H-melanin, (c) T-melanin. A/G, albumin-to-globulin ratio; ALB, albumin; ALP, alkaline phosphatase; ALT, alanine transaminase; AST, aspartate transaminase; GLOB, globulin; TP, total protein; UREA, urea nitrogen; HUVEC, human umbilical vein endothelial cells
We then assessed the cytotoxicity of H-melanin and T-melanin in mice in vivo. The main organ tissues of mice treated with melanin and stained with H&E showed no obvious organ abnormalities or inflammation, and their morphology and structure were similar to those of normal organs (Figure 8B). We also intravenously injected healthy Sprague-Dawley rats with aqueous H-melanin and T-melanin for 6 d, then assessed hepatorenal functions as blood biochemical values. These indexes did not significantly differ from those in untreated mice (Figure 8C). These results suggest that H-melanin and T-melanin are highly biocompatible, not toxic and do not elicit side effects in vivo and in vitro.
-
We extracted natural melanin from M. edulis shells collected from Rizhao coast using HCl (acid hydrolysis) and trypsin (enzymolysis). We found that T-melanin killed methicillin-resistant Gram-positive S. aureus and Gram-negative E. coli bacteria in vitro by efficiently converting NIR radiation into heat energy. We also evaluated the bactericidal ability of M. edulis melanin in a model of bacterial infection by locally infecting rats with drug-resistant S. aureus. The sterilization effects in vivo and in vitro were better for T-melanin than H-melanin. The results of MTT assays and physiological indices show that the NIR photothermal antibacterial method could provide a novel solution to the problem of bacterial resistance. Further investigation is needed, because the bacteriostatic mechanism significantly differs from that of traditional antibiotics. Our findings might also stimulate new ideas for more effective utilization of marine resources and promote the application of natural pigments in healing and other diseases.
-
None of the authors has any conflicts to declare.
-
LIU Ya Mei, drafted the manuscript, conducted experiments, analyzed results. MA Wei Shuai, guided experimental methods, assisted with animal experiments. Wei Yu Xi, obtained M. edulis shells, guided melanin extraction and purification. Xu Yuan Hong, provided intellectual content, and revised the manuscript.
Photothermal Effect-based Cytotoxic Ability of Melanin from Mytilus edulis Shells to Heal Wounds Infected with Drug-resistant Bacteria in vivo
doi: 10.3967/bes2020.052
Funds:
This study was supported by the National Natural Science Foundation of China [No. 21874079]; Nature Science Foundation for Outstanding Young Scientists of Shandong Province [No. ZR2018JL011]; Key R & D Project of Shandong Province [No. GG201809230180]; Taishan Scholars Program of Shandong Province [No. tsqn201909088]; Outstanding Youth Innovation Team of Universities in Shandong Province [No. 2019KJA027]; Science & Technology Fund Planning Project of Shandong Colleges and Universities [No. J16LA13 & J18KA112]
- Received Date: 2020-03-06
- Accepted Date: 2020-05-21
-
Key words:
- Melanin /
- Photothermal conversion /
- Antibacterial /
- Wound healing
Abstract:
| Citation: | LIU Ya Mei, MA Wei Shuai, WEI Yu Xi, XU Yuan Hong. Photothermal Effect-based Cytotoxic Ability of Melanin from Mytilus edulis Shells to Heal Wounds Infected with Drug-resistant Bacteria in vivo[J]. Biomedical and Environmental Sciences, 2020, 33(7): 471-483. doi: 10.3967/bes2020.052

|


 Quick Links
 DownLoad: