


-
C-reactive protein (CRP) is a highly sensitive and specific reactive protein that is primarily synthesized by liver hepatocytes and secreted in plasma[1]. CRP synthesis occurs when the body is injured or produces various acute and chronic inflammations, and its level is regulated by inflammatory factors, tumor necrosis factor, and interleukin-6 (IL-6)[2-6]. Although the detection of CRP is not specific to any disease, its rise in concentration is a sensitive indicator of inflammation and tissue damage caused by various factors[3, 7-8]. In normal healthy subjects, CRP is reported to be in trace plasma protein, usually lower than 10 mg/L[9-10]. In response to severe bacterial infection and burn (200 mg/L), viral infection (10–40 mg/L), trauma, necrosis of tissue, aging, most forms of inflammation, parasitic invasion, and malignant neoplasia, the serum level of CRP increases rapidly by about 1,000-fold in 48 h after an acute event[3, 9]. High-sensitivity C-reactive protein (hsCRP) and CRP belong to the same protein, but hsCRP is more sensitive than CRP[11]. hsCRP is a protein measured by either antibodies labeled with an enzyme using an enzyme-linked immunosorbent assay, by a fluorescent compound, or by polystyrene beads coated with antibodies. Levels of hsCRP provide better sensitivity in establishing inflammation than levels of CRP[12]. In recent years, hsCRP has been utilized in many applications, such as cardiovascular disease, cancer, and disease detection during pregnancy[5, 13-15]. hsCRP is closely related to the occurrence, development, prognosis, and evaluation of diseases, and it is considered as an underestimated and underused indicator[16-18]. It is also a risk factor marker to evaluate cardiovascular disease and cancer[19]. Therefore, the hsCRP status in China is receiving increasing attention among researchers.
As known, hsCRP concentration varies with ethnic status[5, 20] and gender from Asian to Western people[21]. The cutoff point of CRP (3 mg/L)[5, 17] may be high for Asian people[21-23]. The present study, as a part of National Nutrition and Health Survey project, aimed to investigate the hsCRP levels in different ages and genders. This study may serve as a basis to use hsCRP as a marker for the early detection of inflammation and various diseases in China.
-
Sampling of participants was based on a general large city population sampling frame for the 2010–2012 China National Nutrition and Health Survey, which is a nationally representative cross-sectional survey covering all parts of Mainland China. A stratified multistage cluster sampling method was used for participant selection based on the selection of cities, districts, counties, communities, households, and individuals in families. All cities, districts, or counties were divided into four categories, namely, large cities, medium and small cities, non-poverty rural, and poverty rural based on the scale and the economic statistic data. This study selected 34 provincial capitals and large industrial city populations as survey targets. Six resident committees were selected in each city by Probability Proportionate to Size Sampling. Seventy-five households were randomly selected in each resident community. All members of the households were selected samples. Resampling for measuring hsCRP was conducted based on the total samples because of some limitations, such as total available funds. From 2010 to 2012, the study population enrolled 3,372 people, including 1,572 (46.6%) males, 1,800 (53.4%) females, and 78 pregnant women. Five subgroups were established for male and female at ages of 6–17, 18–44, 45–59, and ≥ 60 years. The ethic committee of the Institute for Nutrition and Food Safety approved the projects with file number 2013–2018. All participants were fully informed, and consent forms were signed and collected.
-
Venous blood samples were collected after fasting for more than 10–14 h by using disposable vacuum blood collection tubes in the morning (8:00–10:00 am). The blood samples in the serum separator tubes were promptly centrifuged at 1,500 ×g for 15 min after blood collection. The serum was separated and was frozen at –80 °C.
hsCRP was measured by a Roche Tina-quant immuno-turbidimetric assay on a Hitachi 7600–010 automatic biochemical analyzer (Roche Diagnostics)[24-26].
-
All survey data were statistically analyzed by SPSS 19 software. Statistical significance was defined as P < 0.05. Skew distribution of hsCRP was expressed logarithmically as geometric mean and 95% CI. Its distribution was described as the 5th, 25th, 50th, 75th, and 95th percentiles by age and sex subgroups. Meanwhile, the inter-day CV of hsCRP was 1.1%–1.7%, and the intra-day CV of hsCRP was 5.0%–9.9% for the hsCRP assay.
-
A total of 3,372 people were surveyed from large cities in China, of whom 1,572 were males and 1,800 were females (including 78 pregnant women), accounting for 46.6% and 53.4%, respectively. Among them, detailed population samples were mainly divided into five subgroups. The age, sex grouping of the participants, and hsCRP concentration (mg/L) for population in large cities were shown in Table 1. The percentile distribution of hsCRP for population in large cities (mg/L) is shown inTable 2.
Age (years) Male Female Total ${{\rm{\bar {\text{X}}}}_{\text{G}}}$ 95% CI ${{\rm{\bar {\text{X}}}}_{\text{G}}}$ 95% CI ${{\rm{\bar {\text{X}}}}_{\text{G}}}$ 95% CI Total 0.68 0.64–0.72 0.65 0.62–0.69 0.67 0.64–0.70 6–11 0.34 0.30–0.40 0.34 0.29–0.40 0.34 0.31–0.38 12–17 0.37 0.32–0.43 0.30 0.26–0.34 0.33 0.30–0.37 18–44 0.74 0.66–0.83 0.54 0.48–0.59 0.62 0.57–0.67 45–59 0.91 0.81–1.02 0.94 0.85–1.06 0.93 0.86–1.00 ≥ 60 1.05 0.93–1.18 1.14 1.02–1.26 1.09 1.01–1.18 Pregnant 1.42 1.16–1.73 1.42 1.16–1.73 Table 1. hsCRP concentration for population in large cities (mg/L)
Age (years) n P2.5 P5 P10 P25 P50 P75 P90 P95 P97.5 Total Subtotal 3,372 0.10 0.13 0.16 0.27 0.59 1.43 3.35 5.48 9.32 6–11 489 0.08 0.09 0.11 0.16 0.26 0.58 1.92 4.00 7.16 12–17 463 0.08 0.10 0.12 0.16 0.25 0.51 1.56 3.22 6.36 18–44 774 0.11 0.15 0.19 0.28 0.52 1.20 2.65 4.70 6.42 45–59 779 0.15 0.19 0.26 0.42 0.82 1.72 3.92 6.37 16.42 ≥ 60 789 0.17 0.22 0.29 0.49 0.98 2.22 4.66 8.50 13.79 Pregnant 78 0.18 0.29 0.41 0.74 1.50 2.59 4.22 6.66 7.86 Male 6–11 241 0.08 0.09 0.12 0.16 0.26 0.62 1.90 3.59 6.54 12–17 227 0.07 0.11 0.13 0.17 0.28 0.61 1.96 4.20 6.53 18–44 349 0.15 0.18 0.21 0.32 0.65 1.56 3.17 5.05 6.14 45–59 364 0.16 0.19 0.28 0.41 0.81 1.84 3.92 5.60 12.10 ≥ 60 391 0.18 0.21 0.27 0.43 0.93 2.08 4.76 9.00 19.18 Subtotall 1,572 0.10 0.14 0.17 0.28 0.58 1.44 3.56 5.45 10.99 Female 6–11 248 0.06 0.09 0.11 0.15 0.26 0.57 2.06 4.35 7.67 12–17 236 0.07 0.10 0.12 0.15 0.24 0.43 1.25 2.35 4.93 18–44 425 0.11 0.13 0.17 0.25 0.44 0.98 2.07 4.17 6.74 45–59 415 0.14 0.19 0.25 0.43 0.85 1.70 3.97 8.13 22.31 ≥ 60 398 0.16 0.23 0.32 0.59 1.08 2.26 4.48 7.28 10.39 Subtotal 1,800 0.10 0.12 0.15 0.26 0.59 1.41 3.22 5.68 9.00 Pregnant 78 0.18 0.29 0.41 0.74 1.50 2.59 4.22 6.66 7.86 Table 2. Percentile distribution of hsCRP for population in the large cities (mg/L)
-
The average concentration of hsCRP in large urban residents was 0.67 mg/L, with 0.68 mg/L for men and 0.65 mg/L for women. The difference in hsCRP among the different age groups was statistically significant (P < 0.05), and the details are shown in Table 1. No significant difference in hsCRP levels was found between males and females aged ≥ 60 years and aged 45–59 years, but the two groups had significantly higher hsCRP levels than the other age subgroups (P < 0.05).
At the same time, the hsCRP levels in the 18–44 year-old group was significantly higher than that in the 6–11 and 12–17 year-old groups (P < 0.01). The highest hsCRP concentration was found in pregnant women in large cities. It was not significantly different from that in the ≥ 60-year-old group but significantly higher than those in the four other age groups ( P < 0.05). Meanwhile, the levels in the 45–59-year-old group were significantly higher than those in the 6–11, 12–17, and 18–44 year-old groups ( P < 0.01). The levels in the 18–44 year-old group were significantly higher than those in the 6–11 and 12–17 year-old groups ( P < 0.01). No significant difference in hsCRP was found between the 6–11 and 12–17 year-old groups.
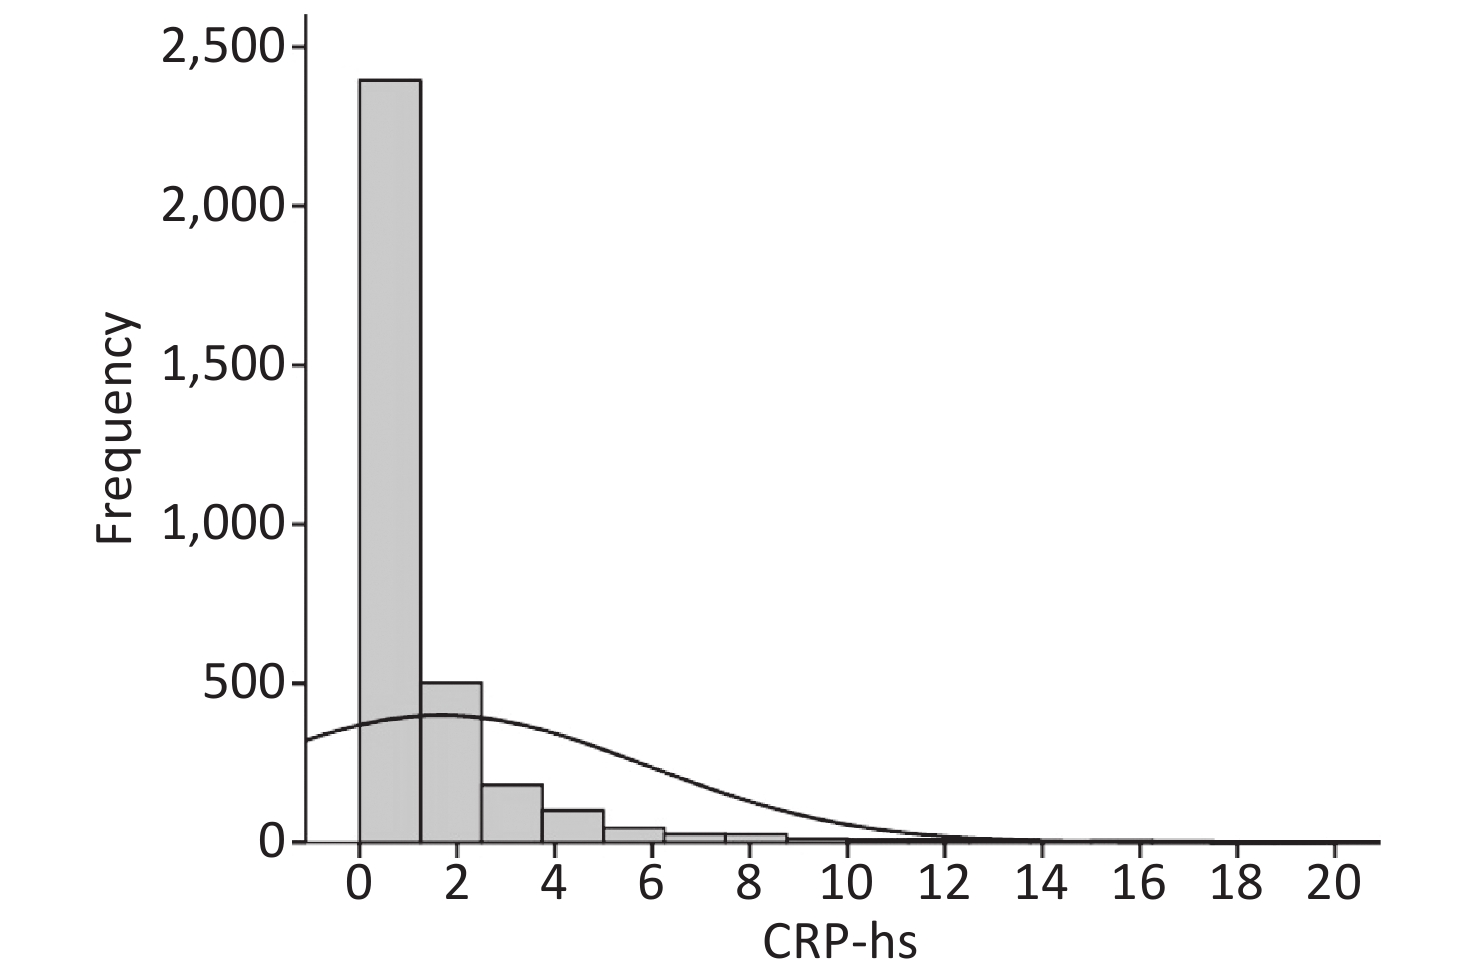
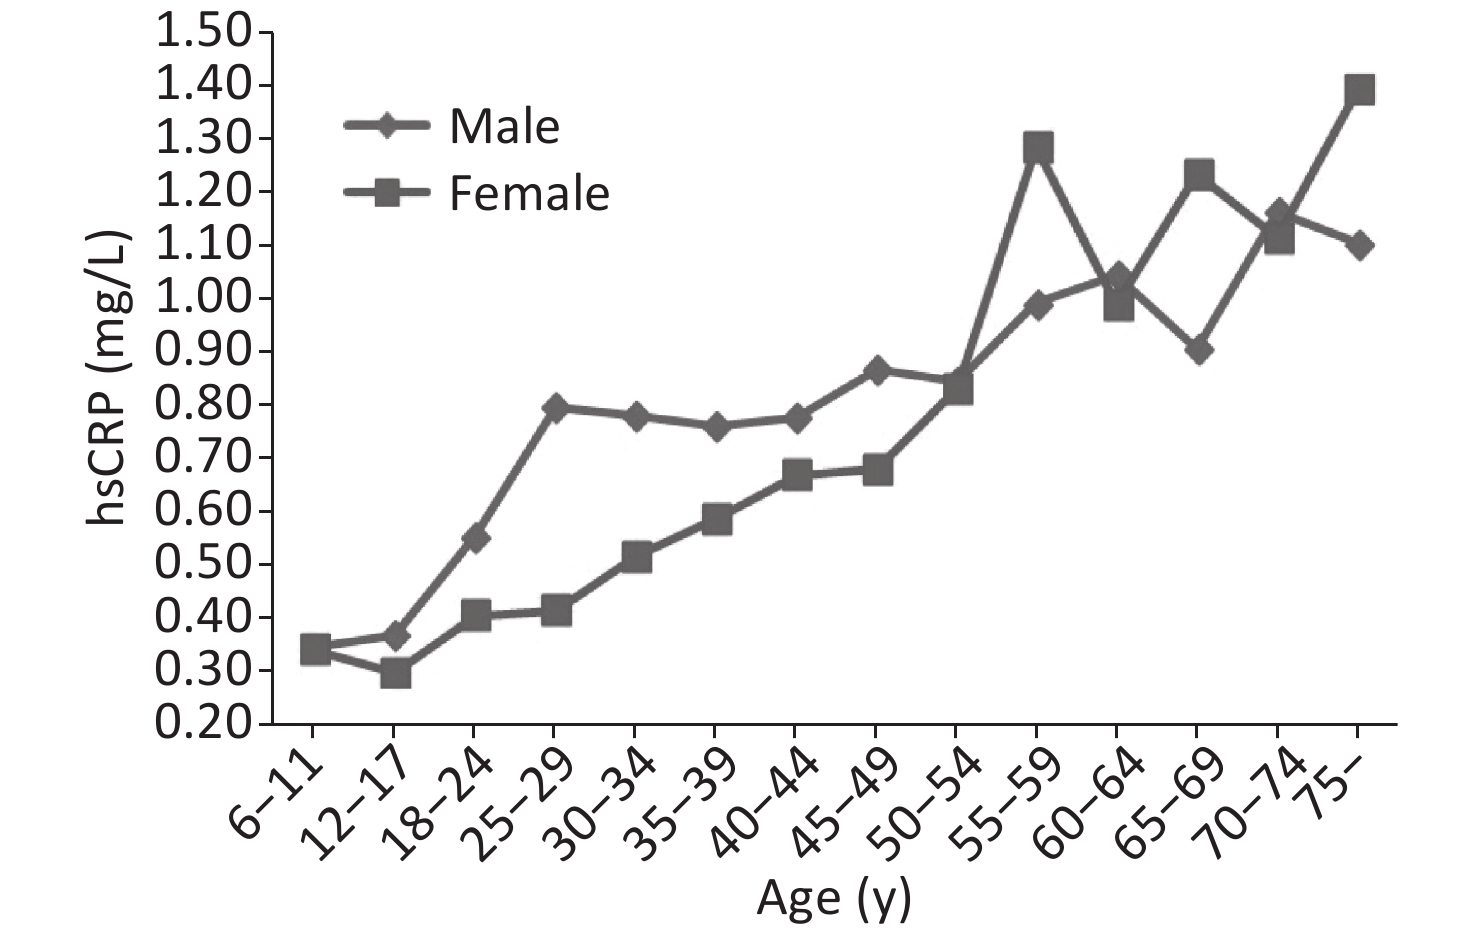
The effect of different ages and genders on hsCRP in the residents of large cities is shown in Figure 1. The hsCRP increased with increasing age for the females and males. The concentration of hsCRP was substantially higher in the women aged > 55 years old than in the younger females. As shown in Figure 2, the distribution of hsCRP frequency in large cities was non-normally distributed.
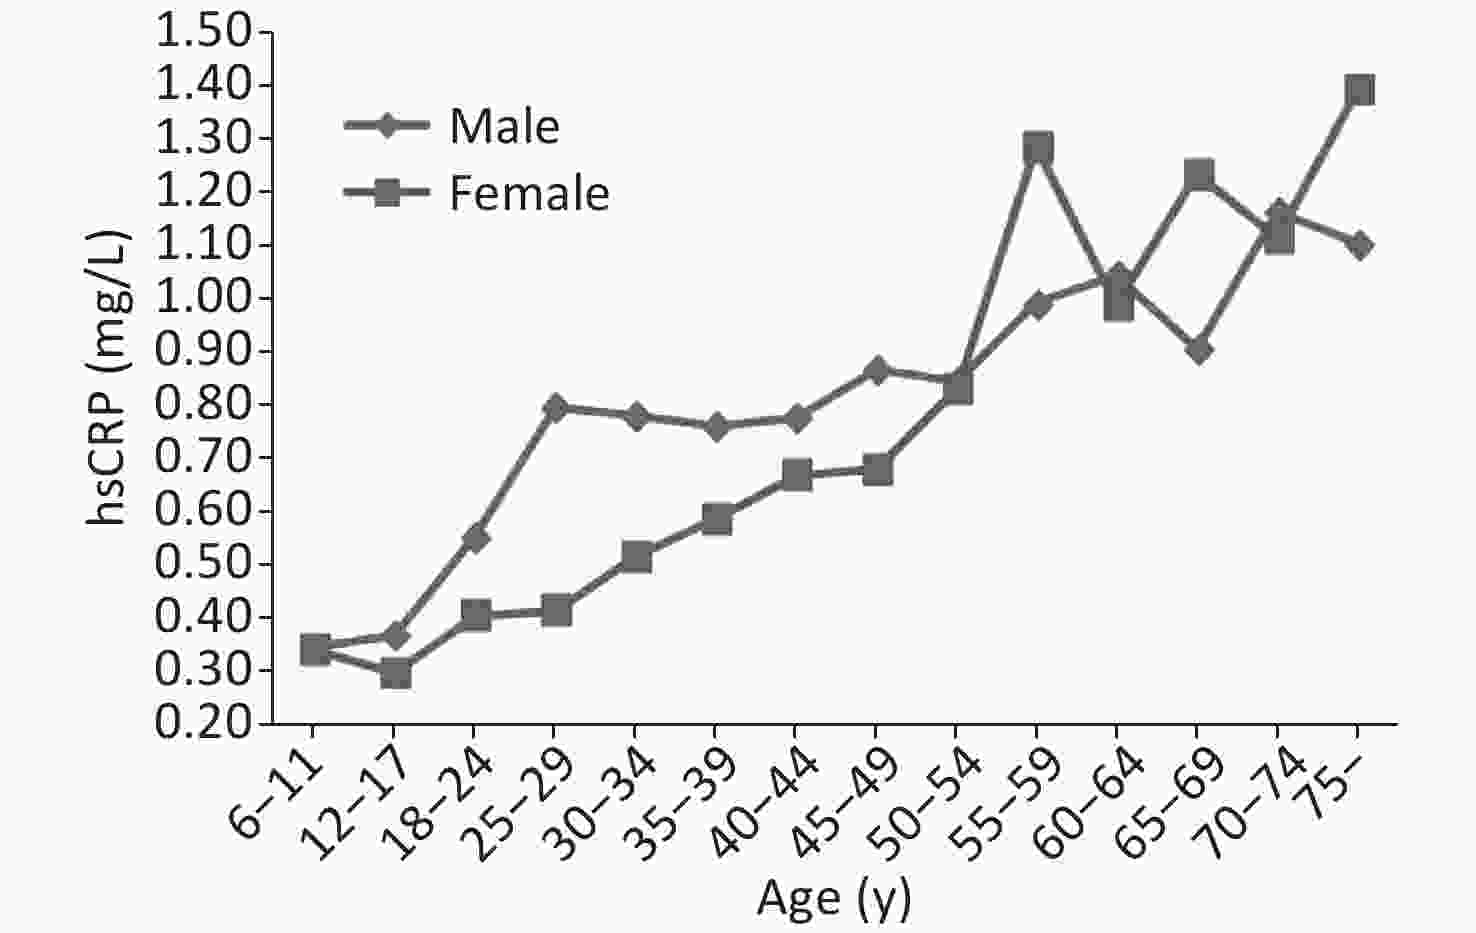
Figure 1. hsCRP distribution feature with age and sex in large cities

Figure 2. hsCRP distribution features for population in large cities
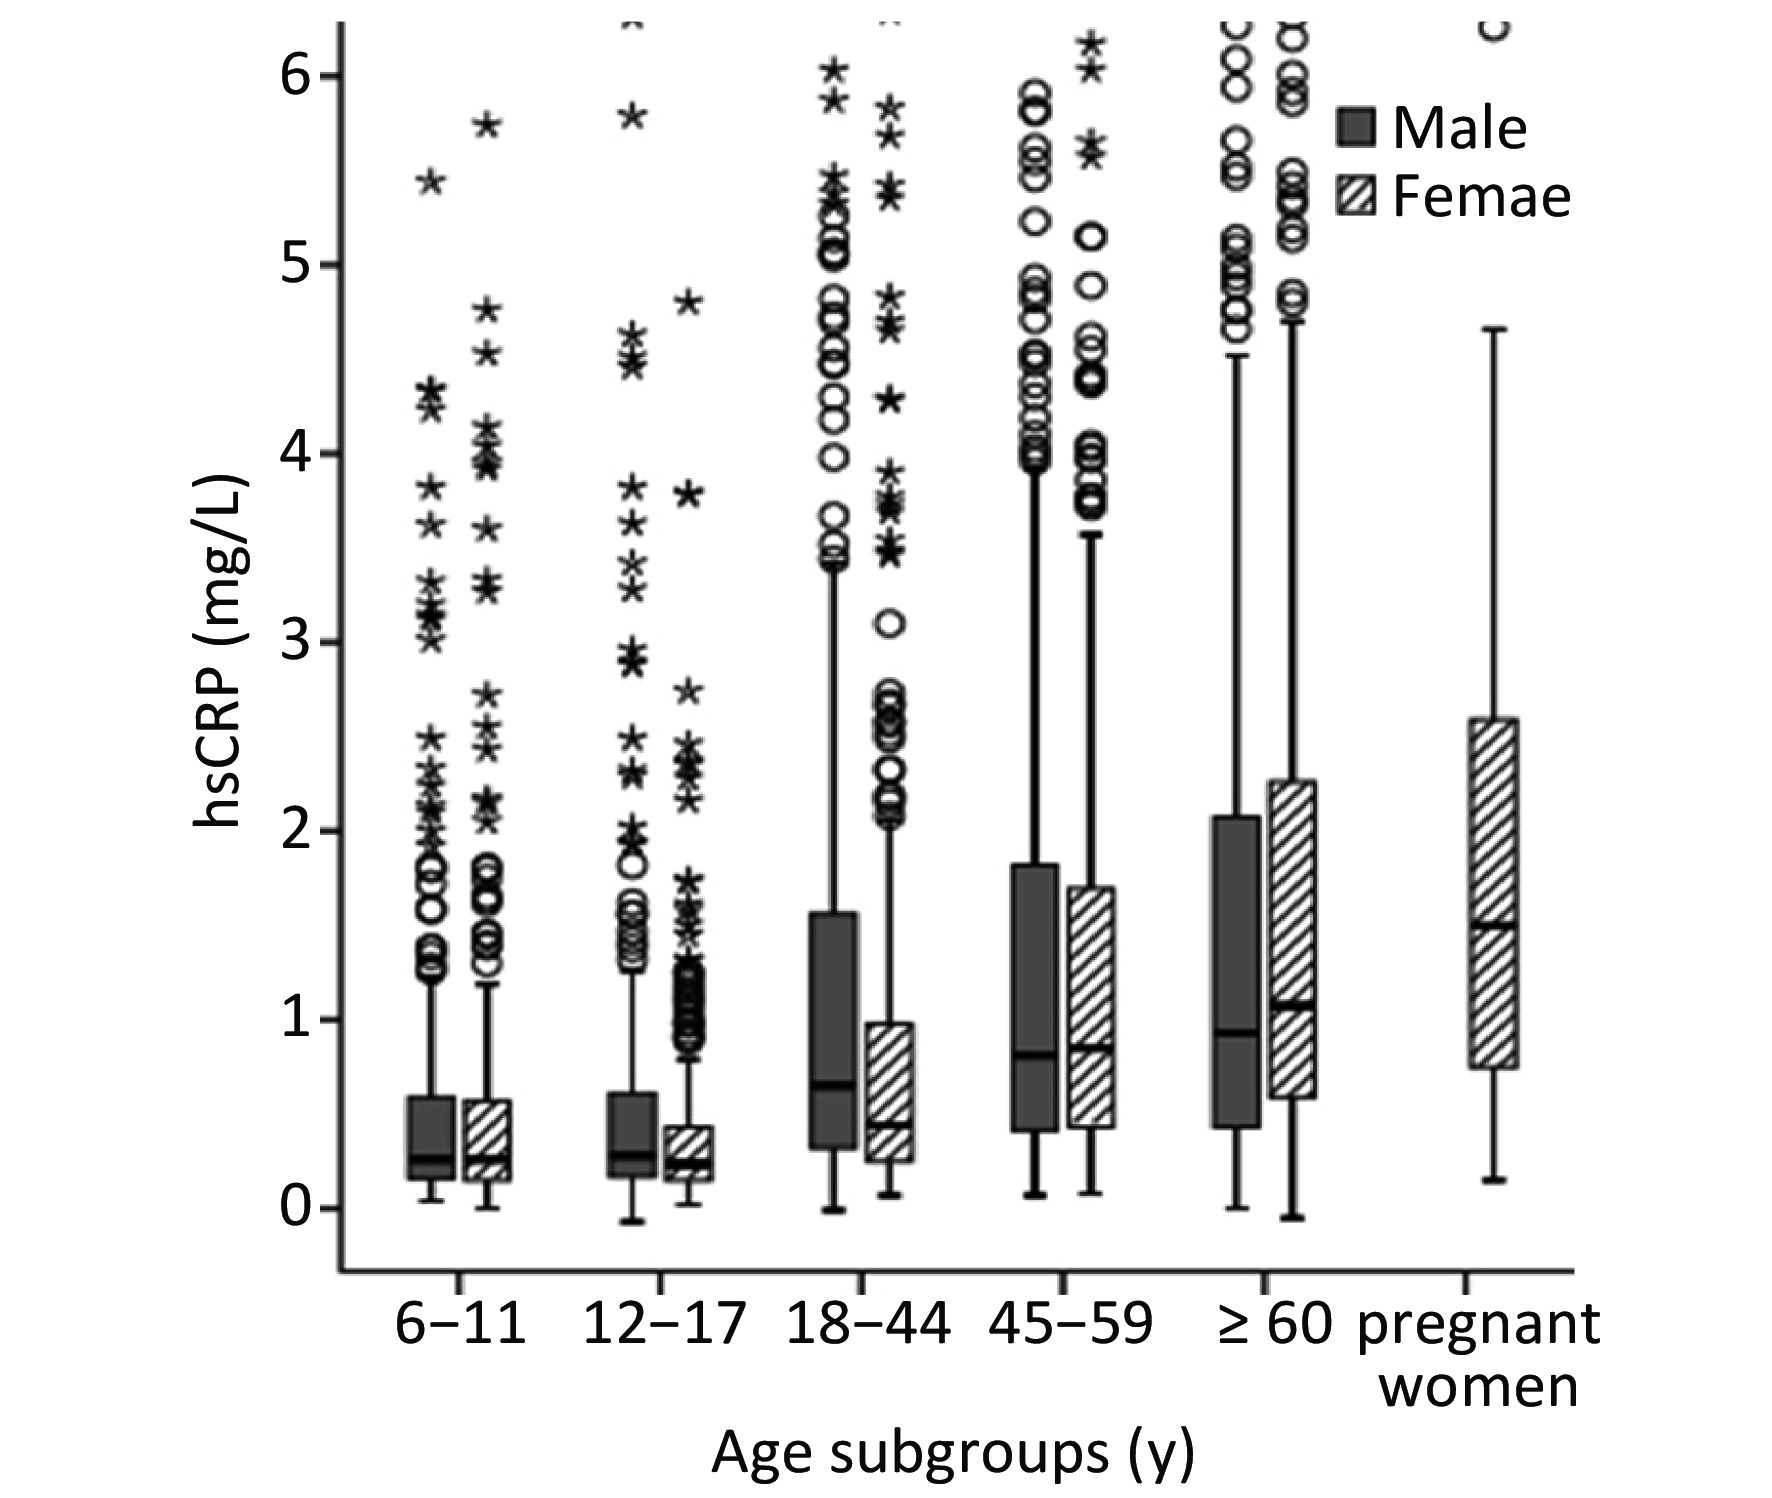
The box plots of hsCRP distribution for residents of different ages and genders are shown in Figure 3. The highest median hsCRP was found in pregnant women.
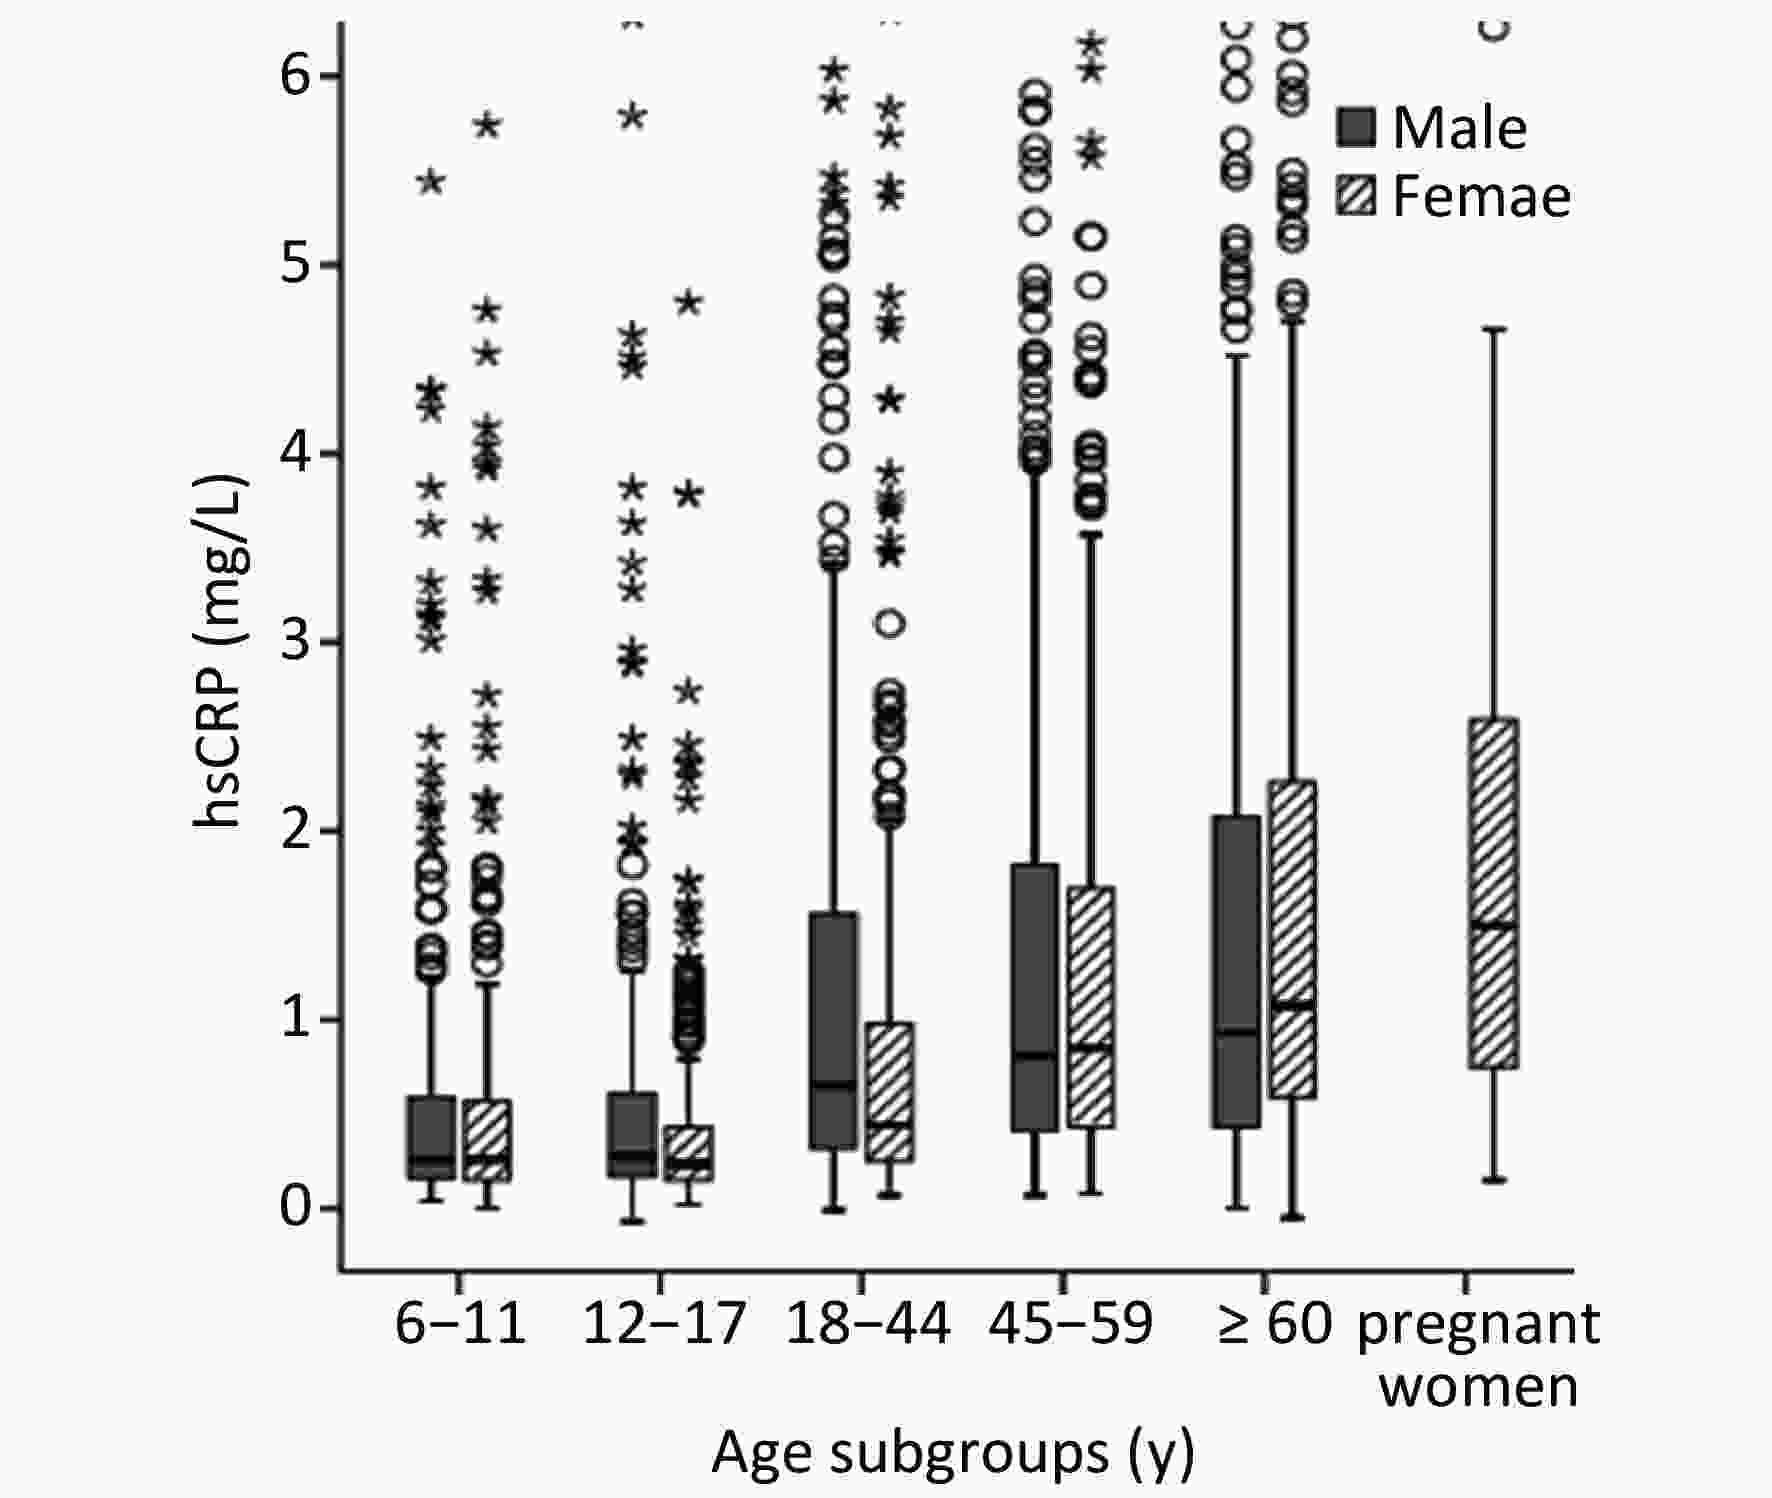
Figure 3. Box plots presenting the distribution of hsCRP for population by age and sex in large cities.
The distribution of percentiles of hsCRP levels in residents of urban areas is shown in Table 2.
-
CRP, as an acute phase protein that reflects the bacterial infection or tissue damage in the body, has been clinically used to diagnose the presence of bacterial infections in patients with an important reference indicator[8, 13]. Its application has been significantly expanded with the emergence of hsCRP-based diagnosis of diseases, especially cardiovascular disease and coronary artery disease[3]. In the present paper, male and female hsCRP levels showed a gradual upward trend with increasing age among urban people in China. Our study report was basically consistent with many results but not all studies reported in Asia[22, 27-28]. One plausible explanation for the higher hsCRP levels in males than females may be that traditional risk factors of cardiovascular disease and smoking were higher in males than in females. In addition, from the youngest age group to the oldest age group, the median hsCRP in this study increased by about 2-fold, and the female hsCRP level after 55 years was higher and closer to the male level. The result was similar to that of Wang et al.[5]. Thus, the prevalence of inflammation was higher in older women in large cities than in men, and this trend could be considered for future longitudinal studies. In addition, although hsCRP levels increased with age, the impact of age on hsCRP slightly increased.
Yuan et al.[29] measured the CRP of 522 healthy adults aged 21–66 years in China and found that the respective median values of CRP were 0.6 and 0.7 mg/L for males and females aged 20 years, 0.7 and 0.6 mg/L for males and females aged 30- years, and 0.7 and 0.7 mg/L for males and females aged 40 years, which is close to the median hsCRP of 0.65 mg/L for males aged 18–44 years in this study but slightly higher than the results for females. Similarly, Song et al. found that the median CRP level for people younger than 50 years was 0.72 mg/L, and that for those who are older than 50 years was 1.09 mg/L[30]. A significant difference was found between the two age groups. This study also found that the hsCRP concentrations in males and females of older-age residents in large cities are significantly higher than those in younger-age residents, which may be related to the high incidence of chronic diseases in older-age groups. Tang et al. conducted a survey of 30–90 year-old healthy people and found that the CRP concentration is 0.78 mg/L in males and 0.51 mg/L in females[27]. No significant difference was found between men and women. The hsCRP concentrations in females were higher than those in males, but the female CRP concentration was lower than that.
In addition, the results of the present study were compared with international studies. In South Korea, 1,046 men and women aged 16–64 were investigated[31]. The median CRP for men was 0.6 mg/L, and the median for women was 0.4 mg/L. In this study, hsCRP was 0.58 mg/L in males and 0.59 mg/L in females in large cities. A survey of 1,761 men and 2,248 women aged 25–84 years in Australia showed that the median hsCRP was 1.30 mg/L in men and 1.50 mg/L in women[18]. The United States surveyed 2,205 women over aged 20 years with a median hsCRP of 2.70 mg/L[32]. These values are about 2–4 times the median of the hsCRP in this study.
Seventy-eight pregnant women were also tested for hsCRP in this study. The median value of hsCRP was 1.42 mg/L. A survey of 202 normal pregnant women in South Korea found that the median values of hsCRP were 0.76 mg/L to 2.28 mg/L from early pregnancy to late pregnancy[33]. The result of this study was similar to the hsCRP results at 15–20 weeks of pregnancy in South Korea. Many studies have shown that serum levels of hsCRP, a marker of inflammatory response, are raised in healthy pregnant women compared with non-pregnant women. Inflammatory response is increased during pregnancy, which may be explained by different stimuli occurring at different phases of pregnancy, such as implantation and the monocyte/macrophage production stimulated by IL-6, the necrotic process associated with placental aging, and the progressive increments in estrogen levels during pregnancy[33-34]. The determination of CRP combined with IL-6 and TNF-α, as the condition progresses, may increase, which was helpful to judge the severity of hypertensive disorder complicating pregnancy and predict the development of pre-ecalampsia[33, 35]. Some studies have found that for every 1 mg/L increase in serum CRP, the risk of developing gestational diabetes increases by 20%[36]. Therefore, early detection of inflammatory factors in hsCRP, which is more sensitive than CRP during pregnancy, can help predict concurrent hypertensive disorders in pregnancy. At the same time, further longitudinal studies on hsCRP levels in a large number of pregnant women are needed to evaluate whether it is truly correlated with pregnancy outcome.
Recent data show that a certain relationship exists between the rise of CRP concentration in the normal range of healthy people and the risk of cardiovascular disease in the future[3, 37]. Through the analysis of a large number of research data, the US CDC and the American Heart Association proposed that hsCRP is a useful marker for predicting the risk of future cardiovascular disease and the diagnosis and treatment of patients with acute coronary syndrome[21,38]. When the concentration of hsCRP was less than 1 mg/L, the risk of acute coronary syndrome was relatively low; when the concentration was between 1 and 3 mg/L, the risk was moderate; however, when the concentration was greater than 3 mg/L, the risk was higher[17].
This study has several limitations. First, the supplementary pregnant women were not specifically sampled because of limited funds; thus, the sample size of pregnant women was small. Second, no correlation analysis was conducted among dietary, BMI, disease-related factors, and hsCRP in this study.
Despite these limitations, to the best of our knowledge, this was the latest study involving a large-scale sample size of people in 31 provinces and their ages from 6 to over 60 years old. This study established a foundation for further research concerning hsCRP in China. Further analysis on the association between levels of hsCRP and the presence of bacterial infection, inflammatory processes of tissues damage, dietary, and BMI will be needed in the future to provide a comprehensive view of hsCRP as a biomarker.
-
This study was the first to provide the level and distribution of hsCRP status in a representative urban population including children, young adults, middle-age, and older people in large cities in China. It also supplied data for a wide range of hsCRP values. hsCRP is a sensitive indicator that reflects the state of inflammation in the body more accurately than CRP. It measures the physical condition of residents in large cities in China, and it has a guiding significance for bacterial infection, various inflammatory processes, tissue damage and its repair process, screening, monitoring, condition assessment, curative effect judgment, and so on.
-
National Nutrition and Health Survey 2010 was supported by the Ministry of Health, China. We thank the team members and all participants from 31 provinces.
-
WANG Li Juan, TANG Yan Bin, HUANG Jian, LI Hong, PIAO Jian Hua, SUN Jing, and HUO Jun Sheng have no conflicts of interest.
Funds:
This study was supported by the National Key Research and Develepment Program of China [2016YFD0400602]
&These authors contributed equally to this work and should be regarded as co-first authors.
 Quick Links
 DownLoad: