


-
High incidences of sudden water pollution and continuous water stoppage that occur owing to industrial wastes have seriously affected urban water supply security and human health in China. To protect the eco-environment and human health, the State Council and relevant commissions and ministries have realized the importance of establishing a more scientific water environmental quality standard system based on its own water quality criteria[1].
Phenol was selected because of its high-production and widespread use in daily life products[2]. However, this leads to frequent incidents of phenol pollution in China. There are also concerns regarding the adverse health effects of phenol exposure, as phenols are listed as potential endocrine disruptors, particularly following exposure during fetal life[3].
Phenol was not covered in the third and fourth editions of the Guidelines for Drinking-water Quality published by the World Health Organization (WHO)[4,5]. However, in the chlorophenol section of the third edition, it is mentioned that the total phenol content of water to be chlorinated should be kept below 0.001 mg/L[4]. The maximum contaminant level goal and the maximum contaminant level of phenol in drinking water are also not mentioned in the National Primary Drinking Water Regulations published by the US Environmental Protection Agency (EPA)[6].
The Standards for Drinking-water Quality in China states that phenol compounds that can be combined with chlorine to form a chlorophenol odor are mainly compounds that could be distilled and determined in water quality monitoring, such as phenol, cresol, or benzenediol. Phenol in water is mainly a result of industrial wastewater pollution, in which phenol is the main component. The olfactory threshold concentration of phenol is 18 mg/L, and the olfactory threshold concentration of chlorophenol following combination of phenol with chlorine is 0.005 mg/L. The limit of volatile phenolics in drinking water in most countries is 0.001 mg/L, which is higher than that of chlorophenols. The limit of volatile phenols in drinking water in China is set at 0.002 mg/L[7, 8].
The Health Advisory Program of the US EPA, sponsored by the Office of Water, provided information on health effects, analytical methodology, and treatment technology that would be useful in managing drinking water contamination[9,10]. In the Health Advisories for IOCs and SOCs published by the US EPA, 6 mg/L is set as the one-day, ten-day, and longer-term health advisory (HA) for phenol. The no-observed-adverse-effect level (NOAEL) that to confirm the one-day, ten-day, longer-term, and lifetime HA is in accordance with the developmental toxicity test in rats conducted by Jones-Price et al.[11]. In the 2018 edition of Drinking Water Standards and Health Advisories, the one- and ten-day HA was still 6 mg/L, but the reference dose (RfD) was changed into 0.3 mg/(kg∙d) because the US EPA altered the calculation method into lower confidence limit on the benchmark dose instead of NOAEL[12-23] since the 2004 edition. No suitable information was found in the available literature for determining the one- and ten-day HA of phenol. As a conservative estimate for one- and ten-day exposure, a modified drinking water equivalent level (DWEL) was recommended for a 10-kg child of 6 mg/L, assuming that the daily water consumption of a child is 1 L/d;[10,11] one consideration was the developmental toxicity of phenol, which can induce significant effects in fetuses. Thus, this study aimed to verify the NOAEL, RfD, and modified DWEL of phenol. We used a method based on a short-term exposure health risk quantitative assessment method commonly used in toxicology and risk assessment studies. This study also aimed to establish an assessment framework for short-term exposure health risks of emergency drinking water pollutants in China.
-
The method of this verification experiment was the same as the method in the US EPA, but we added 15 and 240 mg/kg as the lowest and highest dose groups, respectively.
-
Phenol (CAS 108-95-2; analytically pure) and other chemicals used in this study were purchased from Sinopharm Group Chemical Reagents Beijing Co., Ltd (Beijing). For all studies, phenol was dissolved in distilled water and prepared fresh daily.
-
All animal procedures were approved by the Institutional Animal Care and Use Committee of the Chinese Center for Disease Control and Prevention (China CDC) at Beijing, China (license number: 2016007). Sexually mature, specific-pathogen-free Sprague-Dawley rats were provided by Jin Muyang Experimental Animal Breeding Co., Ltd. [SYXK (Jing) 2014-0043] (Beijing). The weights of male rats ranged from 300–325 g, and those of female rats ranged from 190–210 g (9 weeks old). Two females were placed in a male’s cage in the evening and they were allowed to mate overnight. Each female was examined at the next morning for the presence of vaginal plugs or sperm in the vaginal smears to determine whether copulation had occurred. The day when an evidence of copulation was found was designated as postcoital day 0. To minimize differences in body weight among groups, pregnant animals were allocated into four groups from the control dose to the high dose to confirm the day of copulation. More than 20 copulated females per group were used.
All rats used in this study were maintained in accordance with the Guidance for Animal Use at CERI Hita, which was drafted with reference to the Consensus Recommendations on Effective Institutional Animal Care and Use Committees by the American Association for Laboratory Animal Science[24].
Rats were housed in a barrier-systematized animal room [license number: SYXK (Jing) 2014-0043] and kept at a temperature of 21–25 ℃ and a relative humidity of 40%–70%, with a ventilation rate of 10–15 times/h and lighting for 12 h daily (from 7:00 a.m. to 7:00 p.m.). Rats were kept in suspended stainless steel cages (260W mm × 380D mm × 180H mm) of one animal per cage for males, two animals per cage for females during acclimation, and three animals (one male and two females) per cage during mating. The rats were also kept in suspended stainless steel cages (165W mm × 300D mm × 150H mm) of one rat per cage for females after copulation was confirmed. Rats were allowed access to pelleted food (Coo Cooperation Feed Co. Ltd., Beijing, China) and tap water by sipper tubes from an automatic system and an individual supply bottle ad libitum.
-
On gestation day (GD) 5, pregnant rats were weighed and randomly divided into 7 groups (5 treatment groups, 1 vehicle control group, and 1 positive control group) with at least 20 rats in each group. Rats in the treatment groups were administered phenol via oral gavage at doses of 15, 30, 60, 120, 240 mg/kg b.w., whereas rats in the negative control group received distilled water alone via oral gavage and those in the positive control group were intraperitoneally injected 15 mg/kg b.w. of cyclophosphamide on GD 12. All rats were treated at a dosing volume of 10 mL/kg b.w. by oral gavage daily for 10 consecutive days[25].
-
Clinical Observations The general conditions of all pregnant rats were observed once or twice a day from the start of administration to postcoital day 20. Mortality, pertinent behavioral changes, and all signs of overt toxicity in the rats were recorded. Rats were weighed on day 0, the first day of dosing, and the day of scheduled kill at least every 3 d during the dosing period.
Caesarean Section Dams were euthanized by necropsy on postcoital day 20, and the ovaries and uterus were weighed and opened. The numbers of viable and nonviable fetuses, early and late resorptions, corpora lutea, implantations, and resorptions, as well as the gender ratios, body weights, and placental weights of live fetuses, were recorded.
Fetal Examination Fetuses were examined for external appearance, including fetal gender, body weight, body length, tail length, and abnormalities. Fetuses from each litter were equally and randomly divided into two groups. Approximately half of live fetuses were fixed in ethanol 95% (v/v) for 2 weeks, cleared in potassium hydroxide 1.5% (w/w) for 2 d, and stained with Alizarin Red S for 2 d to examine the skeleton[26]. The other live fetuses were fixed in Bouin’s fluid for 2 weeks for visceral examination[27, 28].
-
SPSS 17.0 (International Business Machines Corporation, USA) was used for statistical analysis of the experimental data. Whenever possible, the data were presented as mean ± standard deviation (SD). The absolute and relative weights of internal organs as well as hematological and biochemical parameters were compared using one-way analysis of variance followed by Dunnett’s test. The effect of phenol on body weight and body weight gain was evaluated by analysis of variance followed by Dunnett’s multiple comparison test if significant differences were found[29]. Frequency data (the total number of resorbed litters and gender ratio of live fetuses with delayed ossification) were analyzed using Fisher’s exact probability test[30]. Statistical analysis of offspring data was carried out using the litter as a unit. In all statistical analyses, the difference between the compared variables was assumed to be statistically significant at P < 0.05. RfD and DWEL were calculated by the following formulas: RfD = NOAEL or LOAEL or BMDL/UF; Modified DWEL = RfD × BW/DWI; NOAEL or LOAEL or BMDL for 60 mg/(kg∙d), UF for 100, BW for 10 kg, DWI for 1 L/d.
-
Oral administration of phenol resulted in the death of 4 pregnant rats at 60 mg/kg, 5 pregnant rats at 120 mg/kg, and 14 pregnant rats at 240 mg/kg. These dead pregnant rats exhibited back hair loss and convulsions.
The rats that survived gestational exposure to phenol in each dosing group gained body weight as expected (Table 1). Maternal body weight, body weight gain, and gravid uterus weight showed no significant dose-dependent changes. However, the net body weight significantly increased at 30 mg/kg compared with that in the vehicle control group.
Variable Vehicle
control
(n = 19)Positive
control
(n = 18)Groups exposed to phenol [mg/(kg∙d)] 15 (n = 20) 30 (n = 19) 60 (n = 20) 120 (n = 17) 240 (n = 6) Subjects (dams) Total treated 20 20 20 20 25 25 20 Deaths 0 0 0 0 4 5 14 Nonpregnant at sacrifice 1 2 0 1 1 3 0 Pregnant at sacrifice 19 18 20 19 20 17 6 Maternal body weight (g) GD 0 301.3 ± 19.9 320.3 ± 20.2 288.1 ± 27.5 308.3 ± 18.6 291.7 ± 24.4 296.1 ± 22.1 308.3 ± 14.3 GD 6 311.2 ± 20.6 329.7 ± 19.8 322.0 ± 26.1 329.6 ± 20.3 318.2 ± 27.7 320.4 ± 26.6 327.7 ± 16.4 GD 9 324.9 ± 24.0 343.6 ± 24.1 340.7 ± 27.3 338.7 ± 21.4 334.4 ± 29.3 330.9 ± 30.5 323.0 ± 27.5 GD 12 329.6 ± 25.1 347.1 ± 22.6 343.4 ± 23.2 351.9 ± 24.1 344.8 ± 28.0 337.6 ± 28.5 328.7 ± 26.9 GD 15 351.4 ± 26.3 368.9 ± 25.0 378.8 ± 28.3 363.3 ± 28.5 362.7 ± 27.5 354.2 ± 28.7 338.7 ± 33.6 GD 20 387.1 ± 38.4 393.1 ± 28.9 402.6 ± 27.9 428.4 ± 40.1 406.0 ± 26.8 413.8 ± 40.1 365.7 ± 60.4 Gravid uterus weight (g) 62.83 ± 17.65 40.69 ± 12.70** 65.34 ± 9.40 56.12 ± 19.70 65.26 ± 12.73 55.93 ± 17.85 40.72 ± 16.39 Body weight gain (g)a 81.2 ± 17.8 63.4 ± 17.6 80.6 ± 32.8 98.8 ± 28.4 87.9 ± 16.9 93.4 ± 29.2 38.0 ± 46.4 Net body weight gain (g)b 18.3 ± 17.1 22.8 ± 10.2 15.3 ± 33.7 42.7 ± 20.1** 22.6 ± 7.2 37.5 ± 34.7 −2.7 ± 38.1 Note. Values are expressed as mean ± SD. aBody weight on GD 20 - body weight on GD 6. bBody weight on GD 20 - body weight on GD 6 - gravid uterine weight. **Significant differences from the vehicle control group, P < 0.01. Table 1. Maternal body weight, gravid uterus weight, and body weight change in female rats receiving phenol per os from gestation day (GD) 5 to 20
-
There was no significant difference between the phenol dose group and the vehicle control group in the number of corpora lutea and implantation. However, the preimplantation loss rate was 6.2% in the 240 mg/kg group, and no preimplantation loss was observed in the other test groups. The ratio of live fetuses in the 240 mg/kg group was significantly lower than that in the vehicle control group. However, the ratios of fetal resorption and postimplantation loss in the 240 mg/kg group were significantly higher than those in the vehicle control group. Fetal gender ratio in the 30 and 240 mg/kg groups deviated from 1:1 (Table 2).
Variable Vehicle
controlPositive
controlGroups exposed to phenol [mg/(kg∙d)] 15 30 60 120 240 All littersa 19 18 20 19 20 17 6 Number of implantation sitesb 15.1 ± 3.1 15.2 ± 3.0 15.5 ± 1.8 14.3 ± 3.7 14.4 ± 2.6 15.3 ± 22 15.2 ± 7.5 Number of corpora luteab 15.1 ± 3.1 15.2 ± 3.0 15.5 ± 1.8 14.3 ± 3.7 14.4 ± 2.6 15.3 ± 2.2 16.2 ± 6.6 Preimplantation loss (%)c 0.0 0.0 0.0 0.0 0.0 0.0 6.2* Number of fetuses 286 274 310 255 288 260 91 Number of live fetuses 269 227 308 249 279 258 76 Ratio of live fetuses (%) 94.1 82.9 99.4 91.5 96.9 99.2 83.5 Number of resorbed fetuses 16 19 2 2 9 2 15 Ratio of fetal resorption (%) 5.6 6.9 0.6 0.7 3.1 0.8 16.5 Number of dead fetuses 1 28 0 4 0 0 0 Ratio of dead fetuses (%) 0.4 10.2 0.0 1.6 0.0 0.0 0.0 Postimplantation loss (%)d 5.9 17.2 0.6 2.4 3.1 0.8 16.5 Sex ratio (M:F) 147:122 78:149 145:163 80:169 117:162 104:154 29:47 Note. aIncluded all pregnant females at euthanasia. bValues are expressed as mean ± SD. cPreimplantation loss (%) = [(number of corpora lutea - number of implantation sites) / number of corpora lutea] × 100%. dPostimplantation loss (%) = [(no. resorbed + dead fetuses) / no. implantations] × 100%. *Significant differences from the vehicle control group, P< 0.05. Table 2. Developmental toxicity in rat fetuses prenatally exposed to phenol
-
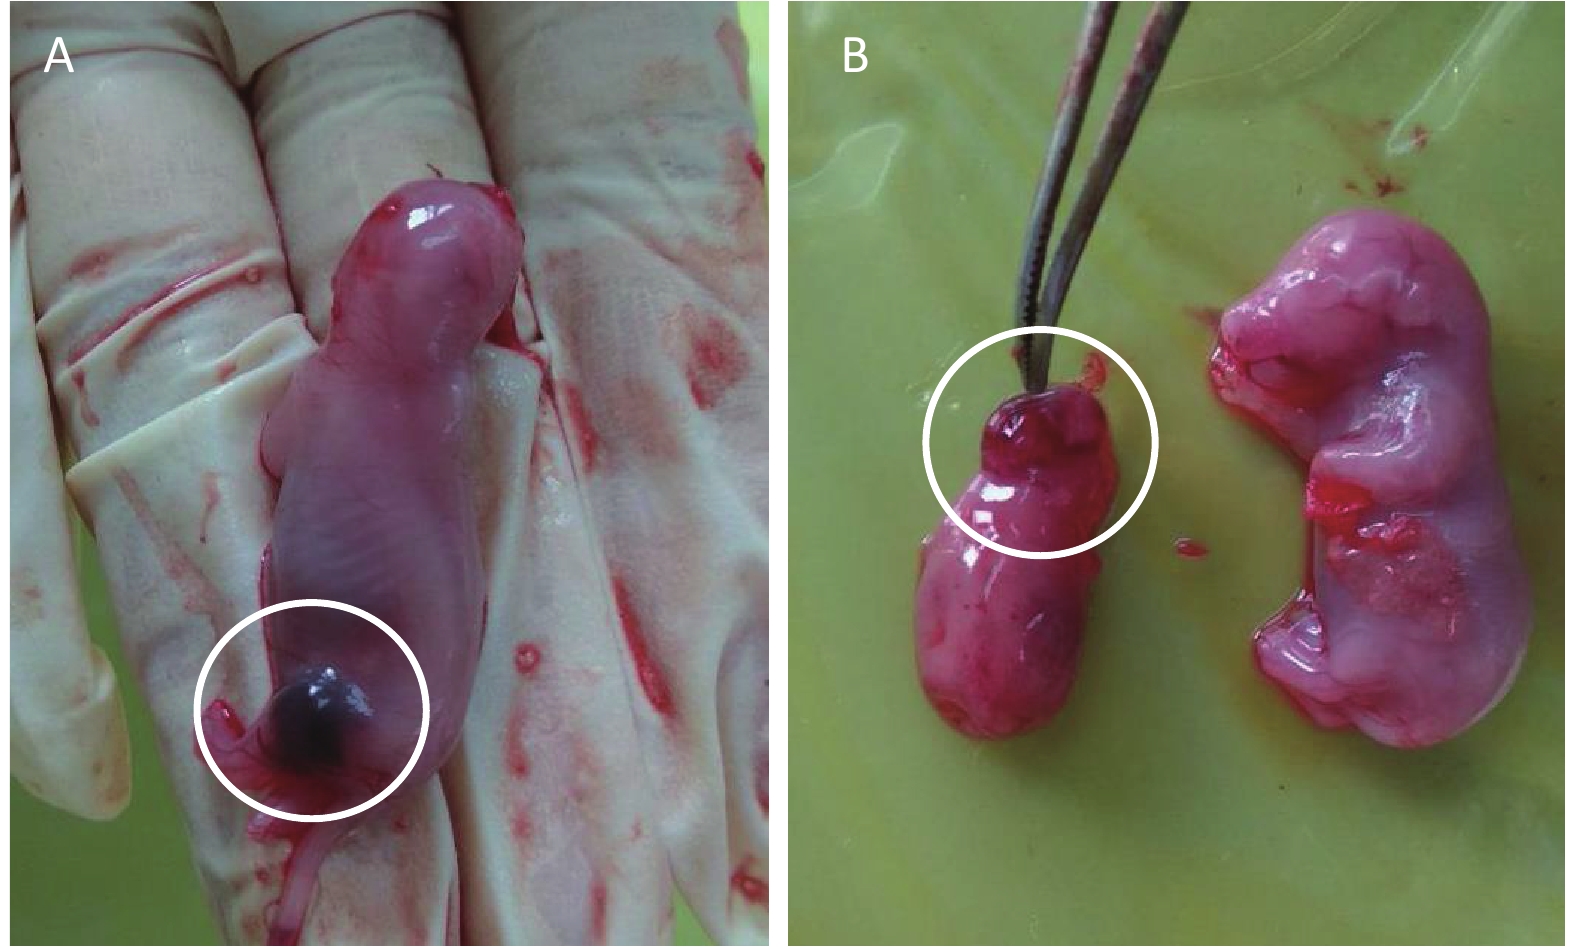
Results of fetal clinical observations are shown in Table 3 and Figure 1. Two rat fetuses showed ecchymoma in the vehicle control group (Figure 1A). Encephalocele and small brain were observed in all rat fetuses in the positive control group (Figure 1B). No overt signs were noted in the phenol treatment groups.
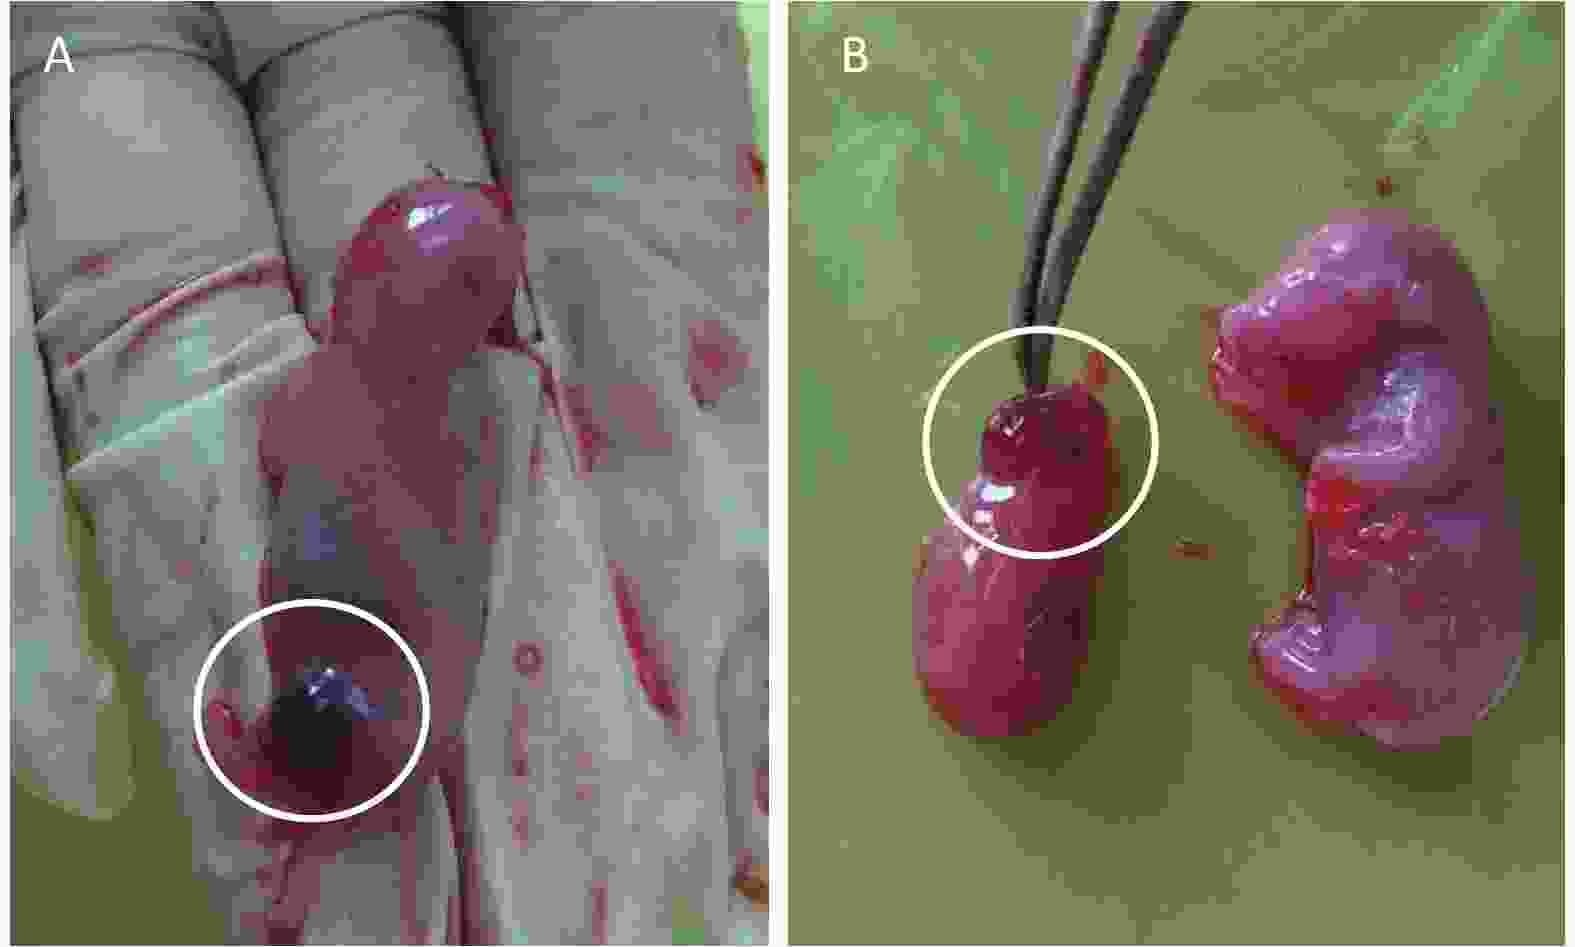
Figure 1. External examination of fetus treated with phenol during gestation. (A) Ecchymoma of the fetal lower limb. (B) The left side of the figure shows fetal encephalocele; the right side of the picture shows a normal rat fetus.
Variable Vehicle
controlPositive
controlGroups exposed to phenol [mg/(kg∙d)] 15 30 60 120 240 Number of litters for external examination 19 18 20 19 20 17 6 Number of fetuses for external 269 227 308 249 279 258 76 Litters exhibiting abnormal findings (number/percentage) 2/10.5 18/100.0 0/0.0 0/0.0 0/0.0 0/0.0 0/0.0 Fetuses exhibiting abnormal findings (number/percentage) 2/0.7 227/100.0 0/0.0 0/0.0 0/0.0 0/0.0 0/0.0 Type of external abnormalities Ecchymoma 2/0.7 0/0.0 0/0.0 0/0.0 0/0.0 0/0.0 0/0.0 Encephalocele 0/0.0 227/100.0 0/0.0 0/0.0 0/0.0 0/0.0 0/0.0 Table 3. External examination of rat fetuses prenatally exposed to phenol
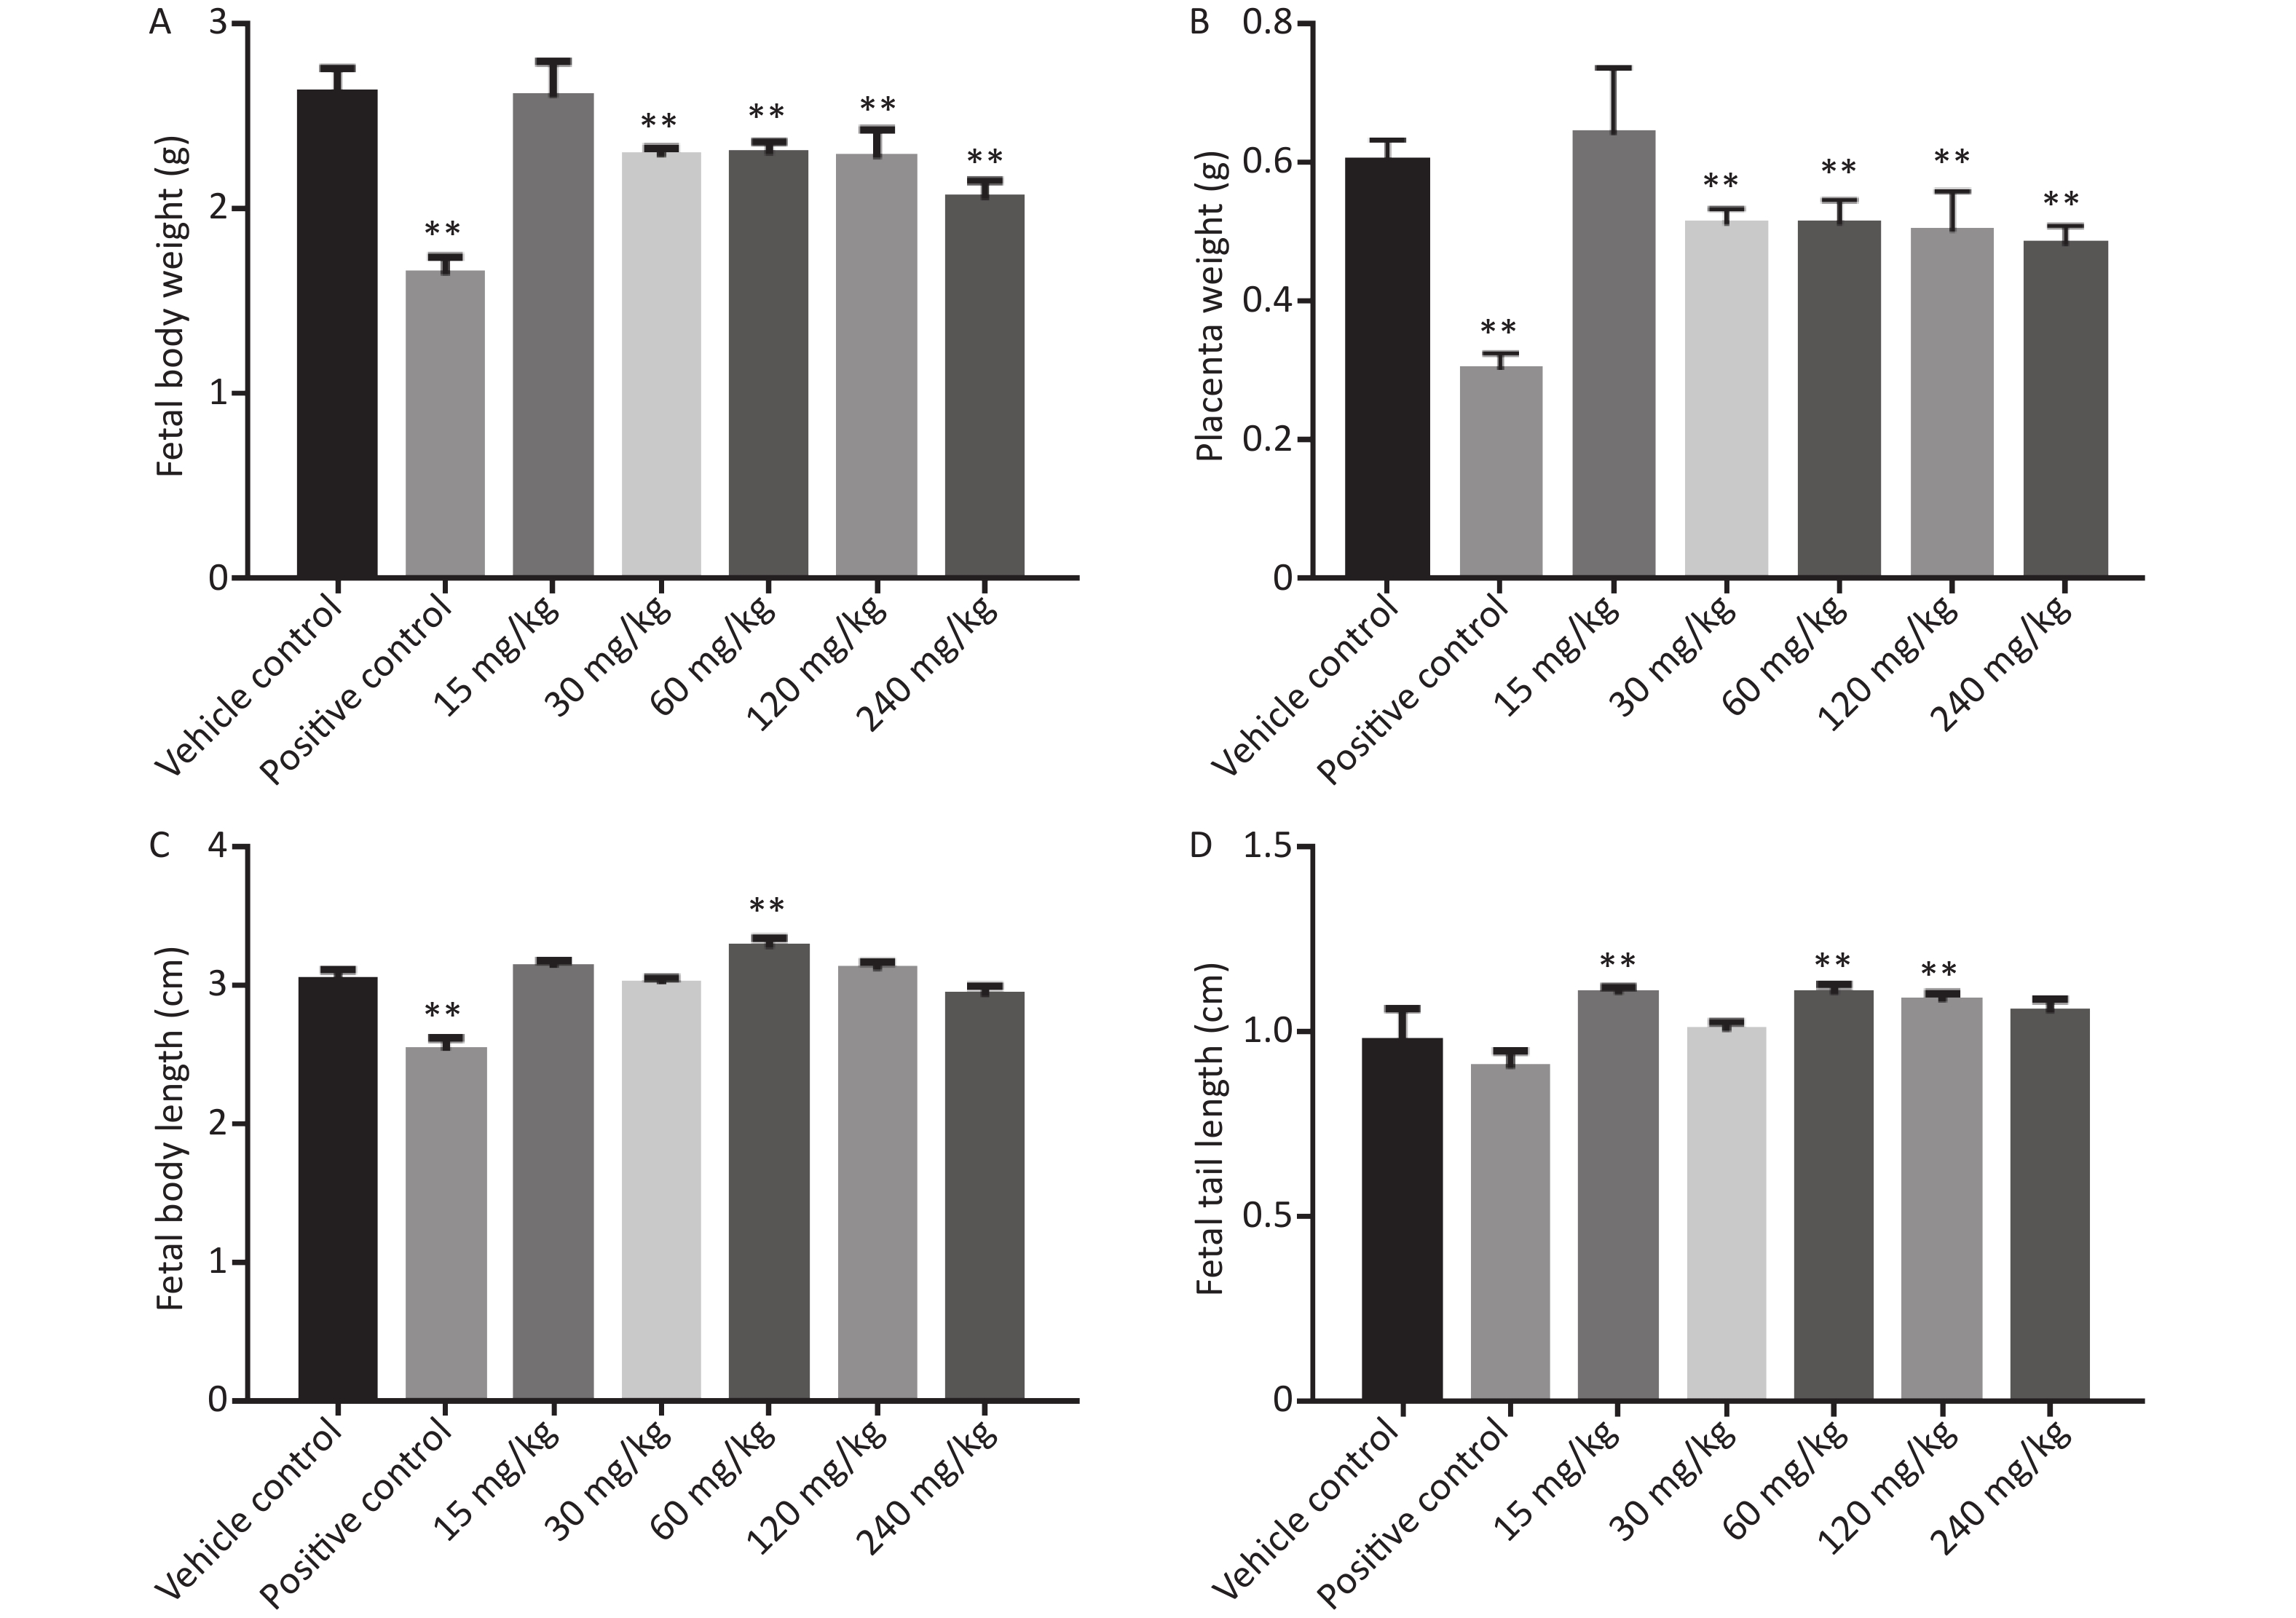
As shown in Figure 2, the fetal body length, fetal body weight, and placental weight of the positive control group were significantly lower than those of the vehicle control group.
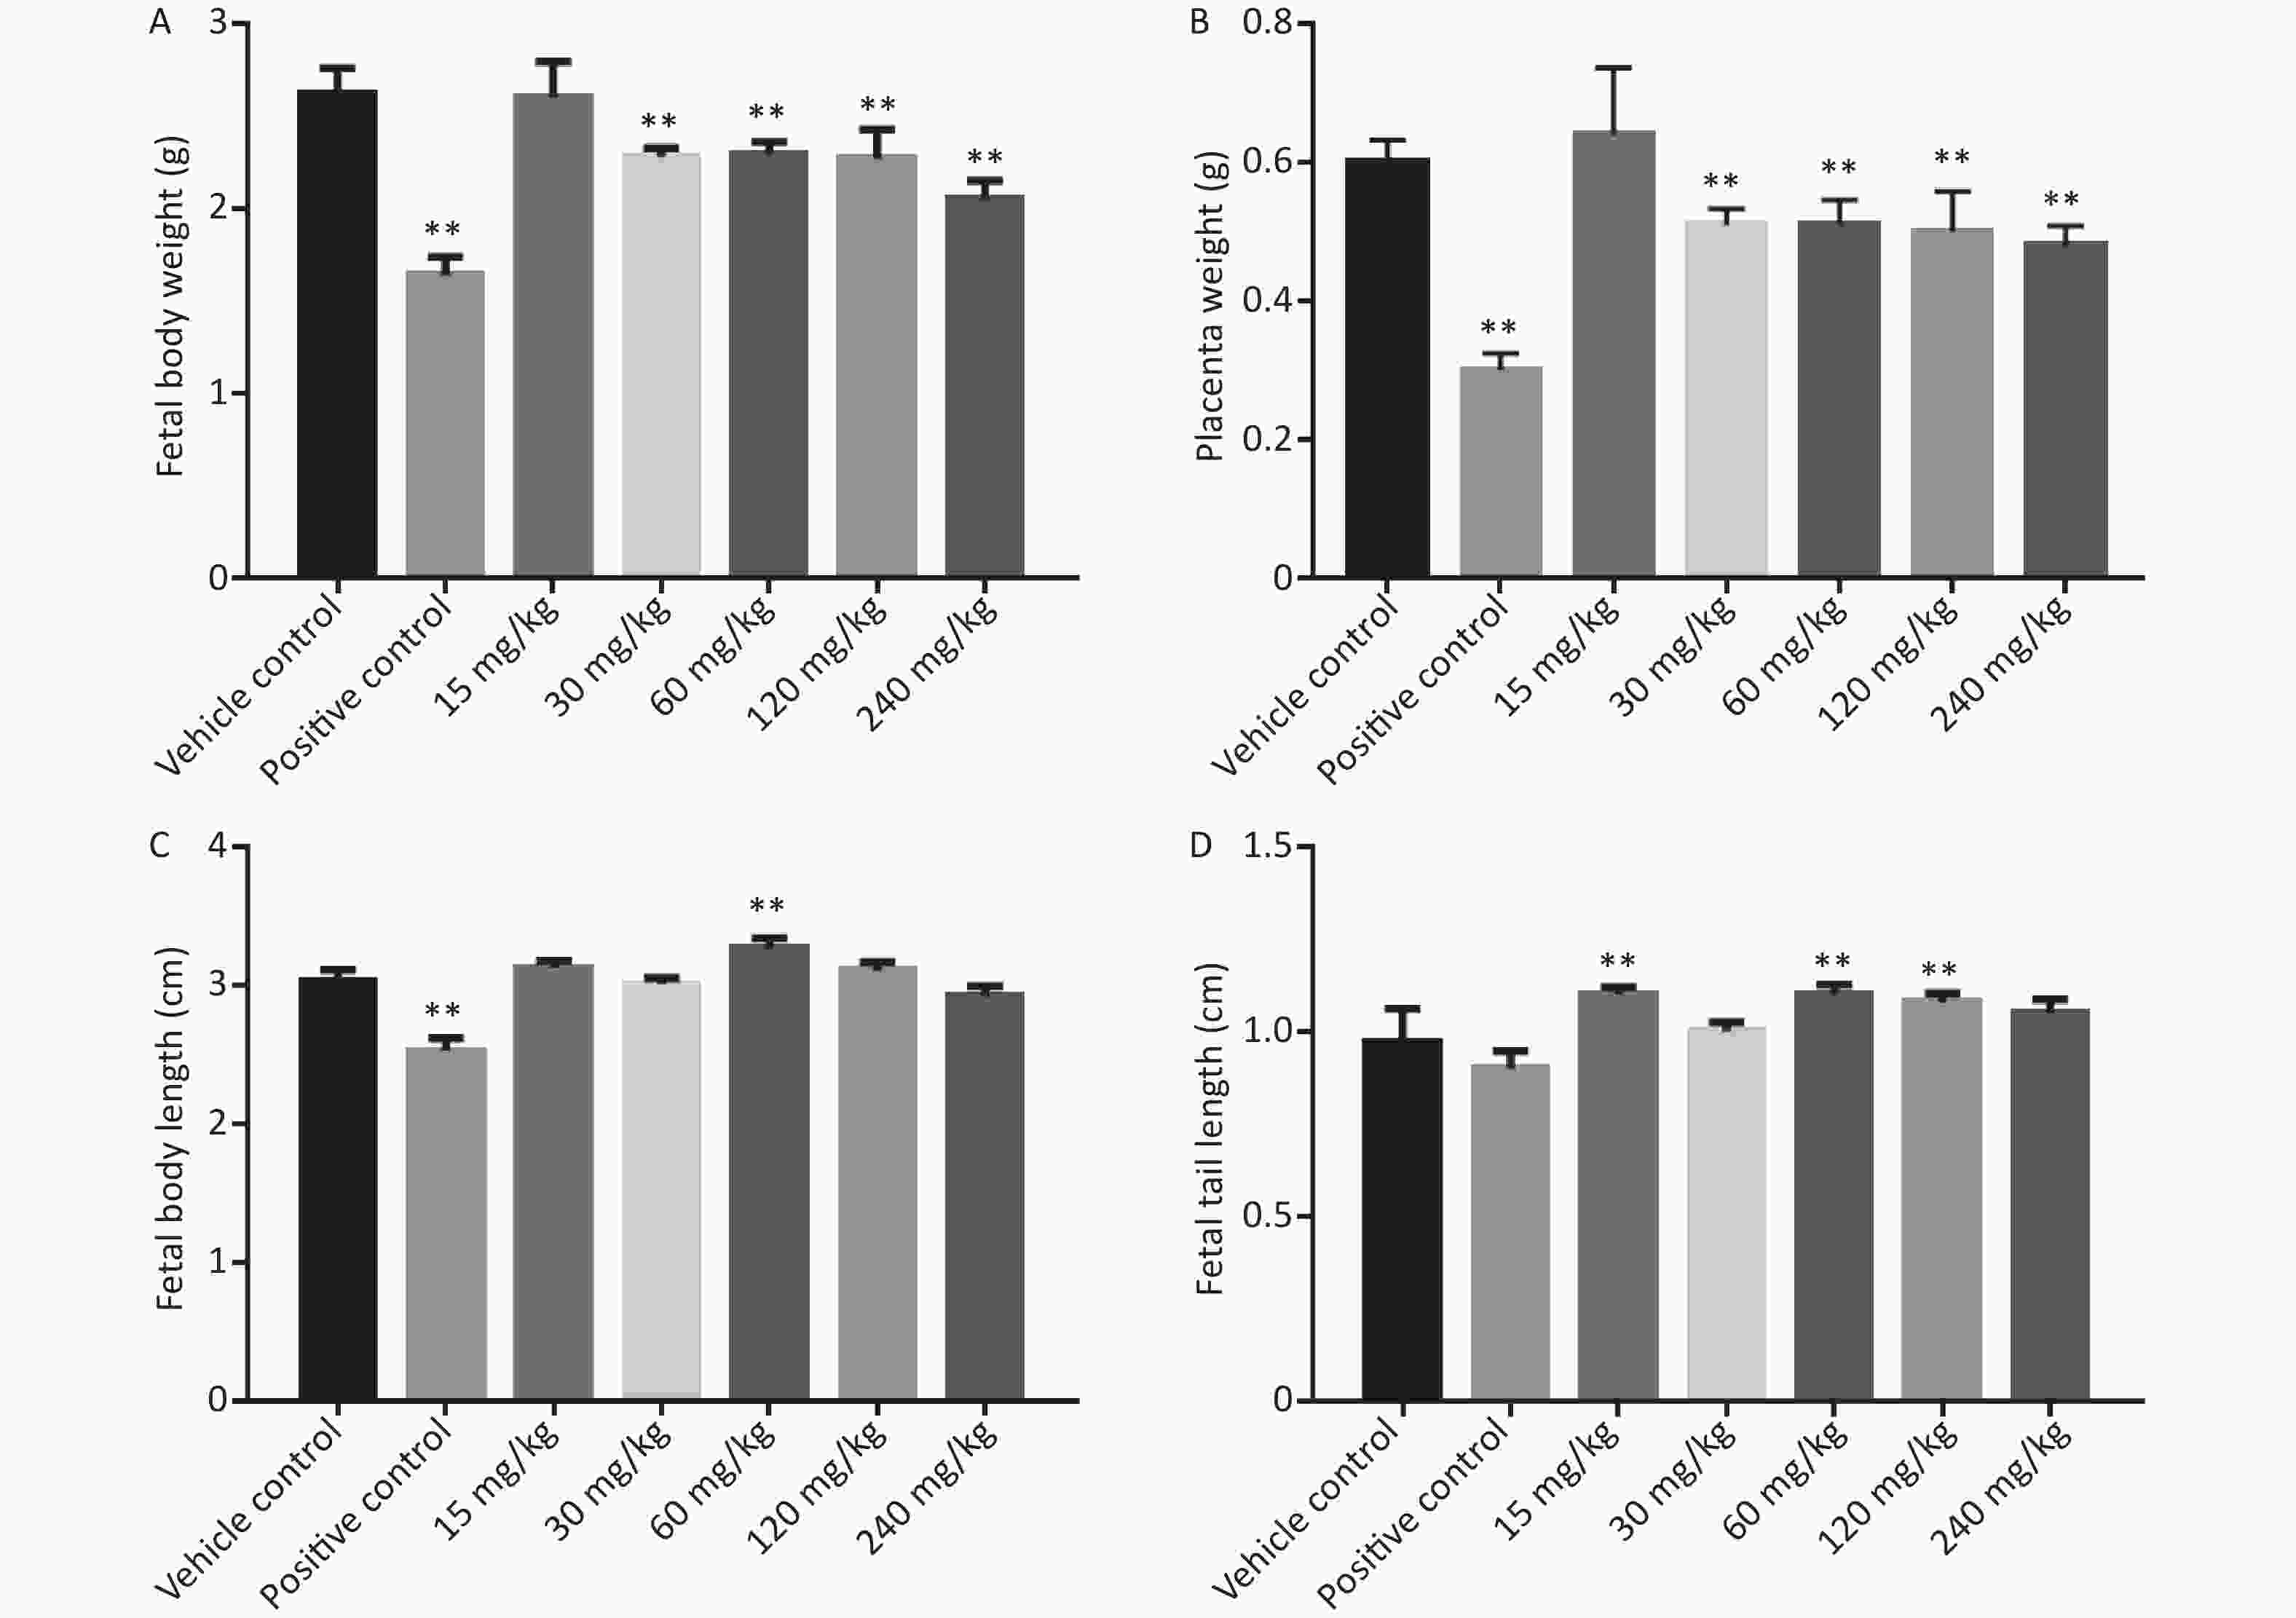
Figure 2. Effects of phenol on fetal body weight, placenta weight, fetal body length, and fetal tail length. (A) Fetal body weight. (B) Placenta weight. (C) Fetal body length. (D) Fetal tail length. Data are expressed as mean ± SEM. **Compared with the vehicle control group, P < 0.01.
In the phenol-treated groups, starting from the 30 mg/kg dose group, placental and fetal weights were significantly lower than those of the vehicle control group. Fetal body length was significantly higher in the 15 and 60 mg/kg dose group than in the vehicle control group (P < 0.05), but was not significantly different between the other dose groups and the vehicle control group. Fetal tail length was significantly longer in the 15, 60, and 120 mg/kg dose groups than in the vehicle control group, but was not significantly different between the other dose groups and the vehicle control group.
-
No treatment-related fetal malformations were observed. Results of visceral examinations are shown in Table 4. Different degrees of cardiac (auricle blood clot) and liver abnormalities were observed in each experimental group.
Variable Vehicle
control
Positive control
Groups exposed to phenol [mg/(kg∙d)] 15 30 60 120 240 Number of litters for visceral examination 19 18 20 19 20 17 6 Number of fetuses for visceral examination 133 110 151 121 134 128 37 Litters affected (number/percentage)a 7/36.8 17/94.4 10/50.0 4/22.2 13/65.0 8/47.1 4/66.7 Fetuses with malformationsb (number/percentage) 11/8.3 85/77.3 17/11.3 5/4.1 19/14.2 24/18.8 9/24.3 Type of visceral variations Ventricular dilatation and hemorrhage, small brain 0/0.0 66/60.0 0/0.0 0/0.0 0/0.0 1/0.8 0/0.0 Auricle blood clot 10/7.5 19/17.3 17/11.3 5/4.1 19/14.2 23/18.0 8/21.6 Redundant liver, abdominal hernia, reduced liver lobe, abnormalities 1/0.8 3/2.7 0/0.0 0/0.0 1/0.7 1/0.8 1/2.7 Small right kidney 0/0.0 3/2.7 0/0.0 0/0.0 0/0.0 0/0.0 0/0.0 Cutaneous dropsy 0/0.0 49/44.5 0/0.0 0/0.0 0/0.0 0/0.0 0/0.0 Note.aIncluded litters with one or more affected fetuses. bA single fetus might be presented more than once when listing individual defects. Table 4. Visceral examination of rat fetuses prenatally exposed to phenol
The following visceral variations were observed: vehicle control group: auricle blood clot in 10 fetuses, redundant liver in 1 fetus; 15 mg/kg group: auricle blood clot in 17 fetuses; 30 mg/kg group: auricle blood clot in 5 fetuses; 60 mg/kg group: auricle blood clot in 19 fetuses, reduced liver lobe in 1 fetus; 120 mg/kg group: auricle blood clot in 23 fetuses, abnormality in 1 live fetus; 240 mg/kg group: auricle blood clot in 8 fetuses, redundant liver in 1 fetus. The malformation ratios of fetuses in the phenol-treated groups (from low to high doses) were 11.3%, 4.1%, 14.2%, 18.8%, and 24.3%, respectively.
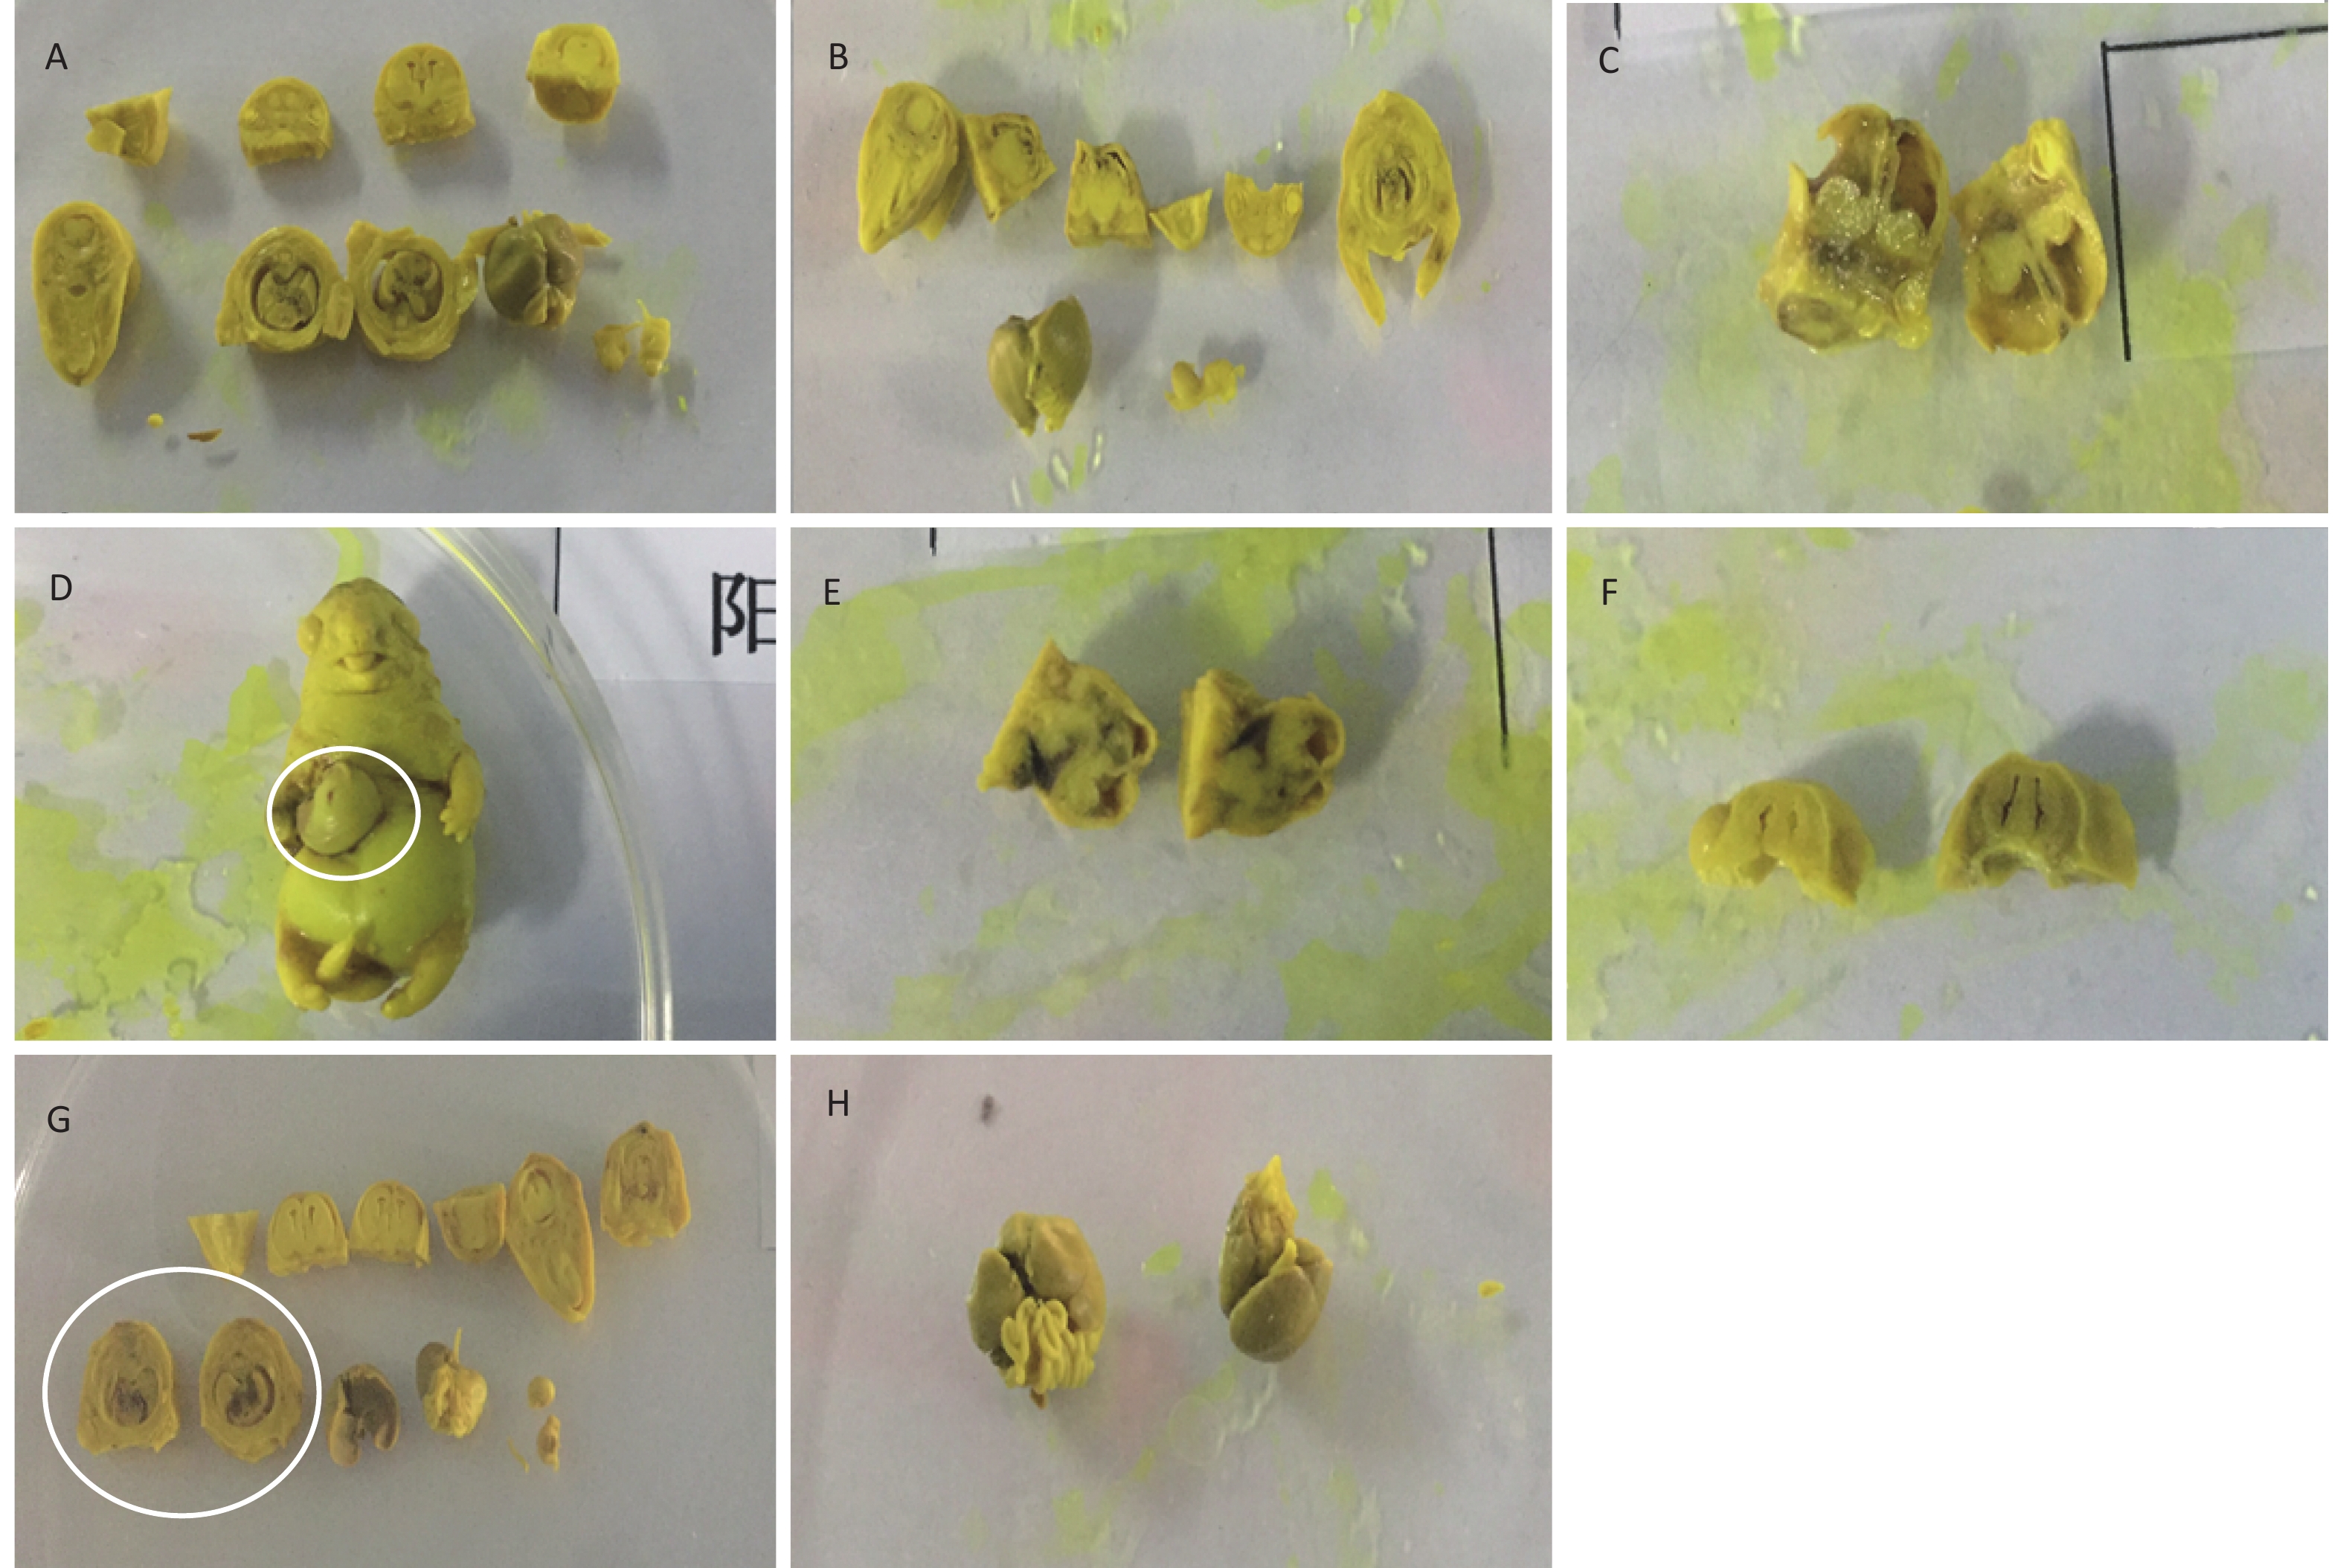
In addition to the above-mentioned changes in visceral abnormalities, other abnormalities were also observed in the positive control group, including small brain, intraventricular hemorrhage, ventriculomegaly, and peritoneal interstitial hemorrhage, as well as small right kidney and cutaneous dropsy. Some typical visceral variations are shown in Figure 3.
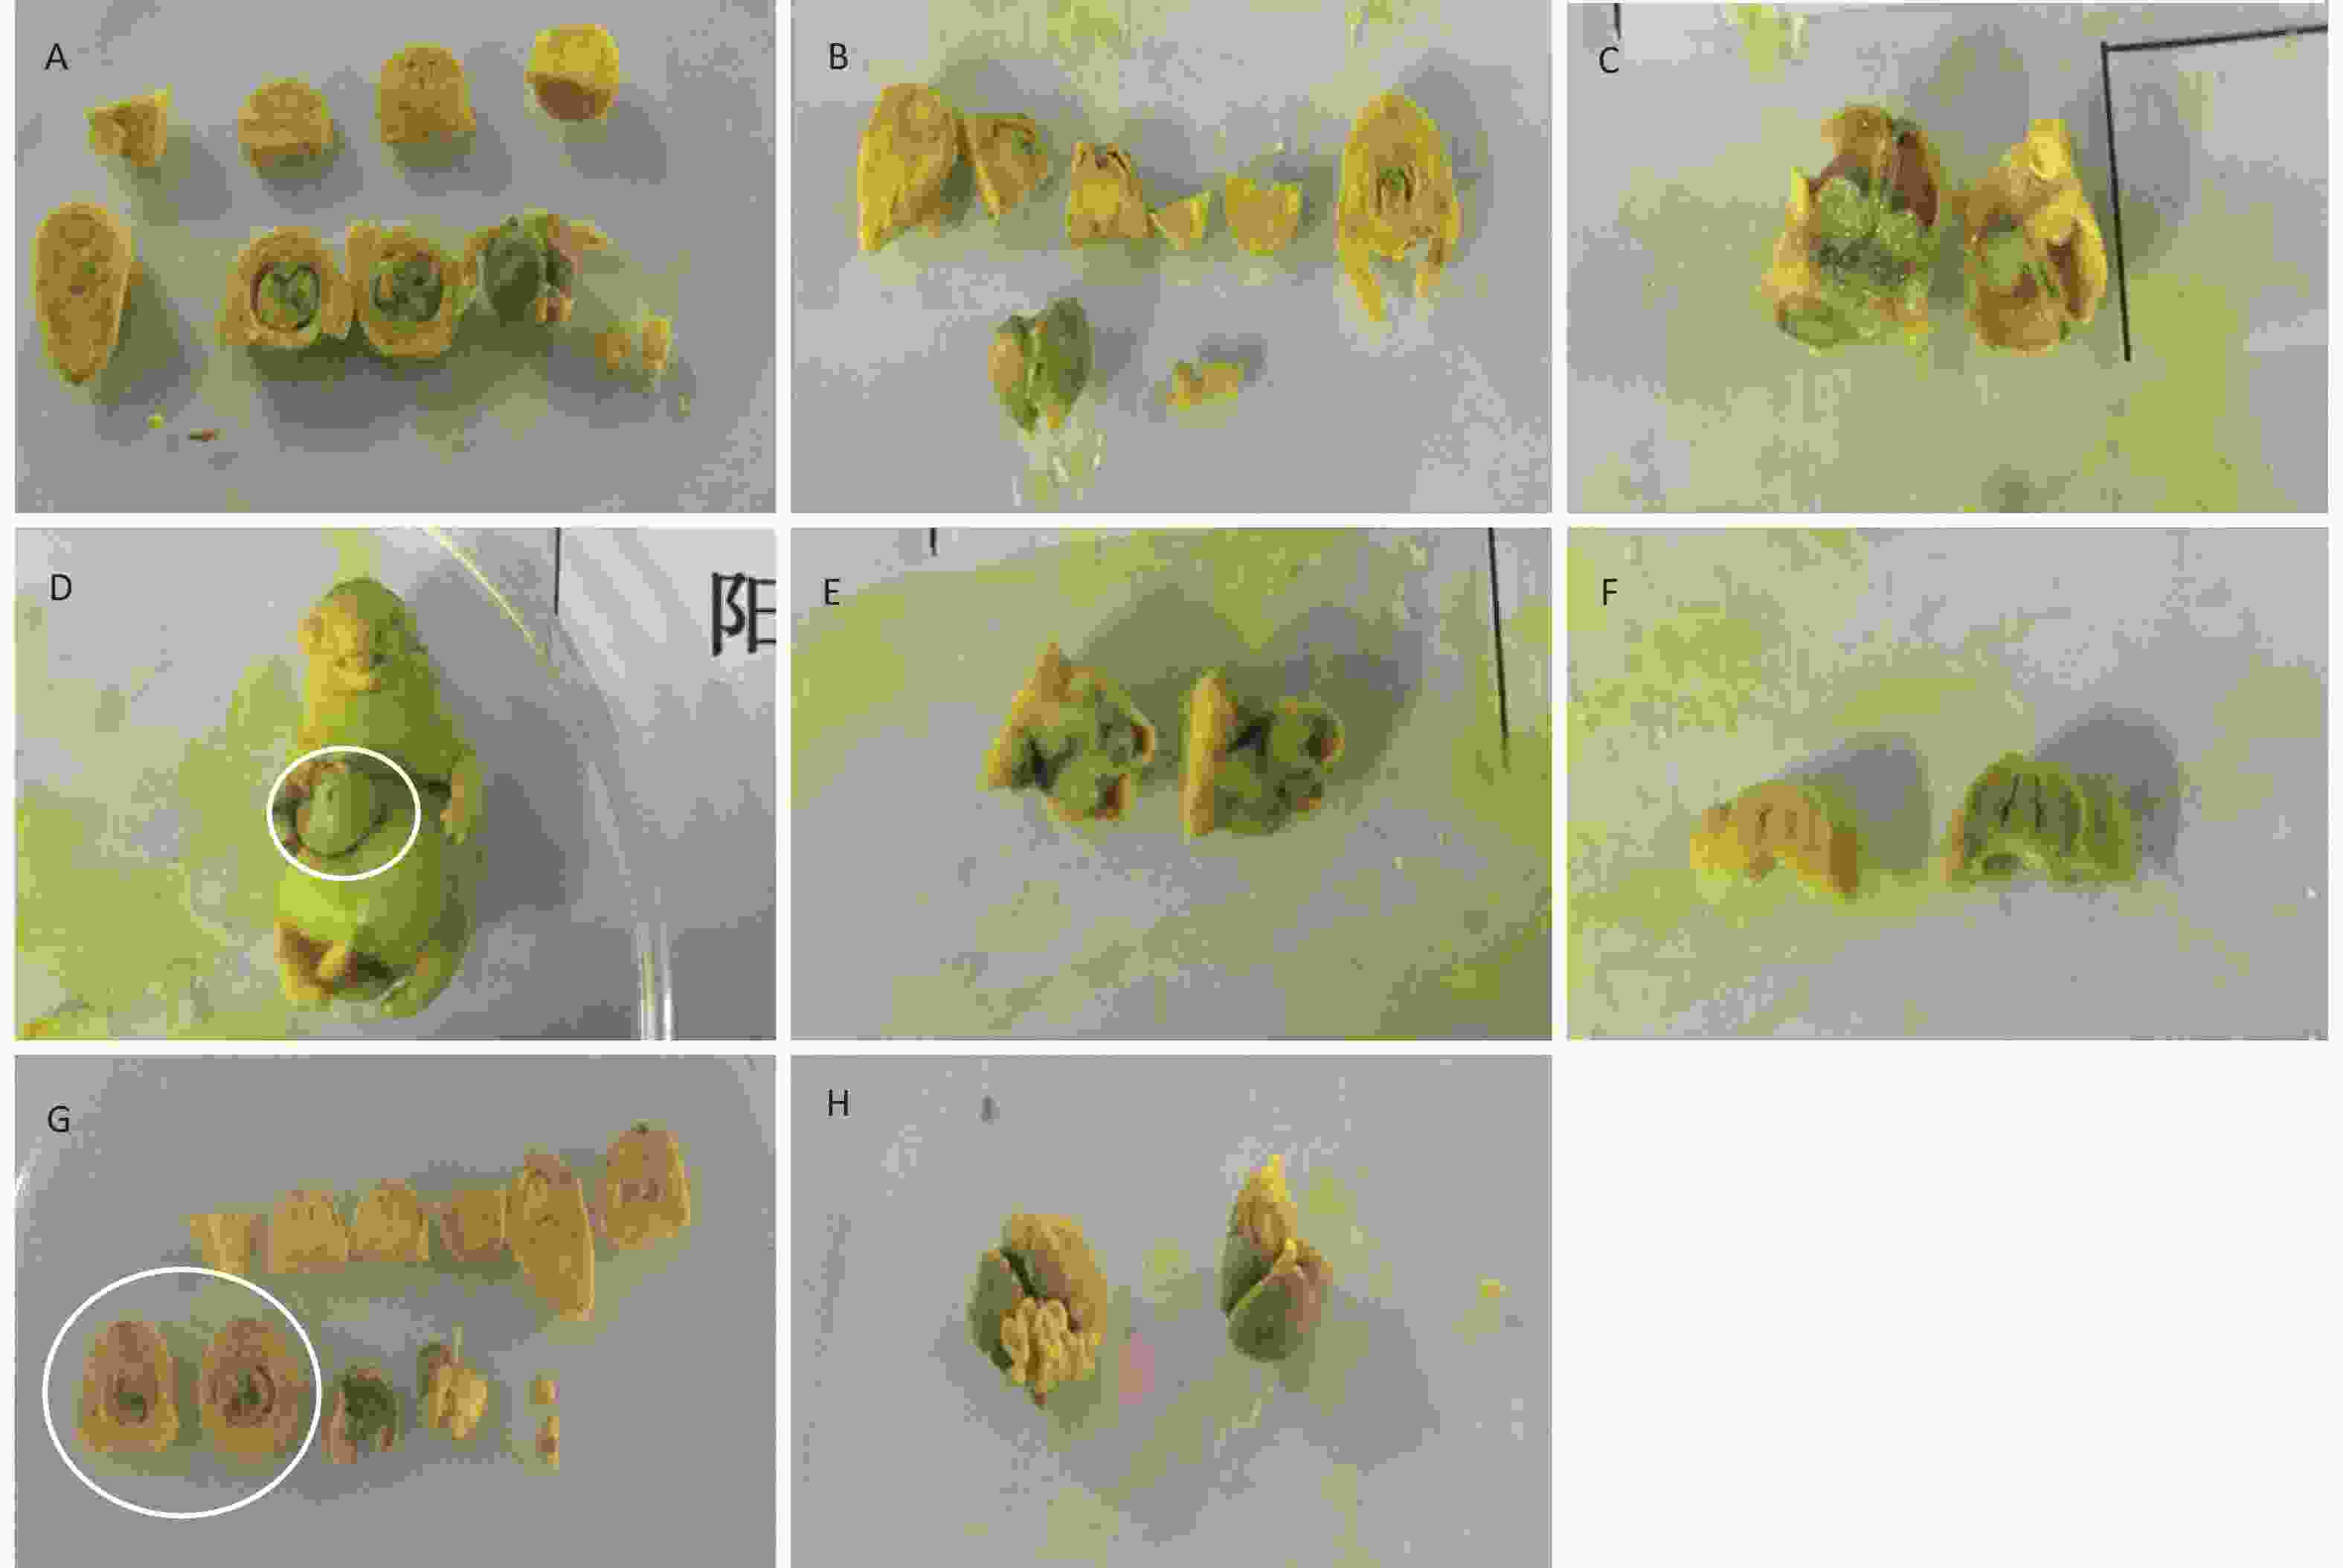
Figure 3. Visceral malformations of fetus treated with phenol during gestation. (A) Normal viscera of the fetus. (B) Small brain and cutaneous dropsy. (C) Ventriculomegaly. (D) Abdominal hernia. (E) Ventricular hemorrhage. (F) Small brain and paranasal sinus expansion. (G) Auricle blood clot. (H) Redundant liver.
-
Results of skeletal examination are shown in Table 5. Compared with the vehicle control group, the positive control group showed cranial bone loss, abnormal cervical vertebra, abnormal thoracic vertebra, abnormal lumbar vertebra, appendix vertebral fracture and widening, limb bone loss, rib loss, short bones, and broken bones. The above-mentioned abnormalities were not observed or only occasionally observed in the phenol-treated groups and the vehicle control group.
Variable Vehicle control
Positive control
Groups exposed to phenol [mg/(kg∙d)] 15 30 60 120 240 Number of litters for skeletal examination 19 18 20 19 20 17 6 Number of fetuses for skeletal examination 136 117 157 128 145 130 39 Litters affecteda (number/percentage) 3/15.8 18/100.0 3/15.0 3/15.8 2/10.0 2/11.8 1/16.7 Fetuses with malformationsb(number/percentage) 3/2.2 116/100.0 8/5.1 4/3.1 2/1.4 4/3.1 3/7.7 Type of skeletal variations Abnormal sagittal suture large 2/1.5 53/45.7 0/0.0 2/1.6 0/0.0 0/0.0 0/0.0 Abnormal occipital bone aplasia 1/0.8 107/92.2 9/5.2 0/0.0 2/1.4 2/1.5 3/7.9 Other abnormal cranium 3/2.3 102/87.9 0/0.0 2/1.6 0/0.0 0/0.0 2/5.3 Abnormal cervical vertebra 0/0.0 7/6.0 0/0.0 0/0.0 0/0.0 0/0.0 0/0.0 Abnormal thoracic vertebra 0/0.0 11/9.5 0/0.0 0/0.0 0/0.0 0/0.0 0/0.0 Lumbar vertebral centra, ossification, incomplete 0/0.0 22/19.0 1/0.6 0/0.0 0/0.0 0/0.0 0/0.0 Abnormal sacral coccygeal vertebra 0/0.0 27/0.2 0/0.0 0/0.0 0/0.0 0/0.0 0/0.0 Abnormal rib 0/0.0 97/83.6 0/0.0 1/0.8 0/0.0 0/0.0 0/0.0 Abnormal sternum 0/0.0 21/0.2 0/0.0 0/0.0 0/0.0 0/0.0 0/0.0 Abnormal limb bone 0/0.0 85/73.3 0/0.0 0/0.0 0/0.0 2/1.5 0/0.0 Note.aIncluded litters with one or more affected fetuses. bA single fetus might be presented more than once when listing individual defects. Table 5. Skeletal examination of rat fetuses prenatally exposed to phenol
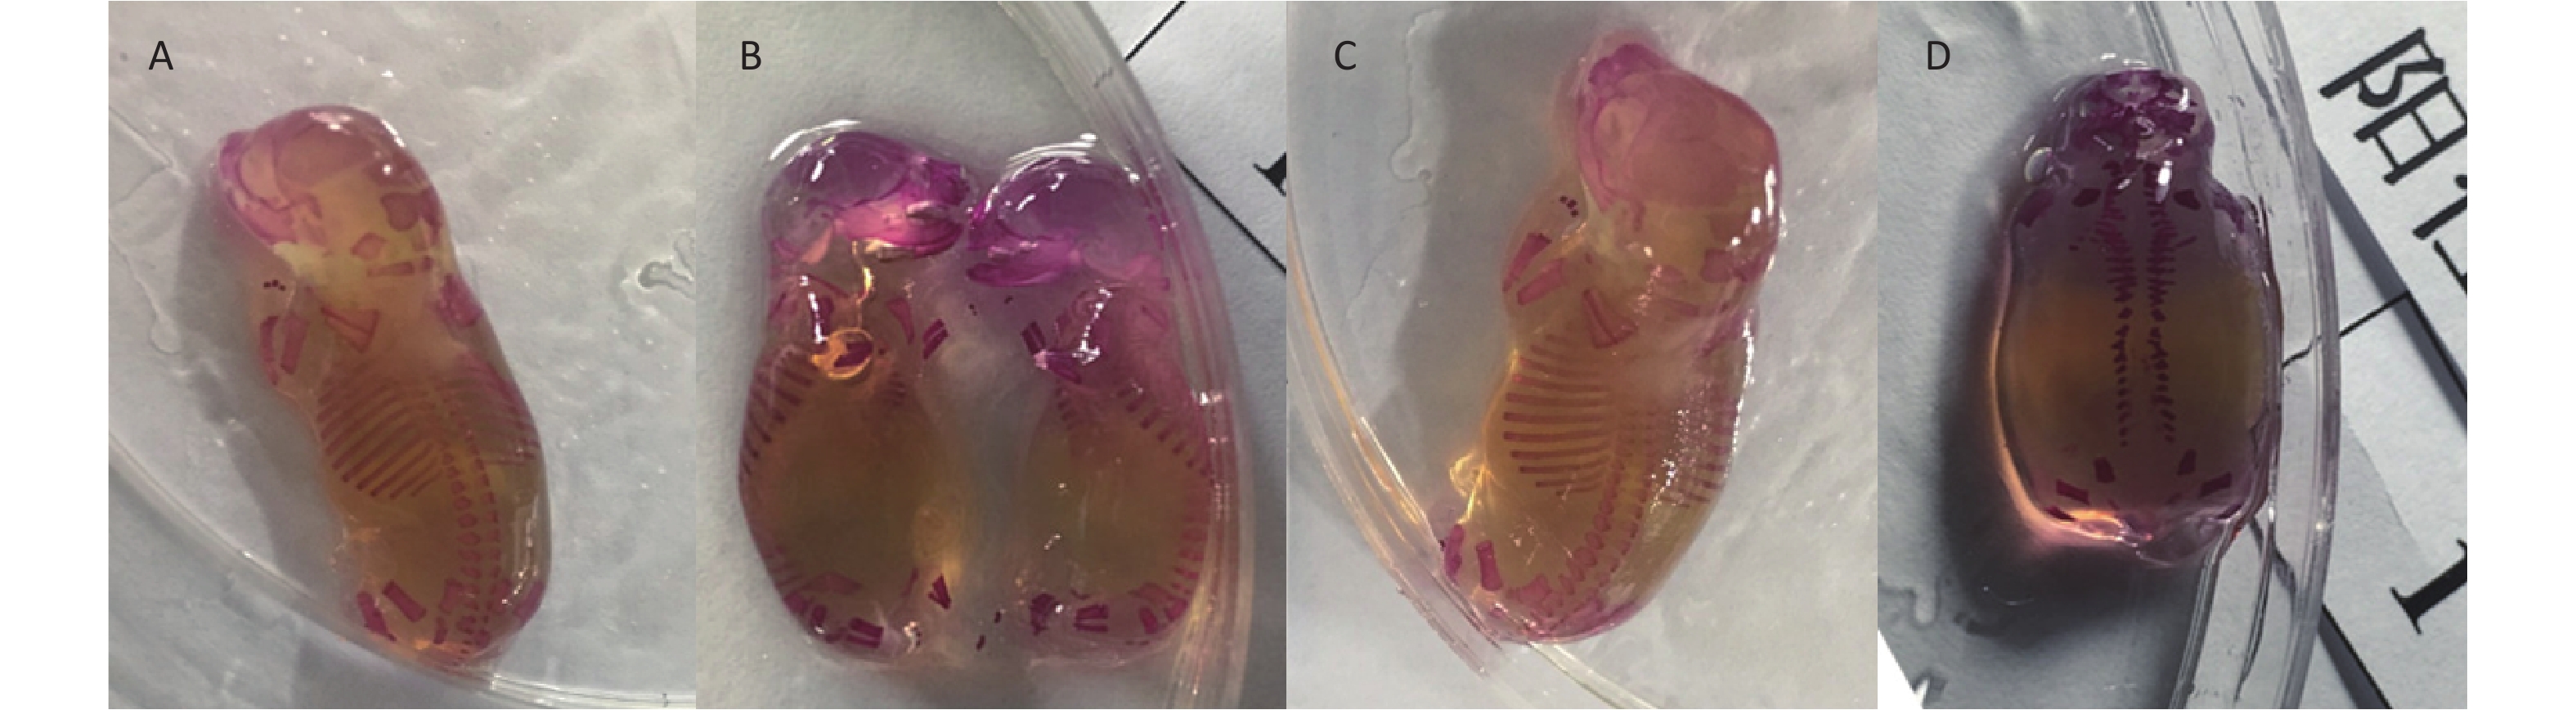
The following skeletal variations were observed: vehicle control group: large sagittal suture in 2 fetuses, occipital bone aplasia in 1 fetus, interparietal bone aplasia in 3 fetuses; 15 mg/kg group: occipital bone aplasia in 9 fetuses, lumbar vertebral centra incomplete in 1 fetus; 30 mg/kg group: large sagittal suture in 2 fetuses, interparietal bone aplasia in 2 fetuses, short 13th rib in 1 fetus; 60 mg/kg group: occipital bone aplasia in 2 fetuses; 120 mg/kg group: occipital bone aplasia in 2 fetuses, left or right metacarpal bone loss in 2 fetuses; 240 mg/kg group: occipital bone aplasia in 3 fetuses, interparietal bone aplasia in 2 fetuses. Some typical visceral variations are shown in Figure 4.
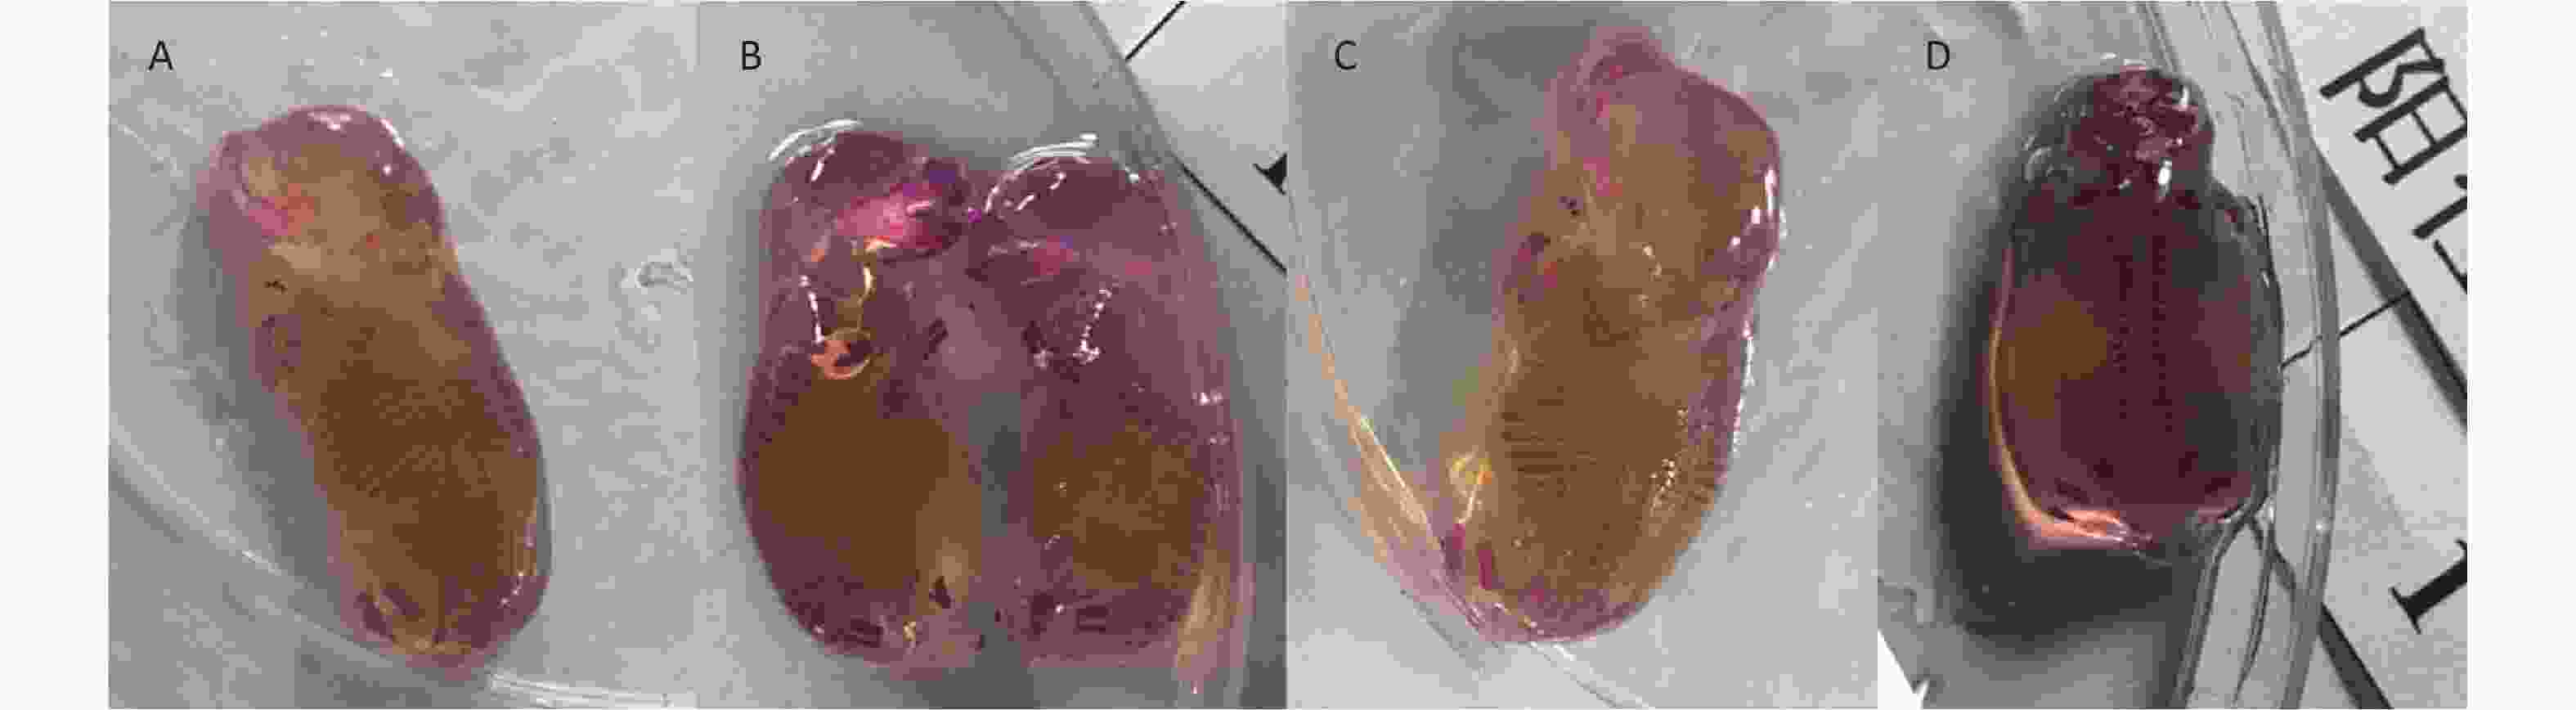
Figure 4. Skeletal examinations of fetus treated with phenol during gestation. (A) Normal skeleton of the fetus. (B) Left and right metacarpal bone loss. (C) Large sagittal suture. (D) Positive control showing loss of the 2nd-13th ribs as well as the frontal, parietal, interparietal bones.
-
The method of this verification experiment was the same as that in the US EPA, but we added 15 and 240 mg/kg as the lowest and highest dose groups, respectively. However, the toxic effects of phenol observed in this study were different from those stated in the US EPA.
In a study by Jones-Price et al.[11], a group of 20 to 22 female CD-1 rats were administered 30, 60, or 120 mg phenol/(kg∙d) by gavage on GD 6 to 15. No maternal effects were observed after treatment at any dose, but dose-dependent and significant (P < 0.001) reductions in fetal body weights compared with the control values were observed in the 120 mg/(kg∙d) dose group. No structural abnormalities were noted in any dose group. The results of this previous study suggested a NOAEL and LOAEL for developmental toxicity of 60 and 120 mg/(kg∙d), respectively [10, 11]. Based on the above result, the RfD was derived as follows: RfD = NOAEL/UF. NOAEL = 60 mg/(kg∙d); UF = 100.
NOAEL was based on the absence of developmental effects in rat fetuses exposed to phenol. Uncertainty factor (UF) was chosen in accordance with the developmental toxicity guidelines proposed by the EPA.
To verify this NOAEL, we designed the experiment based on a study by Jones-Price et al.[11], but added two more dose groups bringing the total, number of phenol dose groups to six: 0, 15, 30, 60, 120, and 240 mg/(kg∙d). In this study, the bone and visceral malformation rates of fetuses in five dose groups did not significantly change compared with those in the vehicle control group. However, in the 60 mg/(kg∙d) dose group, the dead pregnant rats exhibited back hair loss and convulsions, with mortality rate exceeding 10%, which suggested that phenol exerted potent maternal toxicity at this dosage. Moreover, fetal and placental weight significantly decreased after phenol treatment starting at a dose of 30 mg/(kg∙d) compared with those in the vehicle control group (P < 0.01). Therefore, it can be concluded the developmental NOAEL of phenol was 15 mg/(kg∙d), considering the significantly decreased fetal body weight and placental weight after phenol treatment at 30 mg/(kg∙d).
Results of other development toxicity studies on phenol are shown in Table 6[31]. In another study by Jones-Price et al.[32], CD-1 mice were administered 0, 70, 140, and 280 mg/(kg∙d) phenol at GD 6–15; the results showed decreased average fetal bw/litter and fetuses with malformations, and the developmental NOAEL was determined to be 140 mg/(kg∙d). In a study of Kavlock[33], Sprague-Dawley rats were administered phenol by gavage at doses of 0, 100, 333, 667, and 1,000 mg/(kg∙d) at GD 11; malformation was reported and the developmental NOAEL was determined to be 333 mg/(kg∙d). Narotsky and Kavlock et al. [34] administered 0, 40, and 53.3 phenol mg/(kg∙d) to Fischer rats at GD 6–19; reduced number of live pups/litter and fully resorbed litters were observed, and the developmental NOAEL was 40 mg/(kg∙d). In a study by Argus[35], Sprague-Dawley rats were administered 0, 60, 120, and 360 mg/(kg∙d) phenol at GD 6–15, and the results showed decreased average fetal bw/litter and developmental NOAEL of 120 mg/(kg∙d). Ryan et al.[36] performed a two-generation reproduction study in rats treated with phenol via drinking water; the results showed that litter survival and offspring body weight (preweaning) decreased in the 5,000 mg/L group in both generations. Taken together, all these previous studies showed different NOAELs. The current study was conducted according to the latest OECD Guideline for The Testing of Chemicals, Prenatal Developmental Toxicity Study[25], and accumulated data on the developmental toxicity of phenol.
Species Exposure day (s) Dose [mg/(kg∙d)] Developmental endpointa Developmental NOAEL [mg/(kg∙d)] Reference Sprague-Dawley rats GD 11 0, 100, 333, 667, 1,000 Malformationsb reported at the two highest dosesc 333 [33] Sprague-Dawley rats GD 6–15 0, 30, 60, 120 Decreased average fetal b.w./litter 60 [11] Sprague-Dawley rats GD 6–15 0, 60, 120, 360 Decreased average fetal b.w./litter 120 [35] Fischer rats GD 6–19 0, 40, 53.3 Reduced live pups/litter and fraction litters fully resorbed 40 [34] CD-1 mice GD 6–15 0, 70, 140, 280 Decreased average fetal b.w./litter Fraction fetuses malformed 40 [32] Sprague-Dawley rats 10–11 weeks prior to mating through weaning 0, 200, 1,000, 5,000 ppm
[0, 20, 93, 350 mg/(kg∙d)]Fraction of nonliving offspring postnatal day 4 and postnatal days 7–21d 70 (males),
93 (females)[36] Note.aIn each study, phenol was administered by oral gavage. bHindlimb paralysis and/or short or kinky tails. cNot analyzed for statistical significance. dEffects possibly related to decreased maternal water intake due to flavor aversion. Table 6. Data on the in vivo developmental toxicity of phenol obtained from the literature[31]
Phenol toxicity is related with two main processes: the unspecified toxicity related to the hydrophobicity of the individual compound and the formation of free radicals[37]. Thus, the developmental toxicity mechanism of phenol remains unclear. One possible cause may be oxidative stress. Phenol induces lipid peroxidation, which is responsible for damage and finally degradation of cell membranes[37]; it is also readily oxidized to quinone radicals, which tends to be more reactive. Catechols have the tendency to cause DNA damage or arylation, destroy proteins, and disrupt electron transport in energy-transducing membranes[38].
Owing to the negative effects of phenolic pollutants on public health and the ecological system, phenol has been designated as a priority pollutant by the US EPA and the National Pollutant Release Inventory of Canada[39-41]. As phenol possesses hazardous health effects, which can be both acute and chronic, and commonly exists as its derivatives, such as Bisphenol A, chlorophenols, and phenolic endocrine-disrupting compounds[39, 41], subsequent studies are needed to analyze and identify more phenolic pollutants and their environmental fate in natural environments.
In summary, to confirm the HA for phenol, we verified the NOAEL of phenol accepted by the US EPA. This study accumulated animal experimental data to provide a new basis for revision of the Standards for Drinking-water Quality and to further establish our own health advisories for short-term health risks of phenol in China.
-
The results of the present study indicated that, under the condition of this study, phenol exerted certain maternal toxicity starting at a dose of 60 mg/(kg∙d), and the developmental toxicity of phenol was reflected by reduced placental and fetal weights after treatment at 30 mg/(kg∙d). The NOAEL for the developmental toxicity of phenol was concluded to be 15 mg/(kg∙d).
-
The authors declared no conflicts of interest.
-
We thank ZHANG Xiao Jian from the Department of Environmental Science and Engineering, Tsinghua University and ZHANG Lan from the Department of Water Quality Monitoring, National Institute of Environmental Health, China CDC for their help with experimental design.
Funds:
This study was supported by the National Natural Science Foundation of China [No.21806157] and National Water Pollution Control and Management Technology Major Projects [No.2015ZX07402002]

 Quick Links
 DownLoad: